
Jan 14 – 3 Day Weekend In The US Markets
It has been a great start to 2017, with various sectors bullishly marching higher and plenty of trade ideas to profit from. For now it is time to relax on a 3 day weekend and just review where we find ourselves after last weeks trading.
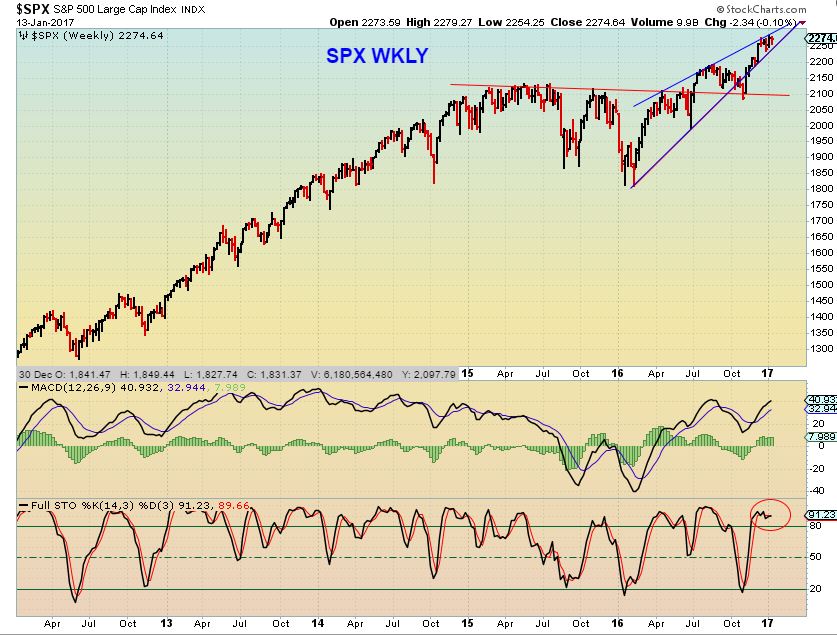
VIX – I do like certain things about the set up of the General Markets, but the VIX is about as low as it gets before the General Markets form temporary tops. I don’t use the VIX to time a market top or bottom exactly, but it does often warn of volatility to come. When the VIX hits the 11 area, we are alert to a possible top forming soon.

So let’s look at the SPX ..
SPX WEEKLY – Is that a rising bearish wedge on the weekly? If so, it doesn’t necessarily mean we get a crash, but it would mean that it will pull back soon and we might not tag that Dow 20,000 for a while.
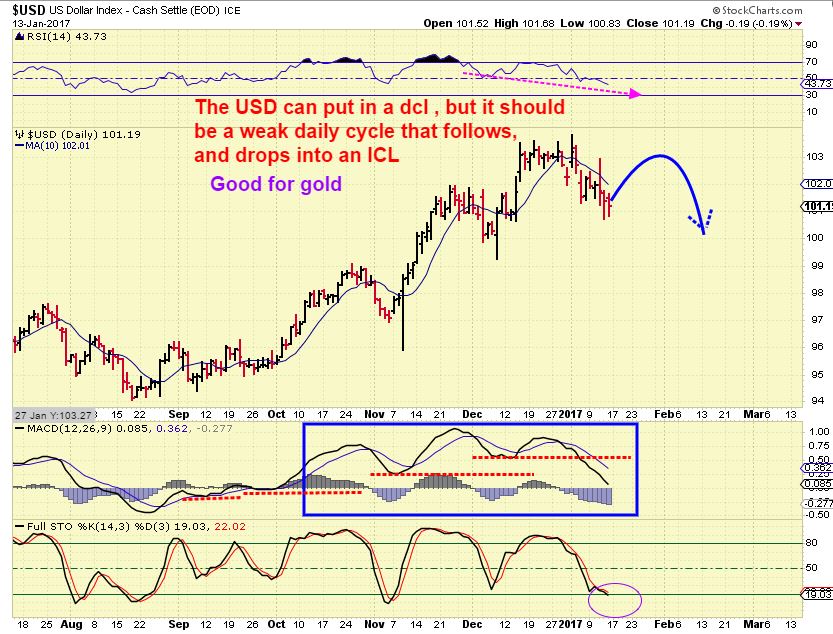
USD – I see weakness forming in the USD chart. I expect the next daily cycle to roll over, AND I expect an ICL soon. The COT for the USD shows commercial traders are also very net short. They are smart money and this is good for Gold.
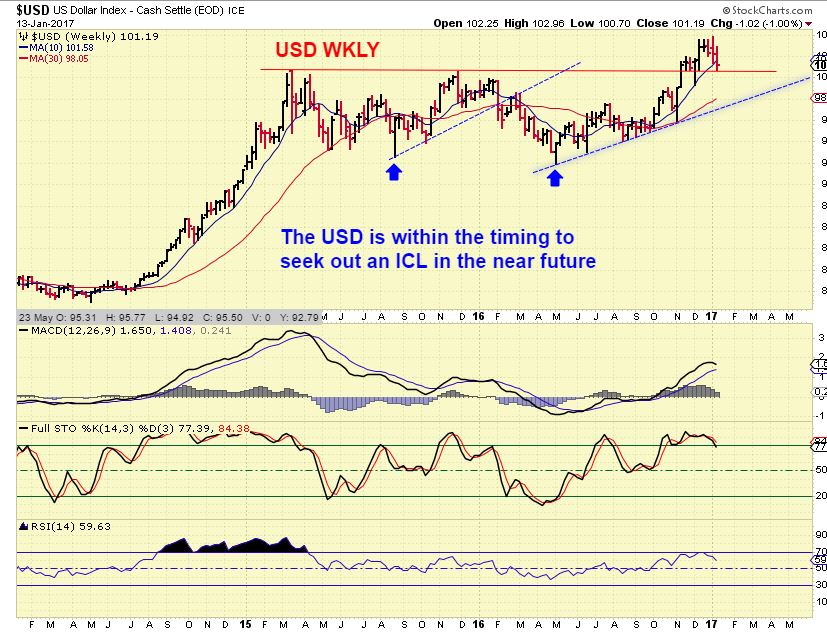
USD WEEKLY – An ICL should drop the USD below the blue line over time. This would be very good for Miners. If this break out breaks back down? Longs could bail out and shorts could pile on.
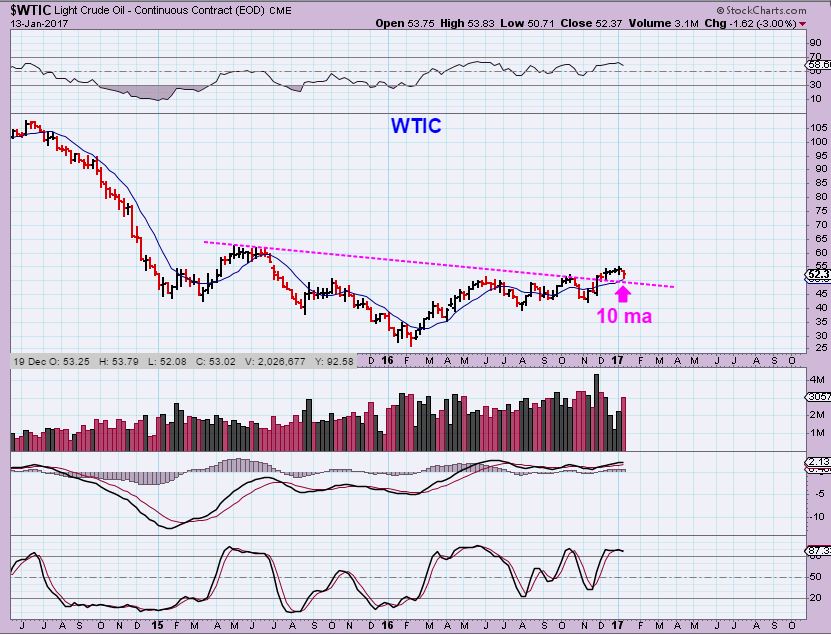
WTIC – I think that Oil can run to the upper blue line with a dcl in place, but we’ll see. I’m not overly bullish on Oil at all. We discussed the COT for Oil weeks ago, and I repeatedly say that I take notice, but it is secondary for a while. It is not a good timing tool. As an example: I had people telling me 3 weeks ago that due to the high smart money short positions in the COT, they have been shorting oil. I commented in my report that The COT is not a good timing tool back then. I reminded readers that last spring the GOLD COT kept making higher smart money short readings, and Readers kept telling me that “so & so” was warning to sell. I heard this last Feb & March as our Miners continued to climb. Our Miners were up 100-700% from Jan to July, with a sideways dip at the May ICL.
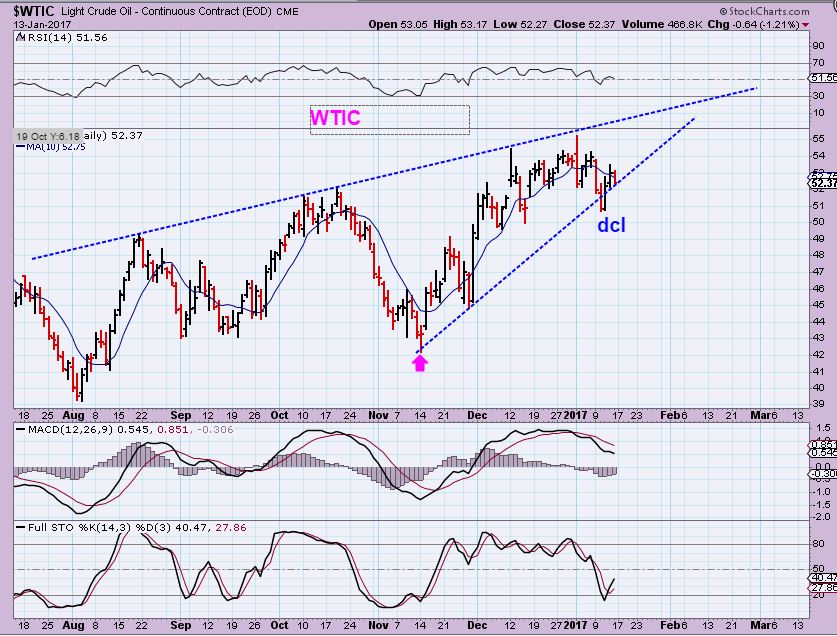
WTIC – Back test? So while the current COT shows smart money increasingly short, it was not a good timing tool for shorting 3 or 4 weeks ago, the drop finally came last week, was not that big and recovered. We still may see some upside before a deeper drop.
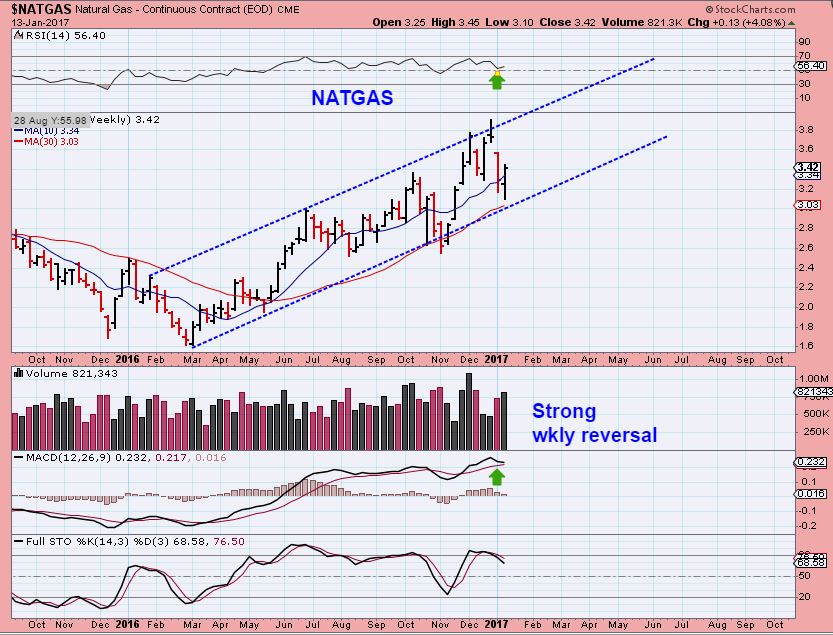
NATGAS – Weekly Reversal
GOLD, SILVER, & MINERS
REVIEW – These are just a few charts from past reports thrown in with the current ones, to show some of what we had considered as possibilities, and where we are now.
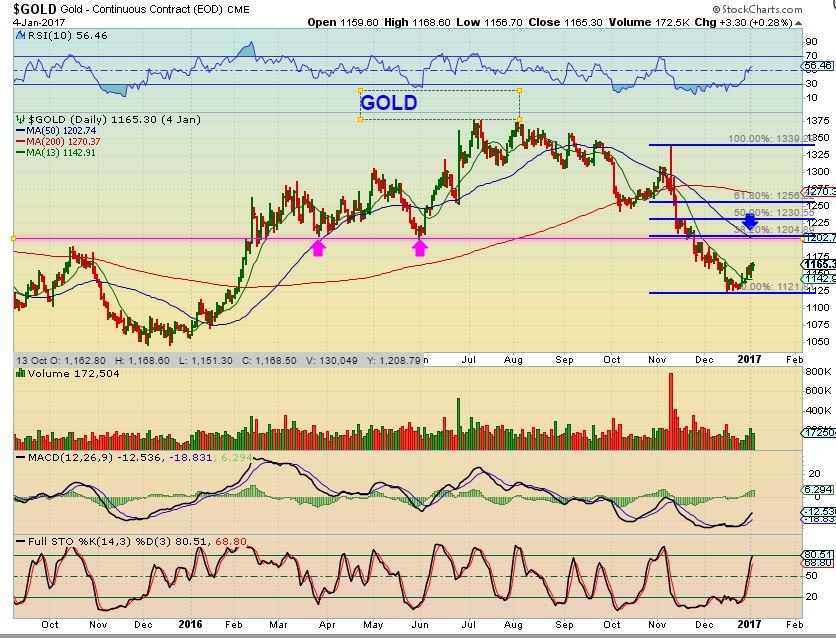
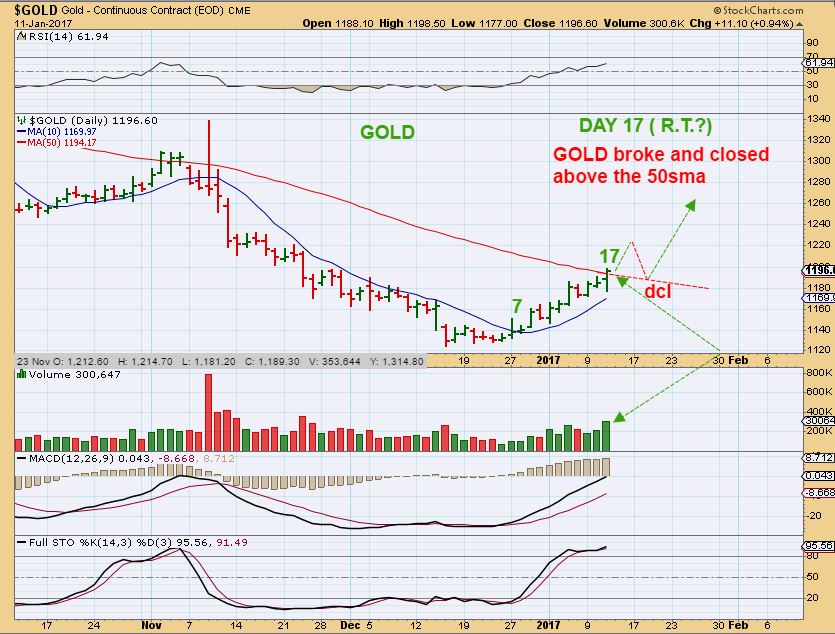
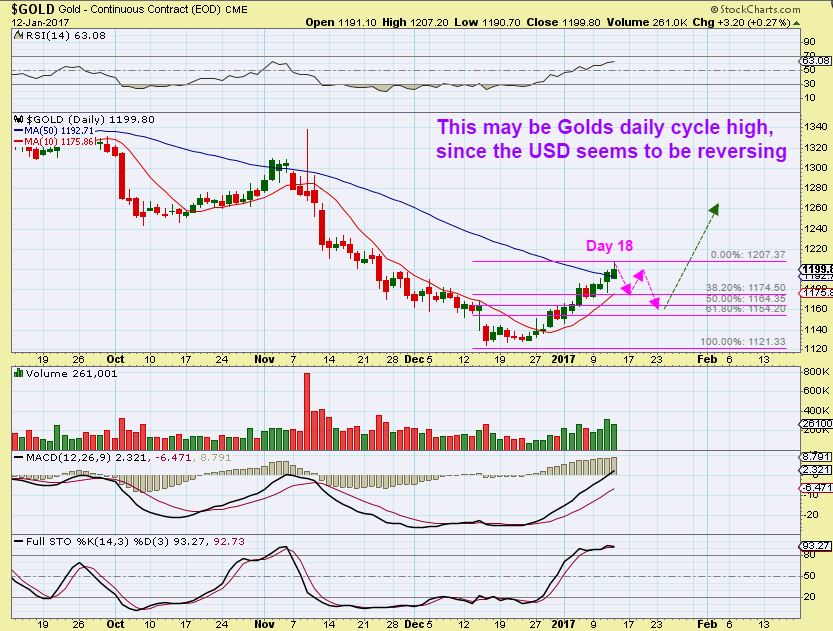
GOLD – On Jan 4th I mentioned that Gold could run up and pause in the $1200 area, since it was a multi resistance area including the 50sma. Magenta and Blue arrows
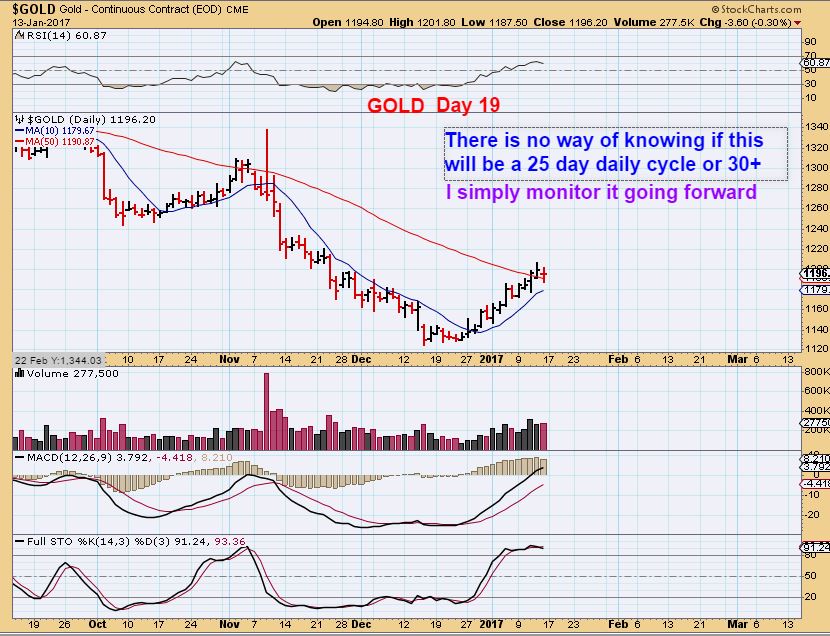
GOLD ran up to the 50sma – $1200 area and is pausing a bit. It may not pause for long. We are on day 19 and anticipate a daily cycle low soon, but so far we haven’t even started the dip down yet. Coming out of an ICL, I do not fear holding Miners, since the 2nd daily cycle should bring us even higher.
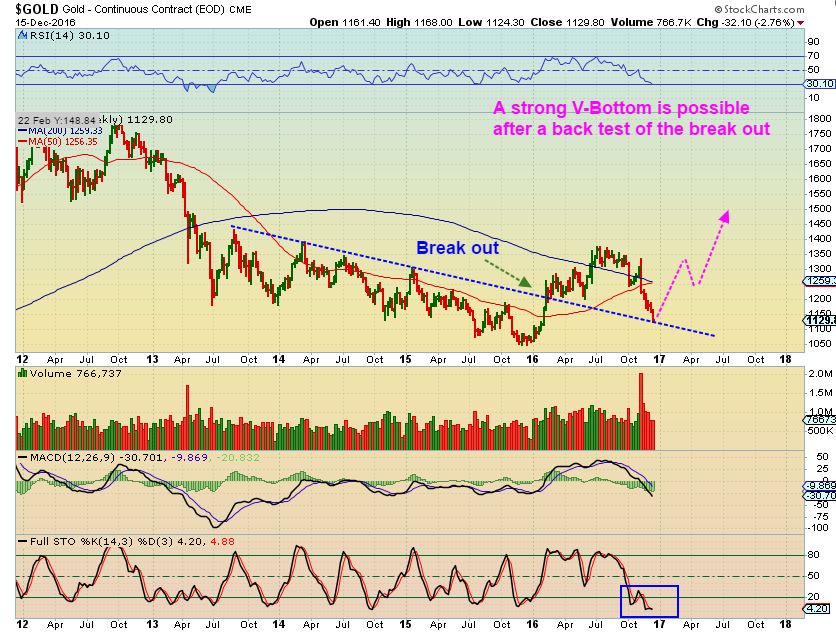
GOLD – On Dec 15th, we were seeing our drop into an ICL, I was hoping that we’d get a back test and a v-bottom off of the blue line.
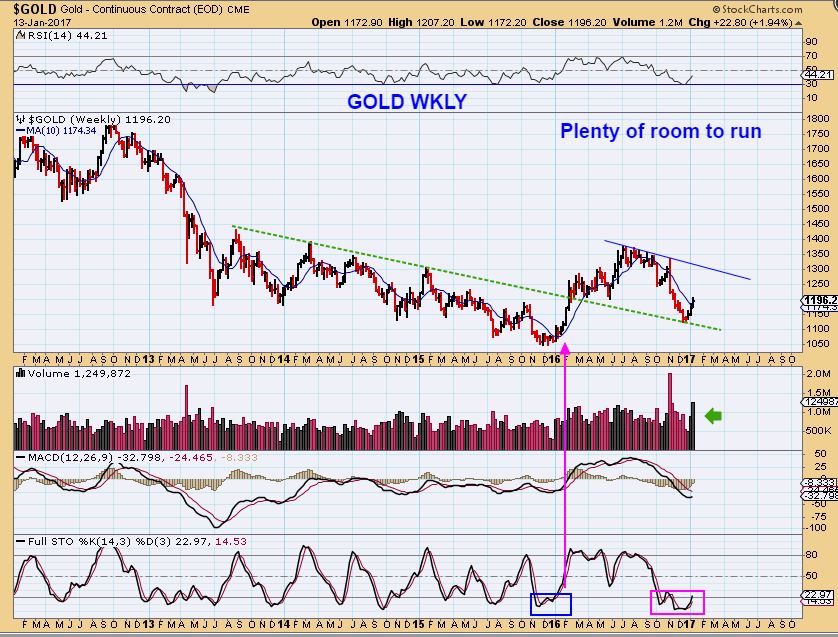
GOLD – The blue line held, and we are getting a nice move higher, so IF Gold doesn’t pause very much, we could actually get the V-Bottom recovery within 2 daily cycles. This chart shows that Gold has plenty of room to run.
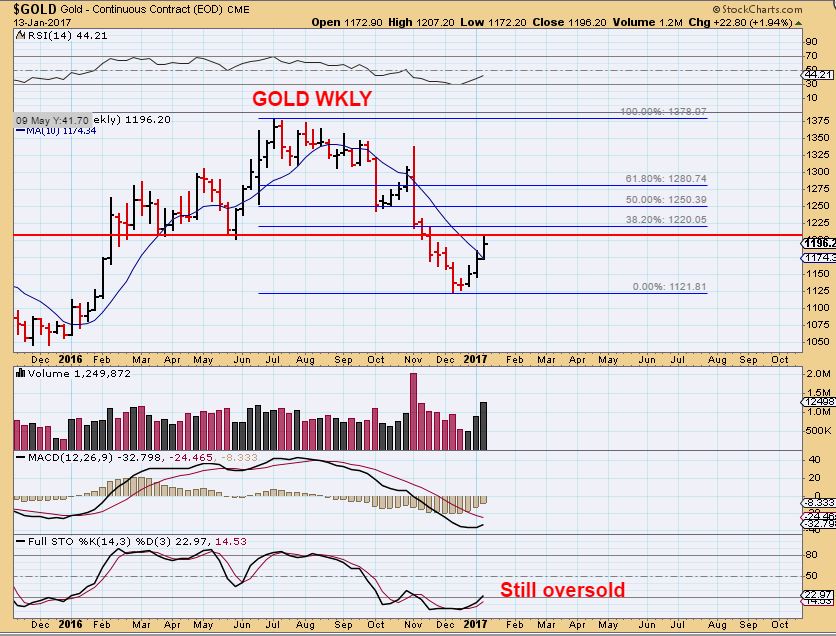
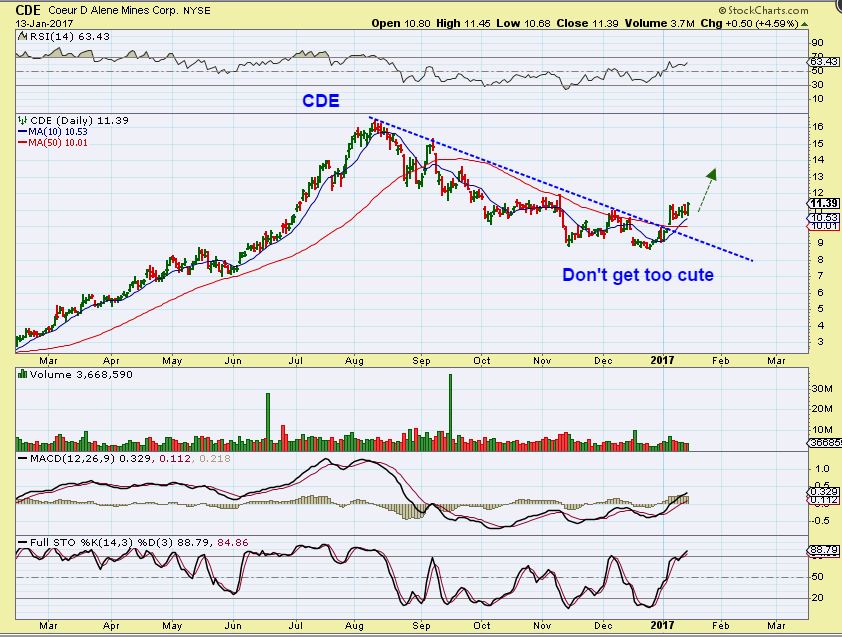
GOLD WEEKLY – Still very oversold, we could pause and work up steam to break higher, or just continue higher at this point. Looking back at Jan – Feb 2016, Gold just went higher 4 weeks in a row at one point. Extreme sell offs can lead to extreme recovery, thus my report “Don’t Get Too Cute” was written as a reminder of possibilities.
And Please review reports from last week in you need a refresher on expectation. For example Gold Jan 10 – GOLD can go higher to say day 22 and then drop into an early day 25 dcl remaining above the 50sma. Or higher through Day 25, and dip down to a dcl on day 32 ( Just a few Bullish sample ideas, not a prediction).
And I said if the USD bounces, we could see this drop. It is nothing to worry about, it is a BUY THE DIP occasion after a swing low is in place, if you have cash on hand.
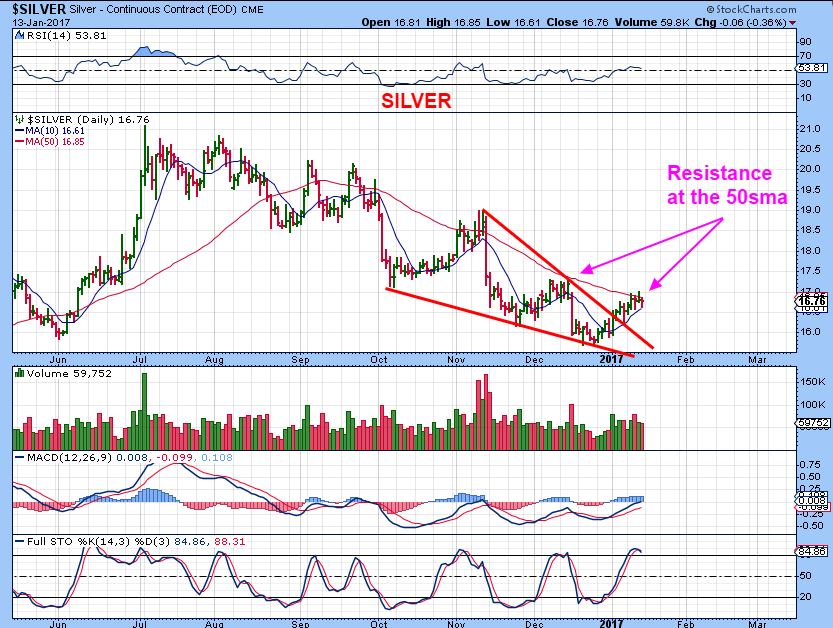
SILVER DAILY – Pushing at the 50sma.
GDX – GDX looks great to me, this is a sideways consolidation and may be a bull flag. It’s funny, on a down day I often hear how ‘weak’ miners are acting. At this point, I am not seeing weakness.
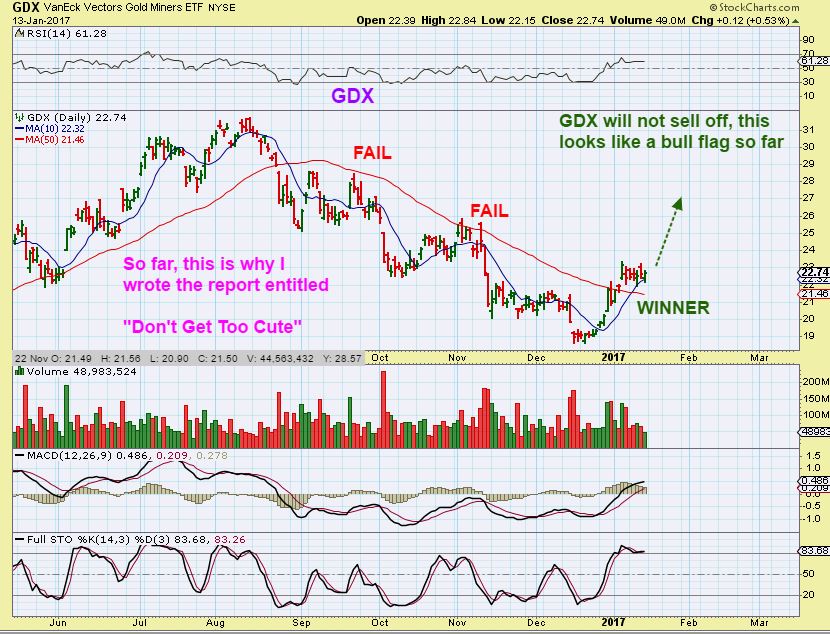
GDX broke above the 50sma and held there over a week ago, it was leading Gold. Gold just broke above the 50sma.
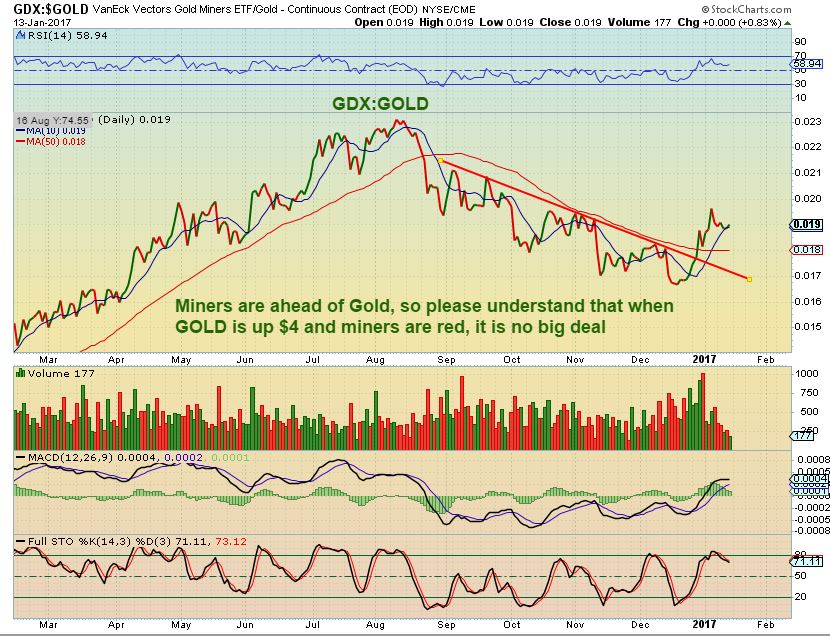
GDX : GOLD – This is a bullish set up, and it tells me that Miners are ahead of Gold. If we have a day when Gold is green and miners are red, does it mean that everything is rigged, manipulation, robots are fooling us? Or did Miners get a little ahead and are resting on a day when Gold is playing catch up? I’ll let the reader choose to believe whatever they want.
CDE– I have a friend that trades the Miners. A week ago he emailed me that he sold everything! He sold his CDE, GORO, MUX, RGLD, GG, NEM, because when he saw the huge down day, he knew that it was breaking down. I look at this chart and I wonder where he will get back in.
That is your weekly wrap up. Things have been playing out as expected so far, and our trades have been playing out very well too with some nice %-Gainers. Again, I don’t want to overwhelm anyone with too many trade ideas, and I do think that the current set ups in Metals & Miners are a great place to be, but I also am seeing other areas that look to be setting up in a low risk manner too. I will probably do a short report on that next. Right now, it is time to relax and enjoy this 3 day weekend away from the markets, see you on Tuesday!
~ALEX
.
NAK – NAK has been pretty amazing, and even after releasing news of ( now 2) Public offerings at $1.86 – it continued un-phased and marched on higher. SO I posted this chart in Fridays report. I was pointing out the pattern that NAK has in place, where it goes…
1. Down for 1 week
2. then up for 2 weeks to a new peak
3. down for 1 week
4. Up for 2 weeks to a new peak ———– As shown
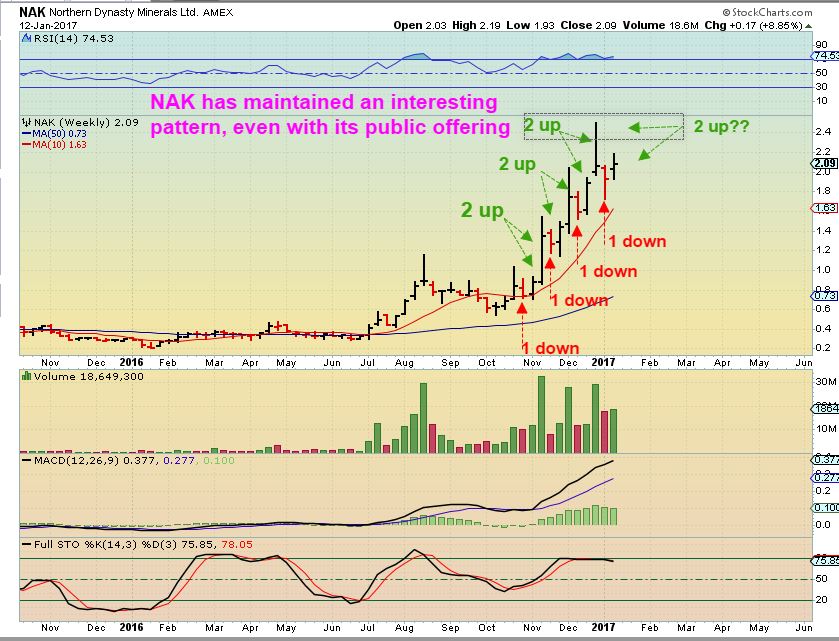
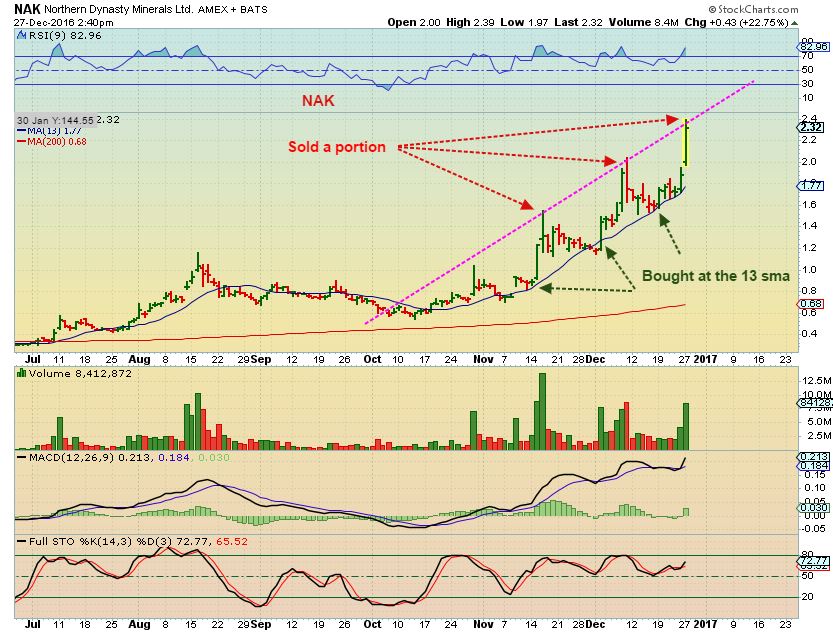
I pointed this out ( On this chart) weeks ago when I said that I sold partials ( Maybe 25 to 33 % of my position) at peaks and re-entered on the dip, able to buy a larger amount of shares than I sold. It has been very reliable.
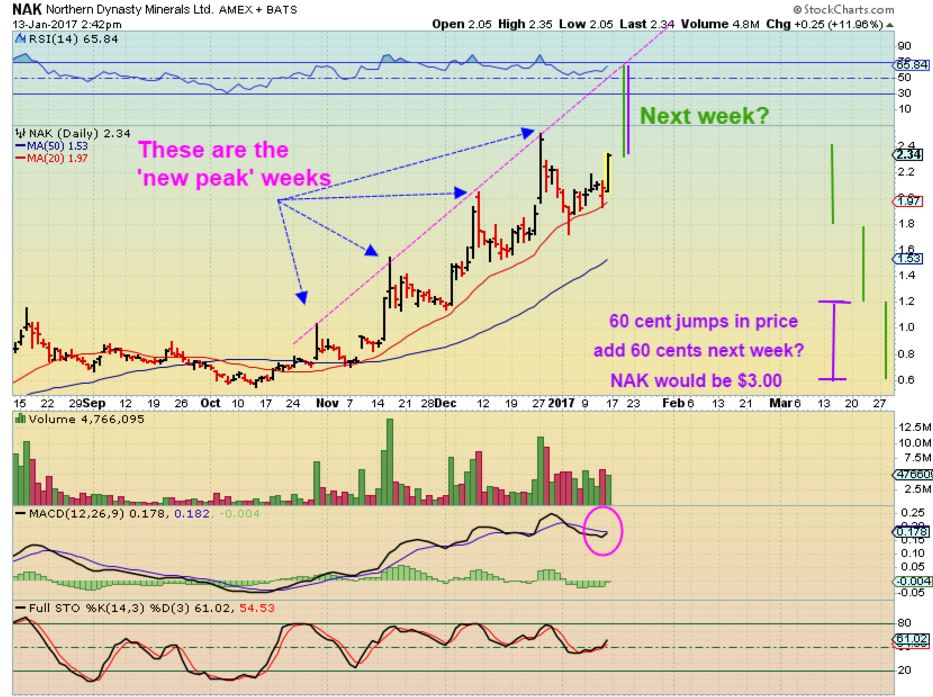
SO let me show you what I was thinking when I posted this chart below last Friday. This chart was saying that we had the 1 down a week ago, and last week should be the first of the 2 weeks up . THAT MEANS that this coming week should see NAK higher if this pattern remains. Let’s see what that could look like…
I was thinking that we just had the first week up of 2, and next week could do this to the next peak. $2.80 – $3.00? If the pattern repeats, anyone that added 2 weeks ago on the dip or even last week should see NAK a good deal higher before it peaks.


Alex, great report and I’ve been holding tight for this ride…and definitely not disappointed. Have too laggards (from a while ago) BAA and TGD. Any thoughts? Thinking of adding to TGD but a bit weary..sitting under the 50dma but I’m majorly underwater all ready. Thx in advance!
Wondering about these two as well
Me too.
They are both pushing against the 50sma and look ready to break out higher.
I believe that they will play catch up soon.
TA DA! 🙂
Thank you Alex. Great report. The COT positioning is extreme in oil, but have you seen the 10 yr Treasury bond COT. Oh my. A big treasury rally will come as shorts scramble to cover. My guess is when it does it will be bad for stocks and food for gold and miners. Coming soon in my opinion.
Bonds and gold have been tightly correlated since election. Bind rally, lower rates sundues the ‘gold doesn’t pay interest’ crowd and bit and should help it strengthen!
Yes, Some have mentioned a play in Bonds based on COT, why dont I discuss trades in TLT ? etc —but it is too lack luster for my liking. Yes, they could run together – I agree.
TMF is a 3x etf, but it doesn’t even move as fast as GDX or GDXJ 🙂
Of course, anyone here is welcome to take whatever trade they like- some do trade TLT.
I’m taking the precious metals trade & will focus on that, but yes I’ve seen TLT ( Dec to now = 116 to 123) and it does look bullish and like a bottoming process too. That is about 5% yhough, I can make that in a day in other Mining trades. 🙂
I almost exclusively trade TLT with call or put options. Otherwise, it’s pretty boring and takes a very large amount of capital to get the size of move that might be considered rewarding. Just one technique. But, b/c of this, usually only play when I’m fairly sure of an outsized move. Same with UUP.
I agree. I prefer miners. Just a mention of bonds as it might positively impact gold and negative on stocks should it play out. Thanks.
Interesting action in the precious metals market this morning with demand for gold way up and the dollar down. Net effect=Gold + $5.90.
https://uploads.disquscdn.com/images/b8e57272b89d4b4e2e54800597e8d9f7fa82232c8b3f4a64a28e83d2697174b0.png A few charts for your Monday. Gold COT, not a timing tool (hopefully, everyone got that from the above already!), but seems to show confirmation of the ICL, imo. Particularly the Open Interest (green line, as circled).
I also did a Miners Bullish Percent Index compare of last ICL to this one (make sure to take it off of ‘log scale’ or it becomes hard to move). A few points – the ICL pullback in May – the BP stayed above even the current rating! Also seems to show confirmation of the lows. Also, if we follow Jan-Mar of 2016, could have more room to run.
https://uploads.disquscdn.com/images/4a6fe86c0a5b87e0aeadbe7e53bb796974168e720965b302bdd3ce86a5097858.png
Thoughts about URRE given the spike? Do you think it will consolidate at these levels and then rip higher? Seems like this could be an opportunity to enter if the potential is there.
I work with low risk entries.
I do think that Uraniums will go higher, and they’ve bounced off of the 10sma, but they are not low risk entries. There is a potential for a last higher ………….or lower.
So proceed with caution
CF – How are you feeling about LTBR. This is literally the only thing Im holding that is grinding my gears. I can take being down in miners (red days are nothing when we get in low enough – still green) but man.. This small position in LTBR is a thorn in my side.
The chart looks like it is pounding out lows, a possible rounding base, and I see a possible reversal candle Friday.
Trades are trades to me. It is an opportunity to enter a trade that looks set to go higher out of this base. I set a stop ( mental or physical) and if it drops below $1 and stays below there, I’ll be out and on to something else.
I think LTBR looks ripe to go higher too with that 5 million $ float and I am getting really interested in TMQ in trying to learn the fundamental story I love that chart
tmq has 10million cash and do debt per and october investor slide so it doesnt scare me to hold
TMQ info reminds me of NAK Novacopper’s high-grade copper ‘Arctic Deposit’ has impressive economics including a $1.26/lb “all-in cost”of copper production in a mining friendly safe jurisdiction (Ambler Mining District, Alaska).
Potential to use lower cost natural gas for power generation at Novacopper’s Arctic Deposit.
Crucial access road to the Dalton Highway is supported by the State of Alaska, NANA (Regional Alaska Native Corporation) and the two northern Alaska Boroughs governments.
I was expecting TMQ to release earnings last week, but it never did. Their last earning report came out OCT 6, so I figured somewhere around Jan 6th would be the next quarterly.
Still waiting.
tmq management owns 60%!
Man, now I REALLY feel dumb lightening up on my miners last Friday. Alex is right, this is not time to “get cute.” At least I’m still over 60% invested. I should have just stayed “all in.”
I sold some JNUG, wishing now I hadn’t. But, in my defense, late in cycle, long weekend, lightening some 3X wasn’t a terrible risk decision even if it was “wrong”.
First Majestic Produces a Record 18.7M Silver Eqv. Oz in 2016 (4.4M Silver Eqv. Oz in Q4); Announces 2017 Production Outlook and Cost Guidance
Crazy moves in Sterling this weekend. SOG, what are you cheeky Britt up to? Hopefully, buying miners!
i’m fully loaded Mr Cas!
just a matter of sit & wait now.
although i got a few spare $$$, searching around for potential giraffes 🙂
Just as I expected. In the same spot here, still have a few bucks leftover but would want to diversify with it, got me plenty of PMs.
CCJ is the RevShark pump this morning: http://sharkinvesting.com/stock-of-the-week/
This is bad information .
CCJ is extended, it was a buy weeks ago. IT is high risk here, I would not follow this advice
Concur……
My mistake. I should’ve been clearer. I did get in under 10 but the part where he wrote “momo over 13.5” caught my eye, thinking worth unloading some into the move there:)
refresh
.
https://uploads.disquscdn.com/images/52eed155fbc8703190898e0a0415baa0d2492d8232df2b825febebb3f53bcf10.jpg
“Fat-finger” trade or stop-sweep?
A few minutes ago, GDXJ had a huge order to drop it a dollar and recover within the minute
There goes NAK on some nice little PM activity
Thanks Alex. “I’ve got sunshine on a cloudy day!”
Yeah, me too, but I kind of hate the gap open.
We could see that mid day dip to fill the gaps.
PLG report out, evidently must not be good, down currently 4.21%
needs to raise cash
Watching the 50sma for possible support, but volume is heavy and it could break below it.
bangin report dear chartfreak…………………..
wooooshhhhhhhhhh … :o)
#vaca
Thx –
Are you on Vacation yet? I didnt think you’d be in Florida yet, but maybe an early start?
not yet… onnnnnly 1 more day of work … yip! i leave 22 am…. ;o)
Have a great trip – Buy some miners and go away 🙂
I mean just try to clear your mind and relax of course
already done my friend……………………..
Gorgeous weather finally here in Florida…absolutely lovely morning! 70s. AHHHHH….
TGD finally played its RSVp to the gold party
Good volume. That was the surge that it needed to break that 50sma
Now the 200sma is overhead, but that is good volume. It might just keep running ( Finally )
I closed 1/3 position at 39 – loving it. Just wanted to free up some cash, Ill take a quick 500 and get back into some more “serious” non laggin miners
BAA broke the 50 sma today too.
egi … hmmm
cant remember…. did i already post this chart of EGI “flipped” candles ….. pretty crazy
https://www.tradingview.com/x/BewZRJYm/
Yeah, you mentioned that last week too. What an explosive break from a long consolidation.
Very nice
I own it
nice… 😉
TGB also running up to new 52week highs – congrats team
Yes, that’s been like NAK part 2 – very nice run up and out of the lows
Mna CF, 2017 has kicked but so far with miners… Up about 33% on the year… Holding this LTBR thorn to see what it does for a few more days/weeks
Alex, good way to start the week. Need some help though. I lightened up a third last week as did many here. I’m trying to decide whether to jump back all the way in. The thing that has me confused is that we are in the timing band for a PM daily cycle top any day now but it also could continue to run. On the other hand the dollar is looking quite week and I have its daily cycle count on just day 9 in respect to both the euro and the yen.. Maybe I’m just fine at 2/3rd’s throttle and don’t need to ( get to cute )
Hey Crawdaddy-
Unfortunately – This is why I wrote the report about not getting too cute, trying to trade around the first 2 daily cycles out of a YCL / ICL. . I cannot help anyone re-enter low risk once she starts running. I get us in near the lows, and from there it can be a nice ride.
Now we find ourselves in the middle of a daily cycle, and it is tough, especially coming out of an ICL where surprises are to the upside. There is no way of knowing what will happen each day. Recently so many were writing to me complaining about Miners “Weakness” and I wasnt seeing it. The GDX chart in the report shows strength.
There is nothing wrong with locking in gains, taking some profit, trading deeper into a daily cycle, but where to get back in is the tricky part.
I had pointed out in that report that in Jan- March of 2016, it didn’t really pull back into an obvious DCL , it had small sideways moves.
GDX just did a small sideways move along the 50sma too. Time will tell the story.
Alex , thanks for the reply. Hell i ain’t greedy I think I’ll just watch the dollar for a pull back and look at it again then. Your very much appreciated Alex!
I do find that individual Miners can play out on their own ( Like EGI recently- flying while GDX went sideways) so you can look for set ups that may break out.
I will be looking for that and putting them in my reports.
Alex, I sir will be watching. Thanks again.
So, last year I got “locked out”. I was waiting for that 3 day flush we used to get. Didn’t happen. But there were 1 day pullbacks, some a bit sharp. Personally, I’d wait for a 1 day, hold my nose and jump in. Gonna nail the DCL? Probably not. But as long as you don’t chase a huge up day, you’re gonna end up ok. I waited for the perfect setup and it never came.
Maybe if TRX breaks the 200 dma it’ll finally take off and run…..
THAT – IS – WHAT – I – AM – HOPING – FOR 🙂
Me too 🙂 It is one of the few miners I kept…:)
What did you do with the rest? You didn’t sell all did you?
No, not all….but a lot…should have held on….but….like I’ve said…..held on too long before in the bear market and it has scarred me…..I’ll be looking for ones that drop to get back in some……or back into oil when it looks like the time is right….
Was saying this earlier with crawdaddy, but I got locked out last winter. If we followed that pattern again, there won’t be too many opportunities to get back in. Pick a down day, don’t chase and go for it, don’t try to nail exact DCL, may be really tough to know at first. Scale in, if able.
Ya. I’m wondering what effect the inauguration might have on things…….wild swings?…..if we only knew what Trump was going to tweet out before he tweets…….:) 🙂
Alex, what do you think of AUMN right here?
It is better with a close over $0.72, but I think that it will play catch up too, and could be a big gainer.
They did an offering in December at the market. That was positive.
I like that it dropped and tried to fill that gap and then got back above both the 200 & 50sma.
The weekly chart looks very good.
Thanks for the feedback! 🙂 🙂
Thanks for the comments. I was ready to give up on ‘er and move on. AUMN just flat skipped the 1st daily cycle, that’s not normally like her to do that.
Ah yeah, was looking at this earlier today and got sidetracked! I started to get some but decided to wait and see what later in the day looked like and then forgot about it….might get some tomorrow if it doesn’t gap up at the open…..but….if dcl isn’t too far away maybe not….or…..dcl might not ever come….or…hahaha
So the pattern with NAK has been to break the upper BB and then consolidate back to the 13sma. Is this where we sell some and reload at the 13? Or is the clue to sell actually a “close” above the upper BB? Or neither. Got some big gains here to protect, but don’t want to get “cute.” (Beaker was always seen as the cutest Muppet).
hahaha
Some miners retraced a bit this morning but not all the way to fill gaps….wonder if we’ll get another push down to fill…or….?
Looks like EGO completely retraced
GDX Count:
Maybe just Maybe GDX beginning Wave 3 of (1)……..
https://uploads.disquscdn.com/images/9a4da3b2e88038b56de72fb85ab5fa1c80ece8082e141788167d20826c28a76b.png
maybe a minor wave 4 with a run to $25 to complete wave 1?
I was trying to determine if it was a BEAR FLAG or a BREAKOUT?
https://www.tradingview.com/x/rqFmJ7ui/
I had it as a Bull Flag as of last week….broke that flag this morning.
CWEI ( up $39 @ $142) bought by Noble Energy. GREAT RUN!
nice.. i was just looking at XOM and i said hmm.. that pattern looks familiar… so i compared it …
XOM and Gold ……… interesting…. who knew….
https://www.tradingview.com/x/ogThwTfN/
Nice run with rare earth, REEMF, still going on good volume when you would think the air would be “rare.” In the past four weeks up 1036%, only bought it when Carl mentioned it @ .23 and then again a day later @.27 now like a kid in a candy store not knowing what to do with my good luck!
Wow, I don’t see any reason for it, other than possibly massive short covering when the Mining sector took off.
I seem to recall a story that this is the only American owed rare earth/element company and that China supplies to the world and was cutting production. But, the thing keeps climbing! Earnings were -$.29/sh in 2014, -$.19 in 2015 and 2016 is still behind the curtain waiting to be revealed. Zacks has the EPS growth at 60% but I don’t think that includes 2016.
Wow. That really was a penny stock! But movements like this very rarely end well…
Very nice trade !
As if I could actually regret selling CWEI at $30 any more than I already did…
I think it was Crytstal that bought & held on to SN way back when I recommended it.
Still holding Crystal ( Was that you?)?
Yes ! Sorry just seeing this now — (dealing with a family emergency …..)
TRX? makin me sad
James Sinclair the CEO has a letter on their website that is very positive since they have secured a 10 year license with the Tanzanian government.
Yep. It’s my single worst performer. Almost everybody else is humming along.
Re. NAK: Hey 2 new articles out today at Seaking Alpha.
SN – great climb today – Good call CF!
Well, actually I think I mentioned it weeks ago breaking above the 50sma
.
To be honest, I would have gotten bored and sold it by now and missed the lat 2 days – lol
OWCP, who mentioned here last week around 21-22 cents. (Thanks again)
Got yourself a giraffe neck there 🙂
look at the volume coming in on NAK on a monthly chart
EDXC just popped Another 25%
It’s gotta be the excelling sales of those Scooby snacks 🙂
See 6 month charts – progress since the Medical Marijuana report
CVSI – Starting to build the cup
EDXC – Cup formed, handle formed, break out now
CBIS – Formed a cup ( and inverse H&S) breaking out
HEMP – Finishing its cup
Thoughts on mjna? Coiling?
That is likely STeve,
…it was forming a nice cup & then had that freak knock down day near Jan 1st and that may have scared buyers away for a bit.
( I liked it until I saw that – now I would need to see what it wants to f=do from here)
Man, I started to get CVSI last week…then again this morning but had to be away a little bit….shoot
You do have the EDXC though, right? I thought that you mentioned that you did. That is now up 32% 🙂
Yes, I do have that one – in 2 different accounts actually… excited to see it move! I have CBIS, CNBX, LXRP, EDXC……all smallish amounts ….just sitting and waiting for nice pops! That CVSI set up I’ve been watching, so kicking myself for actually seeing it and not moving on it….but….I think it has more room to go still so…..I just went ahead and got some…we’ll see 🙂
I agree, CVSI nice volume today – breaking higher out of a sideways consolidation. It could stair step higher or just blast upward like these tend to do, but overall , I think most of these want to go back up to their October highs. Some have and are breaking even higher.
Do you have any thoughts yet on whether there is a marijuana chart “cycle?” It seems like they all move up and down at similar times, I was looking at this last week trying to figure out…..if there is a high and low time…..if so, I think it might have just started a new “cycle” …..? I don’t know of an index that could be watched to determine anything (like watching GDX to determine miner cycle, etc.)….and market is down today, so I don’t necessarily think it is correlated to what the market cycle is….
Oh hey….I didn’t think about it…but that site…The Marijuana Index…..has a North American Index, US index, and Canadian Index…I wonder if it could be used for tracking a cycle?
These work using T/A perfectly. SO far I don’t need anything else. They set up & run and break out and run like little clocks 🙂
What do you think of the TRTC chart? I had some but ending up getting out about break even I think……I remember thinking I’d really like to sit on it for longer but I think I didn’t want to do it in my trading acct and just never got back in my other acct…
Improving, but it is under the 200sma
Pull up a 2 year chart of GRNH & EDXC and just use the 200sma. You can see the benefit of buying it in that area,
P.S.
GRNH – That chart is set up correctly, I do not know all of the fundamentals.
EDIT: Daily chart of MCOA – That is a tight set up , use the 50sma
I think it is more than dogs eating those snacks. Pet owners are coming out of the woodwork.
Ya know, I wondered the same thing, and then when doing a bit more research on it, they apparently use a THC extract that does now give the “High” affect, just the joint pain relief.
Then it is “older” pet owners. Given the price of prescription drugs to elderly (non schedule F- Medicare patients)
u think it goes UP as fast as it came down ??? lol
(candles flipped)
https://www.tradingview.com/x/wgg4EaNr/
lol …. that is the 1st thing that came to my mind as well….lol
I might try it myself if they just cut back on the gravy taste, and possibly go with cinnamon. My mouth is watering already and my joints are even feeling better, possibly placebo effect, though.
Alex….I’ve been watching NOG…..wanted to get it….but ..didn’t….up over 7% now…but…not sure about the oil cycle…? NOG just tagged the 200 dma…if it can break through that do you think it has chance of continuing up to $4 before the oil cycle might start declining?
Could run to $4.50 area
CF TRCH One to have a look at
Yes, Someone ( Maybe it was you?) emailed me TRCH this weekend.
I like the weekly chart and it certainly Popped today. Thanks…I’m sure the group here appreciates that too.
Wasn’t me. But chart looks good and sure did pop today.
Signing off for a while – Have a Good night all!
Can someone help me understand this ?
I got burned huge when the Great Little Panther did an offering …. so … since I was up 300 % on NAK I dumped it in a devensive move @ $2.05 when the offering was at $1.86. Then, today I get left behind on an 11 percent move ! How can that happen ?
I don’t think that I have seen it before either MD, they do usually drop to the offering price and have to absorb that level for a while.
I believe that the value of this company is becoming known and the possibility of successful drilling if they get the permits to do so is becoming a reality too. People are investing in that possibility. It is being accumulated in a bigger way than it is being sold off.
I think that It will pull back again soon enough, I did show a pattern that the chart is following and until that pattern breaks, it just keeps stair stepping higher.