
Looks Inviting
There are areas of the markets that are looking quite inviting, so lets review the first day of trading in 2017 and see what we can find.
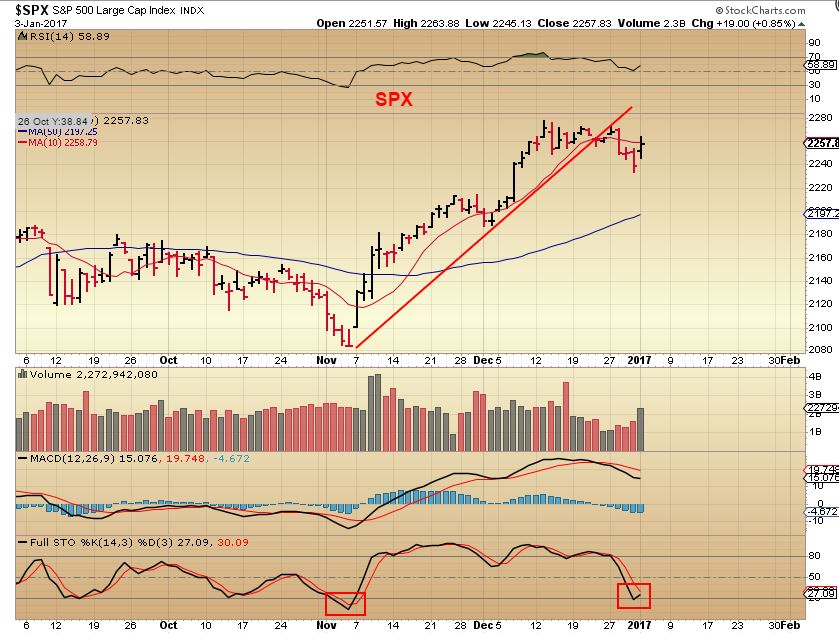
SPX – From the weekend report, I expected a bit more of a drop.
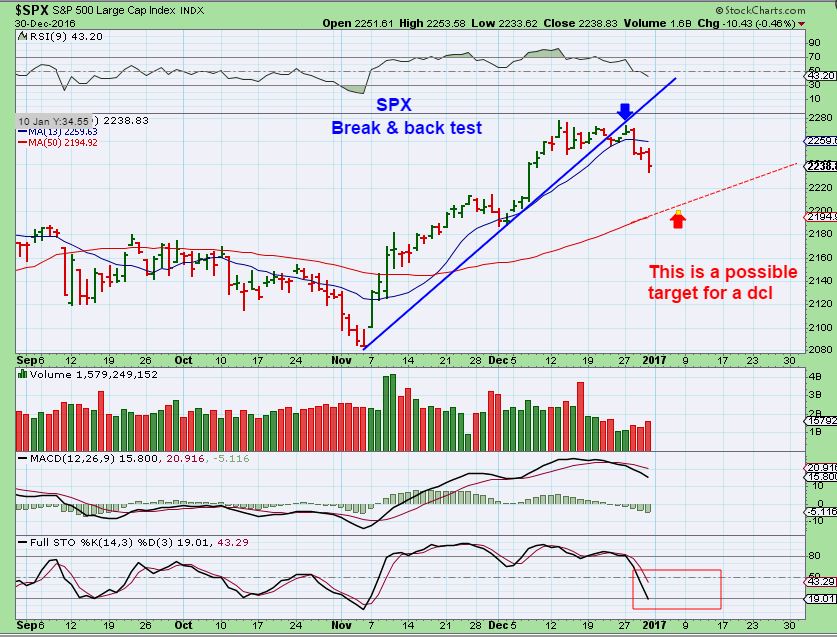
SPX – Good volume on the reversal, this could continue higher.
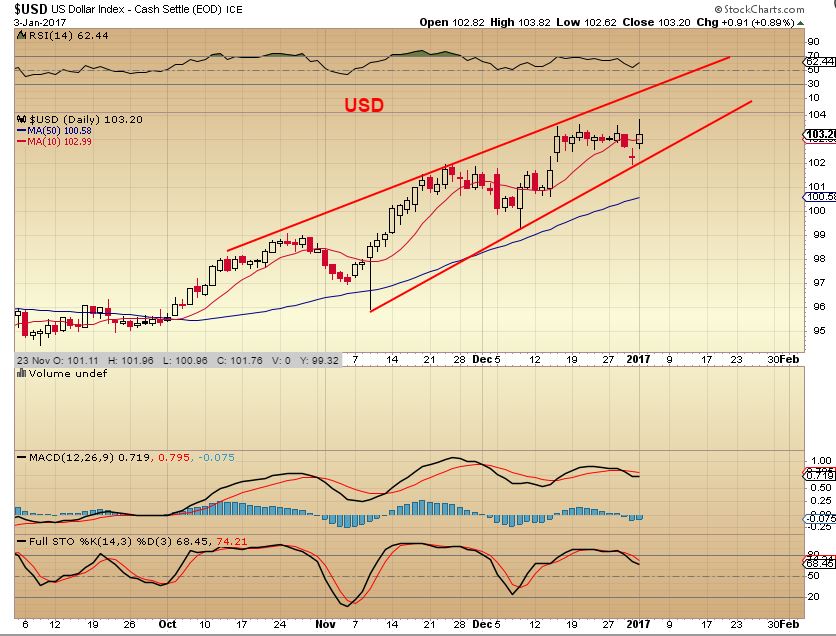
The USD made a new high today. Though the USD closed up almost $1, Gold and the Miners didn’t drop and close lower. That was encouraging and could indicate that the USD has further to drop. It is becoming due for a dip into an ICL, this should help Gold, Silver, and Miners move higher.
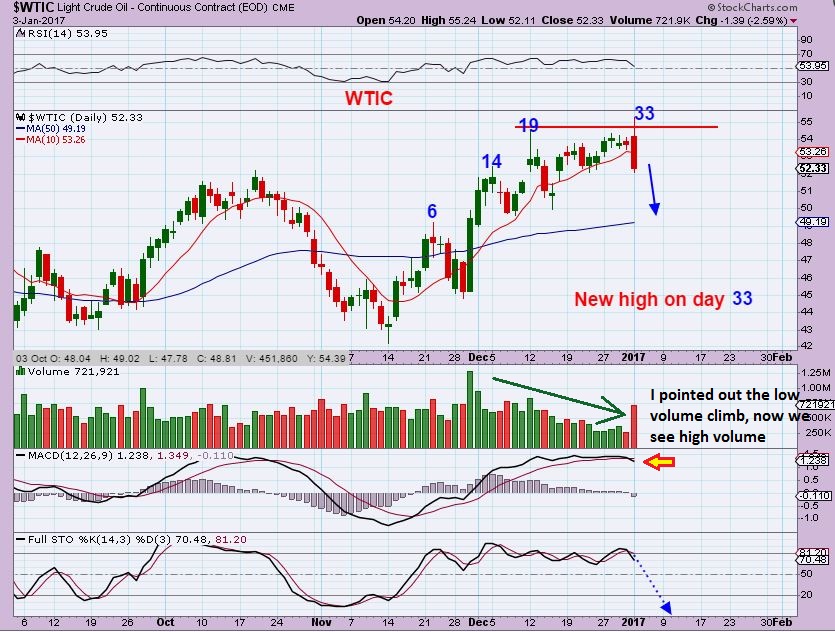
WTIC from the weekend report – Oil has been climbing on light demand. I expected a dip.
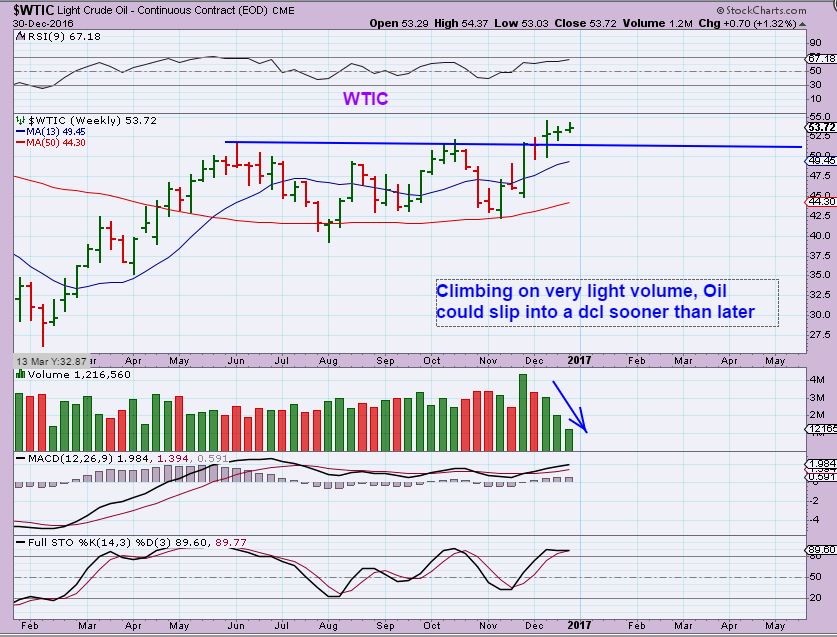
You may recall that over a week ago I said that ” It would be nice to see a higher high than day 19 to lock in the chance for a Right translated daily cycle, before Oil dips into a daily cycle low.” We got that ‘higher high’ on Tuesday, along with an immediate reversal. I would think that we will now dip into a dcl.
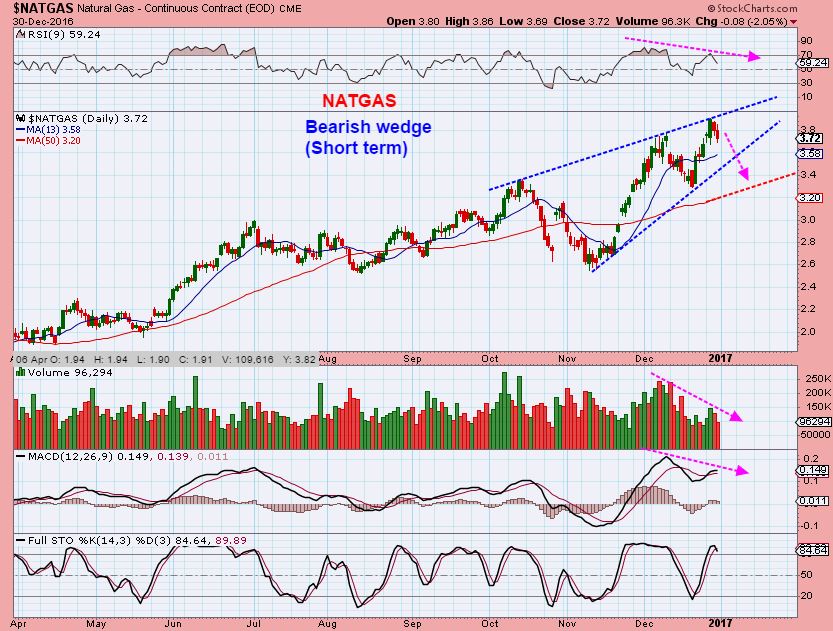
NATGAS from the weekend report ( I had 3 charts). I knew we were seeing a false break out early last week, and I said that I was expected a dip. On this chart I showed possible targets of the 50sma or the bearish rising wedge.
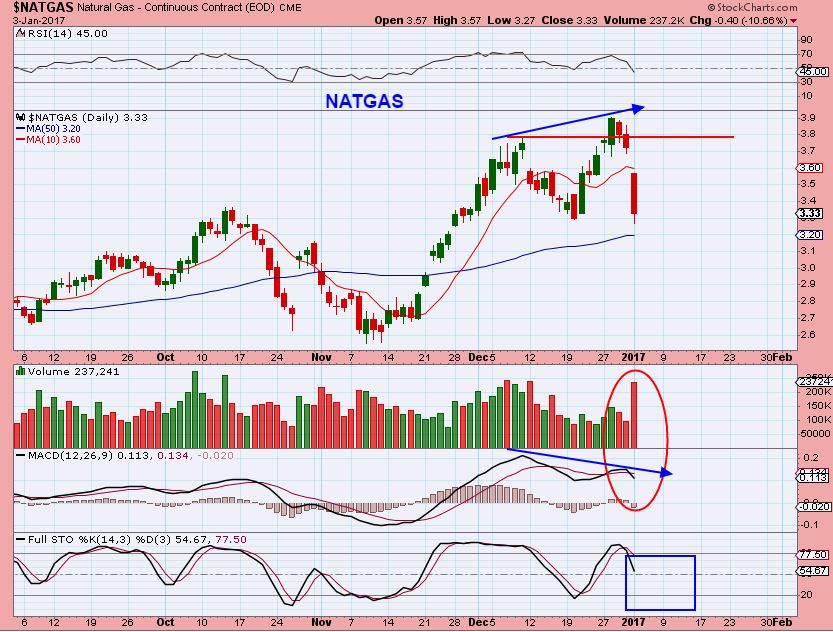
NATGAS TUESDAY – That was a huge drop on Tuesday. We are near the 50sma already, but this needs monitoring from here in my opinion, this has bearish implications for even a deeper drop than that 50sma.
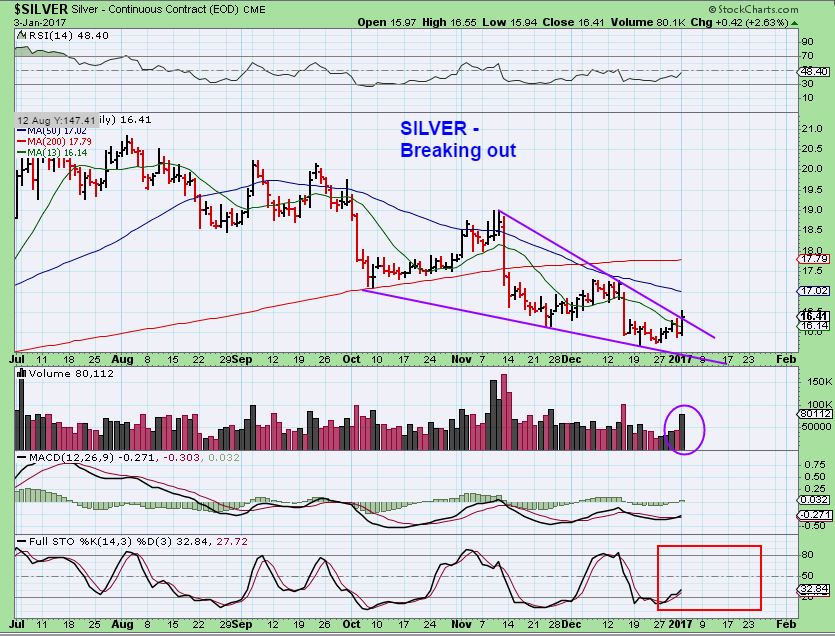
GOLD , SILVER, & MINERS
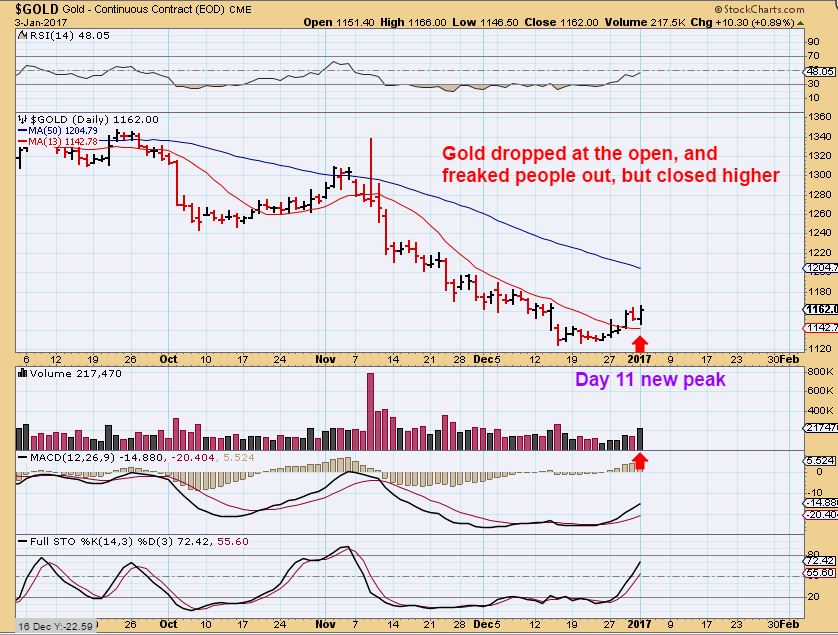
GOLD – GOLD sold off in the first hopur of trading, and that made many nervous, but then it reversed and closed higher. Day 11, we have a new peak and GOLD held up above the 10sma. This is bullish and shows signs that we likely have put in the ICL ( and YCL). I expect Gold to continue higher.
SILVER – Silver looks like it is breaking out from a bullish descending wedge. The volume is increasing and this is a bullish set up. Silver should move higher.
GDX – MIners didn’t really follow Golds morning sell off. We now see a possible mini bull flag building & pushing on the 50sma, but the more bullish indication is in the chart following GDX.
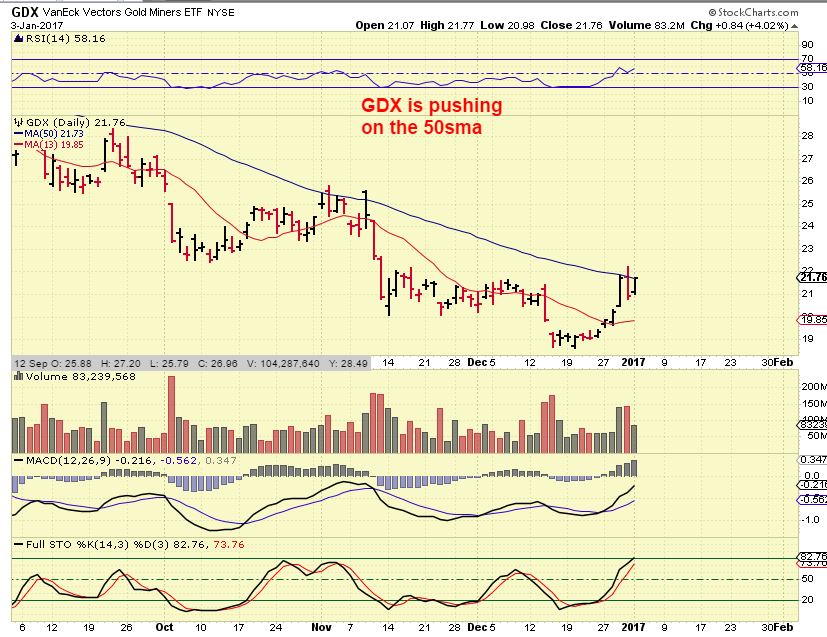
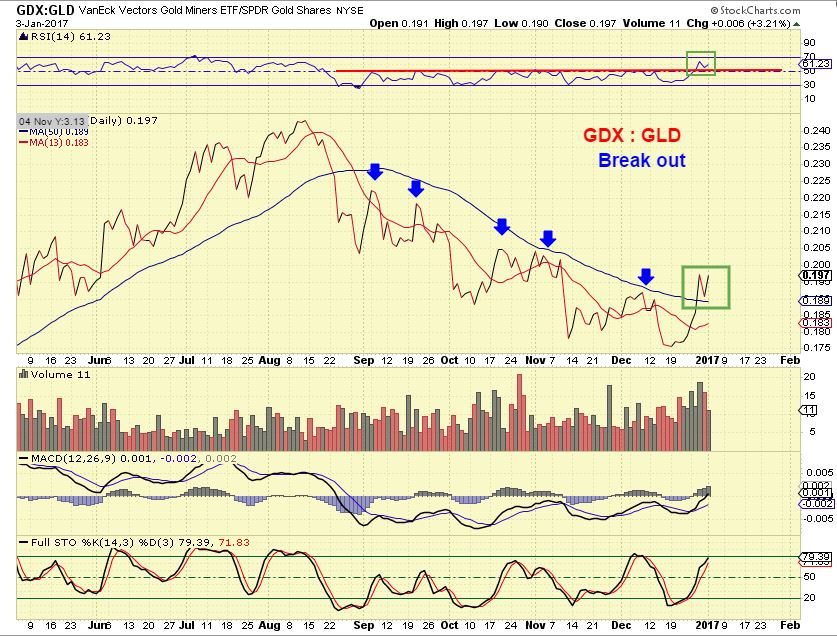
GDX : GLD – We were buying Miners last week, but this is a clearer indication that Miners are leading Gold, and that is bullish at lows.
More Ideas
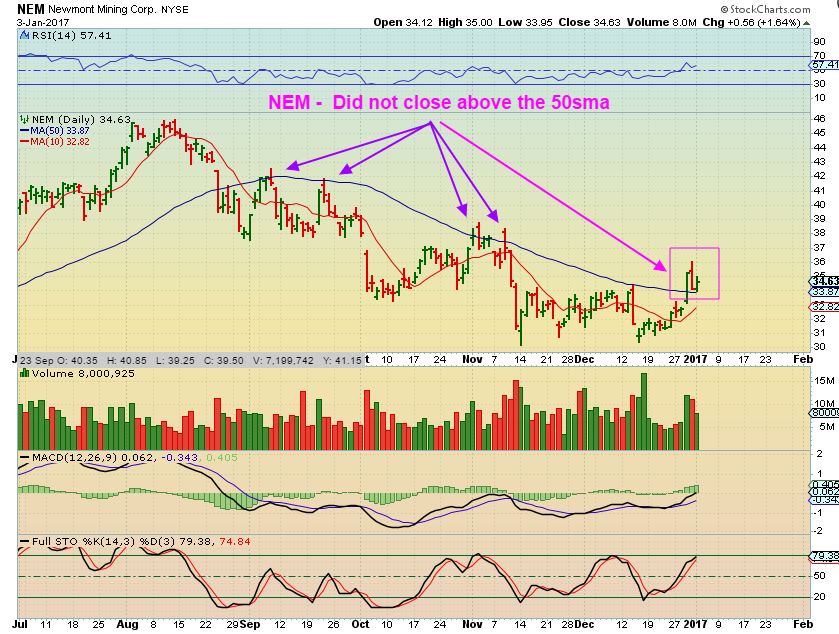
NEM – NEM is a big part of GDX. I see a difference between the prior daily cycles at the 50sma resistance, and now. NEM is stronger at these lows, this is likely the ICL.
GG – Ditto
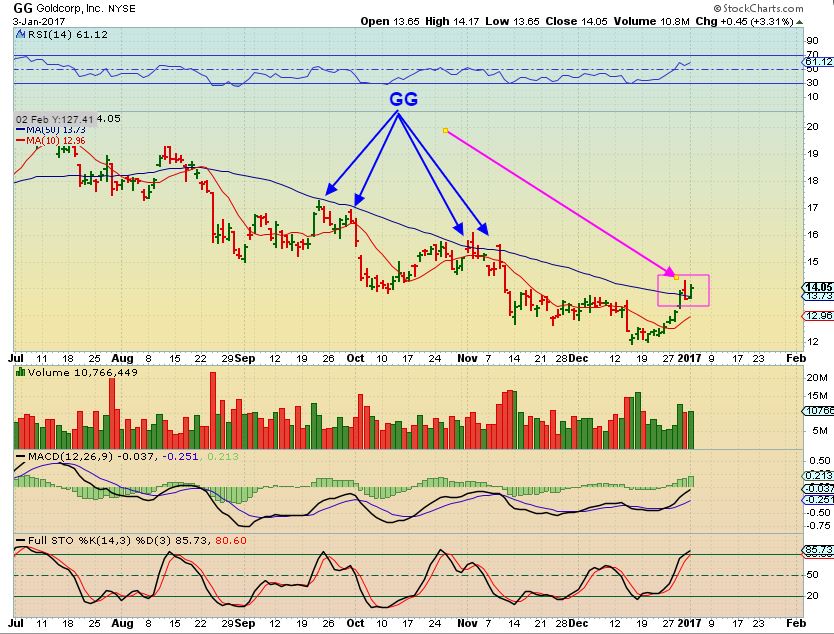
This indicates that the lows are likely in place. The ICL and the YCL are the kind of lows that will not be broken for weeks and should lead to further upside for at least 2 months. We have been buying miners and I am gaining confidence that the current lows should not be broken. Though we do not have all of the confirmation signs in place that we usually look for to identify an ICL, the above evidence adds to the idea that we should be long the precious metals sector.
.
MORE IDEAS
THM – I drew this for one of our readers that was wondering what I thought of THM. We made some really good gains from THM last spring into summer. It looks to be back on a longer term support. It could have been bought on the lower trend line of the channel or a break of the 50sma for added confidence ( but waiting does add risk of buying when a normal pull back is due).
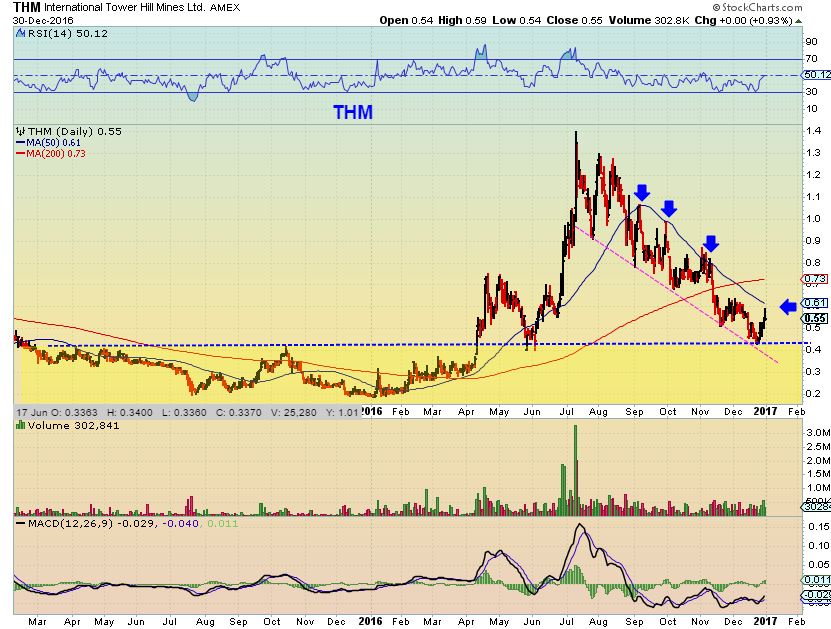
Do you see the June-July little pull back in the ABOVE chart of THM? That is a normal dip into a dcl that comes within a month of the lows. That said, it could happen in any of our miners, at any time, but I don’t worry about that. The 2nd daily cycle was explosive.
TRX – I have been posting charts of TRX for weeks. This was Dec 12th, when it was 47 cents. A bullish wedge. ( Notice that there was no deep dip in June in TRX, so different Miners will act differently).
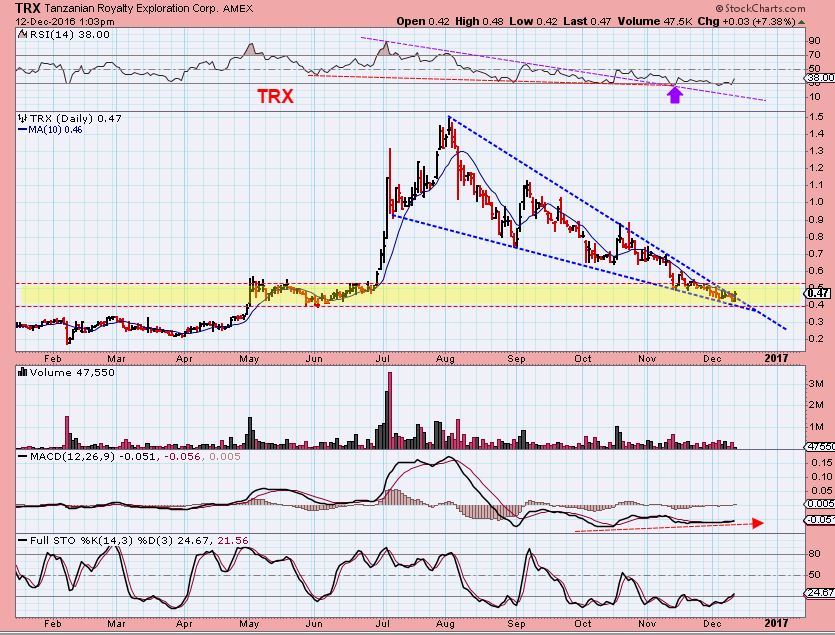
This chart was posted too in my reports, to show that TRX has potential in a Gold Bull run.

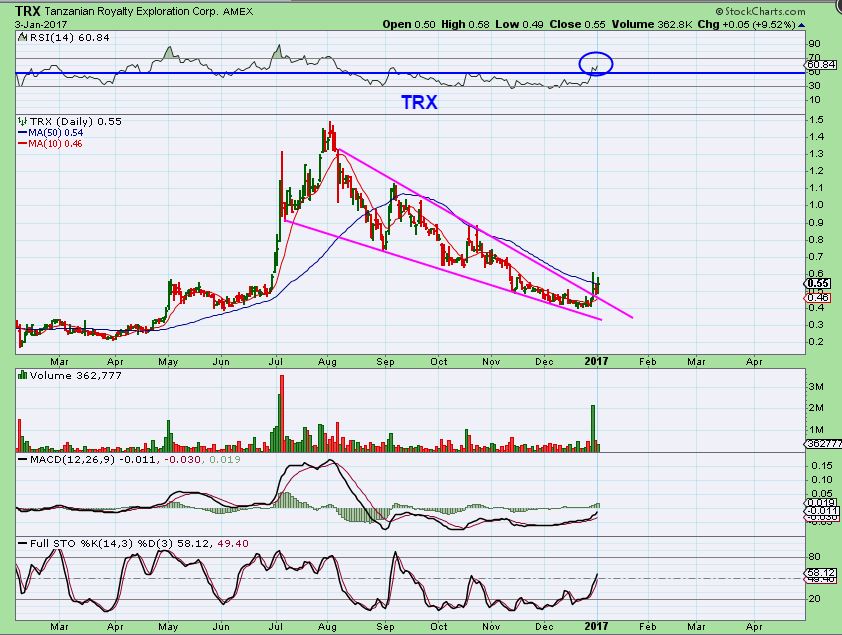
TRX has broken out and is battling the 50sma, now closing at 55 cents. The RSI is showing strength too. If the Gild market remains in tact, buying at these lows could yield a double or triple in the future, in my opinion. The same as we saw when we were buying TRX last May. It ran up as more than a triple.
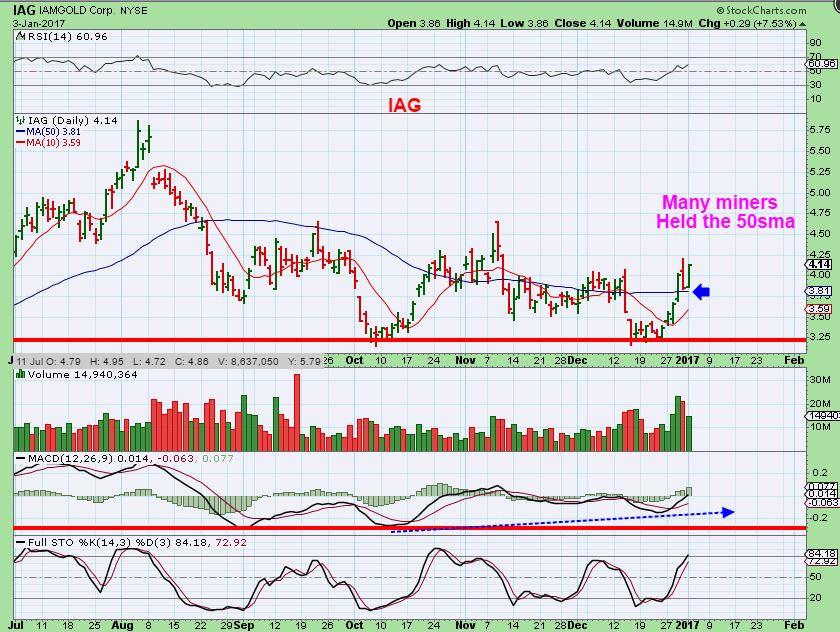
IAG – Many Miners like IAG, GORO, EGO, BTG, etc have already regained their 50sma. They may run up further and then pull back to back test this area, or they may just keep going higher. I wouldn’t wait if I was looking to take a position, I’d at least have partial positions and then you can add on a dip if we get one.
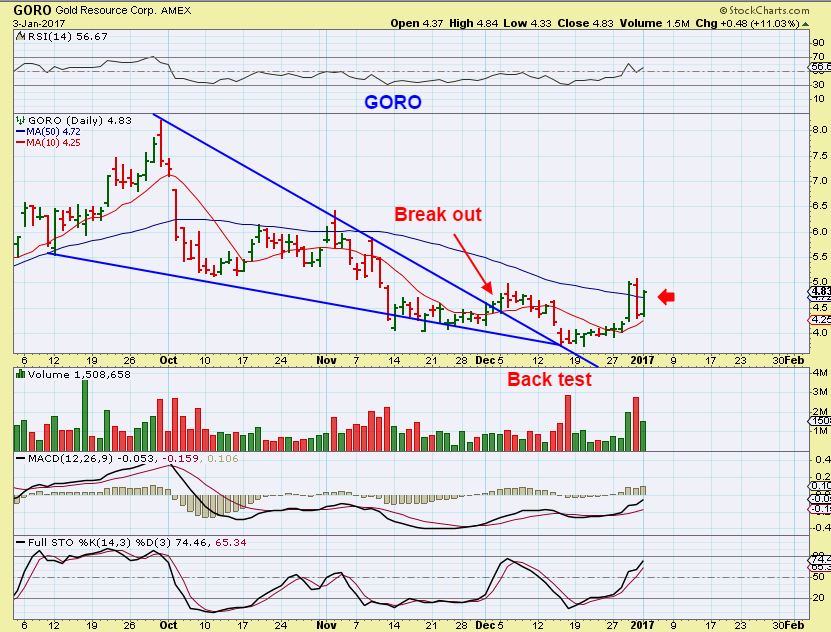
GORO is a bullish set up after breaking out and back testing a wedge. Now it has popped up above the 50sma and could be bought anywhere in this area. I’d expect that it wants to run back to the Sept highs, a run from $5 to $8.00 at least.
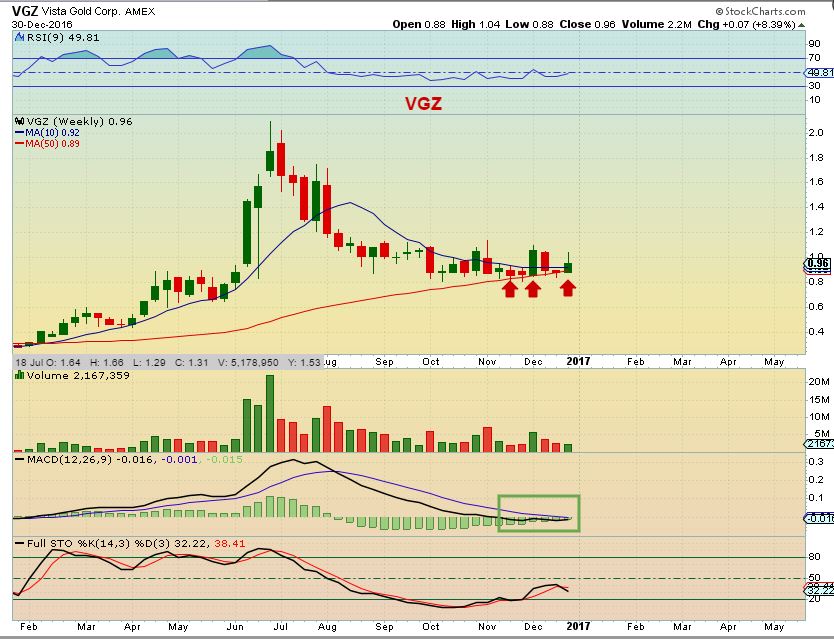
VGZ – From the weekend report, I’d like the way VGX is putting in a round bottom base and held the 50 ma on a wkly basis. A return to the summer highs is a double and could form a cup ( eventual cup & handle).
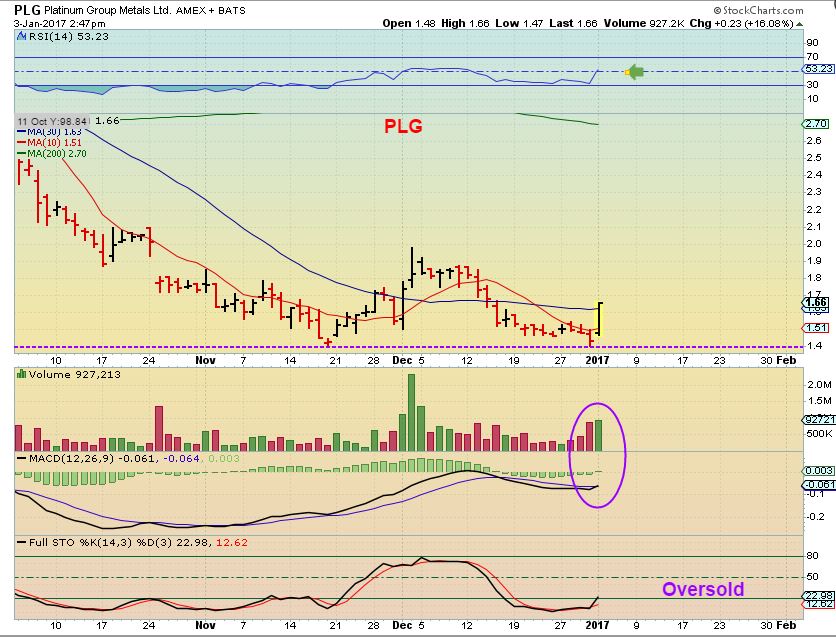
Platinum broke out and PLG double bottomed. In a 16% surge, PLG broke out back above the 50sma Tuesday. It remains oversold and has strong MAVD divergence. I would expect those lows to hold and for this to run higher by a good %. You could use a stop below the double bottom if you enter ( Mental or hard stops).
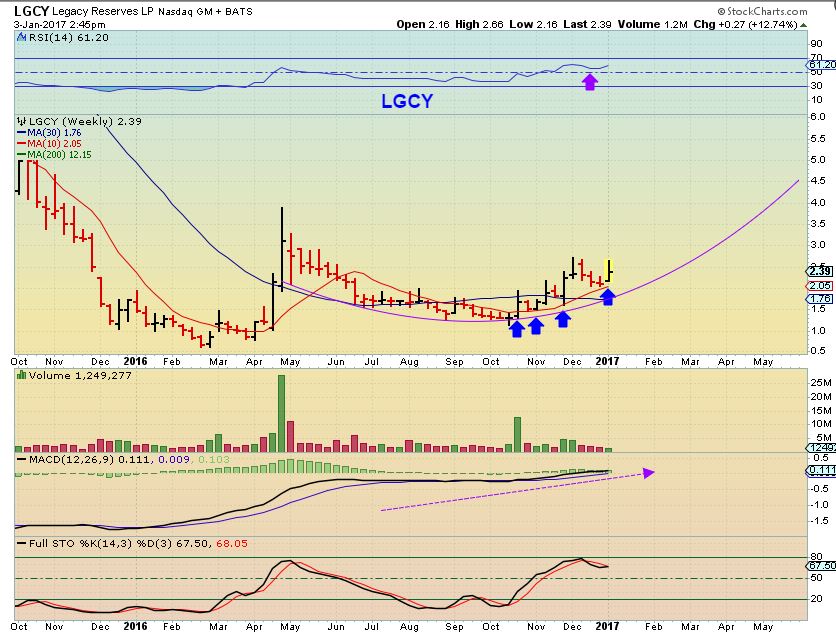
ODDLY – We saw NATGAS and OIL drop rapidly Tuesday, and this LGCY WKLY chart looked like it wants to go higher ( It closed at $2.40). The weekly 10 MA has been acting as a good support point. I am watching this to see if it pulls back again with OIL & NATGAS acting weak. You can also check out charts of NADL and PACD since they also held up on support at the 50sma. I am going to continue watching those energy stocks going forward, but I am focused on Miners for now.
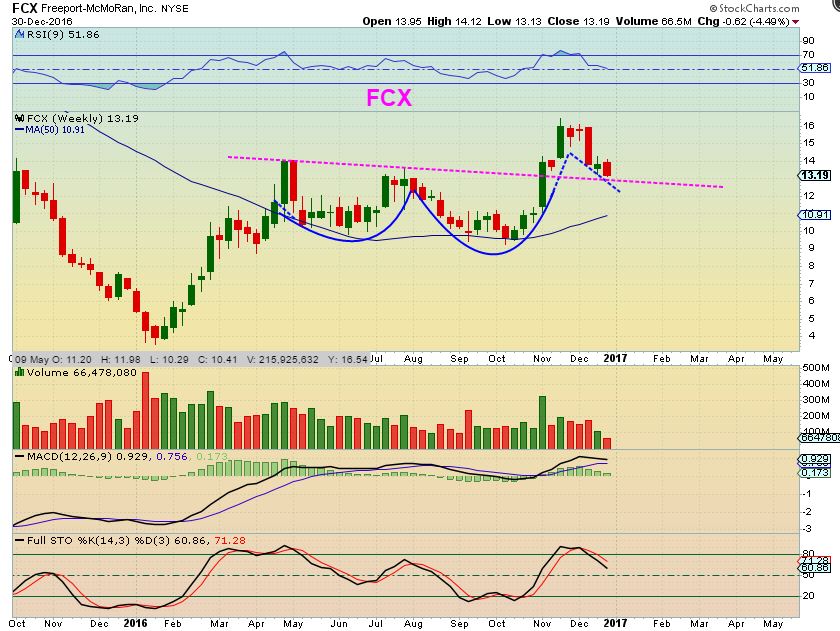
FCX from the weekend report – I couldn’t tell if FCX was done dipping down or not, but the weekly chart looks bullish and landed on a back test area ( Magenta line). The daily chart, not shown, broke slightly below the 50sma. Shake out?
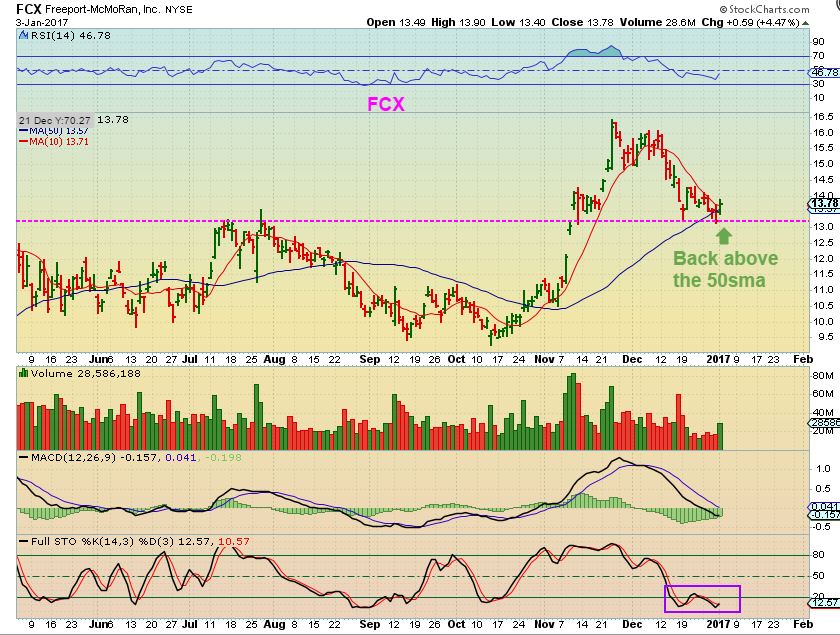
FCX – Regained the 50sma, as though it was a shake out, and the volume was healthy Tuesday too. This could be bought here if you have been wanting to take a position in it, since the Trump election rally. This is sort of a cup with high handle / back test.
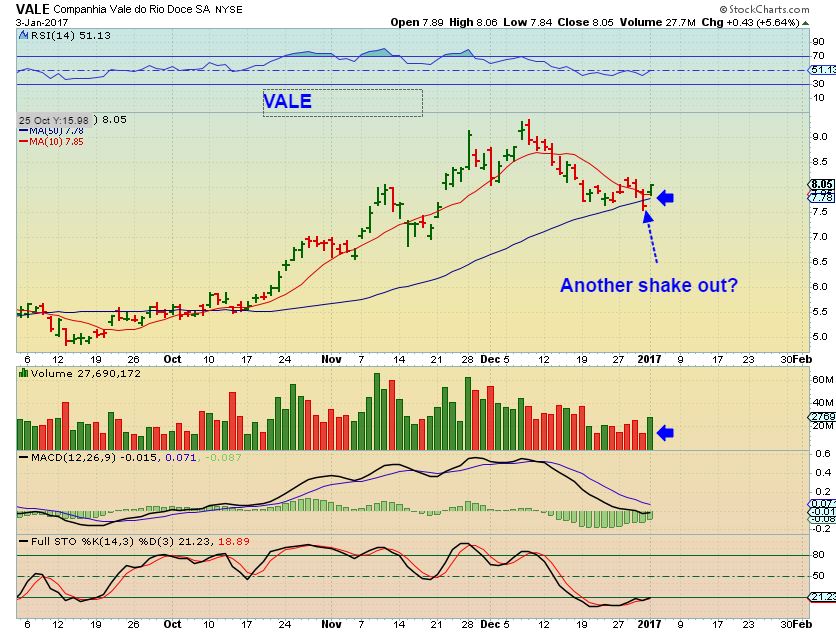
VALE – Another shake out? This also looks like a real reversal back above the 50sma and buying here should offer a low risk entry. My stop would be below Fridays lows.
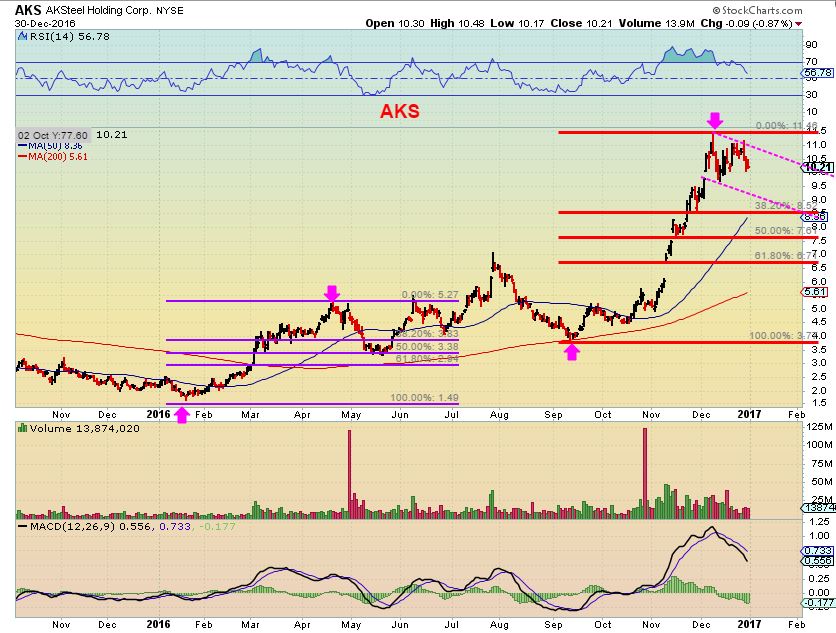
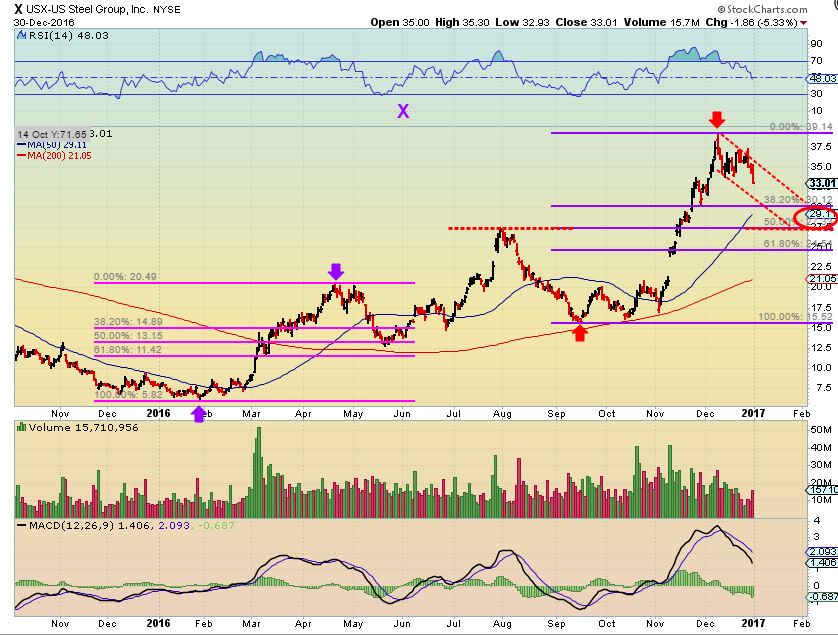
STEEL STOCKS – I had these for the weekend report, but forgot to include them. These ran higher very fast over the past 3 months, and they looked as though they need more time to consolidate as shown below in AKS and X. Believe it or not, Tuesday they also went higher and ‘MIGHT’ just consolidate sideways before another move higher. If that happens, that is a super strong move that left me behind, but I’d feel too much like I was chasing if I entered up here. I’d rather look for Miners that could be preparing to run now.
So that is the current market set up after the 1st trading day of 2017, and those are some trade ideas. Many of the Miners looked pretty good Tuesday, after an early morning sell off and recovery. I have been saying that we are due for the lows of an ICL and a YCL. We see more signs of bullishness as time goes on, so you should be able to buy in this area and have some solid gains in the coming weeks, even months. I will continue to monitor things and point out clues of bullishness or caution as needed along the way. I’m thinking that we will see more ‘buy set ups’ forming in the coming days too. Gold & Miners could put in a quick dip into a dcl in the future, or they may just consolidate sideways around their 50sma before heading higher. Either way, that would also present a buying opportunity if you still have cash or wanted to trade out of 1 position in return for another.
Enjoy your Wednesday trading day and stay tuned, things are getting very inviting! As always, thanks for being here!
~ALEX
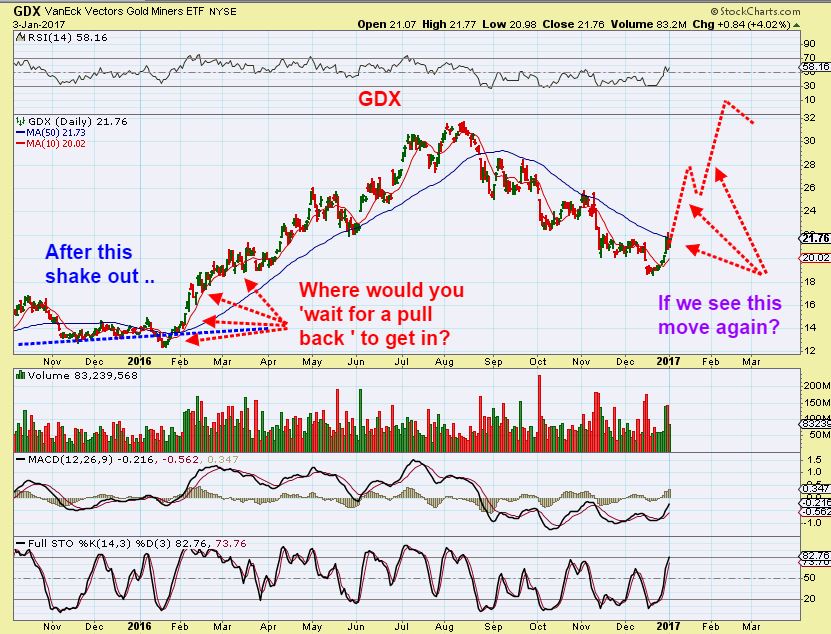
Additional instruction with 5 important charts: Some here are hesitant to buy while price is moving out of the ICL. Here is what you could do, but let me include a couple of charts showing what could happen.
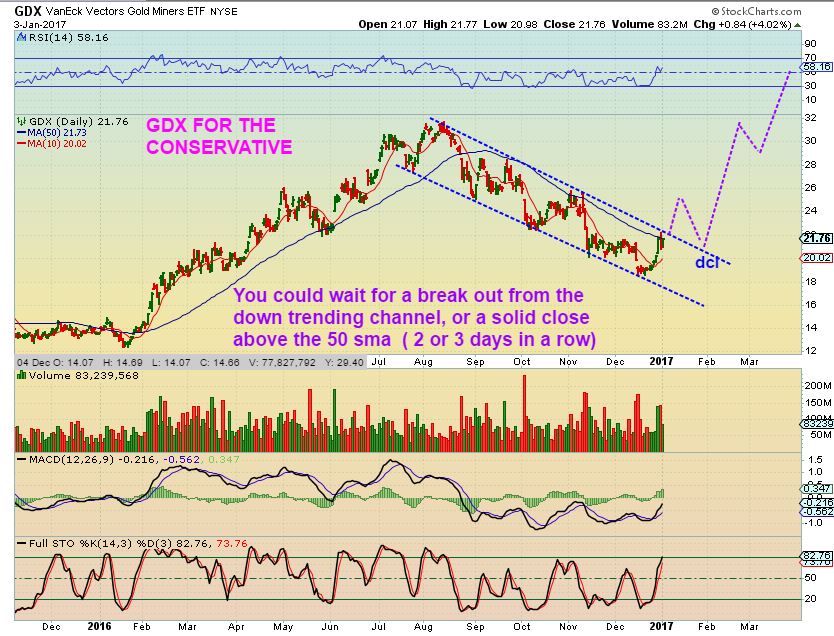
GDX – You could wait for a longer term signal of bullishness, and it may look like this, after a break out in the first daily cycle and the dip into the next dcl in mid January.
I HAVE HEARD CONCERNS THAT SOME ARE LEARY OF A REPEAT ‘SHAKE OUT’, LIKE WE SAW IN JAN of 2016 AFTER A BREAK ABOVE THE 50 SMA, AS SEEN HERE. “Could we get a shake out in January of 2017, like we did then?”. My answer is that ‘anything can happen’, however…
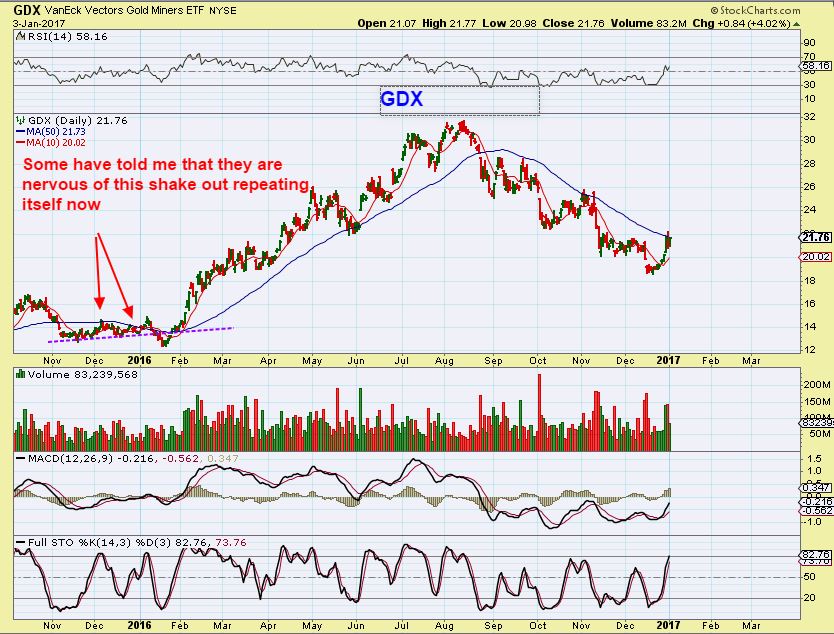
GDX – We may have already seen a shake out and now this could be the real strong run higher.
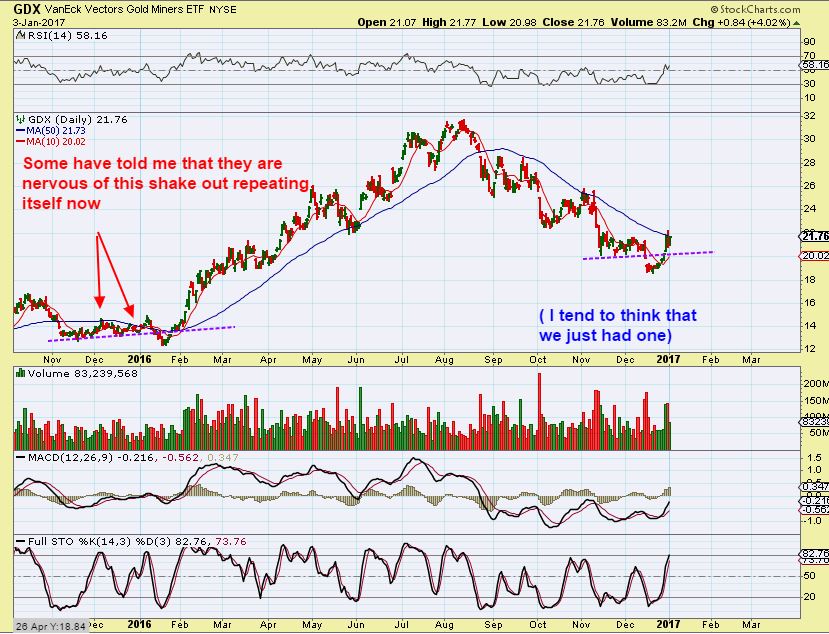
So ask yourself, “If I didn’t have a position after that shake out in 2016, would I have been able to ‘buy the next dip?”
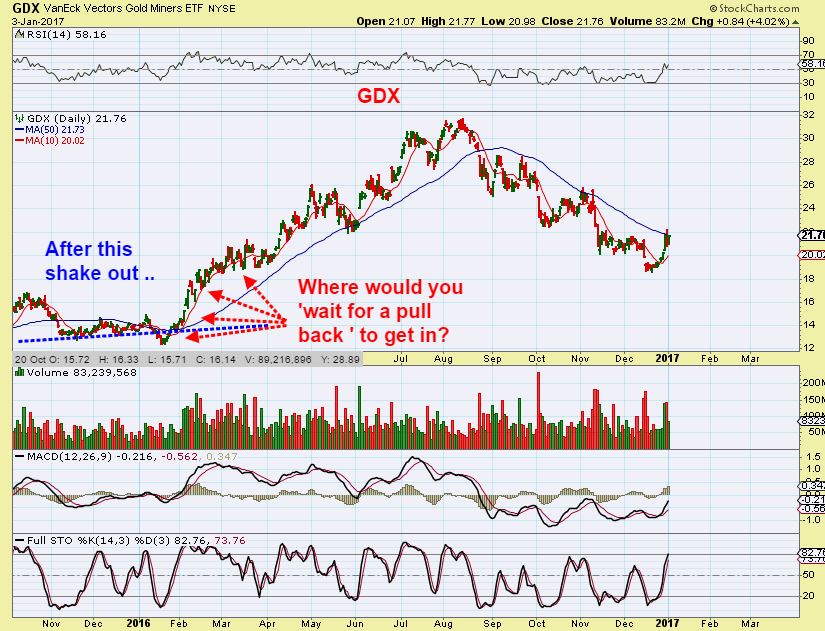
And I ask that, because if we just had the shake out in December similar to last January, where would you get in, if we have a strong rally back to highs? Go back to the X or AKS charts. Those were not easy to buy once they got moving higher, because it felt like we’d be chasing it with no solid pull back? It is best to have a AT LEAST SOME SORT of position now, if you ask me ( and some did ask me ) 🙂


Great letter. Looks like we made it through the bottom. Seasonality and EWT agrees with your last chart. Rally through Feb, pullback, then more into May. Let’s see if we can get some doubles in these runs. Do we sidestep the pullback in March? Lots of fun coming up. We, who held, deserve it. 🙂
Amen, brother!
Alex: My understanding is that the commodity markets generally tend to go in 30 year cycles. How does that mesh with you view of where we are in gold assuming you agree with that hypothesis? I’ve read some believe 2015 was the half cycle low and we are embarking on a 7 1/2 year move higher at which point we resume the decline to a secular low in 2030-31.
I’ve heard various things , conflicting ideas, and I haven’t cared to look into it that much.
I got an email just this weekend saying that someone who uses 30 year commodity cycles says they top in the first 10 yrs, plus or minus 1 or 2 years, and so he says that Gold went 2000 to 2011 or 2012, and now we’ll spend the next 20 yrs seeking out a low to the 30 yr . Which is true? We topped 4yrs ago and will sell off for 16 more yrs or we just bottomed at a 1/2 cycle low?
I honestly cant trade today based on 30 yr cycles that lead to 2 extremely different views like that and the only way to verify it is to wait 3 or 4 yrs.
The one that emailed me this weekend asked me what I thought of the warning that GOLD has topped in 2011/ 2012 and that now it is dropping into a 30 yr low for the following 20 years? I said….That person is using 30 yr cycles and says the top was in in 2011. He is now saying that Gold is falling into a 30 yr cycle low for the following 20 yrs. Do you think he made any money in last years rally from Jan to July if he is focused on “Gold topped and is now dropping to a low for the next 20 yrs?” He probably shorted the rallies.
I dont use 30 yr cycles in my trading, so I haven’t really looked into them in depth. I look for clues in the current time frames and try to compare with historical similarities
Thank you. Agree.
Almost seems this move isn’t following the traditional playbook or maybe it’s just that we (I) have so much recency bias that it gets difficult to see what’s right before our eyes. For example, I missed the GDX closing above the 50 day and how that’s different from all of the other rallies in the last several months. So, thanks for the keen eye…among other insights you offer.
In addition to that , tht GDX ; GLD chart shows a huge difference to the other rallies too.
For the conservative trader, GDX closing over the 50sma either by a wide margin or close over it 2 or 3 days in a row , is often what is looked for.
superb charts and analysis…. thanks cf… i am so looking forward to 2017 :o)
Ditto! Thanks Alex!
Thanks TAMMIE, MARIA, and NANCY, much appreciated
Ditto again! I appreciate all your tips and insights…learning a lot from you. 🙂
Alex, I want to believe we are moving higher for another 2 months, yes please. Until I see a break over the 50 sma I will remain partially in cash. You’re GDX chart above shows the other times GDX sold off at the 50. Granted this climb seems more like a move higher than the previous ones, but caution is needed. That’s the way I am approaching it. FWIW
Yes, that is why I try to give a few different views. We have a few different types or styles of traders.
-We have high risk traders that try to grab the lows, even if they know they may get stopped out and have to try again, – Others wait for a break above the 50sma ( by the way, we are over the 50 sma).
-Other want to see the entire 1st daily cycle play out and buy the pull back. That did NOT work last January,
it did work last May, we had a pull back to the 50sma in June.
I try to cover it all, but that isn’t easy.
I’m the first one. I try to pick lows, the stops are much smaller losses that way.
I dont’ see GDX over the 50sma yet?
Look closer : – )
I have GDX charts in the report, look at closing price, look at the 50sma price.
Okay, Today its over the 50. Hasn’t closed above it yet, Lets hope it acts as support.
I give up 🙂
Excellent report, Alex, especially the end discussing perspective and how and where one would get in both last year and this year. Either way,, there is no way to make money without taking risk, and sometimes a little pain is necessary too, before the big gains come around.
Pretty much exactly correct. No risk, no reward in the markets. So to control losses, we choose our own position size and leverage or no leverage.
Alex, do you think FED minutes being released would have any impact on gold…even if just a quick short term reaction?
maybe 🙂
FCX:
Wave 3 up possibly beginning……stop below 13.13.
Coffee (JO):
Wave 3 up possibly beginning…..stop below 18.81.
Thanks for the updates, Ken.
Interesting Ken. I’ve been watching a UK listed equivalent ETF and was thinking the very same thing. Makes me more confident to dip a toe now. 🙂
Come on aboard Matey ……. 🙂
Looks like 7% downside, what’s your upside expectation?
I typically do not use targets Bill I rely more on Sentiment, TA and EW when taking profits.
Wow, NAK got up on the wrong side of the bed…..I don’t see any news….?
OUCH!
That’s why yesterday when I was asked in the comments section if I was buying that dip to the 13 sma, I said that I wasn’t buying it at the 13 sma yesterday, and didnt put it into the report today as a buy. I needed to monitor it further. The chart has slight differences, indicating that a bit of a deeper correction may be needed after that climb.
It doesn’t make it bearish, it’s just that the symmetrical climb would not be maintained, we would likely see a consolidation phase.
I dont know if news will come out later or not, but the chart was saying , ‘Do not buy the dip yet, Alex.’ 🙂
Good boy Alex, I was ready to add yesterday but after reading your thoughts on it I pulled in the reins. I now intend to add at around $1.65 . That is of course unless you club me over the head again. ( it hurts so good ) Thanks again Alex, you sir have got it going on!
yeah… what he said…. ;o)
#HFT
Yeah, me too….thought about it but then held off…..thanks Alex!
Well, that might work. I think it could go into a bit of a sideways dip & pop type of action. It may get to the $1.60 area, or $1.65. but I’ll have to watch it day by day and see if it starts to firm up and base build. It’s a bit of a bummer, but it may not be ready for the next move higher for a few weeks now, if it starts a sideways base building pattern.
Found this: BRISTOL BAY
EPA, Pebble extend lawsuit-settlement talks
Dylan Brown, E&E News reporter
Published: Tuesday, January 3, 2017
U.S. EPA and the company planning Alaska’s contentious Pebble mine gave themselves more time to resolve a lawsuit over the stalled copper and gold project, with mining promoters hoping that the incoming Donald Trump administration will let work begin.
More: BY BECKY BOHRER
Associated Press
JUNEAU, ALASKA
Attorneys want a federal judge to halt temporarily proceedings in a long-running legal dispute between the group behind the proposed Pebble Mine project and the U.S. Environmental Protection Agency.
The motion, made by attorneys for the EPA and Pebble Limited Partnership on Friday, asks that proceedings in the case be halted until March 20, at which time the parties would jointly propose how they wish to move forward.
The motion states the two sides have been talking since August about ways to resolve the case.Pebble has alleged that EPA worked with mine critics with a predetermined goal to block the project. Attorneys for the EPA have called the lawsuit a bid to undermine the agency’s proposal to protect parts of the Bristol Bay region from development.
Read more here: http://www.thenewstribune.com/news/business/article124374389.html#storylink=cpy
http://www.fool.com/investing/2016/12/30/3-gold-stocks-that-could-suffer-a-meltdown-in-2017.aspx?source=yahoo-2&utm_campaign=article&utm_medium=feed&utm_source=yahoo-2
Thanks….that explains a lot…..with Nancy’s info below showing things are stalled over the Pebble project….and the article you link stating that the Pebble project is about the ONLY thing NAK has…then…..doesn’t look good until that gets resolved…..
None of this is new information to me.
NAK has always been mainly about PEBBLE.
The EPA has blocked PEBBLE continually.
They are in agreement that talks on how to go forward working together are in the works.
The head of the EPA will be changed by Trump to a less restrictive one.
This entire run higher from 30 cents to $2,40 has to do with the value in the ground.
The markets do not follow the news, they trade 6 months ahead of the news.
That’s right….I remember now there was talk on here about how it would affect NAK if EPA gives the all clear…at least I think I remember that now…..think was mentioned a few times….I’m a little slow since the holidays…:P
Well, they have property with
70 million ounces of gold, 57 billion pounds of copper, 3.4 billion pounds of molybdenum, and 344 million ounces of silver.
I would expect that even if they get permits and cannot mine it themselves, some large miner like NEWMONT would love to come along and try to buy them out.
I think Trump’s admin is more likely to push for the project to move ahead. I think this is just NAKs usual shenanigans.
Uranium (URA)
Wave 5 of 1 up currently.
Yes, All uranium stocks are pulling back red with that pop higher in URA. I’m looking at UEG, UEC, URRE, DNN,
That could be the topping candle and then buy the dip 🙂
Very possible.
Although I would be somewhat cautious ….. wave 5’s are fickle. (fickle is a correct term right ? lol)
I am in long term so…….I may add at the bottom of the wave 2 correction where ever that may be. 🙂
I would say absolutely….As fickle as traders and algo’s can get.
lol ……
hmmm wrn is looking tasty
added some trx.. looks like she wants to blow….
I did too…hope you and CF are right! I resisted buying this one.
my PLG (from yest thank u) is doing lovely
been scaling out of the last of my aumn… added to trx… liking that better….
think aumn needs more time… u?
FYI: no rush to answer .. fyi — just thoughts when u have time….
Nenner today again says “buy” gold and silver miners for a short term rise
Yes, that broke above the 50sma and looked pretty good.
Not sure when AUMN will go
Just say the word, I have some UEC I want to add to.
BCEKF – I dont trade it due to the volumes, but such a nice chart
This is what I am watching on the NAK chart.
I’ll probably use this as a sign that I can add back tot he position that I sold higher.
This is NAK on a 15 minute chart. A break of the down trend would be the first sign that it may resume the uptrend.
.
https://uploads.disquscdn.com/images/94396e8c60c594d2725dc608b2353fcd2315759beb0342aab7981eb08a160d20.jpg
Hit the trendline and reversed nicely on the daily also (F5)
https://uploads.disquscdn.com/images/aa547b559e815e5766be76e57ef5e3134fb9c712b06b90fb882358cf23ce0e54.jpg
hmmmmmm
Yes Conrad – I was looking at that today too.
I had drawn the trend line a few times recently with the Dec 1st dip as an overshoot to the downside .. ( See the attached chart), and the reason was because it takes 3 points to get a trend line. We had a parallel line along the top, so that would make the channel along the bottom.
NAK could be setting a new lower trend line as you have it drawn, now with the 3 tags along the lows. We’ll see what tomorrow brings
.
https://uploads.disquscdn.com/images/279c30e933a68f1000a5a962b65c01e9e726005f7d2cb058672ad5073a8b26c4.jpg
Keep us posted! I added a bit at $1.75 and still holding half position from the top.
lol jinx.. sorry i just read urs.. 😉
nice.. i set an alert.. .but remind us just in case i miss it. ;o) id like to hop back in that puppy for another wild ride..
shazammmmmmmmmmm
NAK broke the trendline on my chart. Now it is falling back, hopefully only to retest the line.
GDX daily chart – should would be nice to get out of that yellow downward channel
https://uploads.disquscdn.com/images/b645dde334bbf4ea0b40dc4df5c7e654ad66ffd96dcb86ad1c5ecd79c587b755.png
If GDX can close over the 50DMA then perhaps it will make a quick run to the underside of the 200DMA in the 24’s. On the way down there were two big down days after it lost the
There is an old saw ‘Never short a dull market’. I consider today to be a dull gold stock market – zzzzzzz. Does this mean that a rally is forthcoming? Did the Fed just speak to goose it for us?
Hey, things seem to be picking up after all.
Now I am sorry we were in a dull market. It popped up for a while and now I am below where we were when I complained. 🙂
We got a nice rally at the end leaving me happy and not bored.
ECA looks inviting today
FCX is a beauty as well, nice Alex
Loving that FCX call, CF.
Commodities all over again.
I own FCX and WRN – Buying a little HBM here ( and TGB breaking higher too). Copper stocks looking good.
I was wrong about the STEEL stocks possibly needing more consolidation
X & AKS looking strong today
CENX
URANIUM stocks breaking out now too
URRE – great looking 6 month chart
UEC URG DNN looking fine
Thank-you…. thank-you…. Thank-you-so-much Alex.
Wunderbar gemacht !!!
Hi Geurt
Nice to see you again. Looks like all of the ‘metals’ stocks that we rode in the spring last year are wanting to run again.n ‘ll have to chart some for the report.
You can look at charts of VALE, CLF, HBM, FCX, CENX , etc and just use a 50ma to see what I mean.
CLF looks very good here, I’ll put it n the report.
FCX, TGB, WRN, HBM are copper stocks running.
X, AKS, STLN, are steel stocks running ( SCHN looks ready to go, didnt do much today).
Gotta run ( Band tonight) cya all in the next report
*pretendBand
You do a good job at keeping his feet on the ground!!! LOL!!
Been in and out of TGB (.55 to .99 and back in .75 to .99 today) It looks to me like it wold be a tough trade to try and get in until it comes back to test the 13ema or 20sma.. yes? no?
Damnit, I was late in FCX. Not really sure why I was putzing around instead of buying!
IWM had a day, hard to get bearish on equities after these two days.
Gold pushing to highs right now, 1169.59 or so.. Hopefully we can get some continuation on this
Yes, on the 30-min gold futures chart, I see a cup n’ handle, now breaking upside early in the Asian session. Here we go!!!
1178-1181 is potentially stuff resistance. 1200-1205 next resistance zone. Would like to hit our head on 1180 this week in order to take a run at 1200 for next while still inside 1st daily cycle.
Pretty good move some far in miners; gold is chugging along but I wouldn’t call the move so far “explosive”
I dont think we can call it explosive… But its great to see it making a move up. Been in JNUG since 4.25 fighting myself to not let go just yet.. Locking in profits on Friday when it looked bad and added a bit yesterday, but overall pretty confident.
Yeah, I was WAY early on this (like 2 months), made it hard to trust so now that I see some green creeping in, I’m starting to wonder when to sell…trying to continue to hold.
Nice entry, I got some low and mid 5’s. Man, if we could make a run like we did last year…!
Nice going holding since then! I jump in and out…..in this case holding when I had it at $4 something would have been the good move to make! I got a little after hours though, was thinking gold might go up over night so went on a hunch….hopefully it’ll be up even more by in the morning!
Im actually hoping we start to retrace tonight lol, were up pretty steep on the upper bollinger band right now on the 4hr chart. A retest of the 200sma with a bounce would be nice as a straight shot up isnt really something I see happening, and would make for a healthier ride on up
FYI, moved my stop from 1.62 (break even for me) to 1.70 on PLG. Now I’ll likely get at least 5% from the trade minimum. Once it gets close to 15% gain, I’ll move it to 1.78.
Yea I moved mine up as well.. Im expecting a pull back a bit with profit taking tomorrow possibly into Friday.. Im shooting for 30% overall but we shall see how it plays out. Im happy with 10-15% as this was a smaller position. Im waiting for the next visible climb up to try and enter with a larger position size and see some real cash in my pocket.
Now moved to 1.86:)
Got stopped out at 1.86. Oh well! Profits…
Wish I had had time today to pay attention to LXRP…marijuana stock..up 12% – here is a link to their website – just a quick glance it seems they have people with good experience in business and also pharmacology – have 2 different areas – ViPova which sells teas infused with the oil – and Lexaria Energy that has energy bars I believe…..looking at their financials …they actually have an ok current ratio – looks like their receivables over the past year went up (based on August 2016 financials I glanced at) – as always check things out for yourself, I just did a quick glance – this is one Alex mentioned yesterday I think (in the comments not the report – not that he was recommending it, think it was just on his list to watch …)…looks like big cup formation right now…has gone from .25 to .35 since Dec. 28th…..I don’t have any of this – yet…
NEW REPORT POSTED AT 8 EASTERN.
SORRY IT’S LATER THAN NORMAL, IT IS LOADED WITH CHARTS THOUGH