
Weekend Report- January 1st
In my opinion, the year 2016 ushered in a traders paradise. Let’s take a look at where 2016 left off , and where 2017 begins.
.
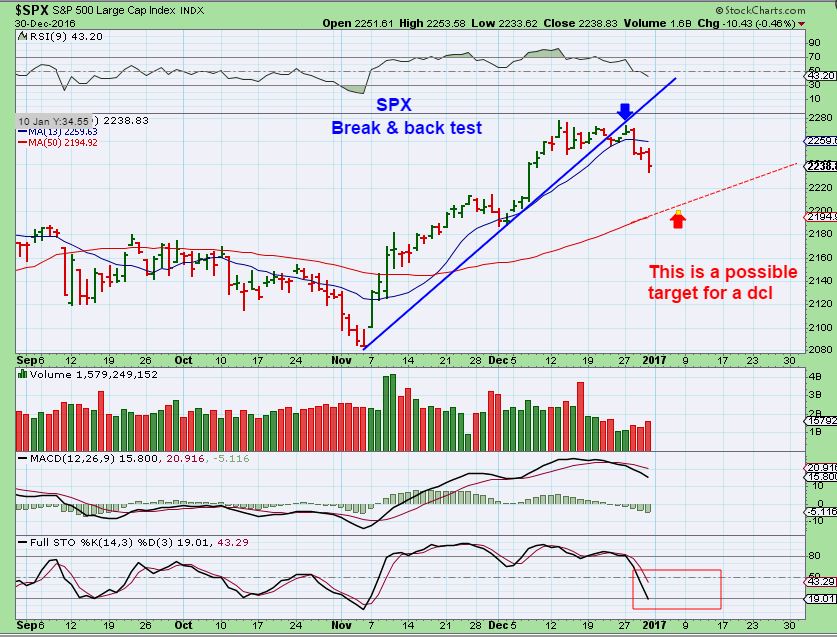
SPX – As expected, the S&P 500 is selling down at this time, possible target shown.
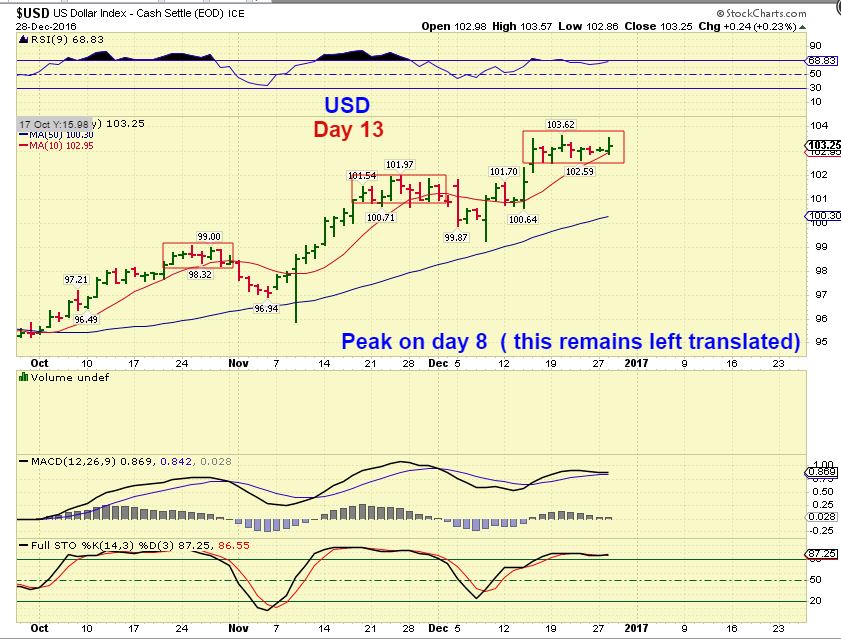
USD – Dec 28th, I wanted the USD to begin its drop into a dcl, and this would make it left translated ( weak) if it didn’t break to new highs.
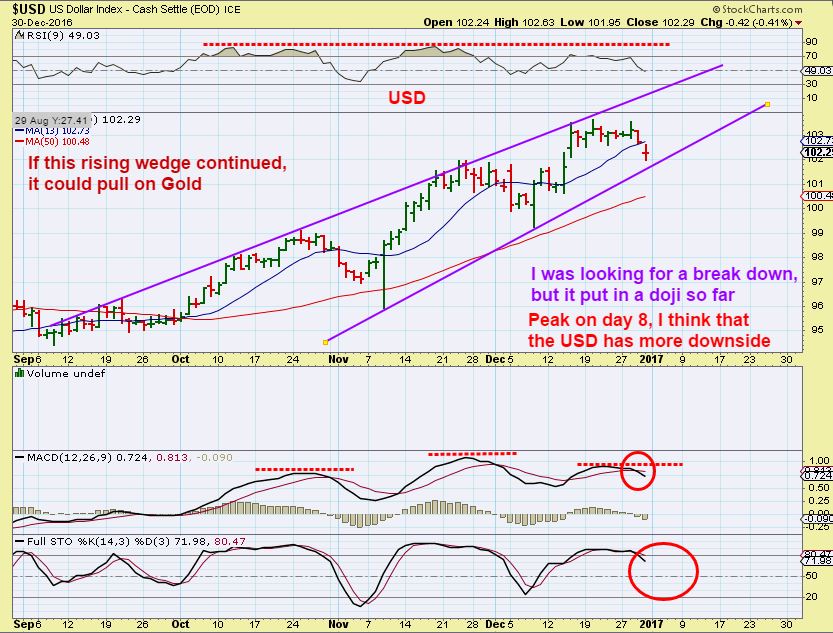
USD – Dec 30, we have our drop, but we need more than 16 days to keep the L.T. idea alive. I anticipated a drop to the 50sma, but I noticed a bit of a wedge rising here. We’ll be able to see how this plays out over next few days.
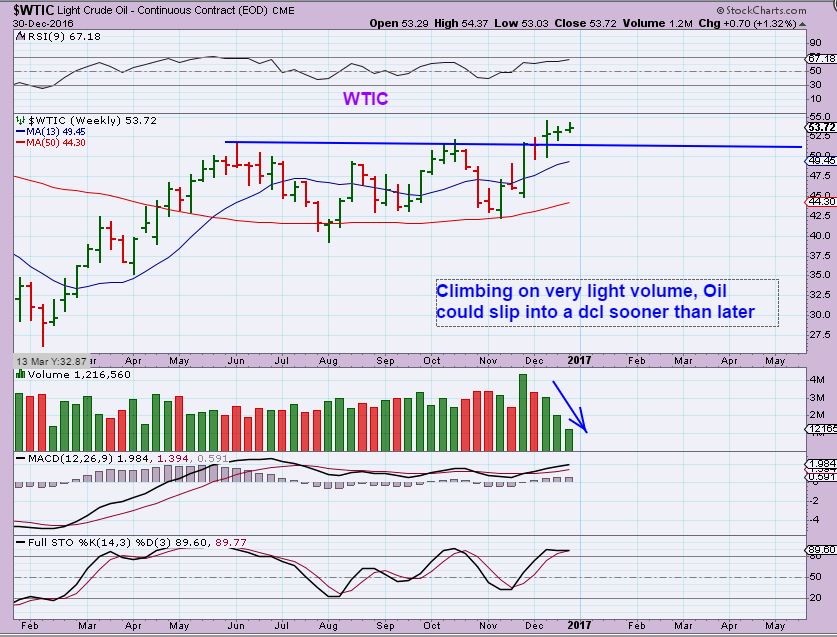
WTIC – Oil is still above the recent break out, but it has not seen any follow through. Timing is moving along and I would expect Oil to start a decline into a dcl anytime in the near future. Volume has died down quite a bit, so Oil is becoming rather lack luster to me now. Basically, I am expecting a decline soon. Let’s look at the weekly chart.
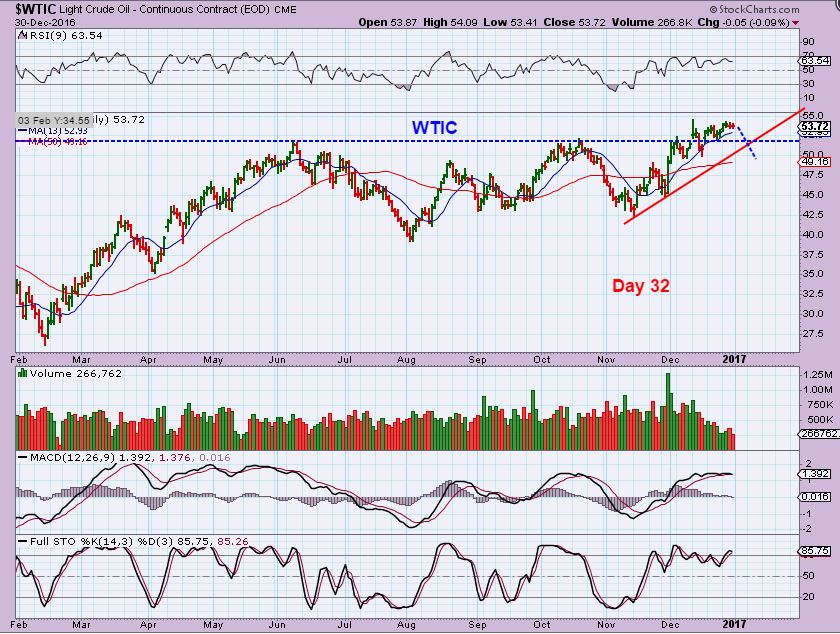
WTIC WEEKLY – We see a light volume climb.
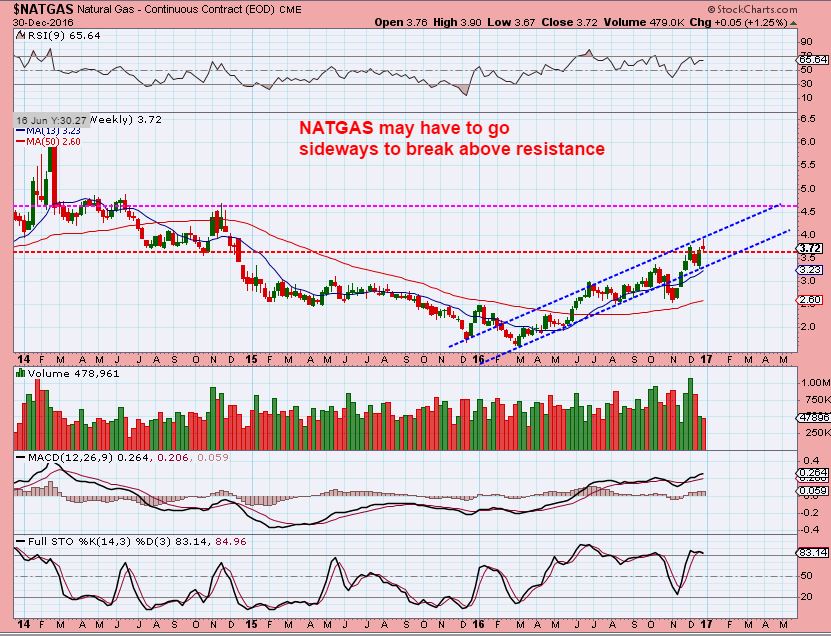
NATGAS – On Dec 23rd, I posted this chart and said that I didn’t think that NATGAS could burst higher at this point. Over all , we see a bullish uptrend, but this looked like resistance.
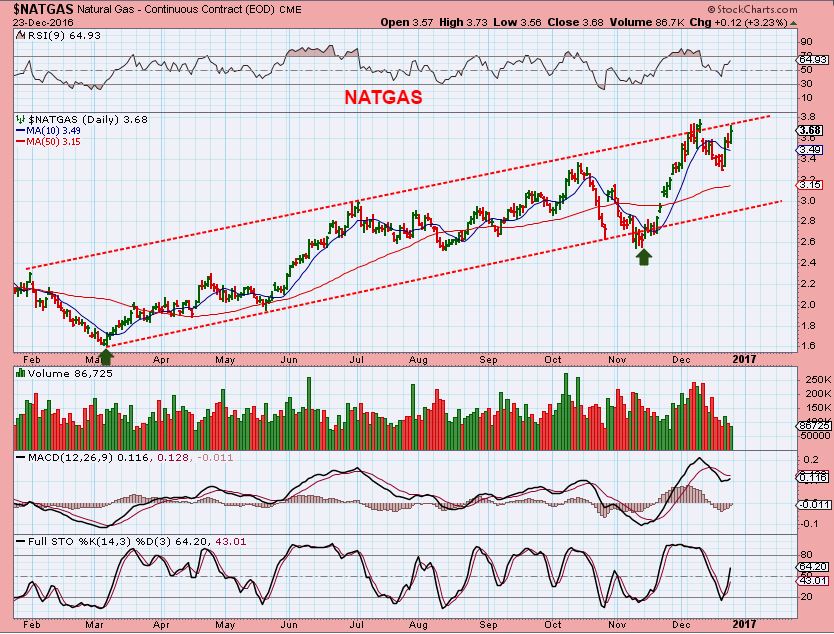
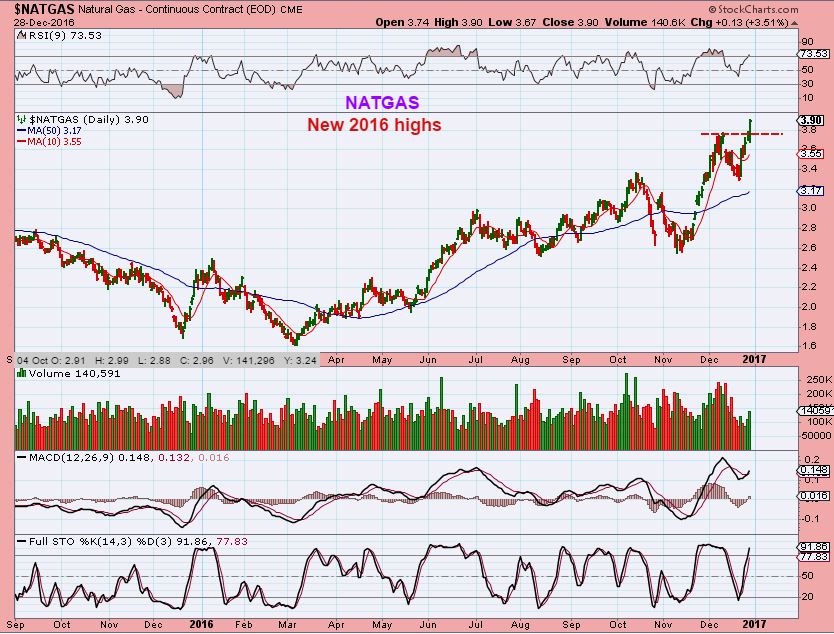
When NATGAS broke out on Dec 28th, I said with this chart that I expect a pull back now. This was ( at least temporarily) an invalid break out. I do have a longer term target of $4.75 ish
NATGAS Dec 30 = I expect a pullback, I cant tell if it will be all the way back to the 50sma or the bottom of the wedge. I’ll watch it as it plays out.
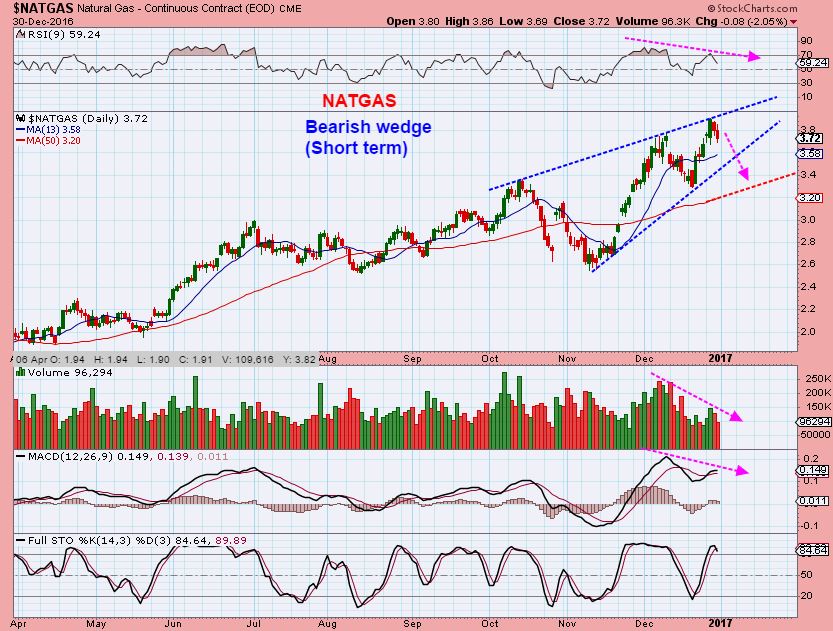
NATGAS Currently – I have a target in the area of $4.75 longer term, but the weekly candle currently looks like a topping candle.
GOLD, SILVER, & MINERS
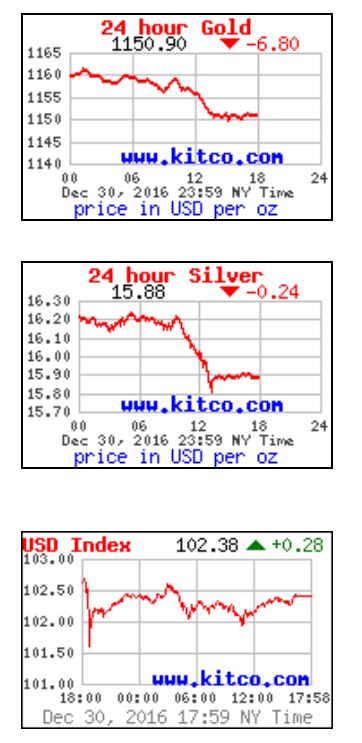
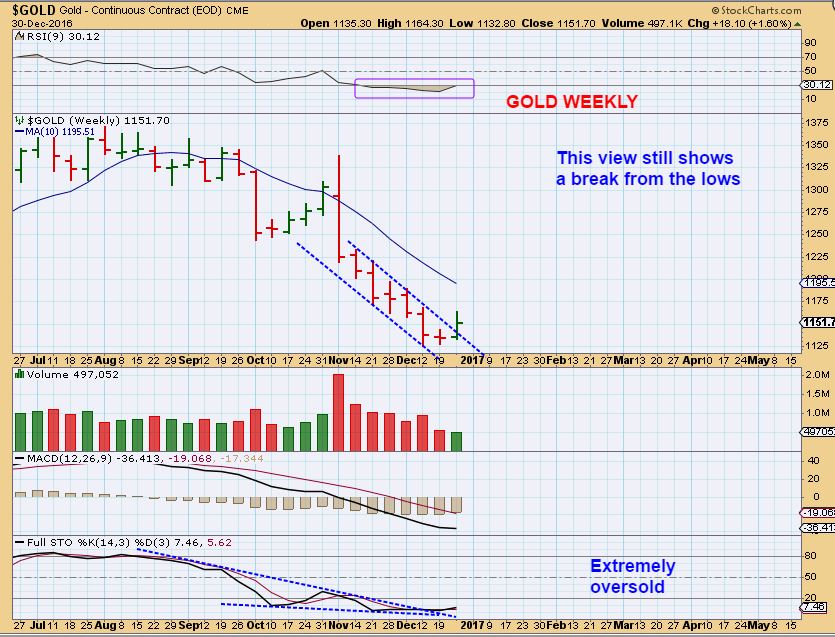
At a glance : Friday looked bearish and negative, with the precious metals reversing lower and selling off even more rapidly from before noon to the close. They closed near the lows.
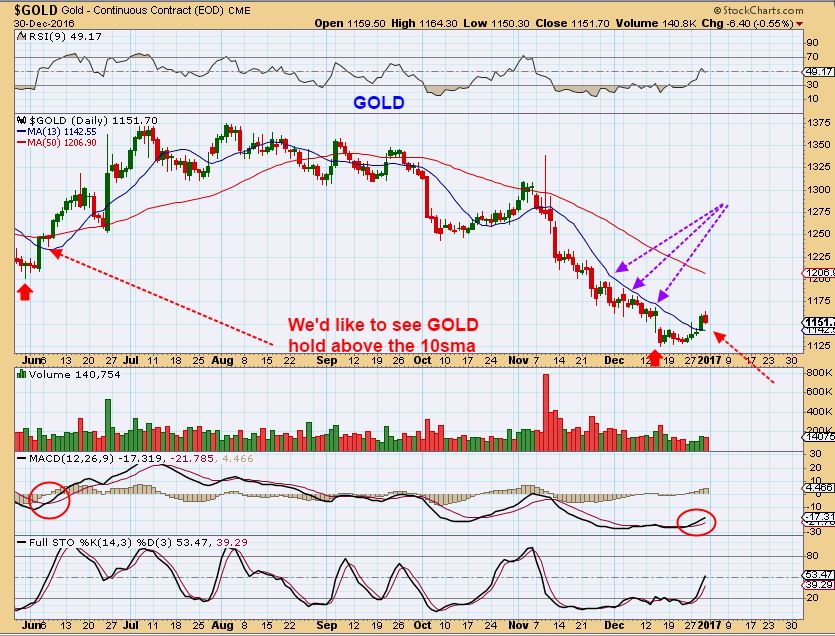
GOLD – After finally breaking above the 10sma, golds reversal Friday alarmed many traders. So far, we are still above the 10sma. I would like to see this 10sma hold, but what if it doesn’t?
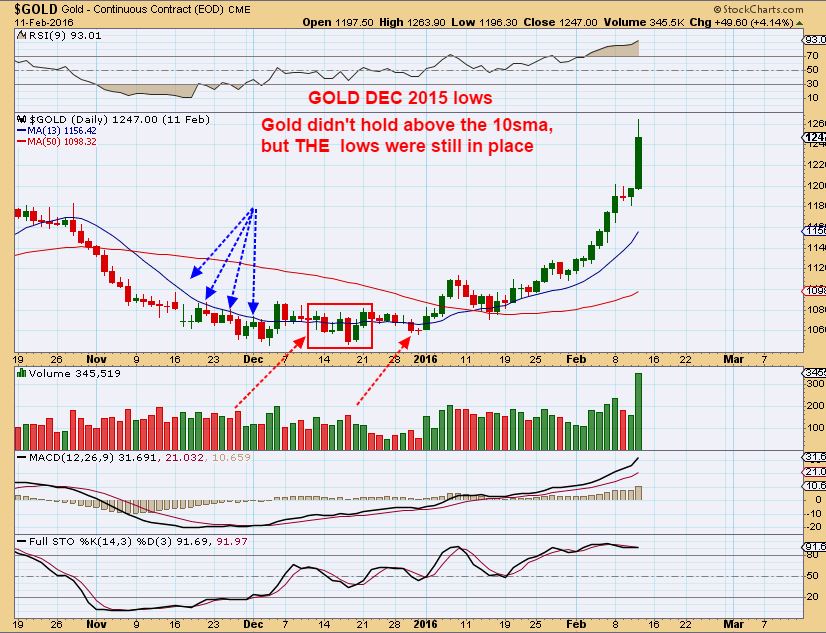
GOLD NOV-DEC 2015 – THE LOWS were in place in 2015 after Gold finally broke above the 10sma. It did drop and close below it again, so it is not the end of the world ( or the end of the lows) if we break back under the 10sma, but it gets concerning and annoying. Then we would need the lows to act as our stop for Gold.
GOLD WEEKLY – Still showing a break out.
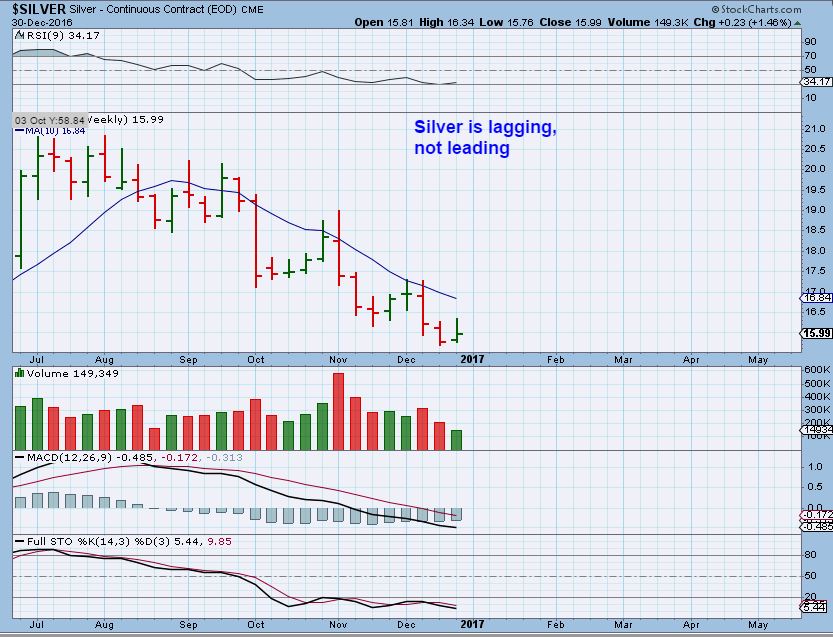
SILVER WEEKLY – Not as impressive as Gold was.
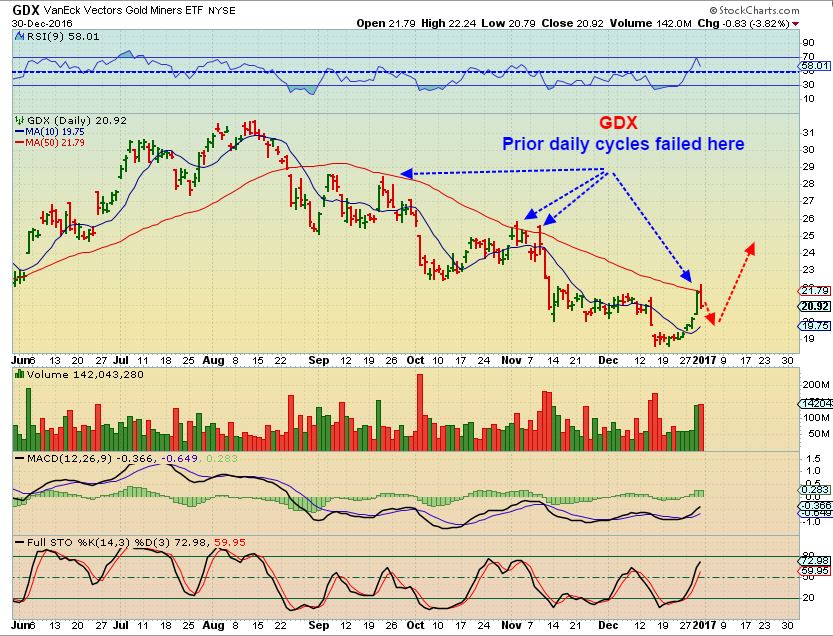
GDX DAILY – This 50sma is where prior daily cycles failed. This looks different this time, so I am not concerned about the rejection at the 50sma at this time, as though it were a repeat of what we saw in Sept, Oct, and Nov.
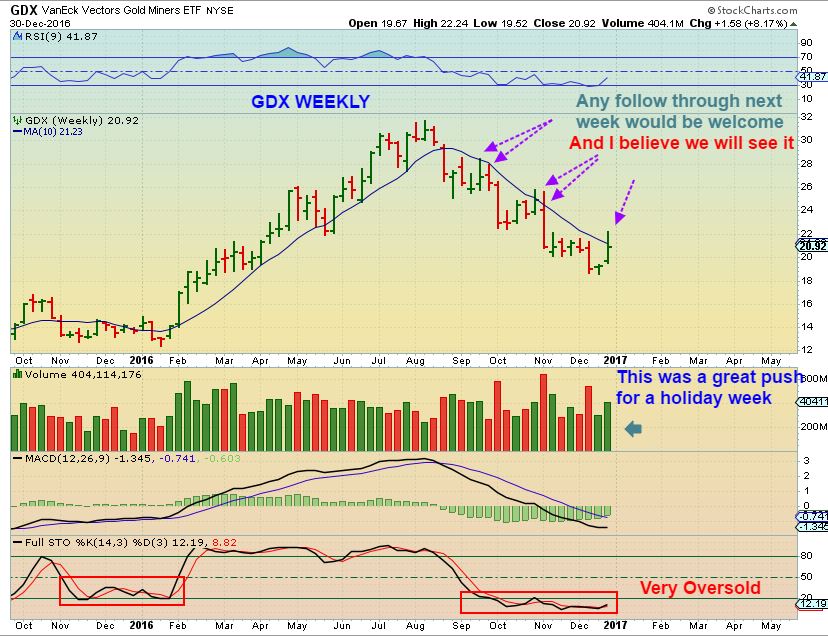
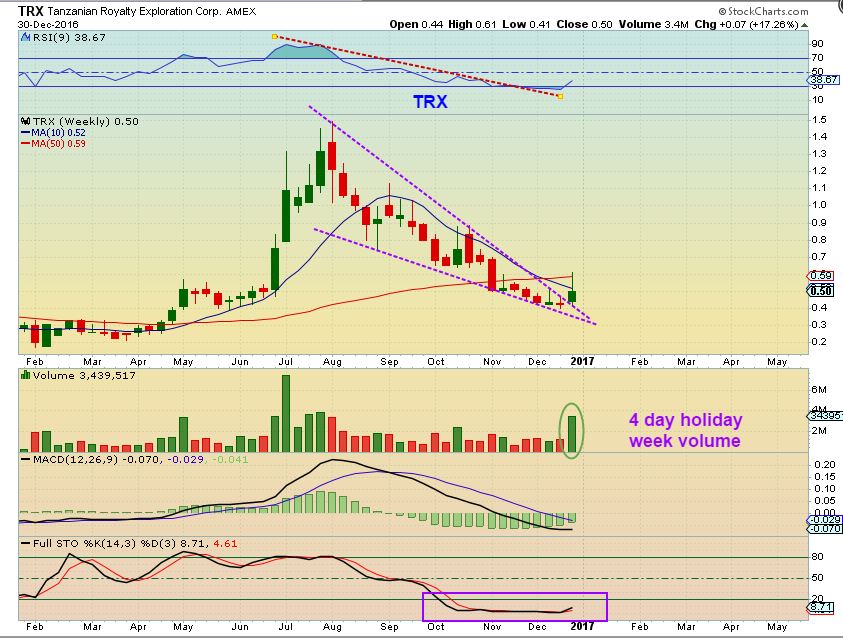
GDX WEEKLY – The volume for 4 days on a holiday week of trading was actually very good.
TRX – I looked over individual charts of a few different Miners. Even though they all sold off on Friday, many Weekly charts still have a bullish look (SO FAR) to me.
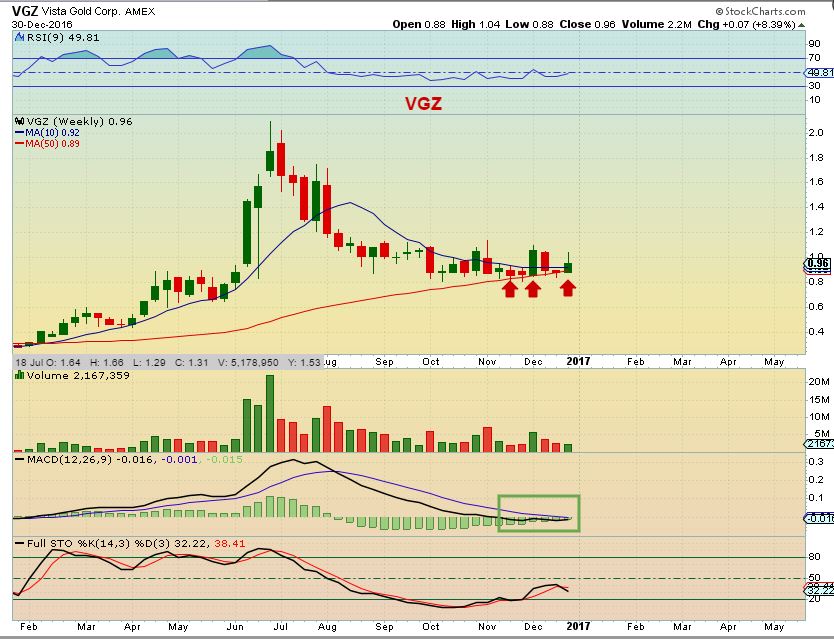
VGX WEEKLY – Gravestone doji holding above the 50 ma.
At this point in time, we had a bullish looking bottom in Precious Metals during the holiday trading weeks, and a break above the 10sma in Gold & Miners. This all sold off on Friday, so now we need to see some follow through upside this week, yet be aware of the downside risk.
REVIEW A FEW TRADE SET UPS
I wanted to review a few of the recent trades discussed here.
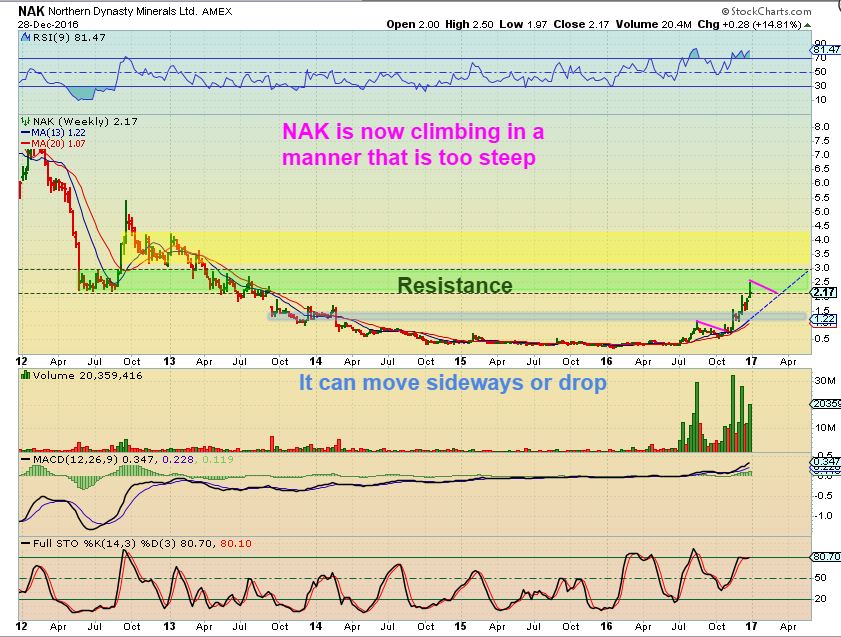
NAK #1 – NAK isn’t really climbing in an overly steep manner in the big picture, but it can be a bit unsustainable with resistance in this area. On the daily chart, we’ve repeatedly seen NAK climb and drop, climb and drop, and that keeps the climb healthy. It is now at a resistance area , as shown.
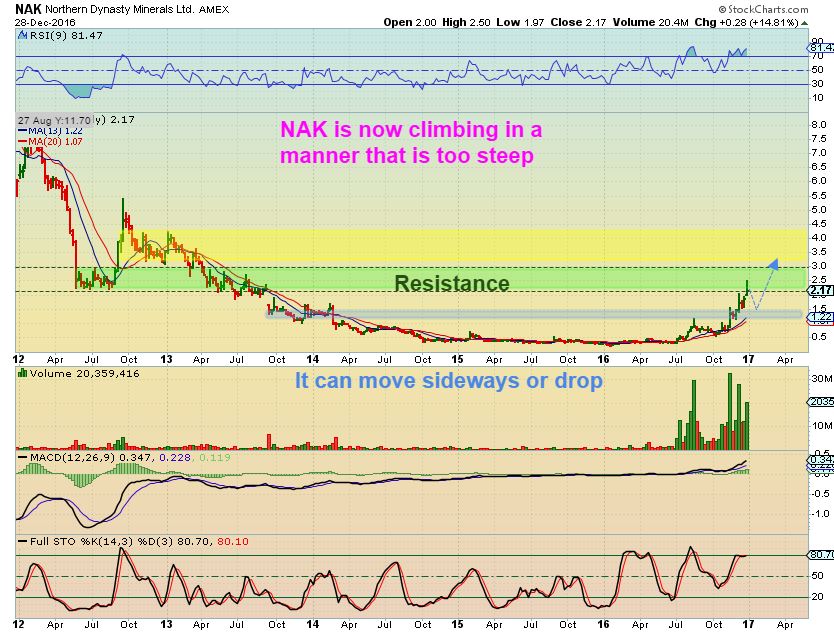
NAK #2 – I can picture NAK eventually putting in a small consolidation, similar to what we saw in July. That time May be now, and I drew what we might see in the coming days. I have been selling a portion on the rise, and buying back on the dips. I’m patiently waiting to see where the next buying opportunity is.
I want to discuss the idea that I presented last week with CLF.
On this CLF Chart – I mentioned that we had a break out above the blue down trend line with a reversal candle. I thought that if we didn’t get immediate upside, we could expect a possible roll down the blue trend line toward the 50sma as shown.
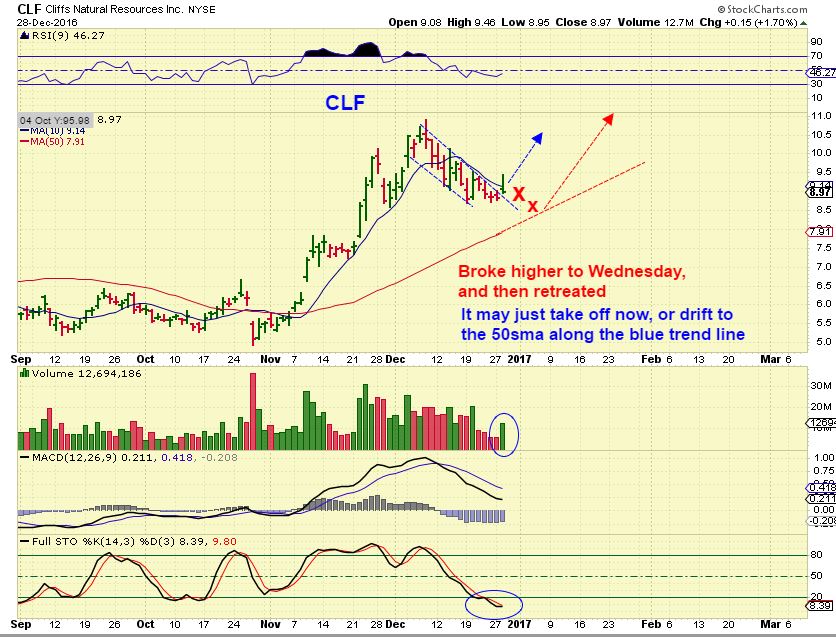
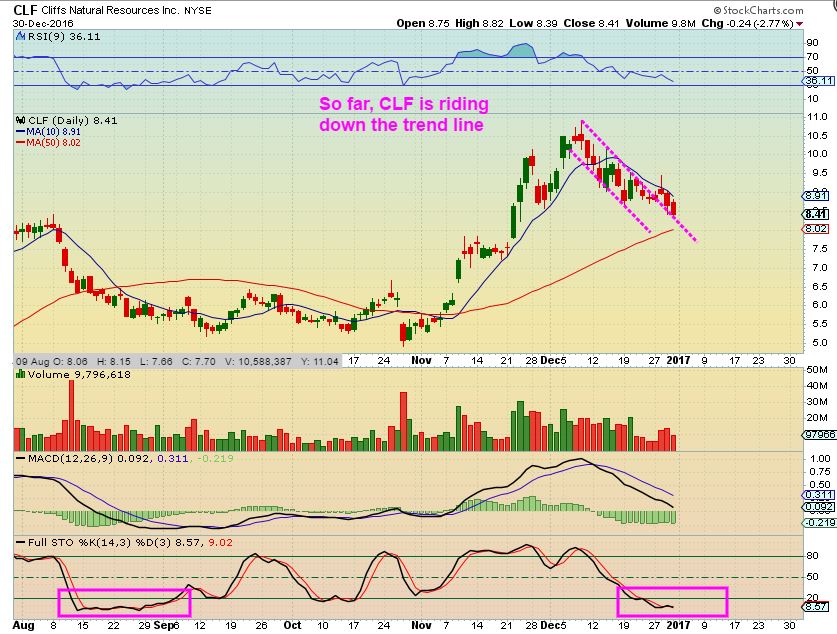
CLF – We are seeing exactly that happening now. It is closing in on that 50sma, and is oversold, so I took another look before buying to see if things are still acting as I expected. You can see that it does have a bit more to go to tag the 50sma.
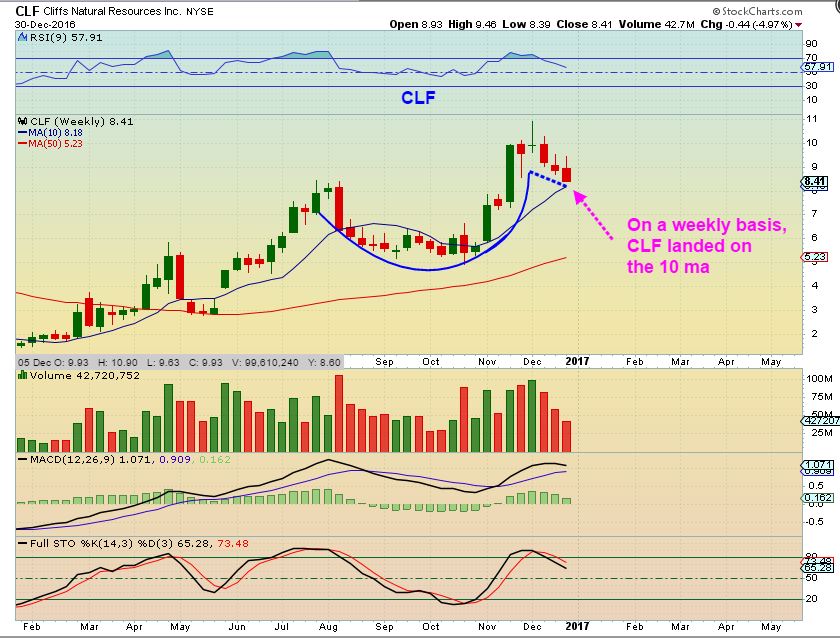
CLF WEEKLY – On a weekly basis, CLF acted as expected, and is right above the 10 weekly MA. That is usually a good place to buy too. This may become a place to start a small position if one wanted to get into CLF, and add on further dip to the 50sma on a daily chart.
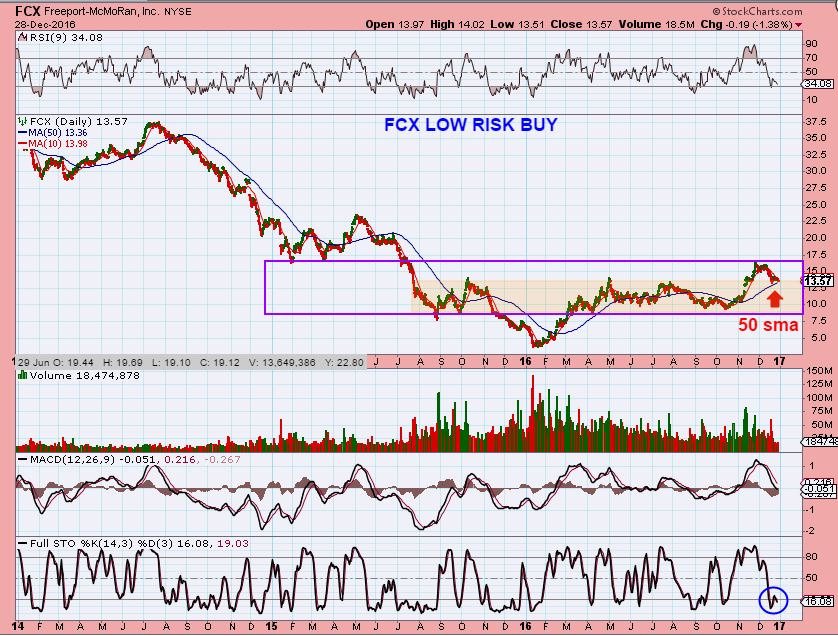
FCX WEEKLY FROM DEC 16th – It was closing in on support and the 10 ma after breaking out. We would watch the pull back further, the 10ma was at $13.
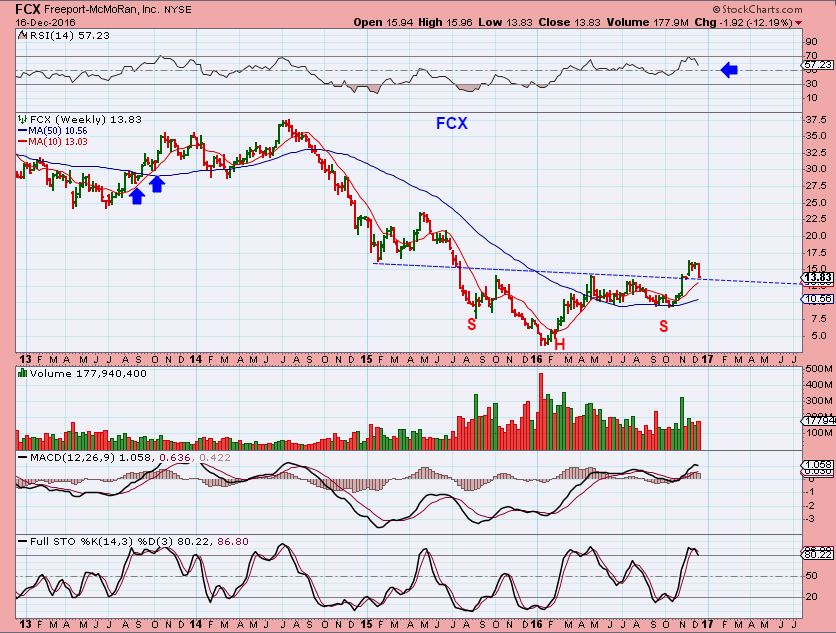
FCX – This looked like a low risk buy for a small starter position, because FCX was near the 50sma at $13.36.
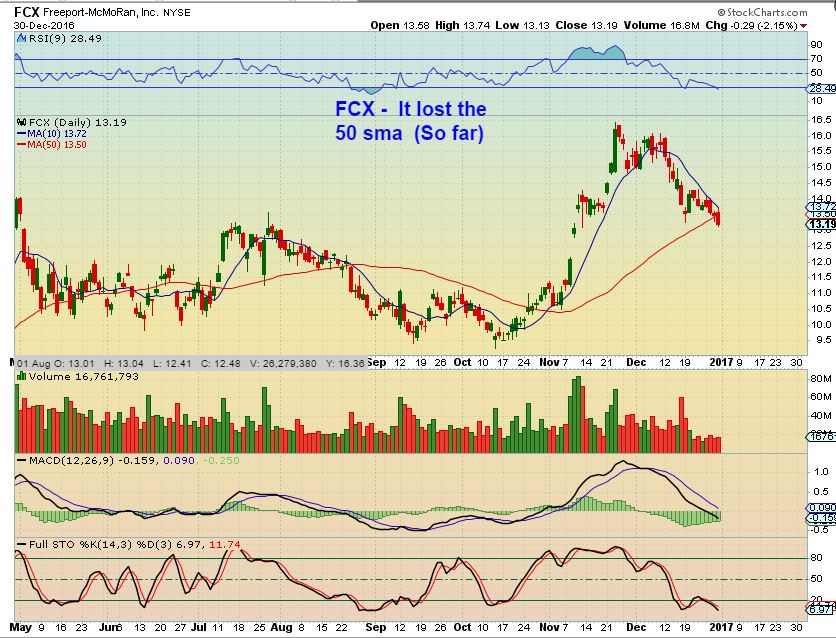
THEN FCX broke the 50sma. Is this a broken chart or is it a shake out, I wondered? Notice how it is acting at the 10sma too, being held down. One could wait and buy a break above the 10sma, but I noticed something when I panned back for a bigger view.
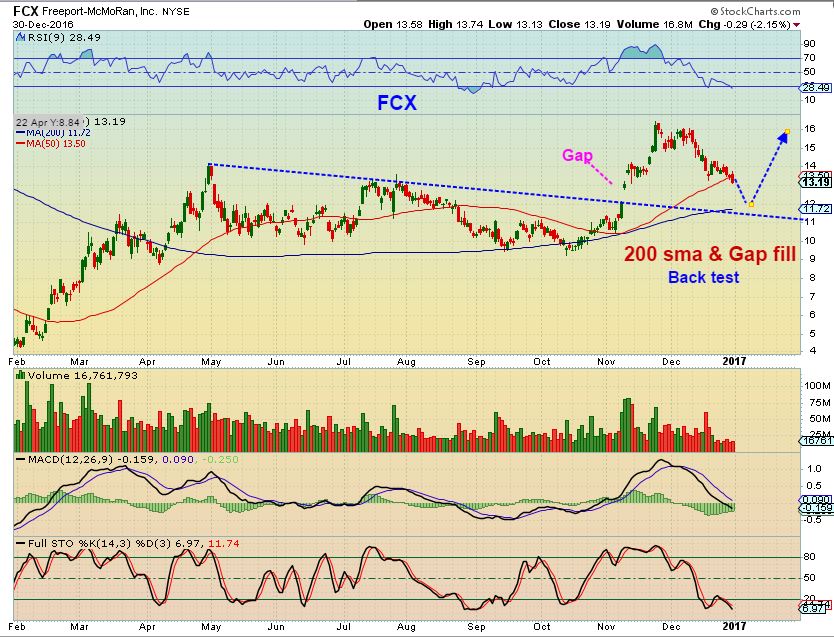
FCX – I see another possibility. Notive how the 200sma is lining up with an open gap. Being aware of this set up (a possible Gap fill at the 200sma possibility) may have one adjusting their trade. Sell and buy lower if you bought at the 50sma? Wait for a break back above the 10sma, wherever that may be? If you had a small starter position, should you ride it down and add at the 200sma? That might break a personal trading rule ( The rule might be not to ‘double down’ on a position in the red). SO with this info, a trade can be taken here, or wait for a drop, or a cross above the 10sma. Let’s look at the weekly chart too.
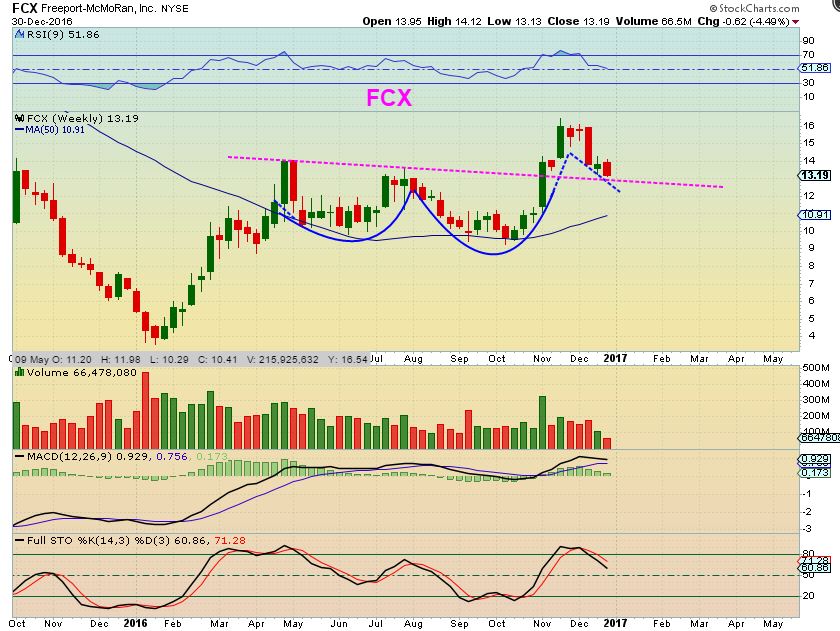
FCX WKLY – The dip actually looks like it could be complete on this weekly chart. I have a feeling that next week should help us to see what FCX wants to do. If the markets sell off, I want to see if Metals stocks resist or get caught up in the selling too.
With the General markets dipping down here, it is possible that Oil & Energy , maybe also CLF, FCX, X, AKS, WRN, and other Metals trades could be dragged a bit lower. That is why I wanted to add these charts to the report now. It is good to be aware that if the general markets are going to dip down further, they could cause other set ups to drop a bit, or just go sideways for a while, consolidating recent moves higher.
The markets are closed Monday in the U.S. , so enjoy the rest of your time off, and Tuesday we’ll see how 2017 starts us off. 🙂
~ALEX
.
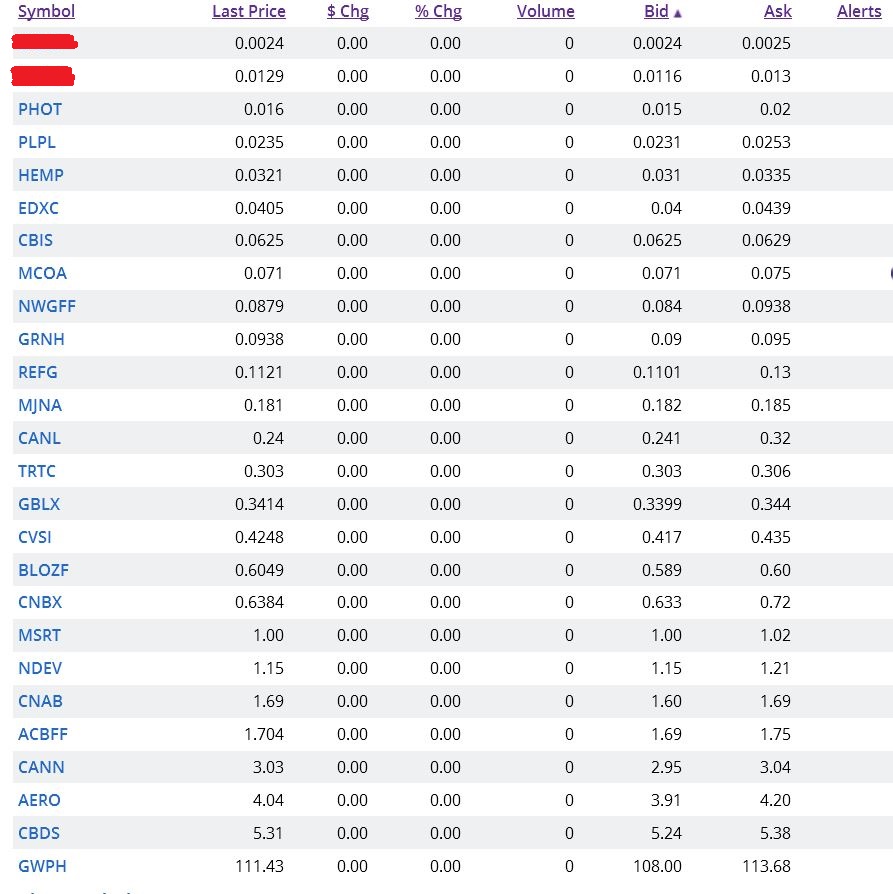
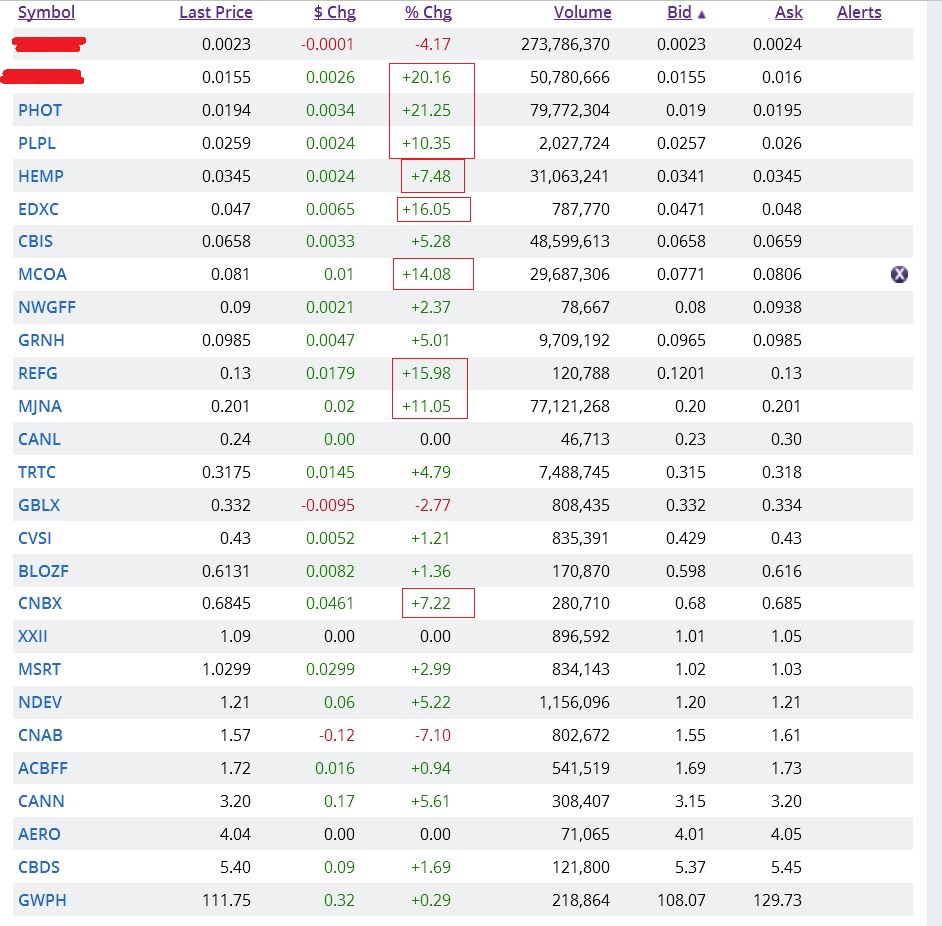
I had a bonus report Friday, showing a list of Marijuana stocks and I repeatedly mentioned that these move a great deal %-Wise daily, so they may not be for the faint of heart or inexperienced. Maybe just plain ole not for someone who cannot be in front of the screen all day. I did mention that possibly taking a small position and letting it ride could pay off in the long run, if this becomes the next healthy bull market with recent legalization voting. So Lets take a look at what happened on Friday alone…big moves?
Heat Map Update – I posted this at the start of Friday.


Great report Alex, thanks. Let us know when you buy a marijuana stock for that long term potentila you are talking, a nickel to
over a buck. With a small size I would like to hop on it too and just watch it over 2017 to get a feel. I don’t mind cheap stocks like int he $2 price range, but very rarely trade things priced at a dime or below!
I hope you are right and we get soem follow through on miners on that weekly chart, but if not I will look to add on weakness when the daily charts are oversold again. If GDX heads lower first, it shouldn’t take more than a couple days before I can buy some more.
For the medical marijuana stocks, some companies just provide research, others tools, others produce grow farms and sell the product. It does take due diligence to understand what you are investing in.
If you look at that list above, some companies are over $1. so you could check out some charts.
As for buying companies under $1.00, I know that many traders wont, and I understand some of that. OTCBB are more risky, it is hard to know what you are getting in to, but some Miners that traded under $1 trade on the AMEX, like NAK, TRX, GPL etc. That is totally different in my point of view.
My biggest %- gainers last year for putting money in my pockets were NAK, GPL, TRX, VGZ, MUX,
They started under $1 and doubled, tripled, quadrupled.
Hi Ralph, having a look at this sector since Alex suggested it on Fri last and I don’t have access to OTC where I live so concentrating on fully listed companies. A few of the more established companies I have come across are INSYS (Ticker: INSY seems to be making a nice base) has 2 approved products on the market; CGC.TO (TWMJF on OTC) is described by SeelingAlpha as the next best thing to an ETF in that their 2 big Brands deal in many different parts of this market; GWPH is a UK company that moved to Nasdaq and has FDA approval for its product to control Epilepsy in children.
Thanks
Good morning Alex, These weed stocks definitely have a different personality. What would you consider the bottom when you look at average daily volume to qualify it as a possible trade candidate on one of these yo-you stocks?
I don’t look at them that way, I’m not using average daily volume to qualify anything.
What I see are some huge bases on a 1 yr chart. The initial surge was huge in Oct leading up to the elections.
Now we have a pull back and start of consolidation of those gains, and they form new bases. They also
move back to weekly support and hopefully hold up.Then they may start to break out.
As shown in that report, some are starting to break from the consolidation bases and test those Oct highs, so I am watching consolidations and moving averages, etc . I pointed out how some have done this already in NDEV, CBIS, and others look set up. This report was labelled a bonus report for 2 reasons. One part is that it could be helpful for experienced traders that might know how to trade a consolidation or scalp some quick gains, I was pointing out those set ups forming. Also the report could help longer term traders who MIGHT want to do research, they may find some companies with promising growth potential. Longer term investors often do not like to buy OTCBB stocks , and most of theese are, but they can track them, they may become listed some day. now that things are becoming legalized.
Fair enough Alex,thanks. I just know that on most stocks you won’t trade them if they have poor intrest via volume. I wondered if that still held with these lot of tickets
Right,
I RARELY trade stocks with average volume under 250,000, as a personal rule.
At times, increased interest or news on a stock like that can see the volume increase and stay increased, so that would be a change in character that might have me trading a stock now that I wouldnt trade last year.
Hey Alex,
You’ve got mail!
TIA
Thanks Alex!
Alex, I am curious how you manage your portfolio in regards to position sizing. Do you get 100% invested with all funds in your account when bullish, or never invest more than a certain percentage in any one group, etc? Also, what percentage of your portfolio are you invested when you feel like you do right now about the miners, think they are going up but also have some warning signs to keep an eye on?
Thanks in advance.
Great question……
EDIT: My answer below is a bit long and rambling. Forgive me in advance 🙂
Short answer, there is no absolute answer for this. I am a trader / investor and my position size can change daily…or not. It depends on timing and what I see too. If I am 100% invested and I see a much better set up in XXXX at its lows , I will sell my weaker looking set up in YYYY after it already gained 30% and enter XXXX, because I think it has better potential. I rotate my crop frequently in bullsih market set ups. ON the same line of thought, If I own a stock that has gone up 40%, and I’m looking at another that is ALMOST “ready to run higher’ , I may sell one that ran 40% now, and hold that cash until the one setting up looks ready. I sell the one that ran up, because it may be ready to consolidate. So now I’m not 100% invested anymore, I’ holding cash waiting for the set up to complete ( maybe like CLF and FCX in this report. I might sell some NAK and wait for CLF as an example. NAK ran well, now maybe I’ll rotate to CLF later. I may ride CLF for a week or two, sell it, and then go back into NAK, which has now pulled back. That is an active trader. That is my account, I cant really teach that. It is based on timing, market conditions, etc – and Trades can happen quickly, daily or weekly , over time, or even just ‘on the fly’.
This is the hardest question for me to answer, because I am a trader, maybe only buying and selling for profit in days, but also longer term using cycles ( I have answered this question a few times in the past, but many here may be newer readers, so I dont mind answering again). I am partly a trader based on technical analyses, and also partly using cycles for timing, plus experience trading / investing plays a huge part. This affects my trading, since I see opportunity live , and real time.
In the past I have discussed this, but it is mostly based on someones confidence in the trade set up and maybe ones appetite for risk?
At an ICL, I often go in very heavy, eventually I may be over 100% using leverage, especially in a bull market, because Bull markets always correct to the upside eventually. I make most of my yearly wage at ICLs . If we get an ICL every 6 months , for example, there are 2 really important trades that year, and it is worth waiting for an ICL and going heavy. Even if I get stopped out and have to try again at a lower low, once the ICL is in place ( Even in bear markets) you can get 2 very strong daily cycles higher. If it is a bull market, you can get moves higher like we saw last January to April in Miners, and May to JULY. A series of Higher lows and higher highs.
I have always said that I go in very heavy at an ICL, (lows), and I often lighten up as we move higher ( I make sure to lock in some gains ). If that apparent ICL acts suspiciously , I may lighten up until we get clarity, but even recently The stocks that I bought were not breaking the OCT lows, so my miners positions were not all affected.
So I am heavier and constantly adding at the lows for a week or so, I try to buy the dips, sell the rips. It is also very dependent on experience.
Currently, I am almost 100%, but I own WRN, NAK, and a few others that are not Mining. I also own GPL, DRD, VGZ, TRX, etc —-That is because I am trading positions and investing for a possible ICL to be in place.
I hope that helps, probably as clear as mud? lol
Freakn awesome. Tx chartfreak……. https://uploads.disquscdn.com/images/0f3fc9a31562d4526911b4d58905e3e5ae62eff0fc4cd908a506f0e249cd1a66.jpg
Thanks for taking the time, Alex. It sounds like you are often 100% invested, unless taking some profits on something. Otherwise, you sales are only to free up cash to put to work in another, more attractive setup at that moment.
Thanks for these suggestions.
I could not copy over a long term silver – log scale chart. The good news it shows silver
crawling along the bottom graph line of the bullish wedge to run back up again.
I think Alex would have to test the quality of the weed to decide which stock is the best!
I’m currently sampling LAGAVULIN 16 yr with my dad . That’s about the extent of it. : )
Great way to start the year. Enjoy!
I would ask what that is, but its probably best that I don’t know. (just kidding!)
LOL – Scotch, but it’s a rugged scotch. I tend to like the peaty mossy scotch
Nice!! By far my favourite! Good taste.
I’d say that it has become mine too.
A friend started me on Laphroiag over ice, then I tried ARDBEG, and that became my favorite. And now Lagavulin is my favorite too, but I’d have to warn anyone that has not tried any of the above as a scotch…
Try it before you buy the bottle : )
Alex, Would you please elaborate why you are not concerned about the GDX rejection at the 50 sma?
It doesn’t look the same this time, there are differences that I will be watching going forward.
Even in the past, when a bull run gets to the 50sma or 200sma, it often crawls along it before the real break out,
so we have to see how things go as we move forward time wise.
For example, go back to the daily chart. See any difference in the relative strength? RSI.
Thanks Alex.
Hello Everyone and Happy New Year. First time posting; been a member for several months now and have made some really nice profits this year (and I hope you all have).
I use a blend of TA (as presented by Alex), and contrarian ideas I’ve picked up elsewhere and via trial and error. Not an ‘expert’ by any means, unless we subscribe to one definition of ‘expert’ – “one that has made ALL the mistakes”! In such case, I may very well be one!
Happy trading/investing in 2017!!!
andy
Hello Andy! Welcome!
thank you Johnny!
Welcome! Happy New Year! I am hoping to do even better with Alex this year then last. I started in Feb. Even with 3 positions going bankrupt [ouch, big losses]…I STILL came out way up!
Hey- I think I caught in an Energy company going BK too, but it “Only” got cut by 40% – lol.
The key to recovery is probably small position size on the risky ones, and then let go and get into a several Miners or other stocks ( Like NAK, WRN, TRX, etc) that would double or triple .
We did have a few rapid drops in some of the smaller energy stocks, but the other stellar trades in CLF, VALE, X, TRX, THM, NAK, and other winners helped a lot.
We don’t give up, just live and learn 🙂
thanks Nancy!
Hey Andy, welcome to the comments and nice to hear your feedback. Really glad that you are able to use the reports and your own trading ideas to gather some gains 🙂
By the way – I too am an ‘expert’ that has tried everything, and “made all of the mistakes” – definitely trial and error over the years, plenty of losses and wound licking to figure it out.
Its hard to know how something tastes if you dont taste it for yourself, right? Bitter and sweet .
Keep up the good work
.. Wait.. R we talkn about trading irrrr brownies again? 😉
Oh, the bitter sweet comment? funny – haha
Glad to be here. I aim for 80/20 ratio (win/loss), whilst making ‘large’ wins and ‘smallish’ losses at the same time, if that’s possible. I joke about my ‘worst’ trade of 2016 being Williams Clayton Energy: bought at $23, sold at $55…and then watched climb relentlessly to $115!! Just a different sort of ‘mistake’, as I left big $$’s on the table.
Other than that, I prefer ‘couch-potato’ investing: once I’ve bought (low), just sit back until it’s time to sell (high), and avoid those common (amateurish) emotional mistakes.
THAT is the key, let some winners continue to gain and cut losses as short as reasonably possible.
For example: You could have 6 trades ( 4 losers and 2 winner) , and still done very well. You’d allow yourself to get stopped out of 4 of the losers at 5% losses, and then have the other 2 trades be NAK and CWEI and those 4 losses just fade away completely.
Of course, the CWEI & NAK trades were the rare gems, but we did grab some huge %- Gains in TRX, MUX, VGZ, GPL, CLF, VALE, X, NAK, etc here , and as long as one doesn’t ride the losses down too much or get overly heavy in leverage, the end result is healthy .
Congrats on the trades, and I’m really looking forward to 2017 – I’m hoping that we get similar set ups as last year. What a traders paradise.
Doing a little research on a couple of the marijuana stocks – a short review of CBIS …certainly not comprehensive…from what I’ve read……they are hoping to provide premium strains for medical purposes, 2017 to have new product releases, larger distribution channels, 2017 hoping to grow/expand, possibility of working with Harvard Medical School (hoping to move from research to FDA approval quicker on some products), have started work on a 2nd large drug development and manufacturing facility in Nevada (including greenhouses for growing, extracting, etc.) – they are mapping out areas for full operations -grow, lab extraction, manufacturing, and dispensaries – they have total of over 3500 acres in California and Nevada – Financials: as with most of these – awful debt, current/quick ratios not good……as always do your own due diligence………:)
Tammie, thanks for sharing what you found. CBIS doesn’t look bad.
I looked into HEMP and will avoid that…legal issues. Just google the name Bruce Perlowin….Forbes said this: Jun 21, 2016 – Federal securities regulators have filed a complaint against Bruce Perlowin that charges the CEO of publicly-traded Hemp Inc of committing a long-running fraud by evading securities registration provisions and selling hundreds of millions of unregistered shares.
GRNH deals with greenhouse, tables and materials for growing plants….not the product itself.
EDXC seems to have several companies…I did not even find mention of the dog treat aspect Alex mentioned, but one of their companies is Mad Hatter Tea Company! They do have some news of hemp derived products being in a clinical study. They seem to be a group for entrepreneurs. I’m not sure about the structure of this.
MCOA has products but it seemed like it was setting up to be a club structure …maybe multi-level type.You join, get referrals. I decided I would avoid this one.
ALL THIS WAS VERY PRELIMINARY. Please everyone…check these out for yourself.
Thanks for the info! I’ve been holding HEMP – it’s the one of my 3 that are in the red just a tiny bit….I’ll take a look at it but if shenanigans are going on….I’ll dump it. 🙂 There are other good ones to look at for future potential…
Thank you Tammie and Nancy ! Very informitive…..
Hey Nancy – here is a link to an article on EDXC and the chews for dogs..
http://www.marketwatch.com/story/endexx-increases-production-of-phyto-bites-cbd-infused-soft-chews-for-dogs-2016-10-18
Hi Tammy
I added LXRP to my list – they have a patented technology for infusing into foods. I’m not done researching the company yet, just thought I’d mention it, since it was not on the list that I had in the report.
Thanks! I added it to my list to take a look at – surprisingly enough it’s my couple of marijuana stocks that are holding up better than some of the gold I got last week 🙂 I’m sure the gold ones will catch up and outrun them ….
I know what you mean.
I bought the EDXC stock after reading that they had their patented dog chew treats for anxiety and joint pain in dogs with hip displacement, etc and it has been higher every day.
That one is still on my maybe list. Alex, in researching, I came across a chart with an opinion that pointed out new 52 week highs in MJ stocks [ I think it was over 400 stocks] were mostly around elections, both before and after, and early January…and suggested a good time to buy is late January, February. Have you observed that or found that to be true?
No, I have not, did you? Did you check the charts? Many charts that I look at do not show February as a good time to buy,
(MJNA did drop pretty fast today, not sure why – I do not own it). .
This article is promising, but I take it with a grain of salt. They are seeing revenue double, they have sold out of product quickly, increased orders are coming in, BUT they do not say what their numbers are ( in other words, they could be losing money , even with revenues doubling). I like the product and the chart was promising on a daily and 3 yr weekly basis, however.
http://www.marketwatch.com/story/endexx-delivers-best-quarter-ever-with-acceleration-of-sales-2016-10-12?siteid=bigcharts&dist=bigcharts
Alex, I was commenting generally on MJ stocks about that chart I came across, not particularly EDXC….the person posted the chart as a compilation of 52 week highs on over 400 MJ sector stocks and when they occurred. I am just looking to see if there are seasonal high/lows in MJ stocks to decide when to buy. I have never examined this sector before. I tried to copy/paste the chart here but it would not work.
I knew what you were saying, that is why I asked if you checked the charts? I said, “MANY CHARTS THAT I LOOK AT DO NOT SHOW…..”
Then I included the article on EDXC, because you did comment on that one as one that you might be considering.
ok… just thought I had been confusing in what I had said.
Man, nat gas fell out of bed as soon as Globex went live tonight. I didn’t think it would try to head down to that 50-day so quickly, but has made half the move already. Glad I moved to hedge last week. Gas is following cycles beautifully right now. If we can ID the next low, wave 3 of 3 is on deck after!
I looked at gold tonight and it hit 1158.80 before pulling back. Hope it goes up tomorrow!
Alright! Maybe my move to buy back JNUG at Fri close wasn’t so bone-headed!
Need to get over 1161, then think we can run the 1178-1181 this week. Pretty heavy resistance there from earlier price memory. A dip tomorrow morning would be a buying opportunity, imo.
Dollar up, gold down (slightly) and oil/$spx off to the races. 2017 should be another interesting year…maybe time for me to switch horses and join the crowd. Seem to always be picking the laggard. 🙁
A lot of us on the same horse with you! Starting to look up, though!
Cason, where’s your target on this nat gas pullback?
Originally, $3.25- $3.40. Today was NUTS. I don’t want think see a close below $3.20 or I’ll have to go re-count my waves. Sorry, just leaving work now. I’ll post my trades at the top and a chart later, if I have time.
Alex, any thoughts on the huge currency swings overnight last few trading days/overnights? Swings over 1% of established currency pairs without major news is NOT normal. Maybe just thin trading due to holiday is causing outsized moves relative to normal? Japan closed Tues so that will affect USD/Yen.
Uranium (URA)
Breaking out of the triangle…….
HNY 🙂
Happy New Year Maria….
HNY = Nat. gas on the TO exchange ? What did I miss ?
idk … not playing it or following … but… did that just finish 2 of 3…. ie. big kahuna in play now?
Oh ….. lol …. I thought HNY was a Uranium stock you were pointing out. 🙂
*giggle … HappyNewYear ;o)
;o)
Possible wave 5 of 1 ?
It needs to break 13.37 though which is the top of 3……
lol who’s on 1st?
*i meant Natty…. LOL
LOL… Well we are certainly communicating well to start out the new year….. 😉
my bad ;o) welcome to the dark hole that is mariasMind ;o)
I have literally 10 tabs up…. and im *working .. and flipping back&forth btwn them & SPEEDreading …
#DangerDangerWillRobinson
I have been there….. lol
**how I managed to have a profitable 2016 is beyond me ;o) tehee
the Gods are w/ me ;o)
well .. and my #CFWeatherStick ;o)
https://uploads.disquscdn.com/images/aea1b60e9036f810ba4de5e1f7e196d50d39944cc565eb61e81e6389d58916a7.jpg
oooooh my .. that looks kinda bad doesnt it? LOL
here … this one is better
https://uploads.disquscdn.com/images/f0b44f8a5c2d436038494cf576d4c073e8b201e9f517226c1e63326fbf2ca126.gif
Hi All … HAPPY NEW YEAR!!! Go 2017 🙂
Many happy returns Maria. Looking forward to more of your comments and humour. Still see the image of the little men in your head heading for the exits from last year. We should have a comment of the year award!
😀 ha ha ha…. yeah, sometimes as i sit silently typing i do laugh at my own jokes.. ha!
that was a pretty good one…….. glad u appreciate my warped sense of humor….. Cheers!
USD Strong.
TLT Lower.
Metals Stronger than expected…..hmmm ???
This is all very weird. Who understands what is happening? TLT is barely down. Golds up.
MUX cranking again, that thing really moves.
Yeh, I own some. But look at that nasty bearish engulfing on Friday. We need to crawl back above that to make me feel good again. 🙂
FCX strong this morning…..
Wave 2 correction possibly complete with 5 waves down and almost a 50% Fib retrace……
FCX has a nice looking chart as well http://stockcharts.com/h-sc/ui?s=FCX&p=D&yr=0&mn=9&dy=0&id=p41291222021
It was in this report too.
I got a daily buy on FCX, so bot.
Anyone that might be holding MJNA….there was just a negative article on it and sent it down 14%….I sold mine for still small profit…figured get out while I could….maybe it will turn around but the article didn’t paint a positive picture….
I’m really bummed…my MJNA was doing well…
MJNA is flat according to stockcharts ?
I show it down 30% now..? down to .14 from .20 or so….
TC2000 shows it up 3 cents.
Sorry I misread your symbol. MJNA shows -16% on TC2000.
Yea…showing now.
Me too, i own that for the long term. Really think it will do well down the road.
Thanks, Tammie.
MJNA bouncing back a bit…
Alex, would you feel comfortable projecting from TA a GDX price target for the DC top, this first Daily Cycle?
No I wouldn’t, it would be just a guess. This can go sideways under the 50sma, bounce around, break out and back test. All of the above, or none of the above….. It is not known at this point.
I knew NAK was going to do this again. This has been one of the easiest to trade , in my opinion, sell near the top and buy the dip.
It acts very well.
See that is what is wrong with my thinking….I have to learn to think like that. My thought on NAK this morning was ….geez, I’m glad I sold and don’t have that anymore!
Try this for buying. Wait until it falls below the 10 dma, then buy when it crosses above the 5 dma. Check it out on your chart. Good traders like Alex can do better of course.
Yeah, and the harder part for me is trying to be patient and wait for a pull back to complete ( not re-enter too early).
I just look at the past few pullbacks over the past several weeks/ months and they all seem very similar so far. Kind of use that as a guide, but eventually a larger correction comes in – many that run strongly & steadily higher will eventually correct a bit deeper, similar to what we’ve seen with CLF, FCX.X, after they run strongly…then you see a change in character and have to adjust the buy the dip approach.
So here we are at the 13 day sma. Are you adding or waiting to see how it holds?
Yeah, it also filled a tiny gap in that drop down to the 13 day….hm….
I’m waiting to see
So do you buy a partial here or wait until it approaches 1.5?
I wait for a reason to buy. A reversal at support, some kind of trigger. In past reports I showed many different charts pointing out when I had a reason to buy. ( See attched for 3 examples ). Today I am just watching for ideas
.
https://uploads.disquscdn.com/images/446ccfbc4cc0e0e1792053721923c3b126d5a2a4dd420a060a0ffe30d84a978d.jpg https://uploads.disquscdn.com/images/996dd820ef6191f136c9261e8cd2c17a3333c638712446951ba120dc1b38793e.jpg https://uploads.disquscdn.com/images/432c9fda4ef7949082ec26776dafcecc95c573a12d7a7ecc31451de1d6e3c286.jpg
Thanks!
It dropped enough to fill the Dec. 27 gap – would that be a signal you would look for?
Just can’t see why one of the leaders in the mining sector would be down today with most others moving higher. I see the hi/low patterns, but……..????
Alex, are you buying anything today, or adding to NAK?
I’m not adding to NAK right now. I’m looking for a reversal
I’m watching MIners, I like the reversal so far. TRX pushing back up against the 50sma
Are the repeated pullbacks on TRX at the 50dma pos or neg? I’m thinking they’re just trying to suck up all the orders at the 50dma before it takes off…of course there’s always the negative side to that story as well. 🙂
I always give added significance to the first trading day of the year and the first week. Today is very promising especially with the nice move in silver.
Silver looking Really good !
YES! I just looked at TRX…go go go!
Latest $BPGDM is good news.
https://uploads.disquscdn.com/images/70f59ed6cbcbfa5cabffb041814635e004786b46b684aeaf615142c7bb2ee817.png
Wow! JNUG is up 14%. My best four are AAU 9+%, AXU 14+%, MUX 11+%, and TRX 8+%. Sweet!
Just checked the 56 top gainers in my watch list. Not surprisingly, there are many golds/silvers. Leader is DGAZ up 32% (don’t own :-()
Quite the reversal in Crude Oil…..
USO AND UCO have huge bearish reversals.
NATGAS getting clobbered too.
I’d say gold is doing well considering the dollar up like it is….that’s encouraging..
I am a relaxed trader. Sometimes I hit it at the low or high.
I am happy to buy within 10% of the bottom and sell within 10% of the top.
I have some miners underwater yet as I bought them too early not expecting
such a horrible take down that lasted so long. Instead of losing money I will
just hold and sell when they are near a top again. The first rule in trading
is not to lose money. Time is on your side in the mining sector.
I like your style and attitude….or maybe it is just that I am in the same boat! Many of my red metals are less red today and one has even gone green. I would like how to get closer to the low buy and out closer to the top…that’s what I will work toward this year.
I know my mistake. I was sidetracked with moving between houses and a house fell
through do to putting two and two together it was going to be a scam landlord.
So, I did not pay attention to my charts and was just watching the GDX price and
my share prices. I am ok as have learned patience since 1998 metal $285 and $7.
You just go with the punches and laugh at the manipulation and “carry on”.
We will do well this year – the metals will go up – miners will go up.
Just a few high notes:
PLG 16% – looks quite good as it pushes against the 50sma
LGCY looks good despite OIL & NATGAS
TRX ,THM, OVG and a few others trying to break and hold over the 50sma
AXU up 12% – good volume as it pushes above the 50sma
NATGAS & OIL down fairly big on the day.
hey CF .. what do you know of Defiance Silver OTCMKTS:DNCVF
I like that chart….
Jordon of Daily Gold recommended it.
oh yea? recently …? well it MUST be good if he did…*giggle ;o)
It is breaking a down trend channel, so it has good signs, but the volume is just not telling me that many are interested in it. At 30cents, I could easily move that stock higher – lol
EDIT: By comparison – some of those marijuana stocks at 30 cents have 40 million in volume.
:o) thank u WeatherStick… lol (my new name) 2016 was compass … 2017-#weatherstick
Price is great the past few days, but I wouldn’t buy it.
There are many days when it doesn’t even have 30,00- 50,000 volume. At 30 cents a share, it only takes $9,000.00 to give it 30,000 volume.
If it drops you’ll get stuck trying to hit a bid price on the way down with light volume. Your order may not fill while trying to sell it.
k thx…. i was thinking maybe for a longer term hold… very small – i was thinking i might like to diversify .. ie. explorer, dvlpr, streamer…. just a thought.. (i do have those once in a while– tho they are fleeting) he he
;o)
Well, I did not renew my subscription with Jordan.
Most of these people do not trade better than I do on my own.
So giggle back. I like Alex the best. The DNCVF chart is beaten
down and the company has good potential. I own it not that
means anything!
tx Seer :o)
I wonder if Jordan gets paid by the companies he promotes also, it’s quite common and he recommends so pretty obscure names?
Trust me, Chartfreak doesn’t – lol
only on a few. you might like sspxf and icgQf also.
LGCY and PLG look good. ( I have not taken those trades though), but I think that the weekly LGCY chart is good too.
:o) thanks CFFFFFFFFFFF
https://uploads.disquscdn.com/images/70ef30743868a2a42f0aa813b6ecafce0435f9831f9cde746e8a63a8645939b7.png
Just kind of wondering how that LGCY will hold up with NATTY and OIL having the big down session.
That is the ONLY reason I havent taken the trade. Weekly LGCY is good above that 10ma though.
sc: when using leverage – lets say w/ miners…. do u prefer one over the other – ie. jnug v nugt…a taste of each perhaps? …or do u line up at the all u can eat bar and pile ur plate w/ ur favorite entree …
Funny Lady!!
Alex, what do you think of TGD? I’m holding some at slight loss….thinking it will make a come back – ?
It should if we are still in a bull market, but right now it is under the 50sma, and there are a lot of buyers that wont buy until it gets above it.
Tammie, Im back in TGD after a few months being out. Was in in the 30s back in the summer.. Back in at .29 – whats your entry? TGD is a laggard with a massive 285mil float – depending on your entry, and with Gold holding up as it is, you may be alright, but as CF mentioned, many wont re-buy until break of the 50sma (.37 on the daily right now)
personally I expect a retrace to around that .30 area before “hopefully” continuing on up
Hi BayTrader! Well, I went ahead and sold in my “trading” account at a tiny loss just to not have to ride it out…I’m still holding it in a retirement account, figure I can wait on that one – but….I got in at .34 on that one…so….might be a bit before it goes back to that…or maybe it will surprise us!
Nice. Yea its an irritating ticker. Slow moves, massive float. But I think it will be alright. Im actually new here, Im more of a momentum trader – been about 80-85% on my trades for the past few years, but the stress of fast movers really gets to me. Came here hoping to find some great long term chart set ups etc…
Welcome! Looking forward to hearing about some of your trades! I’m starting to hold things for less time since being caught in a couple of bad draw downs…..would love to be nimble and pop in and out….that way I could make money in a few minutes and then spend the rest of the day not worrying! Yeah, bit of a dreamer….:)
$IDXG was a huge one today. Ill post some quick trades tomorrow for everyone to view
Wow! You’re not kidding! Up 70% today…whew! And that’s after going up even more than that during the day it looks like…
Welcome Bay Trader,
I was just getting caught up in the comments and saw that you were looking for longer term trades, not fast movers anymore.
You want slower trades long term, momentum trades, and then you mention IDXG 🙂
Yea I do want the slower ones… Im trying to break my habit of playing the low float runners, but with as much hype as IDXG was getting, I couldnt stay away..
Lucky you…my CB is .52! I’ll hang on awhile…I hate selling at a loss and I liked their story at one time though I can’t remember it now.
Oh, then I will think of you if I am tempted to sell….maybe that will help me hang on 😛
Pull up a 6 or 8 month chart of VGZ using only a 50sma and a 200sma. Kind of interesting. 🙂
Sidenote: A 1 year chart shows the importance of the 50sma a bit better
Interesting that Nadl is such a happy camper today with oil down. Not complaining since I own it. Nice gains today in all my miners. Great work Alex!
I know, I saw NADL too ( I was watching NADL and PACD on the 50sma, they both held up right at the 50sma) .
Nancy…I googled Perlowin’s name like you said…found out he founded MJNA back in 2009 and left there to create HEMP….he spent 9 years in prison for drug smuggling…known as the King of Pot ….wow….the things you don’t know. Makes me want to go look up all CEO’s….:)
I know, crazy! I think I read a little blip that he was married to a convicted Russian spy woman he met in prison!? Reads like a Hollyweird script! Did not know he created HEMP.
Been reading up on OTC today as I have not bought much there. Did you know there are different levels? So far I got: 3 levels where they are listed with highest to lowest requirements
1] OTCQX 2] OTCQB 3] OTC pink sheets. The pinks are further rated based on the data they supply and how promptly:
“current info, limited info, no info”
URA breaking out and above the 200sma
DNN looks good here, above the 200sma.
UEC and URRE looking good too
UUUU off of the 50sma
Why isn’t anyone cheering? Was I getting the wrong numbers? Things went nuts the last half hour in our direction. We still need to hit some short time highs to convince me, but what a day.
Good day here as well. Cheers!
I know, right? I had a tremendous day. We have HAVE to string them together finally instead of big day then huge decline the next. But man, we waited MONTHS for the ICL and it’s here. We should be going NUTS!
https://uploads.disquscdn.com/images/2f82fe7e78f7ff2c4a16445b983e1b1128ded7c48b1f22eee4d8112c26fda42e.png
Thumbs up Mr. C!!!
Just got back to my computer….YAY! A great improvement to my account too.
New to the team here, been a momentum trader for awhile. Stumbled on to alex a few months ago.. Looking forward to working with you guys. Miners did well today, good luck to all and thanks CF!
Best in class right here bay.. nice to have you!
Welcome and good luck! Solid move today, I’m excited!
Welcome!
Welcome Bay Trader!
CF, how does it look to you with oil going down but SDRL and NADL still ok? I’m considering taking partial profits. Thanks:)
I’m still in PACD, but hasn’t been doing me much good. Probably going to exit if we get another pop.
Man, that was a hell of a move in nat Gas today. Sure am glad that I took out that hedge (course, I did that for a reason!). I sold 1/2 just after the open, ended up selling the rest of my UNG puts this afternoon. Does that mean I think nat Gas will shoot up now? No. It means puts had a huge profit so I took it. I chewed on a little bit more BOIL. I’m playing this for a winter play, trending below 5 yr. storage. Today’s drubbing wasn’t a reversal, but it got into my buy/accumulate zone. If we get to $4.75, will work out nicely. I can always buy the puts back. UNG $9 strike 13Jan weeklies closed up 231%!
USD trying for a triple top? It’s within pennies of the $103.65 14-year high!!
Does anyone have a “stops” system they like using? I have a system for entry stops, where I limit the dollar amount I can lose per trade; and since CF helps with the entries, they’re usually good. But beyond that I don’t have a system. I was thinking of trying something like this for 2017: once it’s up 5%, move stop to break even; up 10%, move stop to 5%; once it’s past 15%, switch to a trailing stop (I’ve read that traders can “see” trailing stops, so they’re more risky to use). This seems like it could at least be easy to keep track of. What are the down sides to doing something like this?
If the market is going to drop heavily I would not be in the market at all.
What stops do, imo, is alert the black box manipulators where to
take you you out . . . . that is their game. Take out longs and shorts
up down down up gyrations to remove the wealth.
Yeah, there’s hidden stops and and there’s trailing (visible) stops. But even hidden stops are probably obvious to experienced manipulators, given the nature of technical entries (and volume). I was just looking back on some of my trades in 2016, and I did a lot better getting in than getting out. Several went up quite a bit, then dropped back down and hit the original stop. So I’m trying to figure out a system to avoid this as much as possible.
I havent been here too long but does CF help with entries? I thought he was more presentation of his view on the chart…
What I would say is that, if you’re here for a while, you kind of “get it” when to enter. He doesn’t say “buy here,” but you read between the lines you get it. *bort*
Quite frankly, Im happy with your reply. I was definitely not looking for a place to wait around for someone to point out “buy here” – been there done that, years ago. Im generally a momentum intraday trader so my scans are for high vol and such which suit me quite well. however, Im looking for a lower stress type of trading now, more long term (weekly, monthly) chart set ups where Im not concerned over the instant ticks…
Got it. Just as an example, there are a couple references to PLG in the comments section today (and LGCY). Neither are presented “buy here,” but when I look at the chart for PLG and the context (and volume today), daily and weekly charts breaking above the 10s on volume… I buy. Stops are clear (probably to the manipulators, too). Initial entry only. https://uploads.disquscdn.com/images/7af428d79578f57ba620e1b3d780add124316b4122fa4660ed049a57caeb9e20.jpg
Im sorry, you lost me here – Stops are clear (probably to the manipulators, too). Initial entry only.
Either stop below $1.50 (fib) or below $1.40 (swing). To me, those are obvious places to put stops since they’re “technical”. Initial entry is just my poorly worded way of saying first tranche–I only invested a little here.
Ahh makes sense. Well yea, hopefully this is the place for me. Im def looking for swings vs. the quick buck. I still play the quick buck – IDXG today, in 5.75 out half at 9.04, added 8.58 out all 12.03.. Nice few grand trade… but im over the intensity of the intraday low float runs..
Now that it’s crossed above the 50, I’m going to move my stop to breakeven ($1.62), and if there’s a backtest of the 50, I’ll add. Maybe it will work–it’s simplistic, that’s for sure.
Nice, I actually added a starter position this morn at 1.67 – mental stop at the 618 fib line
Looks like were holding up well as of now. Thanks again
I am trading per cycle (2 weeks – 5 months). What saved me in 2016 was I bought late Jan early Feb and rode
it along. Then in May I started to see my stocks go down then back up and then down and then in the back up
I said I better get out before it really goes down. Did super well pulling out between week 1 and week 2 in May from memory. I went in and out in June and again in July. Was all out end of July. Profits all along.
So, I watch about 20 stocks and hold about 8 when in the market. When I see a trend change starting early I really watch for my move because GDX does not always show what the coming change is and will it hold – up or down.
Updated UNG chart – 2 hour. A bit oversold here, could certainly rebound. But we had a higher high recently which resets the Wave count. If this is the start of wave 2, could have a bit more downside to go. And clearly this is the “sharp” one of the corrective waves after today’s action. Will need to keep an eye on that. Don’t want a left-translated cycle this early, that’s one issue. Otherwise, 61.8% retracement just a bit below. Could bounce up and then try to tag that one.
https://uploads.disquscdn.com/images/925321e97533167dd5bcebd026ff4731e39f77803293e39ae2d622c53b5bdeba.png