
Thursday – Dec 22 – Day After Day
Yesterdays reports called ‘Baby Steps’ discussed how the markets have been moving slowly along, and how that can eventually lead to a particular outcome. Well, most areas of the markets continued that slow crawl yesterday. If you read yesterdays report, nothing has really changed in many areas, except for Natgas. Today we will briefly review and discuss a few of these areas again.
.
Did the Dow hit 20,000 yet? It was only 13 points away when I pointed out this chart
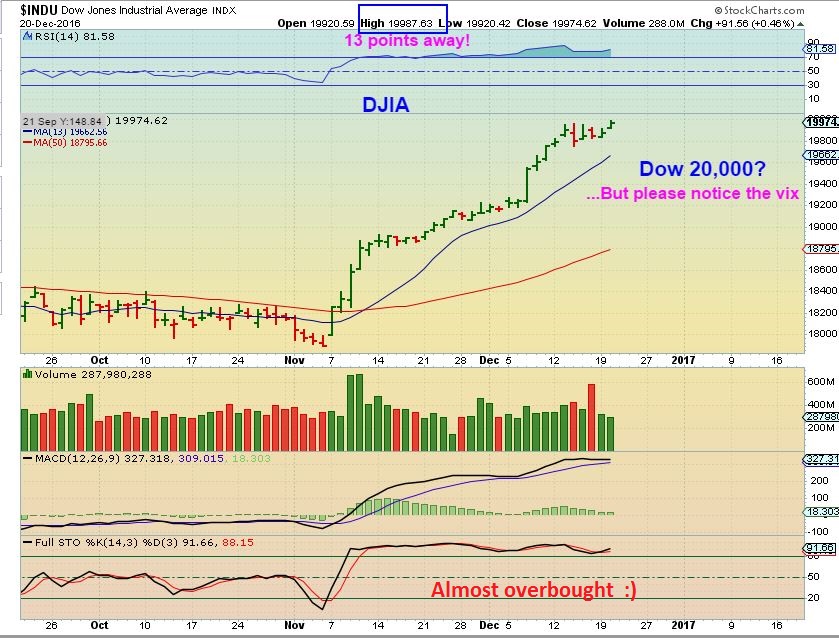
No, the goal of hitting 20,000 on the Dow remains in front of us. So we’ll move on to the USD.
USD from Wednesdays report, we were on day 8. Read the chart.
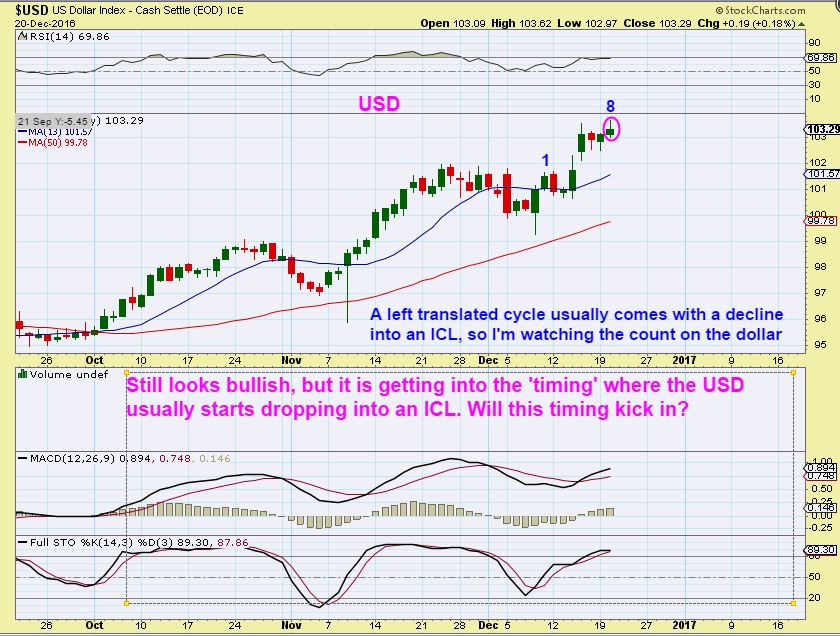
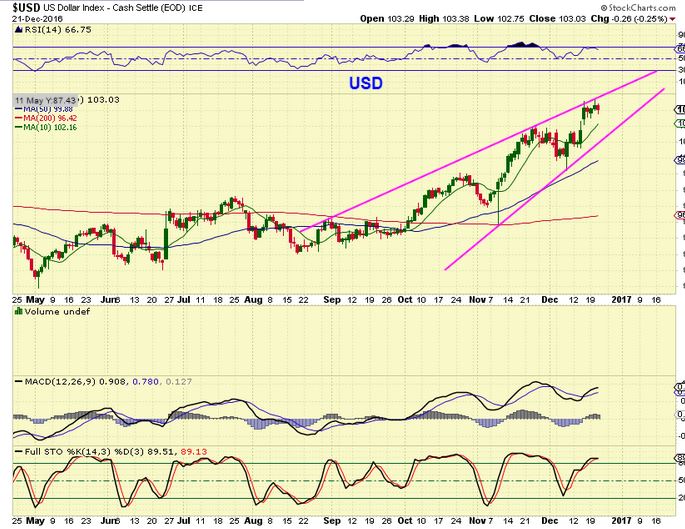
USD day 9 saw the USD drop a bit lower. We could be seeing a rising wedge, which would indicate that the USD should be capped from a steep rise, but 105 could still be tagged over time.
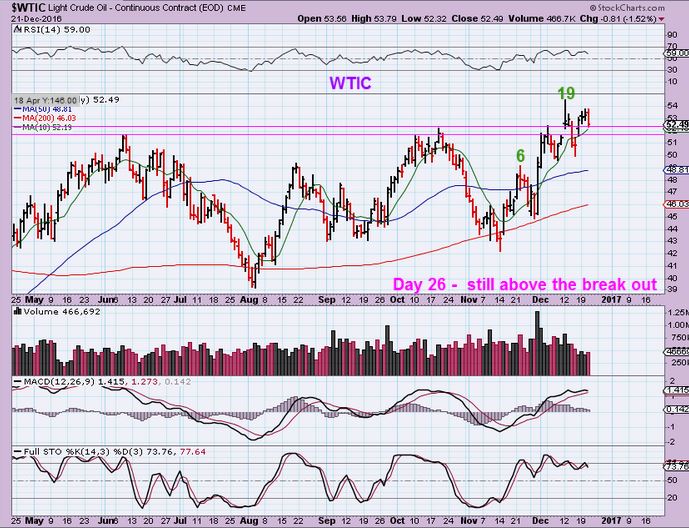
WTIC from Wednesdays report – Day 25, but Oils cycles can go from 30 to 50 days. It is above the recent break out.
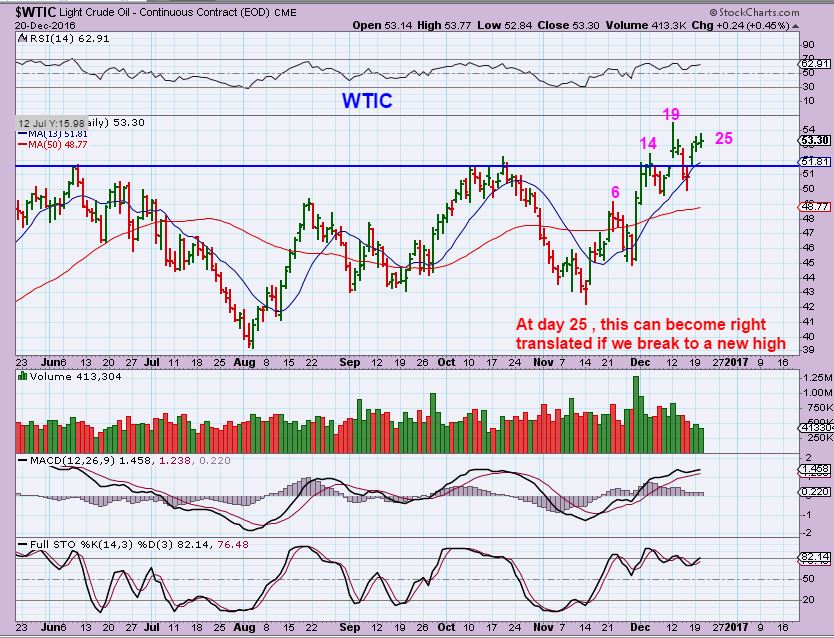
WTIC – Wednesday Oil dropped after the inventory report, but no technical damage was sustained and volume was rather light. Oil has dropped every 3 or 4 days, but continues to trend higher for now. Oil above $51 is still holding the break out and can continue higher or sideways in this daily cycle.
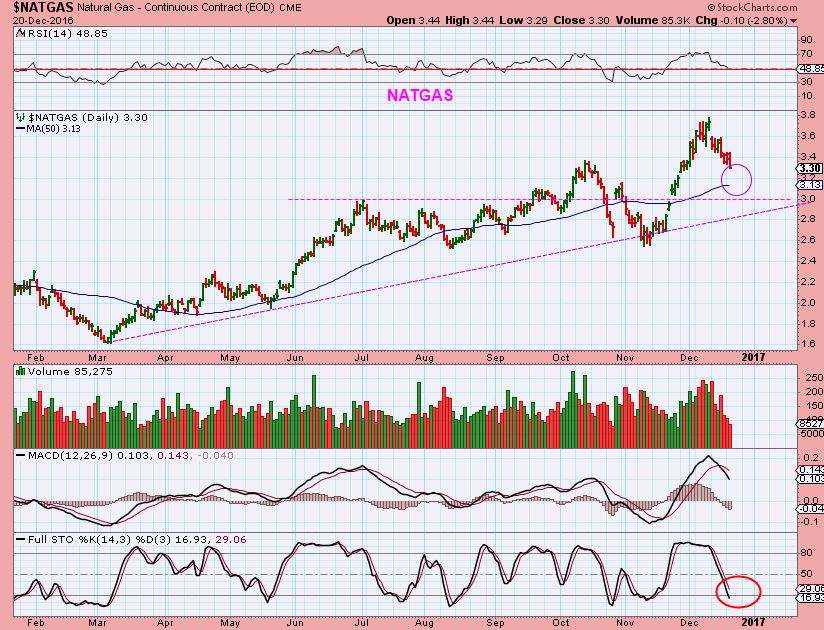
NATGAS – Expecting a dcl soon, I said here in yesterdays report that I normally would take a position here and buy any further dip toward support ( the 50sma and Magenta line) , HOWEVER I didn’t recommend that approach to those that use UGAZ , because holding leverage in a dip that is as steep as this could be could hurt.
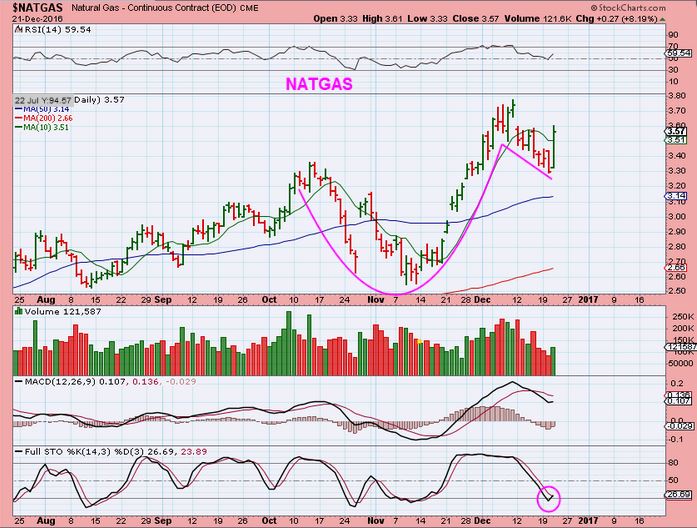
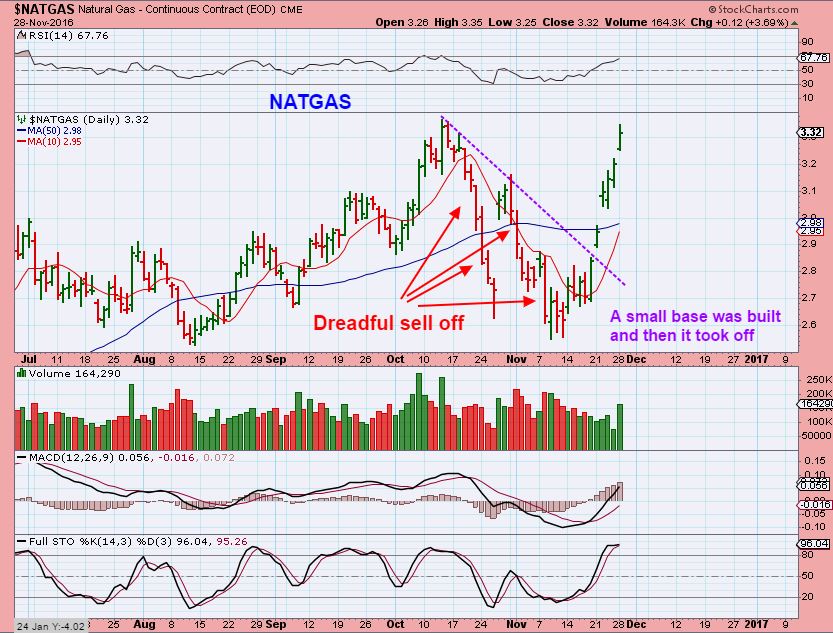
NATGAS took off yesterday – This indicates that the DCL is in place, this is day 1, and the last daily cycle out of the ICL was very right translated, so we should break to new highs over time. This would be a buy, just keep in mind that it can 1. Pop & Fly higher, or it may also 2. Pop and drift a bit lower before breaking to new highs. It has formed a bullish cup & handle.
Let’s discuss (again) what a slow process bottoming can be!
REVIEW:
GOLD – No real change again from Yesterdays chart shown here. The Lows didn’t break, and the 10sma didn’t break. That is what I am watching at this point. Day to day wiggles are just noise.

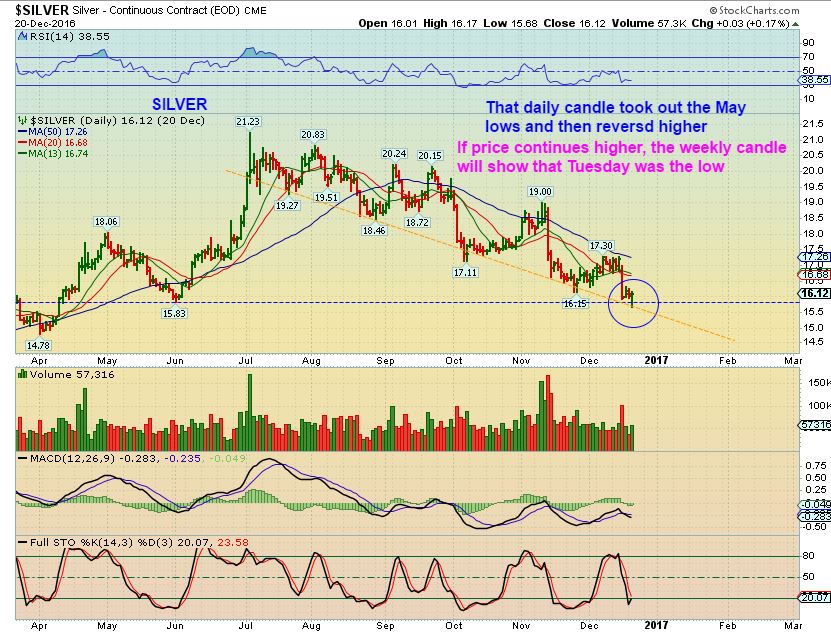
SILVER – We saw this reversal candle, which can signal that lows are in place, and it did not break yesterday. In Silvers case, you are watching for the lows of $15.68 to continue to hold. It almost dropped there overnight, but again, the lows held.
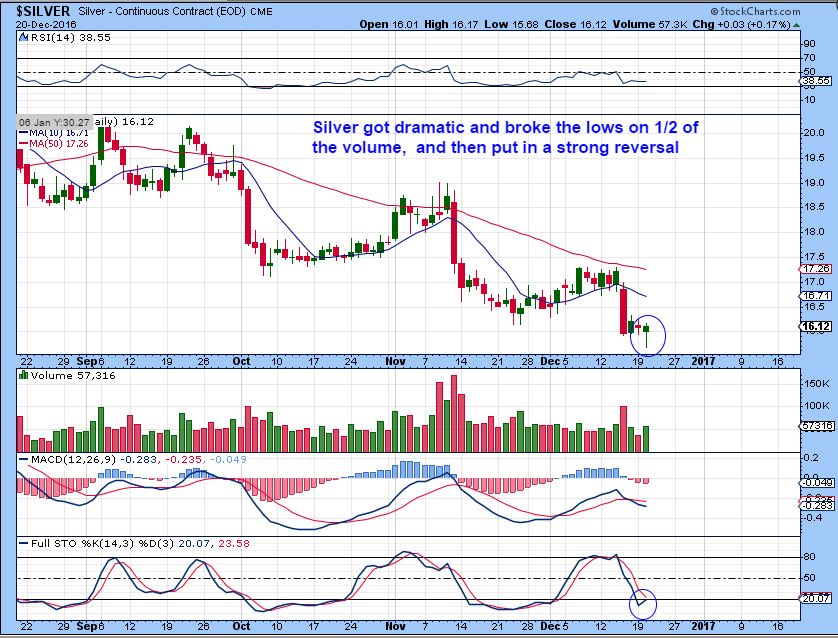
SILVER BIGGER PICTURE – Silver ran stops on the May lows Tuesday and put in that reversal candle that I pointed out. This could indicate that the lows for Silvers selling are in place on a weely chart, IF those lows are not taken out. Many are calling the Silver bottom because of this candle alone. Time will tell.
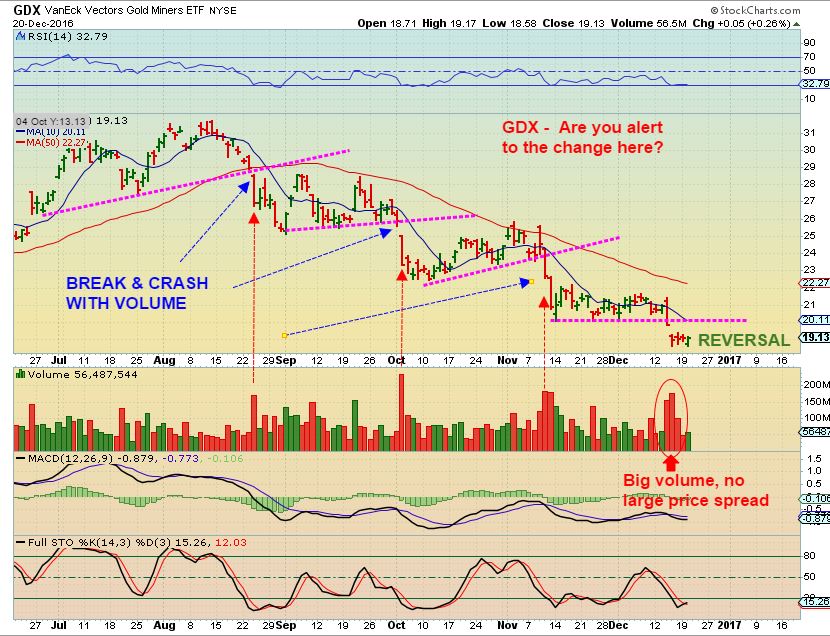
GDX – I mentioned a possible Island Bottom base forming, and so far it remains. A gap higher would be bullish, a continuation sideways would be possible continuation of a base building process.

In yesterdays GDX chart, I shows a change that took place. We haven’t seen the normal high volume follow through after breaking down, so I am watching for that to continue. That is why I mentioned a possible base building process.
This is becoming another sideways Yawn-fest. A boring sideways move, so let’s discuss that now.
.
I have shown the ‘bottoming process’ that took place at the Dec 2015 lows in past reports. I still hear traders look back at those lows and say how they would love to just buy that and hold and wait for the rally, as though it was easier than what we are seeing today. ONLY IN HINDSIGHT does it look easy. We were still in a Bear Market and many were crying and calling that move “Weak”. Trust me, I remember, since I was running this site.
Base building can lead to a solid launch, but take that Day-To-Day movement and it can frustrate some traders. Let me try to show how this can happen 1 more time, in case we begin to move sideways in this sector for more than just a few days.
GOLD Dec 2015 lows – We look at this chart and see a Beautiful Base, and easy to ride too, right? Since the lows were not broken, this looks easy, just 1 month of sideways trading and then a LAUNCH! Looks easy now, but let’s adjust our perspective.
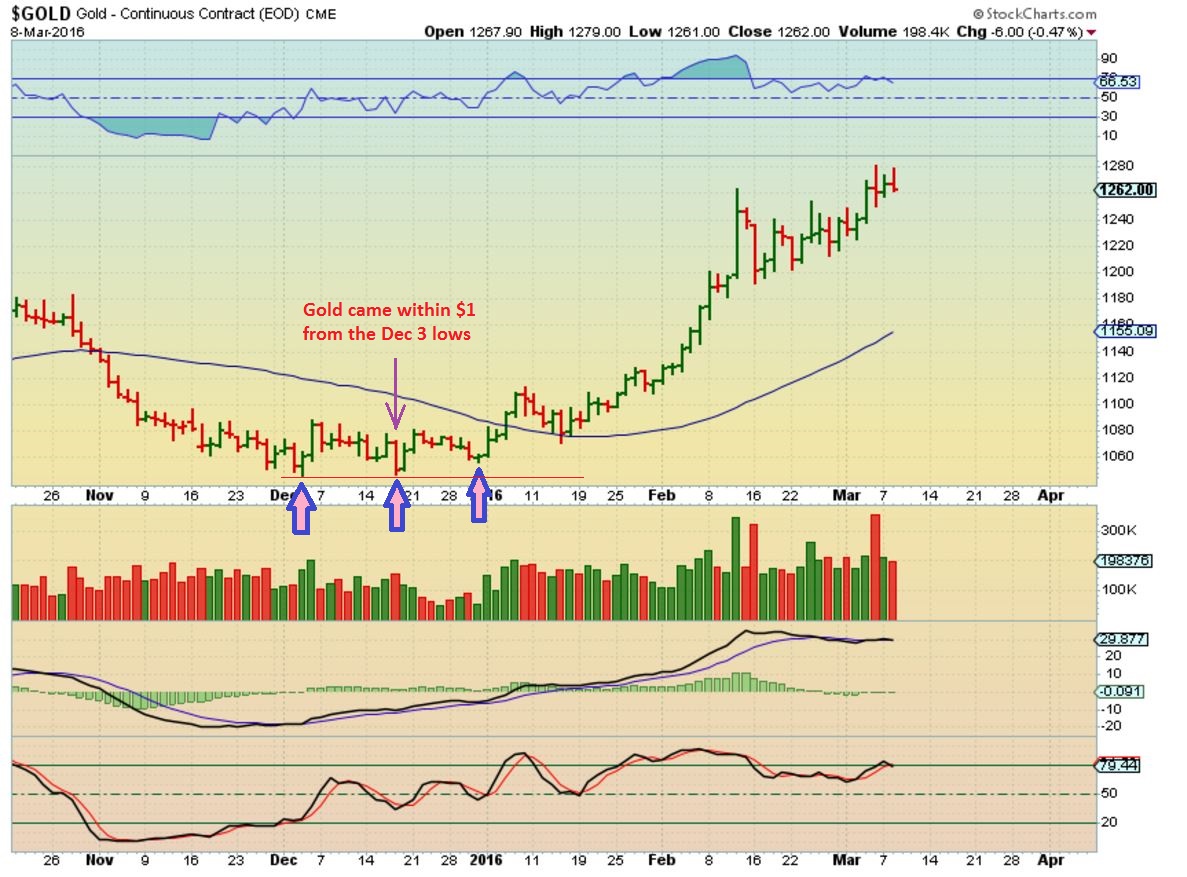
The same GOLD Dec 2015 lows – A different perspective.
This is day after day after day after day. Picture the end of Monday, then Tuesday, then Wednesday, then Thursday, then Friday, on & on as the lows form, and price stays almost the same. See the chart . Weeks go by and Gold basically does NOTHING! People freak out. It bounces and goes back to the lows. The one watching this base wonders every single day, “Will Gold break down today and start a sell off again?” Posts in the comments section can get rather emotional.

In the above chart , I didn’t even include November, but the sideways chop started there. I also didn’t include the crying that you hear in public blogs, “This sucks, Miners suck! They are so weak, this will never get off the ground. I give up, it’s going to break down! I Give up! The Bear market is back”. You read that day after day after day and it can affect your resolve (I ignore it). Those same people hating these Miners keep buying JNUG and NUGT on each reversal higher and get stopped out on each drop. What a shame, because this base building chop tears them up emotionally and financially.
I personally just focus on the lows. Have they been taken out by todays lows? If not, the drop that day means nothing to me, and I also block out the comments of emotionally extreme traders. Again, at this point, some Miners havent taken out the Oct lows yet, if I own them, I am still in ( GPL), if I get stopped out of another ( I am now out of AUMN for a while)? I just watch to see if this is a bottoming process continuing. I wont keep jumping In & Out, unless I see a trade set up acting correctly ( started liking the Drd action as mentioned in the comments section).
The Lesson: If it gets choppy and we get stopped out, stay out until Gold moves above the 10sma at least. Stay off of the leverage, keep positions smaller and manageable. Do not jump in and out, because the chop may continue. Let it play out for a bit. If this move is going to go a lot higher over time, you will have plenty of time to buy good solid set ups in Miners later too.
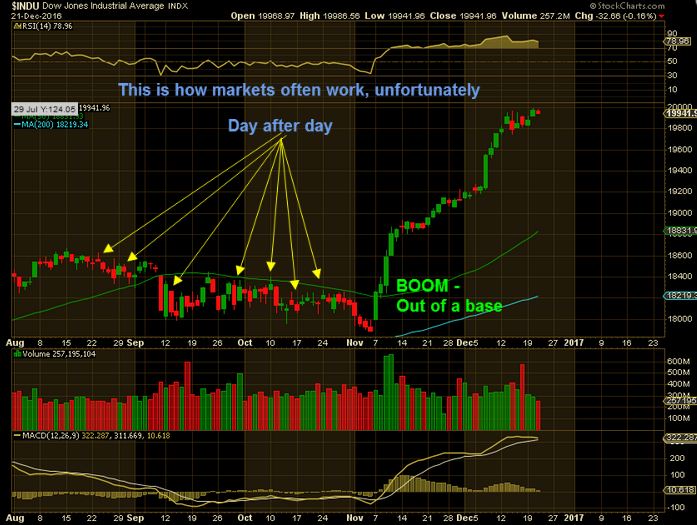
Yes, sideways moves and long base building activity is boring and can be drawn out, they can even quickly break down in a final shake out, but the eventual rewards for those that do not allow this process to make them overly emotional can be exceptional if conditions are right. This is the stock market, sideways moves happen all the time, shaking buyers and sellers alike off to the side. It’s O.K. to stay on the side and be patient. The recent DJIA activity was similar , and no one remembers that now. It’s all about “How Bullish that DOW 20,000 run has been!”. Nobody talks about that choppy Sept and October move was anymore, right? Look at August, September, and October, yet no one talks about that now. The RUN is the focus. Miners may do that in the future too.
NATGAS WEEKLY REMINDER CHART #1- I called for a drop in Natgas to about $2.41 and then a buy as an ICL
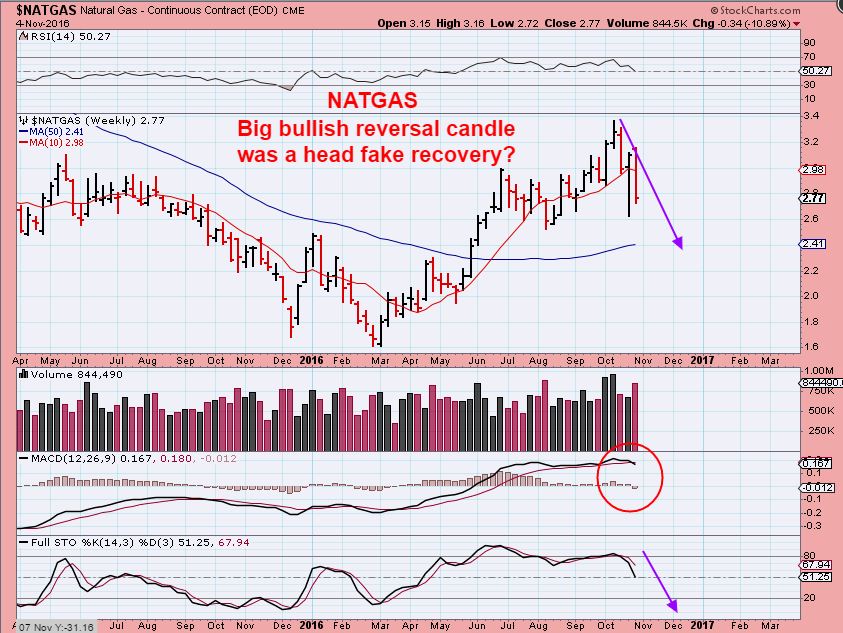
NATGAS CHART #2 – It dropped to about $2.60 straight down, popped and crashed again lower to $2.55! Dreadful, Horrible. Painful.
NATGAS – NO ONE was talking about that October double drop after mid November, people just wanted to buy NATGAS. Do you see what I am saying? Patience can pay off when market sectors are bottoming.

GDX had a long winding base after a November sell off last year. That built a base. A quick sell off scared many, but honestly it just barely broke those Nov lows 1 day, and then it ran away without many of the emotionally distraught traders on board. At Chartfreak, we doubled and tripled our Miners positions over the spring of 2016. I don’t want people to lose sight of that now. We may be in a bottoming process.
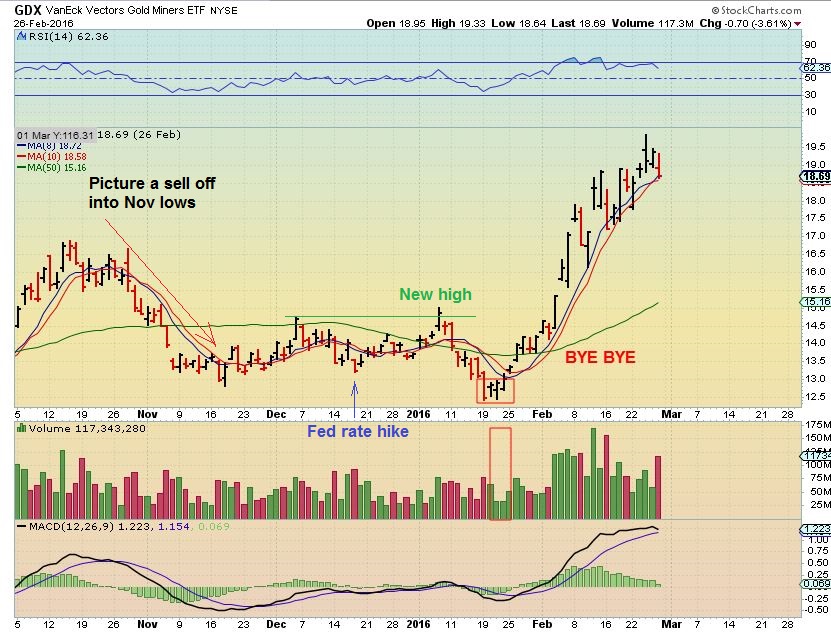
GDX TODAY- This could be a base built in November, and a shake out move now, and an Island bottom. If so, and it breaks higher, it could lead to a bullish run into 2017. If it were to break lower and stop us all out of any Miners that we are holding? If it does that I will monitor and not re-enter until Gold breaks out upward and puts a confirmed swing low in place. We have not seen that yet, but we have seen some bullish looking Miners still holding above October lows. I think we are basing out here, and some Miners may be leading the way. Yes, Time will tell.
In the meantime, I am trying to at least provide a few trades in other areas to off set boredom for our active traders. It may offer a different way to raise a little money by trading in areas that are set up properly. CENX, AKS, NOG, WPX, OAS, WRN, TGB, and more have been helpful to some. To be clear, I am encouraging just using a small portion of your funds to trade in another area if you are an active trader (not going “All IN”). We can do this while monitoring the action in Precious Metals. I still think that a bigger trade could be lining up in that sector. The weekend report will cover more in this area, enjoy your Thursday & Friday trading! I may have a small Friday report just discussing trade set ups.
~ALEX
TWLO – I found this chart and the volume indicates that this pop should be real and could have good follow through. That little 2 month base has tightened up in December and broke out nicely. When this was an I.P.O. this summer, it quickly ran from this area to $70.

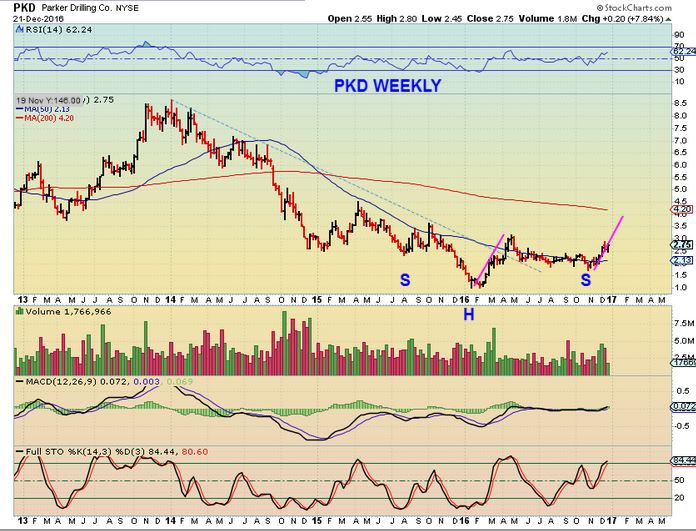
PKD – This also caught my interest when it popped Wednesday, because the weekly chart is just as bullish as this daily chart. The daily is forming a rounding bottom or base. A long cup & handle consolidation after a major run higher last spring.
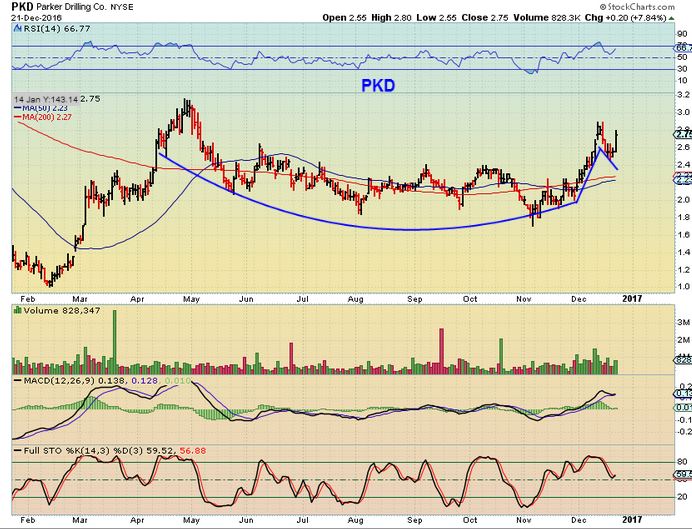
PKD WKLY
PACD UPDATE – PACD moves quickly and in both directions. You can see that it actually just ran from let’s say $2.75 to $7.00 in 1 month! HUGE. It is pulling back and I wanted to draw a few charts to show that after a huge run like that, a normal pullback can be rather big also. Possible support is in the $4.35 area?
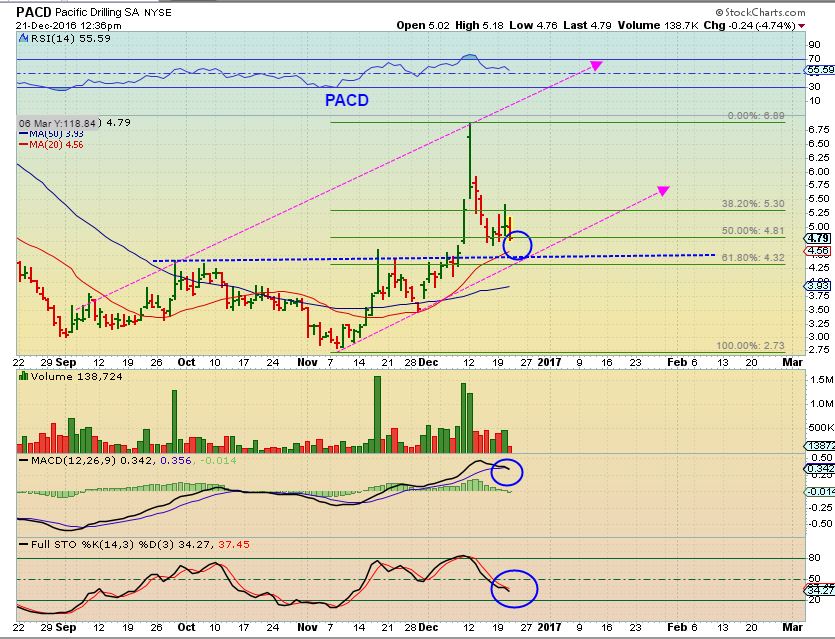
PACD – $4.25 area? PACD is at $4.75, so that is a big drop, though it doesn’t look like it on the chart. It is not oversold yet.
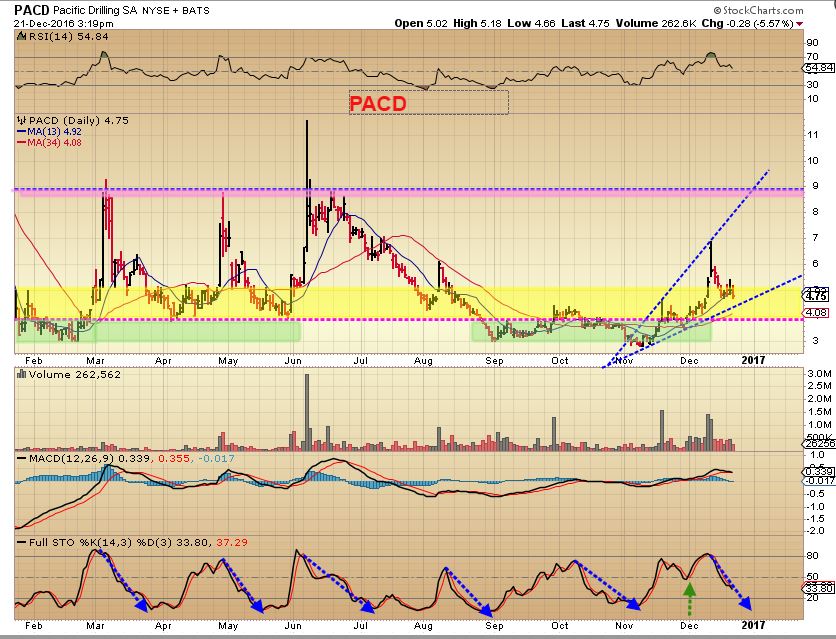
PACD BIG PICTURE – It has a big trading range from $4 to $9, so it might try to get there if Energy continues strong.
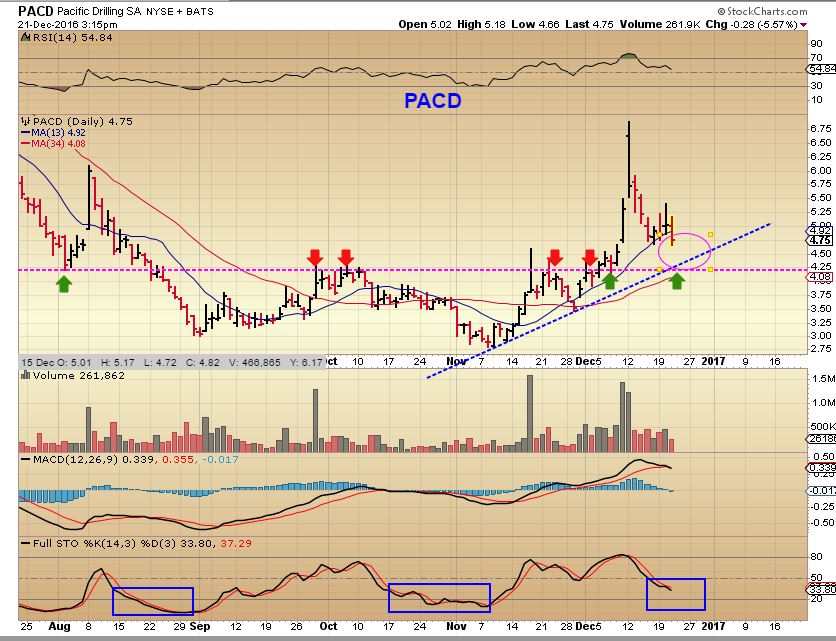
PACD – I was hoping to see PACD close above $4.75 for a big picture break out. It may not hold this time, but it is building a long base and could try again sooner or later.


Oh man, markets and gold right now are…
https://uploads.disquscdn.com/images/fad910483f448082a0ea08aca1b433ad99893f4df299f2ea9f117629774c5da6.png
better that you are bored, than having you slit your wrists Mr Cas 🙂
🙂 hi
Merry Christmas young Maria 🙂
and the same2U old man… 😀
I kind of chuckled at this, but I dont think I’m supposed to. 🙂
lol
its the season of jollity & mirth.. so feel free to do so
sagely advice & pearls of wisdom that only experience can offer.
I am printing this report for future reference…. u r an endless fountain of knowledge.
#unFreaknReal #machine
Thanks Maria – It is a constant process, these markets. A learning process, since many bottoms and sell offs and reversals vary in how they form.
I hope traders realize that we use various trading styles at various turning points. I admit – I do go very heavy at what looks like an ICL, but if I eventually see it drag on and I lose a few positions and see choppiness? I cut leverage, watch things unfold, and dont fight the markets, I just have to keep listening to see what it is trying to say. I still own some Miners, I lost a few positions. No sweat, if we rally later, I have cash and am trading a few other areas too.
So far what is Gold telling me? It’s a big fat , ” You are not going to get the V-Bottom rally that you hoped for in Precious Metals, but I may still decide to build a base”. SO I have to trade as though a base is building, not a ramp up rally. That requires a bit more patience.
There it is again …. CUT LEVERAGE ….;)
– For now 🙂
Yep…for now! Waiting to jump in on JNUG…..
i already bought some small starter position..
looks like a possible out on my 15min chart right now, as i type??
Yeah, just came back to my screen after being gone a few minutes and I see it’s up……was thinking about getting in when it was $4.09 but held off….
*break-out
dunno why that didnt register.
disqus does my head in sometimes, with the cursor just jumping to random postions and deleting text i just typed.
JNUG down around $4 is so tempting – but the words of wisdom above are keeping me at bay.
lol… jinx 🙂
Jinx with itchy fingers!
So true, JNUG at $4 looks like a screaming buy
( However, I think I did buy it around $6.50 – $7 and got stopped out at a small loss. That was only 2 weeks ago? so that is a helpful reminder.)
I bought at approx $7.50 and set a stop at $6 thinking no way is it going to stop me out this time. Small position, so no big deal. I need somebody to keep telling me to step back from the keyboard.! Always appreciate your sound advice.
Yeah, I tried a couple of ‘small positions’ in Oct lows and Nov lows, simply because you cant keep the stop too tight on a 3x etf.
You can’t keep the stop too tight, but you have to limit risk one way or another, so position sizing is the way, and you can always add if the trade goes in your favor. 🙂
My avatar is an image of Conrad Gessner who was the first person to catalogue Tulips and introduce them to North Western Europe. 80 years later, Tulipmania in Holland was reputed to be the first market ‘bubble’ when the price of a tulip bulb soared to 10 times the average salary of a craftsman. Was that the first leveraged position? Always a reminder for me to keep investments within reasonable limits!
Did you ever want to ask a question, but you think to yourself, “Maybe the answer is obvious and I’ll look stupid.” So you dont ask.
I was going to ask who your avatar was a long time ago – Mystery solved, and lesson learned…There really are no stupid questions. 🙂
I read about that Tulip Bulb market Bubble – it reminded me of the Cabbage Patch Craze, and then the Beanie Baby craze, and what epople were willing to pay to have it now. THAT helps me to understand a few things in investing….
1. Market perception at times becomes reality, so try to listen to what the market is saying NOW
and
2. Here today , Gone tomorrow does happen — beware of holding on to a popular well liked stock breaking your stops, because it can be ‘gone tomorrow’ . (See charts of the once very popular GPRO, TWTR, FIT, etc)
Im looking for an entry around $3.55 (with tight stop, due to next support after that under $3) but only for a quick trade.
The end is near. At hand?
I could see an easy double to $8. Limited downside maybe a 10% loss (stop at low) possible against a 100% gain.
Was just about to post that WTI has finally been pulling back the past 2 days….when I looked and instead of down .07 now it’s up .04….keeping my eye on it – since it soared so well it might be a good one to get after the next cycle low is in….not sure how long we have on this cycle…
What might be obvious, things are perking up. Of course, it is the first hour. 🙂 I have lots of hourly buys and some daily buys. Nice feeling.
go little JNUG ,go!
Good call earlier SOG, seems to be breaking out in the short term, hope it continues, needs to break through $4.40 .. Nice trade
GPL (own) just broke recent hourly high. Up 5%.
refersh- More baby steps, higher lows on GOLD, SILVER, Platinum. Copper nice break out again.
Looking for follow through on all of them : )
https://uploads.disquscdn.com/images/fe51995a55218b0d1d98abbd2c8b44f222d6811a6dcad6c160f8eb2b4340c5a4.jpg
.
Great charts. Thanks.
mmm mmm mm … yum
GFI just broke hourly high. Up 6%.
Yen turning up a little. Buck down. But JNUG pulling back a little. Are we going to get a big rally or just a small blip?
I wanted to take a trade in UGAZ this morning, but damn Merril won’t let me trade it? One disadvantage to TD! I did take a trade in BOIL. Anyone have any other good plays for Nat Gas?
I usually play BOIL since it’s just a bit more forgiving than UGAZ (but not much). I hedge with UNG puts in Wave 2 and 4.
Alex, do you think we just started the 2nd DC in NatGas?
I do Bill.
I don’t understand why they wouldn’t let you trade UGAZ. ( in your other comment). That’s odd.
They limits some leveraged etfs you can trade. UWTI I can’t trade either? Bummer
Hi Bill. You may have forgotten but UWTI was delisted on 8/9 December along with DWTI
This is true, and I actually can’t remember the tickers, but they were replaced almost immediately.
EDIT: UWT / DWT
Yes, but with a different broker/provider.
took the words outttta my mouth ….
oh hi ..
*he’s old … brain cells r crusting over ..
**or he smoked a littttttle too much of that wacky weed in his flowerpower childhood days… ;o)
#HB
Its now legal in MA miss Maria. #HFT
….well then, i expect u to have a fat one rolled and ready when i arrive …
*make standing in that treehouse line go a bit easier 😉
hows chris :o)
Good thanks Maria…and still patiently waiting for gold/silver to turn!!! 🙁 Like just about everyone else I guess!!?
I did forget actually, BUT I did try to trade them a while back and couldn’t.
Yeah, I knew them and had it on my watchlist (I stopped trading them when the delist notice came out) and was like crazy, UWTI hasn’t move in weeks. Then was like, “oh yeah…”
Try UWT or DWT Bill
Thats OIL, I was looking for Nat Gas Today. UWT is a n ETN, don’t like getting those nasty K1 forms
I dont either like the K1 forms either, but you mentioned that you couldnt trade UWTI ( I thought that that was an ETN too, not etf). I was pointing out that UWTI was replaced by UWT.
natty is pretty crazy…. every single time i see this i say (yes outloud lol) “REALLY???”
https://www.tradingview.com/x/GpbQOYGF/
Sidepoint: GPL has held up very well in the recent choppy waters.
Not only still holding the October lows, but closer to the 2 month highs than the Oct lows.
When Gold & Silver run, I think this is an indication that GPL will run very well.
It is. Sorry thay I so poorly timed my entry and exit. Nice move today. Mon move really got me on what looked like another extended breakdown. That’s why I stopped trading these stupid wiggles.
Gold drifting back to red.
More choppiness.
You guys DID see the cover theme picture , right?
yes that’s hilarious….
whoaa! wtf URRE?
Nice!
So I looked up UEC and that had popped big too, and URG is a nice set up. DNN is up almost 60% since Nov 3rd
These may be setting up as good plays ( When a whole sector starts dancing, it might be time to hit the floor)
Trump just tweeted that we need to strengthen and expand our nuclear capability.
Thanks. I hope that you are one who follows Trumps tweets real time, perhaps at 3 AM too. If so, please let us know ASAP when he says something that will move stocks. Hell, who needs TA when we may be able to get rich off of Trump tweets. 🙂
Yeah I should have been following him since the election.
I shared this with a friend who asked “Electric power or weapons?” Any idea? Maybe this will differentiate among the companies we invest in.
He changes his mind from tweet to tweet plus I don’t think he can be taken literally so not sure about investing based on what he says.
I’m surprised TWTR isn’t doing any better with Him at the helm 🙂
Looks like a BIG H&S about to break down.
can u imagine if this puppy ever finishes correcting? dang… that will be one … funnnn … ride…
*shazamm
*giddyup
I have kept 100 shares (a lottery ticket) specifically for that day if it ever gets here.
i do that too… (need2do it more) even less sometimes when I’m really chickenLittle …. helps desensitize me to the crazy fluctuations … ;o) it works too… instead of just falling off my chair in sheer horror, and laying dead on the floor … i realize I am still living & tuck & backward roll into a handstand BOOM .. im ready to fight again…. 😉
can’t remember the exact figure.. but was something like 12800% back to the top??
LoL.. yes plz
another one with schizophrenic tendencies is OPTT. This one can make URRE look like a utility stock
oh hmmm .. interesssting…
I remember recommending REN here ( And not taking the trade myself) this past summer.
Ugh!
looks like cwei … another ughhh…. swiped a fraction of what i should have…
https://uploads.disquscdn.com/images/4d08fdad6e71947e4c50cf188b3191c4ee6f0829deacaff4214bd2c154223317.jpg
Yeah, I guess I ( we) can say that at least we caught a nice slice of CWEI, but after $30 it just left me behind like a runaway train.
yes daddy… ever the optimist ;o)
*yeah santa.. u have 8 good reindeer left standing…………………
Most every time I am Ocean side or Lk. Michigan side I wonder why someone can’t figure out why we couldnt harness the renewable energy of the ocean waves. OPTT is trying…..
IPI – Bull flagging
Well jumped into JNUG a little earlier today….
#whydidIdoitagain #shouldhaveboughtAREXinstead
#iwonderedwhomadeitgodown
https://uploads.disquscdn.com/images/54118fc9c21e3f43f21b63f56a2b43cff9e72b58663b54cb4caaadab88395ca6.png
Have to leave the computer, here’s hoping it’ll at least stay where it’s at for now (or go up preferably…)…..argh
Sounds like something I’d do! Alex’s warnings on over trading this week really hit home. I tried, I was stopped out so need to stop playing each wiggle and really wait for the REAL move to happen. Tough for me to be so patient, but I have Not taken a trade all week. #ThisReallySucks
Alex, I am wondering if people are waiting to sell (any market arena) until January 3rd in case the capital gain tax gets a reduction from the new administration? You also have people who will start buying into their retirement accounts for
year 2017. Maybe metal and miners will move past the 10DMA after Jan 3rd, otherwise, a boring wait until
after January 20th . . . . . Thank you for your alternative trades for your active traders. I think you are a very
considerate trader to expand the field. I am staying with miners as it is the area I know. I like your flexibility.
I am going to not look at stocks this weekend and give myself a break!
Taking a break is healthy at times, if possible.
At times, I just check in 2 or 3 times a day – to see if anything “real” has changed.
Like check the open – GDX gap out of these lows ( For an island reversal)
Check at mid day – See if any real move pushed Gold over the 10sma?
etc. Sometimes the bottoming can be a bit time consuming, other times it is a rocket ship out of the lows.
Some accounts let you set ‘alerts’ for your phone too..if you wanted to feel in touch with any changes without actually having to check in.
The alerts are great to have. And, this has been a long correction but
I seem to start laughing each morning now when I see the take down – laughing
at the secret hands doing their illegal greedy manipulation and knowing I am
a sincere clear spirit with no $ karma when I pass on to the other side. I like
the sincerity of your reports and good heartedness to guide in trading.
Could you tell me how to sign up for alerts? Thanks in advance.
Yes. Kitco.com provides alerts to phone or email. Also, your brokerage will supply alerts
to both, as well. You can set up the alert to how much of a move either direction you
want the alert set for.
Thanks, I thought you were referring to alerts when Alex makes a trade, and I wasn’t seeing them! Much appreciated.
Oh….funny. Maybe Alex can get an app . . . .
All may know this, but here is GLD news:
http://www.marketwatch.com/story/heres-how-dramatically-investors-have-been-fleeing-gold-2016-12-21?siteid=nwtam
That fellow in the picture sure has a nice suit on. He’s also sporting quite a grin and all those pieces of paper on top of the gold bricks must be “margin calls”; no wonder he’s smiling!
Thank you Gary. I knew about the notes but I didn’t realize how much it affected the black market and gold price.
Did you all here Oprah lost 40 lbs. !!!! Quite the incentive when you can move the stock you own……I wonder who knew that news before going public ??
Her doctor? 🙂
New report posted Friday at 8 a.m. Eastern