
Tuesday Dec 20th
Nothing has really changed since the long weekend report, so lets just review what has happened on Monday.
.
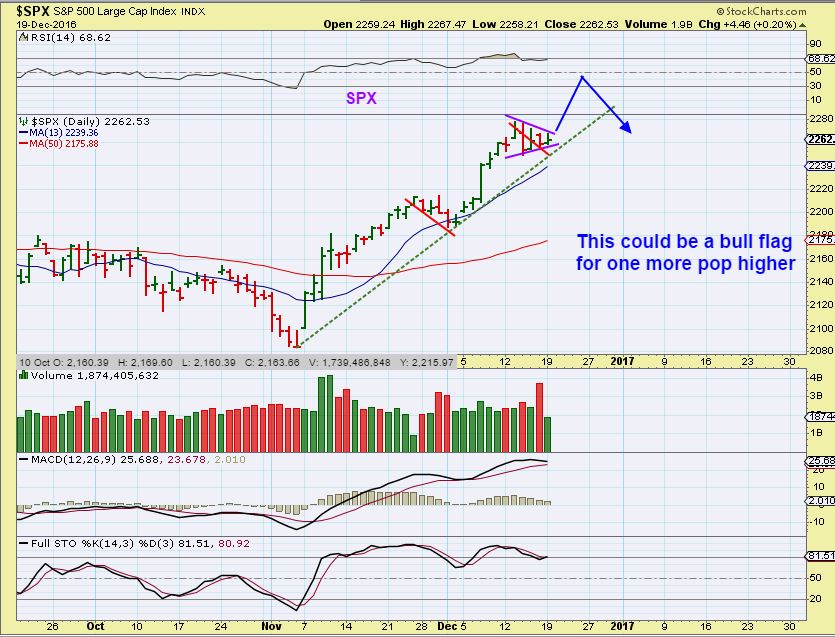
SPX – We are due for a pullback into a dcl soon, but this looks like a bull flag forming, so one more pop higher could be in order first. A pop now could help the DJIA to reach 20,000 ( And then a drop would be expected).
USD – The USD actually has a target of 105 with the recent break higher. With a 105 target, Is Gold just going to continue to miss the 10sma mark?
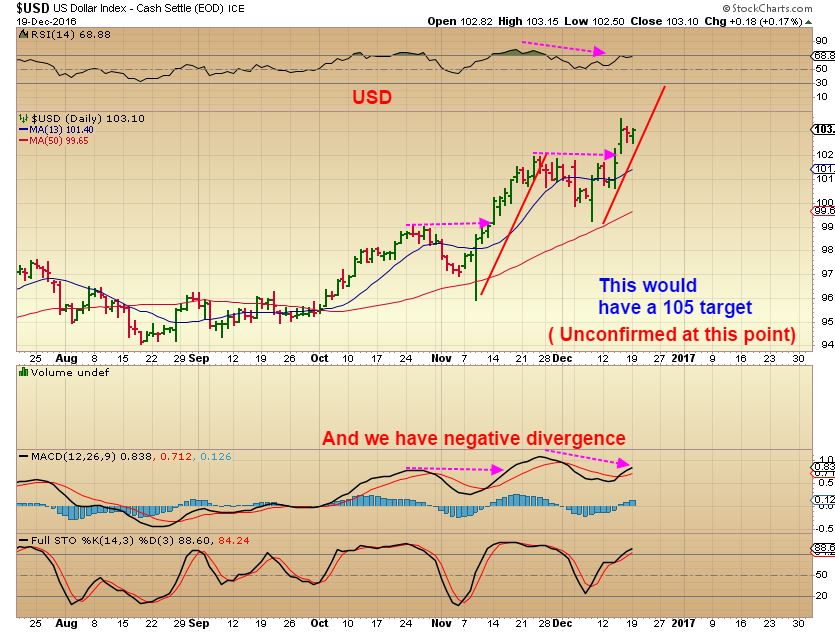
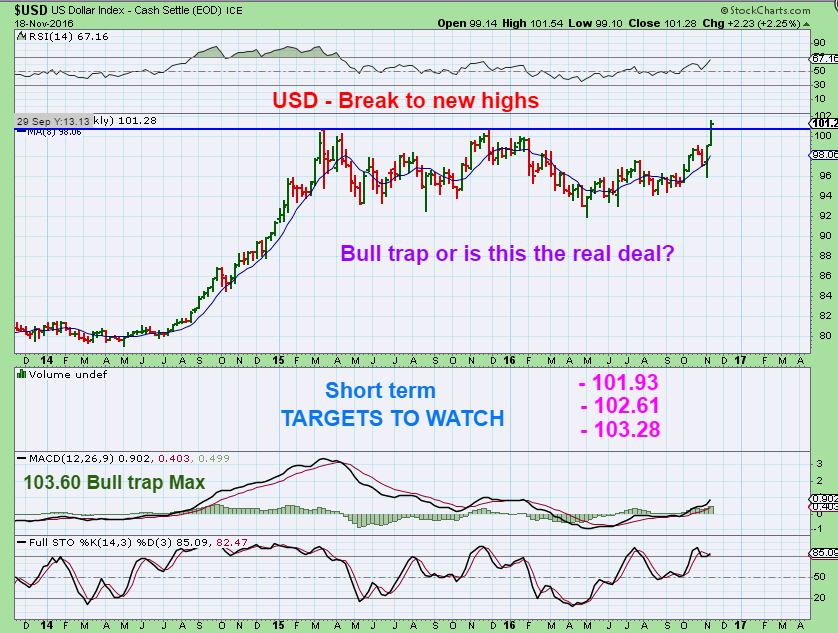
ALL SHORT TERM USD MEASURED TARGETS FROM NOVEMBER HAVE BEEN OVERTAKEN –
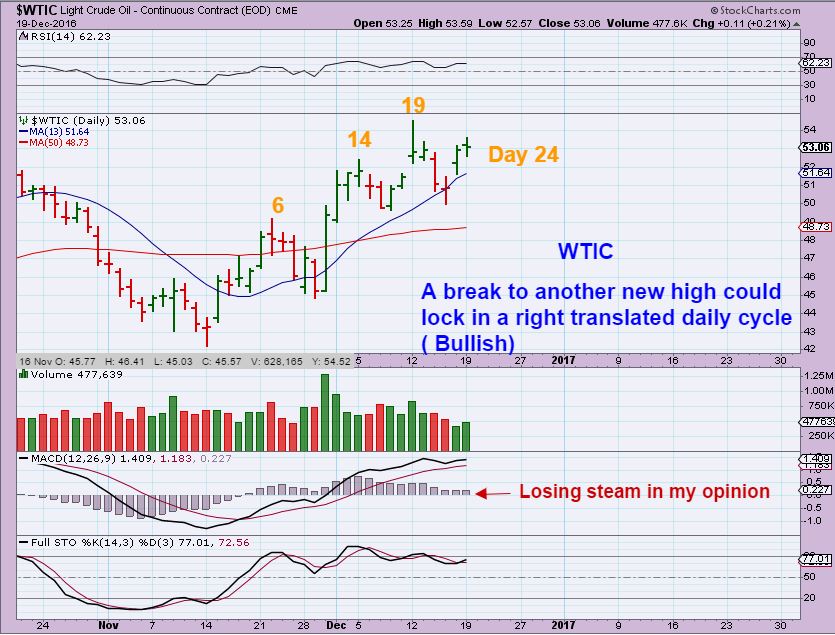
WTIC – Oil remained above the break out level, but did not do anything spectacular on Monday.
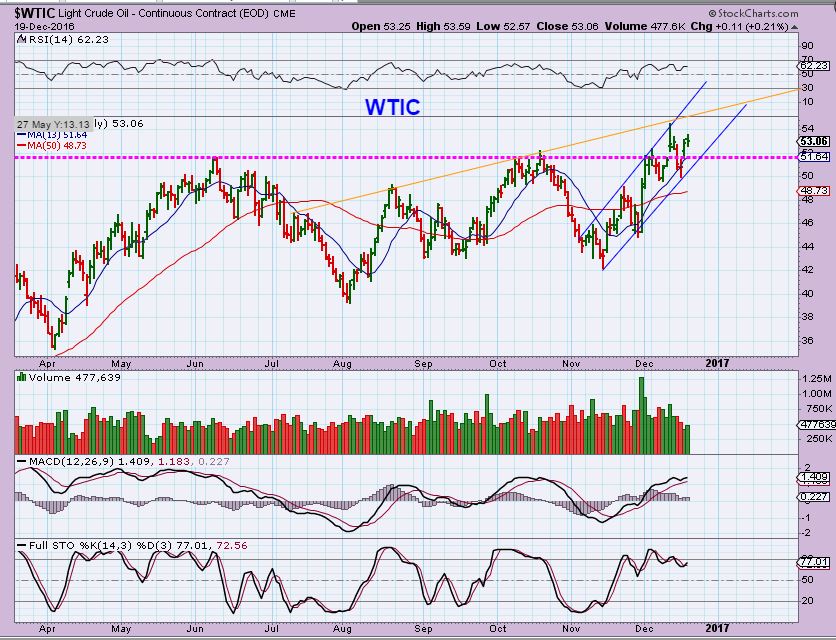
WTIC – Since daily cycles in OIL can be 30- 50 days long, and new high above day 19 would almost clinch a right translated daily cycle. Day 19 high is middle ground. This also looks like a mini H&S, but a move higher negates it.
As I was preparing this report on Monday night, the BOJ DECISION was released – Their decision is to keep policy steady. Gold started to sell down slightly as the USD moved higher.
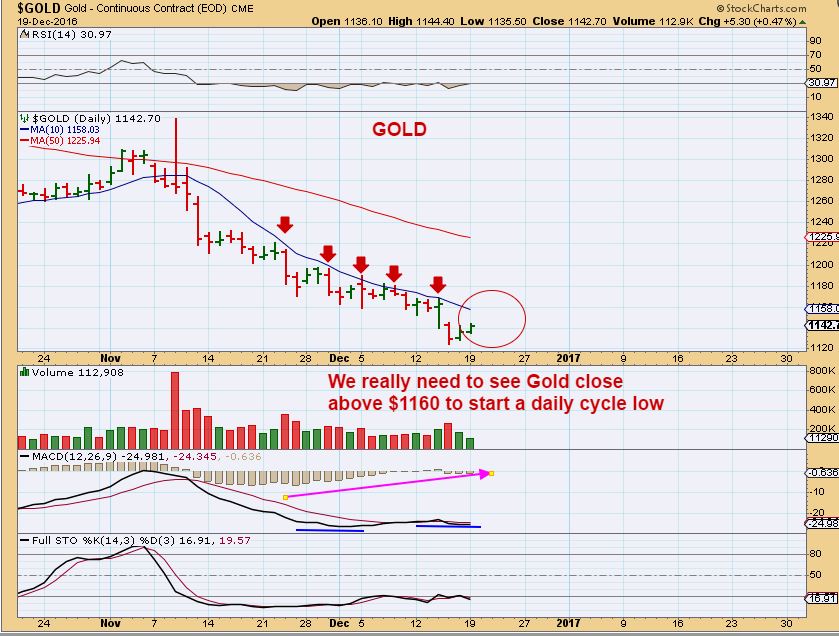
GOLD – Gold has slowly moved off of the recent lows again. CAN it break above the 10sma this time? We are looking at $1160 Gold to get above the 10sma. $1124.30 is the recent low. Gold is very weak when it cannot overtake the 10sma for this long of a period of time.
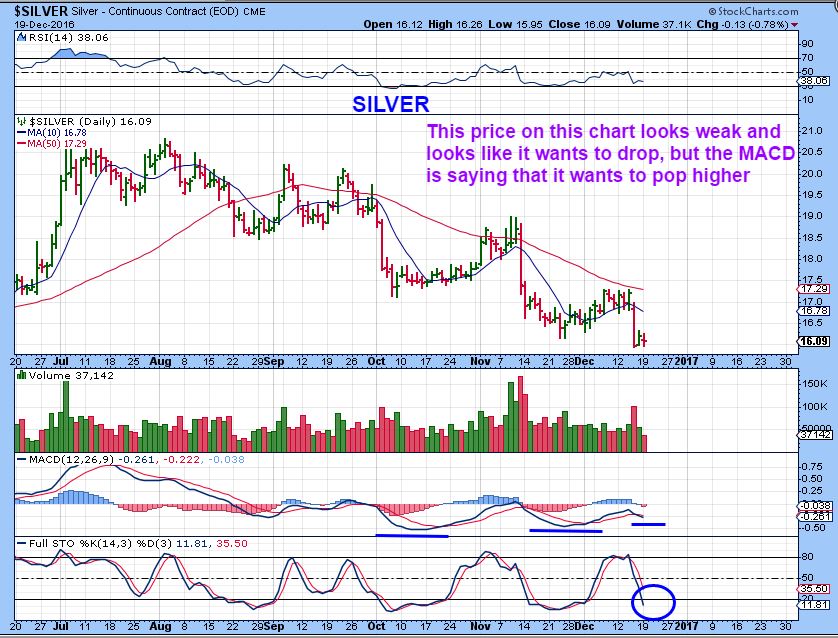
SILVER CHART #1 – Silver looks weak here.
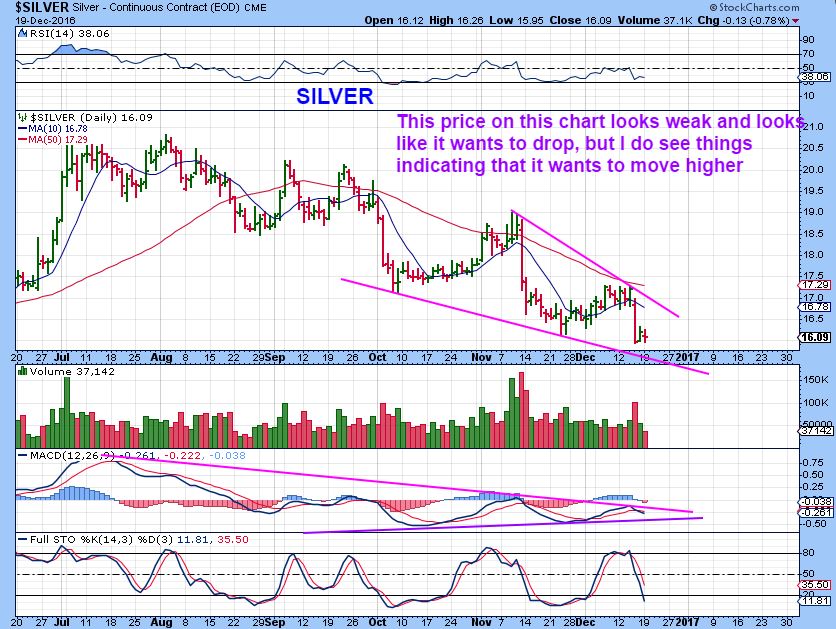
SILVER CHART #2 – We could be seeing a wedge form with the recent lower high, but as you can see, there is room for silver to drop lower and still be forming this wedge.
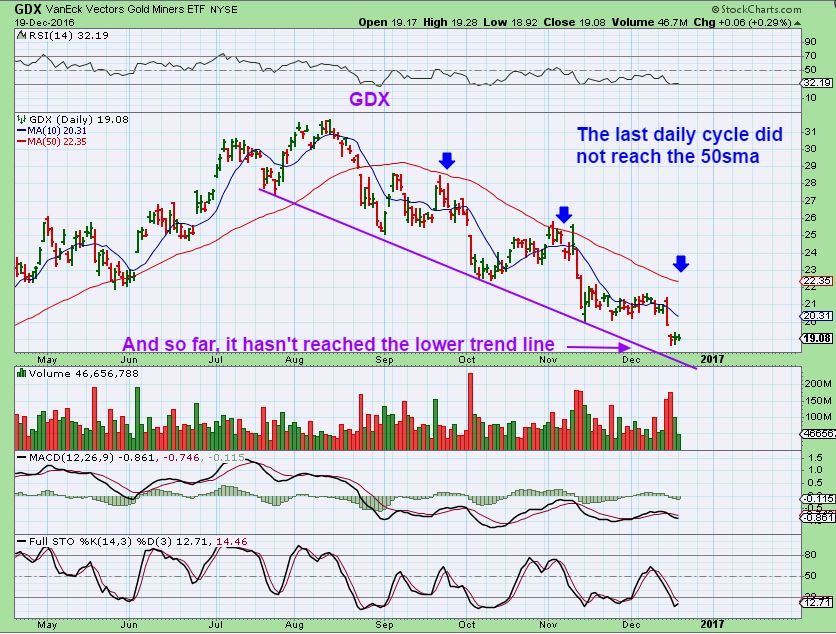
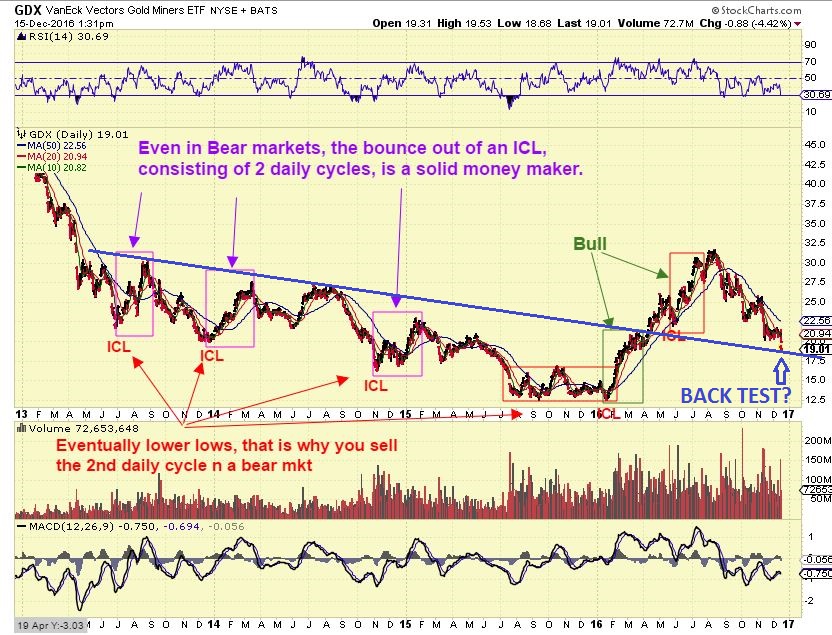
GDX – GDX has not reached the lower or the upper trend line at the 50sma, like the last 2 daily cycles did. There is room to the downside 🙁
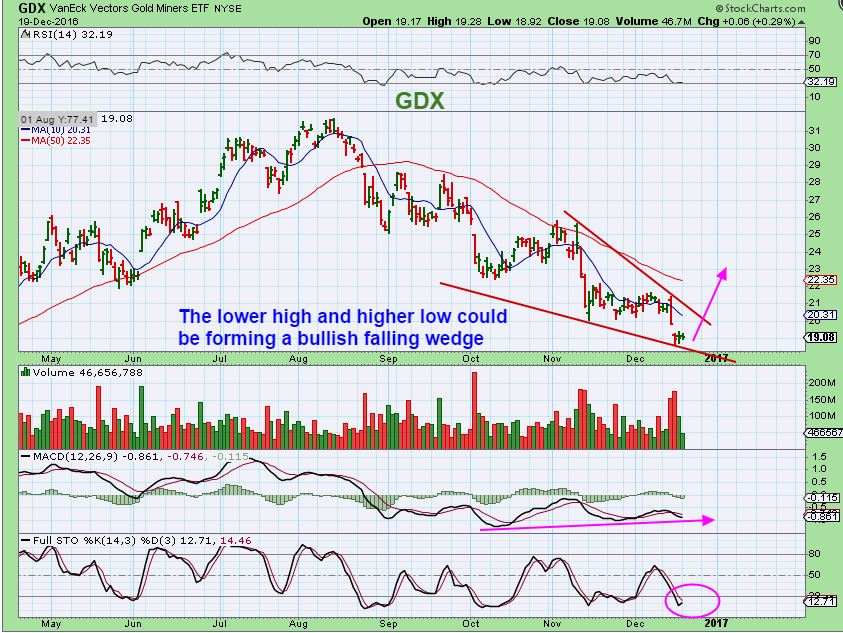
GDX – With that higher low and lower high, we actually see a possible bullish wedge forming. Gdx could drop slightly lower and still have a wedge forming. The above chart shows that it can drop toward $18 area to tag the downtrend. So far, this is just weak, buyers are rare.
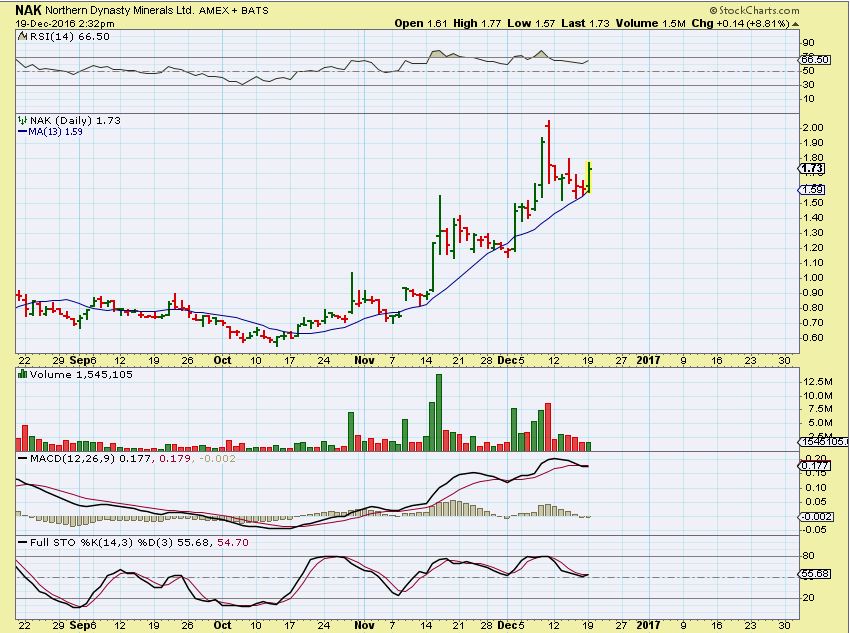
NAK continues to act correctly. Dec 15th we saw it moving in a similar manner that it had during the last consolidation.
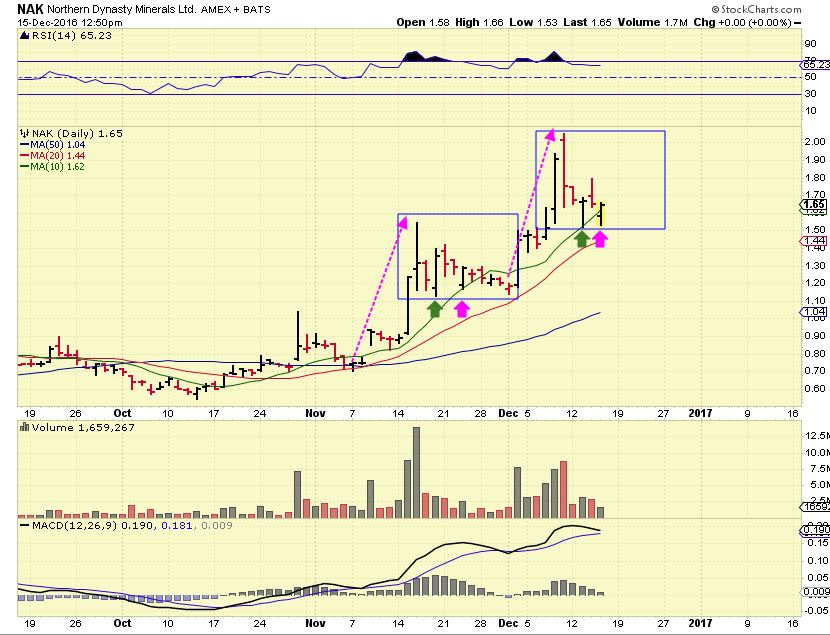
The 13 sma area seems to offer support
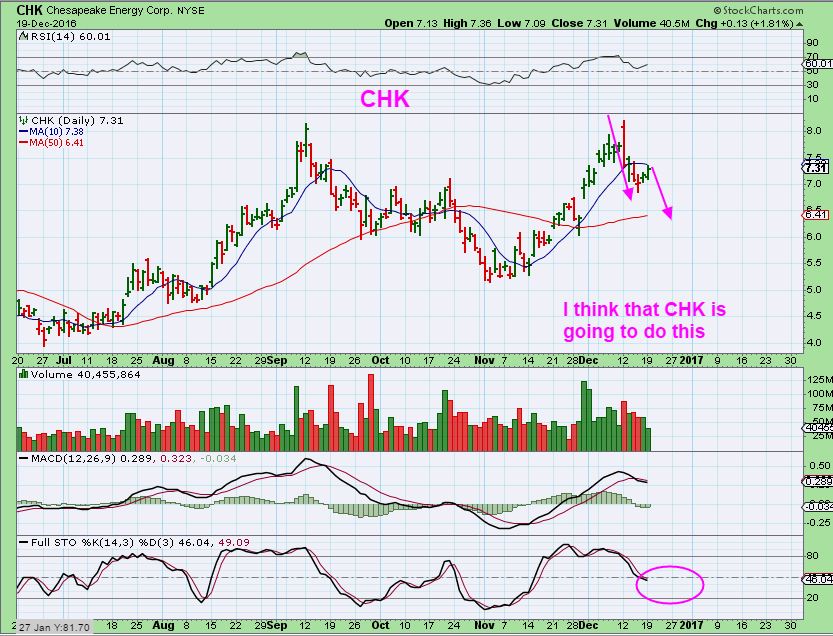
CHK – I would expect CHK to drop to the $6.50 area before continuing higher, UNLESS it gets above the 10sma on this try.
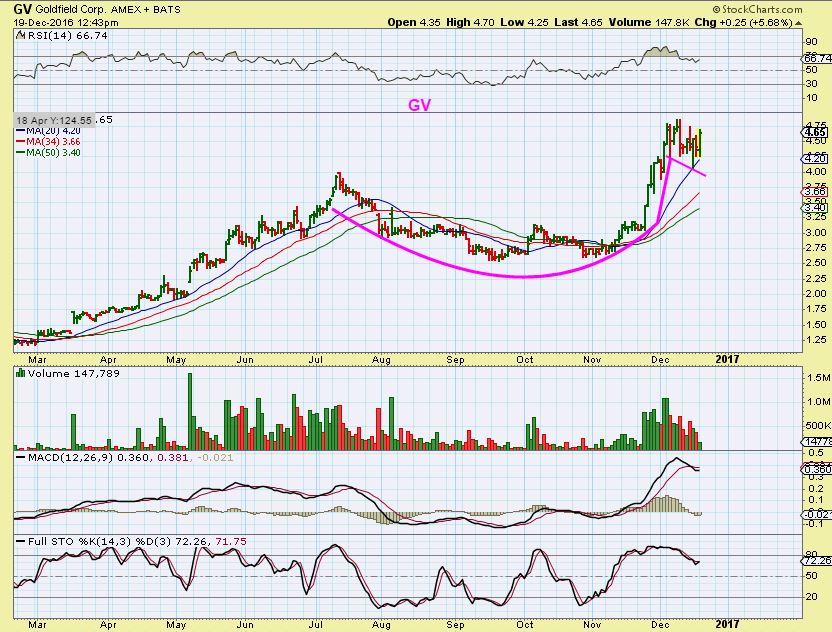
GV – This stock was mentioned weeks ago as a possible break out that would form a handle. It is forming a handle now. Volume was rather low on the reversal Monday, so the handle consolidation phase may not be finished, it remains a good set up at this point however.
The next 2 weeks are holiday weeks in the U.S. and combine that with possible tax selling and other things taking place, I have to wonder if we will be bored to tears waiting for some good solid action to present us with trading opportunities.
If you were here last year, then you know that last December was rather similar. January saw the stock market selling off for the entire month, but from mid January to May, many Mining stocks doubled, tripled, and some were up 500-700%. It was an amazing period of trading in Energy and Precious metals and we made boat loads of money hand over first. Low risk set up after low risk set up kept forming week after week. I am certainly hoping for another Low in the precious Metals like that! Miners and Energy stocks were setting up perfectly and acting very orderly, so they were very easy to trade. Entering at the lows and riding long moves higher for days and weeks at a time is when all of this ‘patience’ and ‘perseverance’ near the lows pays off. We were able to just ride trending stocks higher.
Gold, Silver, and Miners have been selling off into a yearly cycle low and when that low finally puts in an ICL / YCL, we should once again have some very nice trade set ups to ride higher. I dont want people to lose sight of that, because as I mentioned in the weekend report….
Even in Bear market rallies, GOLD & GDX has 2 daily cycles out of an ICL where good money can be made. In Bull markets it is a very profitable time period. Charts below are of simple bear market rallies once the ICL is in place.
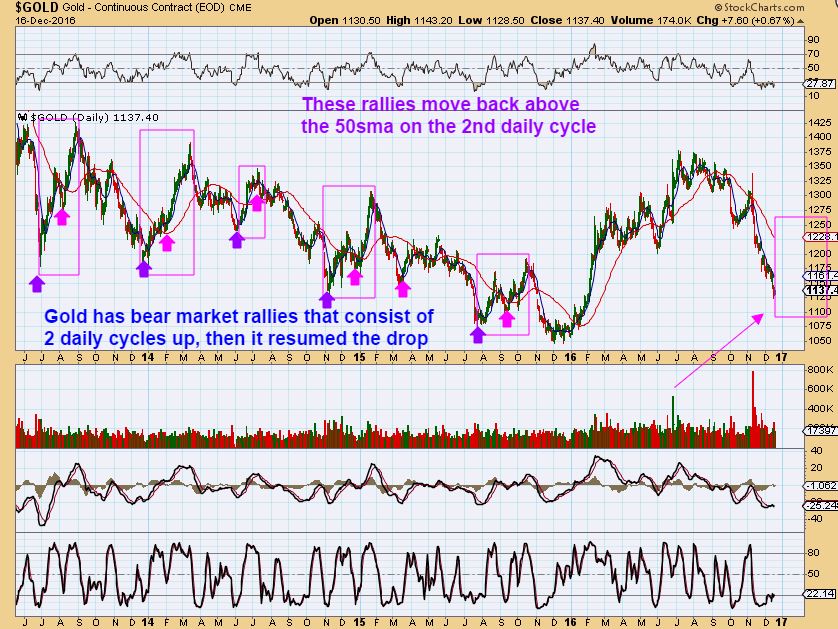
If we start a Bull run after the recent sell off , the rally is a steady climb higher. An ICL will present itself in the near future, and the move off of the lows should be a money maker. Lets remain patient and vigilant. In the meantime, traders can possibly make some money in a few of the other trades pointed out in my reports recently, perhaps in Energy or Industrial Metals. Enjoy your Tuesday trading.
.


Although I am guilty of using the word “hope ” many times, I hate the word when it is used in conjunction with markets; it implies that I am depending on some exogenous force to bail me out. Anyways, I “hope” things work out.
I only have hope in regards to miners and gold at this point? What else could I have? Positive technicals or fundamentals? Nope! When you remove the impossible (gold actually going up), everything else is possible (hope). 😛
Thats why I was referencing World War Z and the 10th man back in October. What happens when everyone is thinking the same thing (ICL at the time)? There still is the chance that we go in the opposite direction.
I ‘Hope’ You’re right 🙂
Alex, on your chart directly above in GOLD. Are we seeing a retest? What event or policy woill cause the USD to roll over and show some serious weakness? Anyone?
Guaranteed the real “reason” will become known after the fact
I think we’ll need a large scale fundamental change to usher in the gold rally. Technicals don’t matter, if they did gold would have at least moved up by now. Market will have to top out or some other large change that cannot currently be foreseen.
The market could top, I know Alex has been saying it might. I suspect the miners are going to go to at least a 78.6% retracement. We are already past 61.8% fibo.
Hey Bill- I have to run out for a bit. Do you know what that number is off hand? thanks
The SP is at 2265.30. The miners at 18.61 about 70% retrace
Low for gold was 1122. Looking for that low to hold. Currently 1127.
Double bottom on the miners holding for now.
*undercutting the 61.8 fib is the short ‘juice’ that is needed to support a giant wave 3….
*generally
**not investment advice
**meow……………………………………………………………………………………………………………
Show me a chart where that happened. #HB! BTW, I went to TH last Thursday and loaded up, no line! 😮
nice…JIT for the festivities…
#AnnualPartyThatWasnt
imAtWork
im half thinking of stopping in boston on my way down to FLA for my month vaca …. just to try that beer–
*not to see u or cf
#gross
What are you retired or something? #HB. Go to TH on Thursday, best chance of not getting a line.
workin on it.. this is my ‘test run’ ;o)
So, you’re heading back to my part of the country…it is too hot here! But, I would rather have that than the cold/snow elsewhere!
Ill take it as well. Supposed to get UP to 32 degrees today! #Brrrrr
Do you have snow?
We had 7 inches of snow this last weekend. Have about an inch left. just cold
not until mid january 😉
If you get to Vero Beach…stop and say hi!
-13 on sat here. gonna be a heat wave today 45.
Do you mean a retest of Golds low 3 days ago? It isn’t necessary, but it hasn’t broken yet either.
The USD has had a very bullishly set up weekly chart for a while, and of course the YEN has just been selling off endlessly. Many times when this happens, everyone looks for a specific current reason or catalyst for this to change, and even though we don’t see one, it just happens at extremes.
It was the same with OIL. You may remember that when we caught the lows in Oil last February, EVERYONE was writing articles about how Oil could never trade above $40 again, fundamentals were too weak, Oil supplies too high, Rig counts too widespread, Fracking would take Oil to the lower teens with an oil glut, Oil would never rise again, etc etc etc . So when sentiment gets so extreme and everyone throws in the towel, it moves higher and by that time, no one wants to believe it as more than a bounce.
I see it happen again and again, and each time things get so extreme that it becomes unbelievable again and again.
Gold is breaking down from the current bear flag. I’ll be stopped out of the rest of my new positions at the open. Likely going back short as a hedge. Two possibilities, 1 is a measured move to complete the Fed slam, the other is complete boredom through the end of the year.
I’ll be running back through yesterday’s report if setups to find somewhere else to park a few bucks (thanks for that!). NAK will be my only remaining non-Core miner position in about 57 minutes. Still holding core, can’t face that loss until we at least get our overdue BMR.
Alex, what are your thoughts on MEMP here?
Well, I said that I had a mental stop at the 20sma, so I got stopped out 2 days ago.
It doesn’t really give me an idea of how far it wants to pull back ( or not). volume is not heavy on the sell side, but it isnt
moving any higher. I just took the loss , because it wasn’t acting as well as it was when I took the trade.
Doesn’t mean that it won’t, just that it isnt, so I stepped off .
Just a quick thought – Yes Gold sold off and Miners are down pre-market, but so far the recent lows have not been taken out.
On the charts, I mentioned that we are looking at a low in Gold of $1124.30
Silver took out the lows that it had in place from last week.
GDX low is currently at $18.63 ( refresh).
.
https://uploads.disquscdn.com/images/9d803737b83464ef146a39c41c5ffbe4cdef6b2feb30c4c70b63973a423d8b68.jpg
…and WTI just …keeps…going…
Alex
Is the USD 105 target chart above an example of Wm. Oneil’s theory ?
Sold my BCEI a day early and only wish I’d been so lucky with my miners!
I am getting lots of pre-buys, my acct is far less negative, and I have an hourly buy on JNUG! Evenso, all of my positions are still negative. Also the first hour has past. This is a touch of rational optimism. Stay tuned.
Things are slipping back – less optimism than 14 minutes ago.
Been away. Things are picking up. My acct is still red, but 25% of what it was at the worst. Lots of hourly buys, some daily, 6 of my stocks are green for the day, GDX has a long bar up, on my 10 min chart, JNUG is green. I am not buying, but I am not selling. Maybe today was the final shakeout?????
beach boyz singing in my ear …..
*wouldnt it beeeeee niceeee …bah bah bah bah bah bah bahhhhhh
My acct is green, tho half are green, half red. My NAK and DRD are on daily buys. ALL of my stocks are on hourly buys!!! Still not buying and certainly not selling.
Yes, many miners reversing losses today .
I guess “they” like to keep us hopeful and hanging on ? 🙂
MEMP is getting a bid.
This doesn’t show up in GLD. No buyers there?
LOL
Watching Gold drift around and suddenly it just rocketed out of the lows.
With some volume.
GOLD LIVE – REFRESH – At least it wasn’t a spike down, right?
.
https://uploads.disquscdn.com/images/bee432d7baab8a006ad660bc41d7683c194048f9ccd107f1c2e7364b1ab38587.jpg
we’ll take it
And a little follow through, so I can walk away and go eat a little lunch, please 🙂
man u r like brad pitt in oceans 11 ….
*always eating
Correction:
# always starving
cover shorties……cover..
From yesterdays report
PACD – – Use the 13 sma, and it is acting correctly and has nice volume too.
CENX & FCX looks pretty good today too.
NADL still ok, but went red today
how much lower can we go here?
updated Weekly chart showing GLD histogram extremes.
only been this low for 5 weeks since 2008 crash, and that includes last week.
https://uploads.disquscdn.com/images/95bacc053da6785532fa0cac94b5c5d55591f398eec84f599f66a1e8520d7c14.jpg
Good stuff SOG
Doesn’t this show 2012 and 2013 we hit this low too? Maybe I’m misunderstanding what you mean.
Good chart for showing the extreme though
those 5 weeks i meant, were…
1 week in Dec2011
3 weeks in Jul-Aug 2013
Last week.
and … the first week of entry to those extreme levels was also the weekly low on both occasions in 2011 and 2013.
so last weeks low should not now be breached if we are to follow suit for 2016.
Oh! I misunderstood and thought that you meant in 2008 we stayed down there for 5 weeks . Sorry about that.
“… This low for 5 weeks since 2008”, I thought you meant it spent 5 weeks this low in 2008
Didn’t we all say that 5 weeks ago?
.. and now we 5 weeks closer to the bottom than we were then 🙂
And HMY, AUY, EGO, AU, DRD, RIC all looking progressive.
Buying a little this morning. Looks like the double bottom GDX is holding.
u like those bottoms…
#HB
Yes, the double bottom must be equal and hold firm! #HB
I tried HMY too early as an OCT laggard thinking ICL was Nov. It was pure death. I’d recommend all stay away.
Some didn’t break Oct low until Fed day. HMY sets a new low every day. There is just better out there.
As mentioned yesterday
There is something almost bullish about DRD lately
If I recall, was it also one of the “early” ones to get moving last year?
Yes, the African Miners all took off and ran very well from the summer of 2015 or Novemberish , not January .
Look at HMY, DRD,SBGL, AU, GFI, SGL
OBV is moving real higher – insiders knowing something is happening ?
Every single stock pick from yesterdays report went higher either yesterday or today. AREX still not that impressive though
CENX – the best one today up 12%
FCX looks good too.
Bought CENX yesterday so I did something right!
I bought WRN – so yes, YOU did something right 🙂
Congrats, and it looks like it has further to go so personally I’d hang on for a bit.
Dang….I should have taken a bite of WRN as a pure copper play yesterday. You did mention it but got sidetracked with FCX.
That could be a Very Nice trade CF !
I liked the cup & handle type consolidation on a 1 year chart, and It did end up perking up a bit today, but volume is light. I’d like to see a good burst of volume as it leaves the handle, so…
( I’m counting on you to Buy it up tomorrow) 🙂
I like the FCX trade too, and TGB & HBM are another good pair lately too
Cool. Thanks watch list for tomorrow……
Funny guy….
(not funny ha ha….)
excellent.. great job scout! :o)
https://uploads.disquscdn.com/images/4bd49095e684b53bfdd44f6e11b941b6e3f3fd52f6267bfe0bd617293a32ab4c.png
GST, PZE, TVIA, WG, PACD, ( And SGY) interesting charts for various reasons.
I don’t want to jump too far ahead, only to find disappointment, but….
– If GDX closes in this area with this reversal,
– and then we gap open in GDX tomorrow
– that would then give us an Island Bottom 🙂
.. oh yes … please jump….
*off a bridge
This is looking pretty good to me.
So. Many. False. Starts. More penalties on GDX than all the NFL games I watched all weekend.
kendawg…. do u have Nak in 3 of 3?
*or anyone can feel free to chime in… thx
AQMS seems to be in the same wave pattern as NAK…. ?
Oh wow – A giant inverse H&S on a 1 yr chart. That is a nice chart ( Sad volume at times though).
I love NAK, it sells off every morning and acts like it has no gas left in the tank,
and then by the close it ends up green.
yes… it’s definitely working hard for mommy & replenishing the MariaFunJar that was skimmed 2pay4 my FebruaryBirthdayAdventure …… 😉
To be honest I haven’t looked at it EW wise but my quick glance at it:
Yes it does…..unfortunately top of 3 of 3 was the high at 2.05 ? I see 5 waves up for 3, currently in a corrective wave 4 ?
But this thing is all over the place so……..I am tracking Gold / Silver / GDX for actual buy sell signals.
What do you see ?
maria*cat
did you take the FCX trade yesterday?
nope.. super busy at work training my replacement — :-X but I am watching u ;o)
cant just jump into a trade – need to study a chart & FEEEEL the waves b4 i can take a position… UNLESSSSSS of course i have traded it b4 & familiar w/ the nuances & personality ‘dis order’ lol annnnnd am keeping watch w/ the eyes in back of my head…stalkerStyle ;o) then i do feel comfy to pounce 😉
still In nak, & some aumn, trx, have skimmed, trimmed & trailed where/when i could; not so fun to witnessing the “shrinkage” off my highs (cue Seinfeld) buy mommy’ very happy w/ the good chunk she skimmed from energy 4vaca ;o)
….mostly working on my discipline like a goodgirl -….waiting patiently to deploy …..
I still struggle w/ whether or not to hold thru shallow “4” corrections … I just never know if/when i will have time at work. ie. was interrupted 3x just trying to type this…. lol. looking forward to being ‘old’ & retired like u… HA!!
LifeIsGood 😉
Yes You can then take naps in the afternoon as I am about too…. lol
I understand the need to “feel”and “see”the chart before pulling any triggers.
Dow a tad below 20,000 and the VIX at the lows… should be ripe for a reversal there soon.
TVIA, GLF, BCEI, FELP, PZE, GST , good energy performers on my list
Kind of like that GLF 1 yr weekly chart a lot. Great volume out of the lows.
Man, I stopped out of almost everything early this morning just to watch it reverse. Just to guarantee I sold at the absolute lows. GPL, AUMN, JNUG all well, well below closing price.
We’ve been oversold for so, so long and $$ higher after day, cycle count is so skewed it’s gotten completely useless, etc. I am completely out of Hope, which I all I had left. So, I’m taking a break. I’m not gonna go chasing anymore. I need to quit for awhile. Just sit on my hands until my hope jar refills itself. Preferably, with Benjamins. Until then… https://uploads.disquscdn.com/images/feea6d2fc9f6fc669ae9ec4964d3c6bcba216b91a3e6d2f68f810f1bb7930220.png
You’re funny.
Ok, so I didn’t stay away for long. But this isn’t about stupid metals. Nat Gas is currently in Wave 2 (down) and should hit DCL shortly. I see btw $3.20- $3.25 as a pretty good buy point.
Weather for end of Dec and early Jan is coming in warmer but the recent cold should put total US gas storage below the 5 year avg – been a long, lonely time for that one. A big cold snap in Jan could get us btw $4- $4.25 nat Gas during Wave 3.
Lol…
API report showed significant draw to U.S. crude inventories…EIA comes out tomorrow…..
New report posted