
Tuesday Dec 13 – A Pre-Fed Hike
We are one day away from the FOMC meeting that is expected to result in the first rate hike of 2016. After a quick review of the markets, we’ll discuss some action in the markets Monday that may be of interest to many of us.
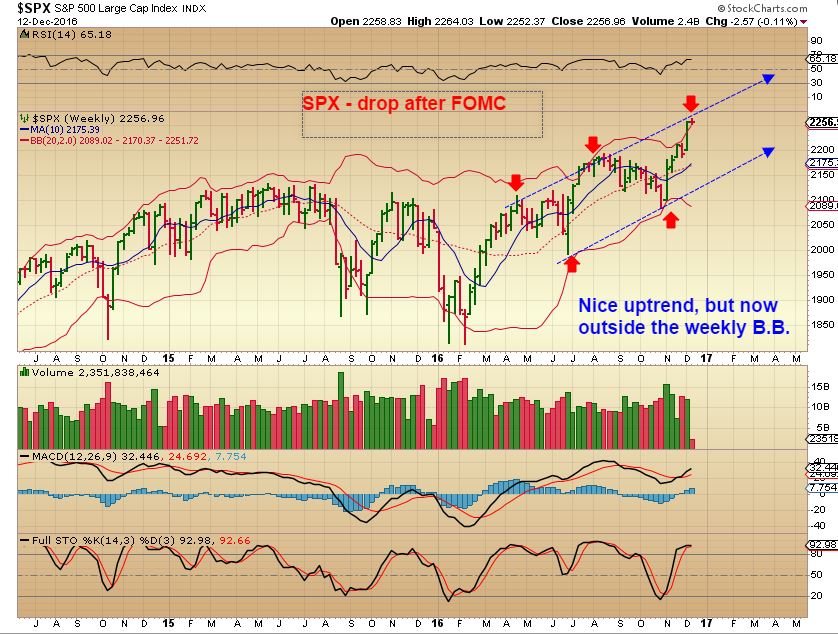
The general markets ( SPX, DJIA, NASDAQ, IWM, etc) have been on a tear since putting in their ICL in early November. They are pushing on and riding outside of their Bollinger Bands too,so since they are a tad extended, they could drop down to the 10sma like they did at the end of November. A deeper drop from a Fed reaction could send it down into a DCL at the 50sma and back test the break out. Do you know what happened when they raised rates in Dec 2015?

SPX DEC 2015 Rate Hike – The Market was dropping heading into that day, and it reversed and drew people into going long and turning bullish into the end of December. It then sold off in January 2016.

SPX WEEKLY – I would expect the markets to pull back after the FOMC meeting. The VIX is very low too. Very experienced traders could attempt a trade in TZA, SDS, and other ‘short’ trades, but the FOMC Wednesday can get extremely volatile and you must be ready for that.
USD – I see weakness here near the highs, but with Fed Wednesday, anything can happen. We are only on day 3 and I do expect the USD to roll over shortly to seek out an ICL, but a nice quick POP to new highs after the Hike could fool the bulls and draw them in first. We could see a move similar to July. The USD does look weak here.

WTIC – This was the Oil chart from Friday. I wondered , “Would Oil break out or dip down and build up more steam to burst higher?”
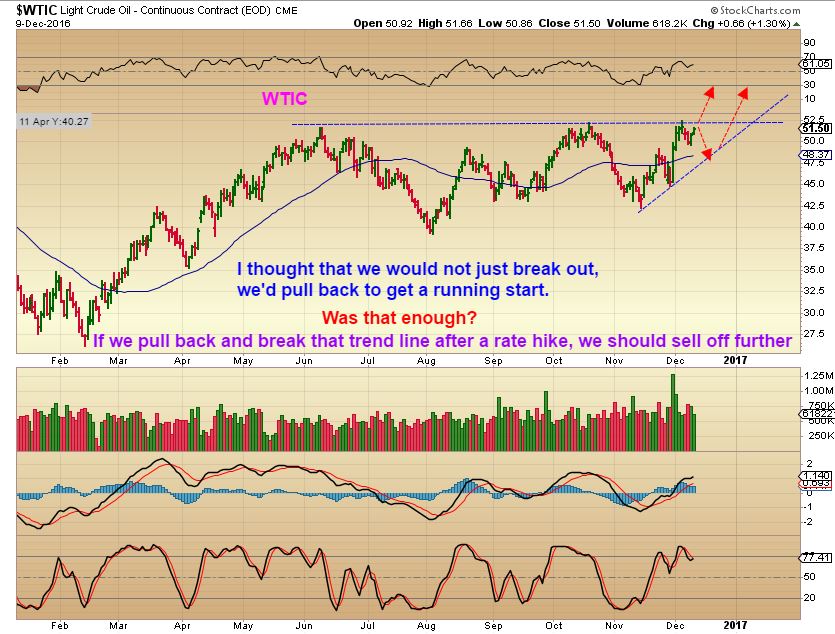
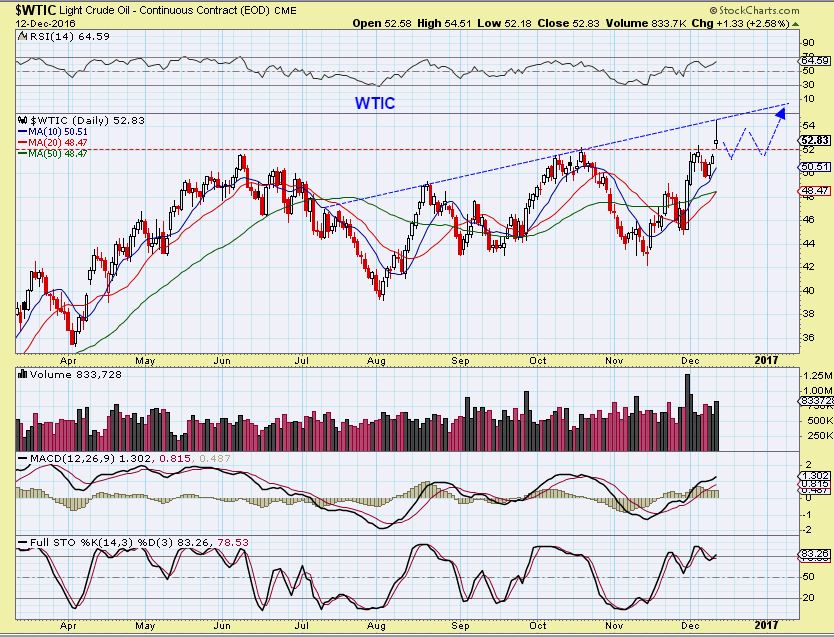
WTIC – Oil was up over 4% in a break out move overnight. As the day went on, Oil pulled back and we see a reversal candle that usually occurs at tops. I drew in the blue resistance line and that held Oil down. So we may go sideways and build more strength before we get some some solid follow through.
XLE actually broke out a while ago, and it also put in a reversal top on Monday. I have drawn what could be a back test and a sideways move before energy resumes its upward motion. Both Oil and the XLE could also just tag the break out and run higher, or drop back inside the channel and become a false break out. What to do in that situation? Tighten stops or sell when you see a reversal candle after a long run higher and watch how it plays out.

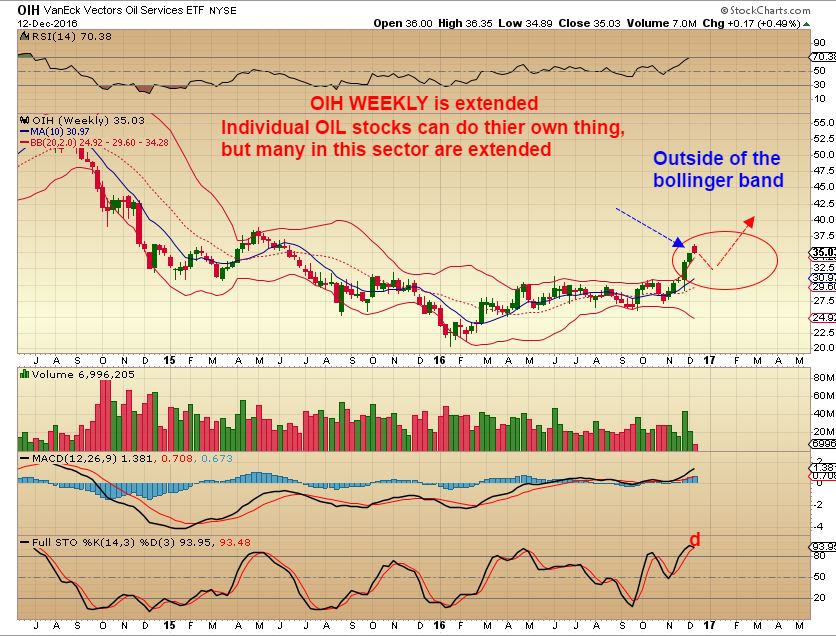
OIH WEEKLY – A black candle appeared on the daily at the top of a long run Monday. That is a reversal candle. Here on the weekly chart, we see it is outside of the B.B. completely. We should expect a reversal and a dip in many Energy stocks. This should become a “buy the dip’ opportunity.
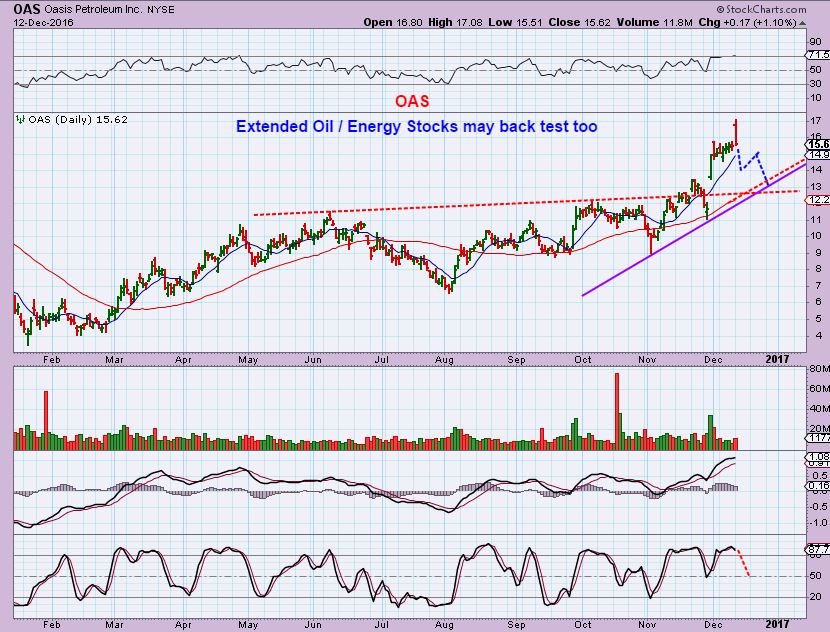
OAS CHART #1– OAS is an example of an extended run. It just ran from $9 to $17 in a little over a month, so I would expect it to drop back to the break out area ( $13ish). If you know of other Oil stocks that put in a reversal after a strong run, they could become buy the dip candidates in the near future. This sector does look bullish so far.

OAS CHART #2 – Here is a visual of that ‘dip’ and then it could move to above $20.
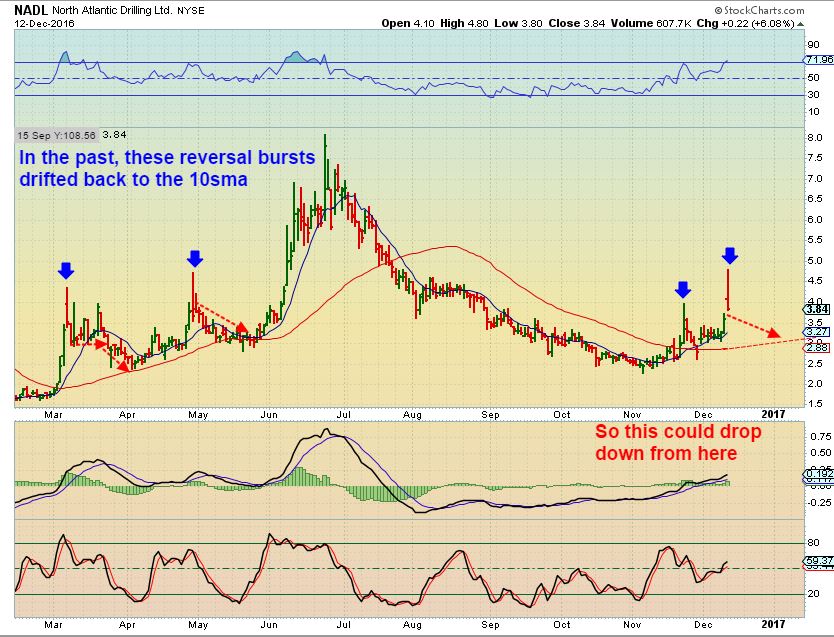
NADL is an energy stock that is not as extended as some of the others. It could pull back or it could also continue to move higher. It did also POP and reverse Monday, and in the past when it did this, it would often drift to the 10sma or 50sma ( see March and May). I think that various individual Oil & Energy stocks may each act individually if oil just goes sideways, so you will need to decide to sell or hold and see how it plays out if you own some.
 .
.
GOLD, SILVER, and MINERS
.
GOLD – $1152.50 on Day 45, and we are OVERDUE for that ICL. Fed Wednesday now looks Bullish for Gold, simply because we are so overdue for a Meaningful low. I do not know exactly how Gold will react on Wednesday, we have seen false moves and spikes in the past. Gold HAS NOT closed above the 10sma yet, so we HAVE NOT had a dcl yet. This causes me to expect a run higher.
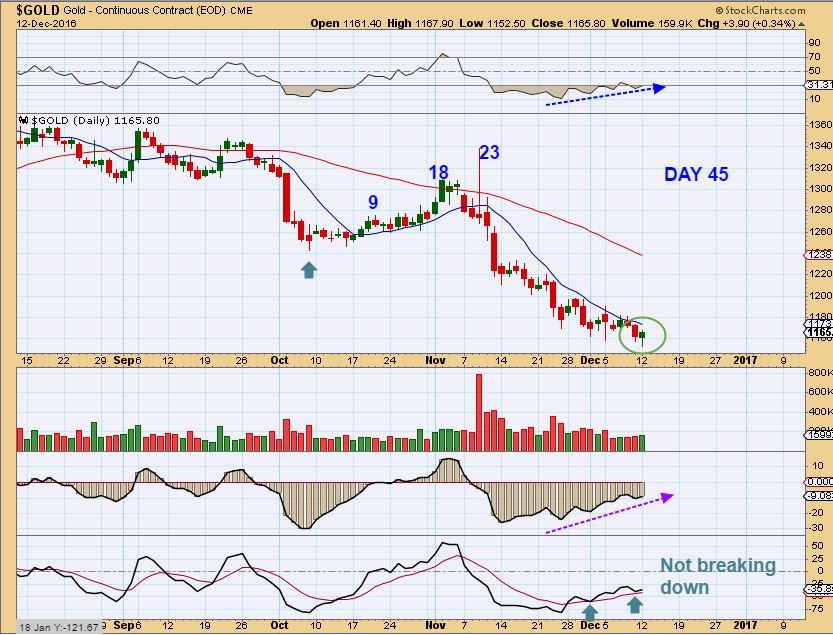
I personally think that a break toward $1180 is going to signal that a low is in place. This is a wedge that is bullish with a break above the upper line.

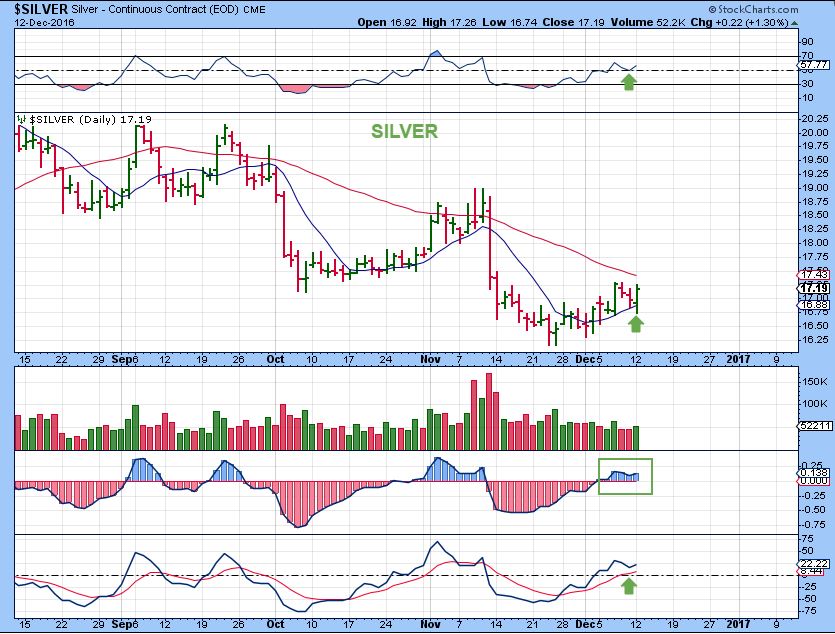
SILVER – Again, Silver is leading Gold, and has broken above its 10sma and even broke down and recovered it again on Monday. Both GOLD & SILVER now have reversals in place.
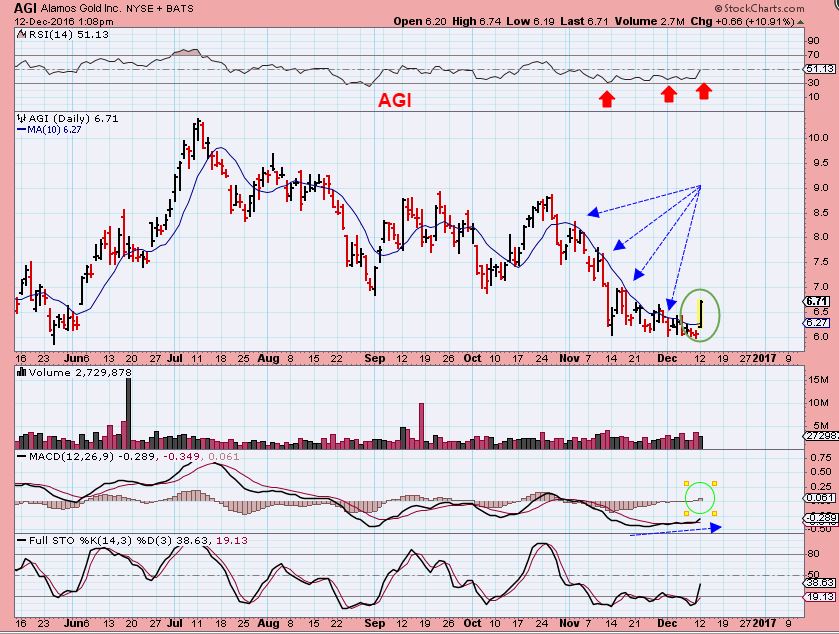
GDX didn’t do very much on Monday, but some individual Miners were actually acting rather bullishly. Is that encouraging as we look for a low? Yes. Could they still get whipsawed around on Fed Wednesday? Sure, but while I’m looking for signs of life to develop while we are in the timing for a low, the following Miners are a welcome sign. These charts were captured Midday. They had higher volume and looked even better at the end of the day.
.

DRD at the close- This looks like such a BUY! It looks ready to just burst above that 50sma and run higher.


GPL ended up closing the day with 6 million in volume

MGH – MGH ended up with almost double this volume by the close, and closed above the 50sma ( Not shown)!

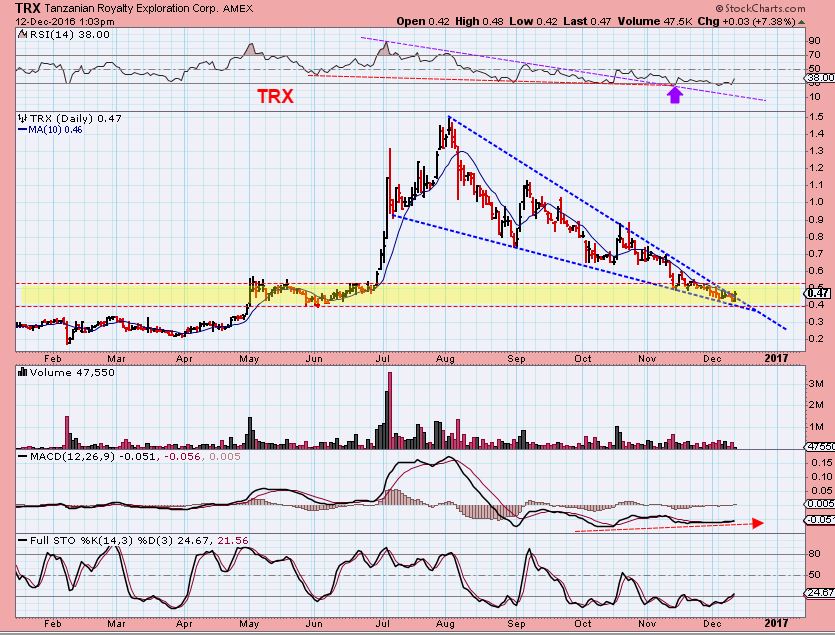
TRX – TRX was up 7% , but it doesn’t look like much. If TRX breaks this wedge to the upside, I believe that we could see a repeat of June. No promises, but we did buy this last summer and it ran up about 300%.
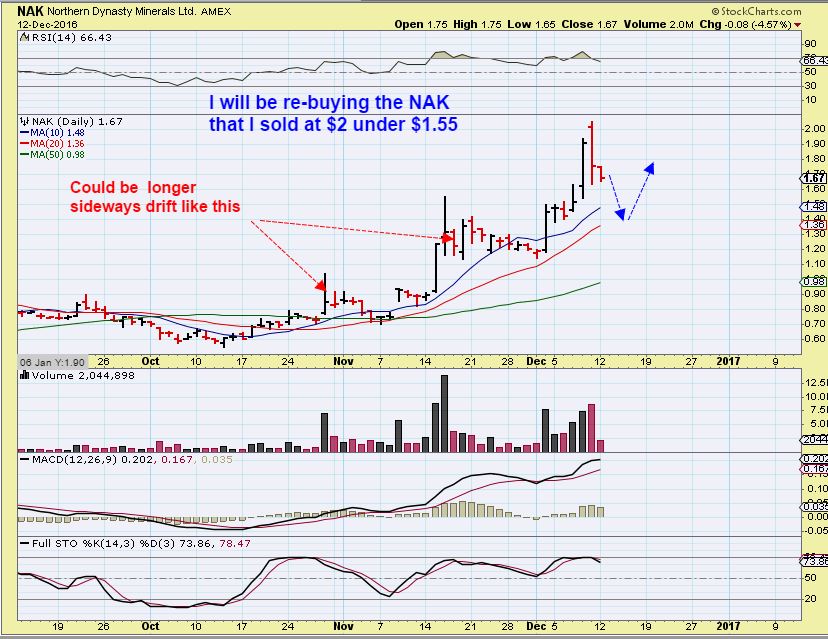
NAK – I mentioned that I sold a portion at $2 and I said that I would reenter when it gets to $1.55 or less. We could be there tomorrow or Wednesday. Prior moves lower were a lot more sideways, so this also could unfold that way.


Thx Alex.. the length of this pullback has been rather excruciating… I have to assume many have thrown in towel and moved to other sectors. Do you expect retests of this years highs in this ICL for most miners?
Hey Rm,
” … the length of this pullback has been rather excruciating… I have to assume many have thrown in towel ”
yeah, to put it mildly, but I do think that patience and waiting for this trade could be a big winner for many here.
I do think that some could go back to 2016 highs, especially after watching the moves that X, FCX, AKS just made. I would say a stock that only pulled back 50% should be able to break out above the former highs if things get going and the BULL in precious metals remains in force. . Look on a 1 year weekly chart of GPL. I would say that it could complete making a cup here in this intermediate cycle., or even break out higher. A set up like PAAS could break out too, and back test later.
They actually could move out of these lows in a similar way that the industrial metals did, and that looked like this….
( refresh). In that case, you’d get what we see on the 2nd chart attached. After looking at these charts below, take a look at a 1 year chart of AKS. Miners should do that if we are still in a bull market after a crushing drop like we have been through.
https://uploads.disquscdn.com/images/8b9c7020ed57af7e231cc599f1e3a7870a7482ec6f71301edf62a5756f4c6929.jpg
https://uploads.disquscdn.com/images/946b393f9c1314170dbfd70ad79bb29ac38d5826fa6737423b40fc207a1d0b58.jpg
Thanks.. this is why I have been patient and without leverage. I may add a smidge before fomc as a reward for being patient 🙂
Seriously, your patience should pay off. I did end up losing a little dough n my leverage play, but more than made that up with NAK, GPL off of Oct lows, and a couple of energy trades so far. As for Miners now…
I don’t like to shout from the roof tops that we absolutely WILL see miners break out and fly 100-500% in the next move, ALL ABOARD, until I see is the Bull remains ( And I think that we are seeing inflation in prices and it should remain). At the same time, they certainly could do that.
I do not want anyone to miss this move or even sell too early , once they make 20% or so.
That is why once we get a turn around, I will post charts like the FCX or X charts to show the potential moves and how possible they really can be.
DRD – Moving higher again on what looks like the same volume as yesterday .
Many Miners green 🙂
Agree. My JNUG and GDX are flat. I would like to see more.
Seems as if the indices like GDXJ want t break those November lows while stocks like GPL seem to be maintaining their upward momentum? It’s as if one is lying.
I know, I look at my account and see GPL, AUMN, and NAK last week and think that all is well, then I start looking at other miners or the Metals and they are dropping – it is a weird situation. Until we get the FED MTG behind us, I think things will remain a bit unclear to most ( I do think that LOWS are being put in, volatility still a risk on Wednesday).
strong open for equities
Wouldnt it make sense to see DOW 20,000 as the Fed raises rates 🙂
Then general markets outside the B.B. on weekly charts could conveniently pull back as the Dow tags or breaks 20,000
Maybe
Internals weakening is a good sign, start strong and finish weak
Agree, the weakness could become more apparent and especially if someone looked at the VIX and TZA and thought they wanted to try a ‘short trade’. This gives them time to really check it out and look for another reversal off of the highs.
Crude Oil:
I will be selling the remaining USO Calls (50%) at the next unconfirmed daily swing https://uploads.disquscdn.com/images/dc3cdb4f95a01837410310c08abd81703060bff8cd70cc35e421618b0139eb0e.png sell signal, currently below the red dash line, most likely it will want to “fill that gap”.
Thanks for the heads up! Do you think oil could start falling into its DCL here around day 18? I’m not sure how oil has reacted to FED hikes in the past……or if it matters? I need to look that up….
IMO…..Crude is due for an ICL late Jan. or early Feb, 2017 so maybe one more DCL after this current one we are in then into that ICL ?
Alex concur?
After this current one we are in….so you do think this is going to be falling into a DCL here?
Very possible in the next 20+ days or so then one more DCL cycle into that ICL in Feb. ? This is Alex’s area of expertise so ……. 😉
Pretty much, but Oil is tricky for me when it comes to their ICL.
I have followed Oil for yrs and one thing that I do hate about Oil ( And I’m not exactly sure what the psychology behind it is), is the daily cycles can be 30-50 days and they do play out that way, and ICL’s?
Pull up a 5 yr weekly and you’ll see them. Bear market ICLs are brutal and long, bull market can be stealth and do they come every 6 months? 8 months? Once a year? They are rather unpredictable ahead of time due to the length of their daily cycles being so wide range ( I.M.O.)). .
So if we get a burst higher after another daily cycle low, 3 could be in full force and the ICL could be later with a faster drop in Feb or March. Real touch one there.
Is this what you have in mind……. https://uploads.disquscdn.com/images/4d849783881a5e3c7de8a5a87bc7493fbbf29b9cdf1658440b6058586818660f.png
No- If you go back 5 years, maybe use a weekly chart. You’ll see the difference.
The drop from Jan 2014 into March / April 2015 was all one intermediate cycle, I believe. I see no ICL from Jan 2014 to about March 2015?
Is this possible? https://uploads.disquscdn.com/images/281b2a60755dbce3e6a25b7f66a5ea6b0e8fc0bf354418e00adf719d872cef9c.png
Yes, That is what I get, but look at Jan 2014 to March 2015 – That’s 13 or 14 months .
It’s Oil, it is tricky to determine going forward when the ICL will come, but here is the thing….it should come after the trend is broken. You often get a broken trend line & a bounce to back test it
That is why in October when that trend line gave way, Oil should have started a dip into an ICL, after a back test in my opinion, so that is what I expected.
Opec seems to have derailed it for another daily cycle….or two? Now we watch for Oil and see if it broke out & drops ( Fake out) or just back tests and runs higher extending the iii.
.
Gotcha…..
Heading out to work out now but could Crude then extend its ICL into spring of 2017 ? Assuming Feb. 2016 was an ICL ? Which means Crude is currently in the 2nd DCL in the current ICL with 2 more DCL’s expected?
Maybe? I would need to look into more and look at historical precedence too to get a better feel for it.
Sounds good. Thanks Alex.
Hey Ken,
I’m puzzled by the iii. Wouldn’t that make your iii wave WAY smaller than the i
If I look on a yrly chart and seeing the first wave from Feb lows is what I am looking at . Thx.
wave iii may Not be over yet……. 🙂
this is a micro count btw….
Gotcha – thus the stop sell rather than take the money an run sell ( possibly trailing adjustable stop).
Yes
GOLD & SILVER plunge a bit
DRD, GPL ASM ignore it.
ASM trying to break out off of the lows and over the 8 ema
EXK and FSM are on my list to get……they are actually green while others falling…
Ah, I see EXK had news come out….hence the rise…
Nice, right off of the lows.
I love how EXK dropped back to the lows, but the MACD did not cross down, it just tagged. I see that so often and it still amazes me how often they break through or tag at tuning points.
I was planning on getting this later in the day….but….now that it has popped not sure…..would have been great if that news had waited til after FED for me….:)
silver and gold phi slamma jamma pre-fed. Bonds up though. Miners hanging tough. Dow almost the most overbought in history on RSI. Commercial traders the longest in 10 year treasury bonds in 10 years, massively short copper here. Mutual funds now the most overweight bank stocks in history, bond sentiment at 0…..Just a small taste of the insanity that are markets today….
AUMN:
I just was filled on a buy at .71 …..
Stop just below the PSAR currently at .698.
The PSAR changes daily so you need to adjust the Stop daily.
Risky but Reward could be very good. 4% risk factor currently. https://uploads.disquscdn.com/images/0d4499fd14a9a23e8ab62f37a21df8f81195ec02c4b7665161a256246100b2a2.png
You could extend the Stop below the 50 sma too……which is not on the chart btw.
Refresh –
.
https://uploads.disquscdn.com/images/97cf3fe3dc0c1ea1386454d15919383e74aca48369c4f0cc3a2a69aca27e9538.jpg
Picked up some @1.55
I bought as I was posting the chart ( I still want to add a bit more to get me back to where I was before). 2 Things…
1. This could go lower since it broke the 10sma 2 times in November and went to the 20sma. A nice reversal off of the 10 sma would be a good sign of strength.
2. I’m hoping that it doesn’t just linger down here and go sideways like it has in the past after a nice run higher.
You can see in Nov that 2 times it just went sideways for 7-10 days. I’d like a post fed burst higher: )
Same.
I hey same thought (didn’t see chart until tonight) but missed it. I’ll put in a stink bid for tomorrow to try to grab in the potential volatility.
Alex, any thoughts on a good re entry for IPI on this pullback?
It looks like it could drop to the $1.75 area, but I’d have to see how it is acting when it got to that point.
It gained quite a bot in a short period of time, so it might consolidate or go sideways for a bit when it gets down there too.
Russel negative, not good
Alex: Help me with what I think I just saw on SLV HUI GDXJ and GDX and of course that potential nasty giant H&S pattern. On the weekly they all look like bear flags in a down trend which may be a continuing patten. I’m trying to reconcile what I see with an over due ICL. Like you (but probably less so) I grapple with the idea whether these are “true” patterns that suggest a bear market OR whether these flags suggest a meaningful stop run is in the cards. What a surprise it would be if the FED held off on raising rates.
Or saw Dow 20,000 and Industrial metals taking off and raised it .50 , saying
“We were going to raise 4 times in 2016 and didn’t. Now Steel , Copper, and other areas of rising prices are calling for 2 hikes in 1. 🙂
Any comment on those bear flags if that’s what you see.
Technically ( technical analyses) on the weekly charts, I do not like the set up. Yes, they look like bear flags.
My miners are acting correctly, so I am holding my miners with stops and have no leverage.
Thanks for that. Forgive the frustrating question:)
Well, it is what it is.
It does look bearish using technical analyses and is definitely trending down.
At this point we are relying on cycles timing and the thought that inflation could be increasing and benefit precious metals. Some miners are acting well (So far) Smart money decreased their short positions, sentiment is ugly, and a few other factors.
I really appreciate those thoughts. Helps to illuminate things that much more at least for me.
GDXJ weekly is absolutely a bear flag. Can only hope action this week invalidates that pattern.
I am causiously optimistic here. I like some of the action in many miner stocks. Obviously overdue for an actual rally
Exactly. But will it start tomorrow or Thursday or wait a whole month like last year? Hmmm..
If the Fed raises the gov interest on debt payments rise another 60 BILLION . . . .
The NASDAQ is just now breaking out and it is doing so on strong volume.
That is kind of interesting
Does SGY appear to be a low risk set up here? Nice bounce off the 50 day.
‘low risk’ as in – stop below the 50sma and accept the possible loss, yes. It could be a bull flag and may break higher, but if Oil sells off it may too.
Understood. Your post was clear. SGY just looked like a possible exception to the extended nature of some of these oil stocks notwithstanding a possible pull back in oil. Your focus is really on those PMs as of now then.
I bought MEMP yesterday and it is sitting right on the 10 or 13 sma, and is above the 20sma.
I’m hoping for one good POP and then I may sell it : ) Otherwise, it could get rather boring in this sideways move
Alex, don’t you think oil could move higher on the dollar rollover just like gold?
I do think Oil could move higher
At a gap fill at .81 ?
and that tags the 50sma. I’ll take it 🙂
So you DID get in with me. I will be watching what you do with this one!
I did, and its boring so far, and I hate it as much a s you 🙂
I am watching the 20sma on this one.
If it goes below that , I will just sell and call it a nice try
I’m in NADL, not in PACD anymore , and in MEMP , but I’m going to see if it can pop. It does have a nice rising MACD and o where near overbought.
What time frame chart are you watching the 20sma on to make a judgement?
This was interesting, and I am seeing sell off reversals in other energy stocks too ( Including my Nadl : )
.
refresh
. https://uploads.disquscdn.com/images/3c82ece973fc774662908f1f5a96407bc25c2cfa2f3b1d6125c2f45bf340e07d.jpg
Wonder why the big pull back in NOG compared to others? I don’t see any news…maybe just because it ran up so much? Good time to get back in? I had sold my NADL but got back in right before it popped up today…..:) Not sure how long I will hold….
USEG??
I had been looking at that one a couple of days ago and then forgot about it….argh
Me too, when CCJ, URRE, DNN, UEC, URG, etc were running – It was on my list.
Oh, I know why I stopped watching it….I made a note “volume too low” on my notes here….HA
You got me thinking: a surprise may come as a.50 raise given the extent to which long term interest rates have risen. I wonder whether they see a sudden and rapid rise in inflationary pressures warranting a larger rise. Might that accelerate the rise in the PM market (that may already be part of your discussion for tomorrow)?
Yeah, It’s tough to tell what they are thinking, but we sure did see a strong POP in commodity prices ( Copper, Steal, etc)
I’ve wondered about a .50 hike ….but wouldn’t that be worse for gold?
I think the initial reaction could be.
Initial reaction would be lower, much lower and quicker but that might not last, that’s just the initial herd mentality. The algos are gonna sell the news, probably.
Wow what a slow day
If anyone cares to kill time with a chart, here’s GDXJ hourly – Sure seems that “creeping” along the lower line of the Purple triangle means it may break thru to the downside. If it does, hopefully there will be more positive divergence on the RSI, which is above 30.
https://uploads.disquscdn.com/images/046590672f95381ce76a4aaca1f1bf2ee4f0d8e6d07b8a30b48341b0535845ca.png
seems like advances the last couple of days are weaker in nature and more large cap oriented. Is this rotation or just a weakening trend, market needs a pause.
Yeah, some of the momentum names have lagged, the last few pushes to a new high haven’t been all boats rising together. Not sure how significant yet or yet. This stock bull is OLD! BUT that hasn’t mattered yet so for now, follow the trend.
Something seems to be stirring in a positive direction. Maybe it is only a very short term rally in golds or maybe we can get something going into the close.
Well, I got a little bump the last hour, but not what I would have liked. I hope the Fed doesn’t do more than .25 tomorrow. I hate to think what .5 would do.
Apocalypse! Run!
I think it’s unlikely. Market hates surprises, they would have had to prep for that one.
.50 rate hike would be like……
https://uploads.disquscdn.com/images/ccb0cc51bf5c0b673de7411be31fa3eb6b8de51eafc2fde74aecbda816beaa75.png
https://uploads.disquscdn.com/images/1bb12db82f04c23442fc4ce53a6ab7c8f843554847e6c7beffb438be7df6dc64.png
hahahaha! 🙂
test
Good.
http://finance.yahoo.com/news/endeavour-silver-drill-programs-discover-115500289.html
Endeavour Silver Drill Programs Discover New High-Grade, Silver-Gold Mineralized Zones at the El Compas and Terronera Properties in Mexico
EXK, part of my coresume, finds more Silver, up 8% ahead of Fed!
GL tomorrow all. May not knowthe REAL move until Thursday or Friday or even January (if it follows last year). Stay strong and stay frosty!