
DEC 10 WEEKEND REPORT – Flying Low
The general markets are flying high, but the Precious Metals are still flying low. Let’s take a look at last weeks market action.
.
SPX – Please read the chart
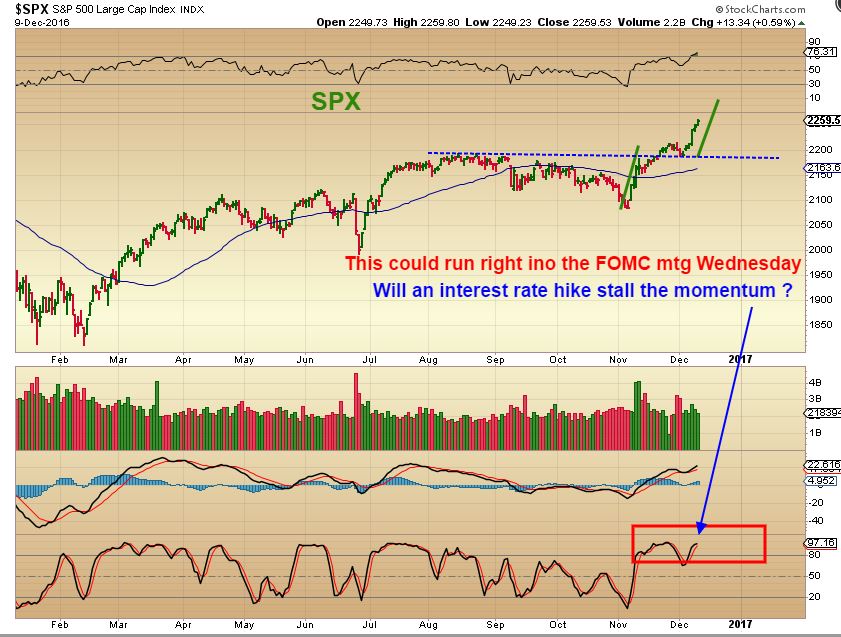
SPX – crazy potential target.

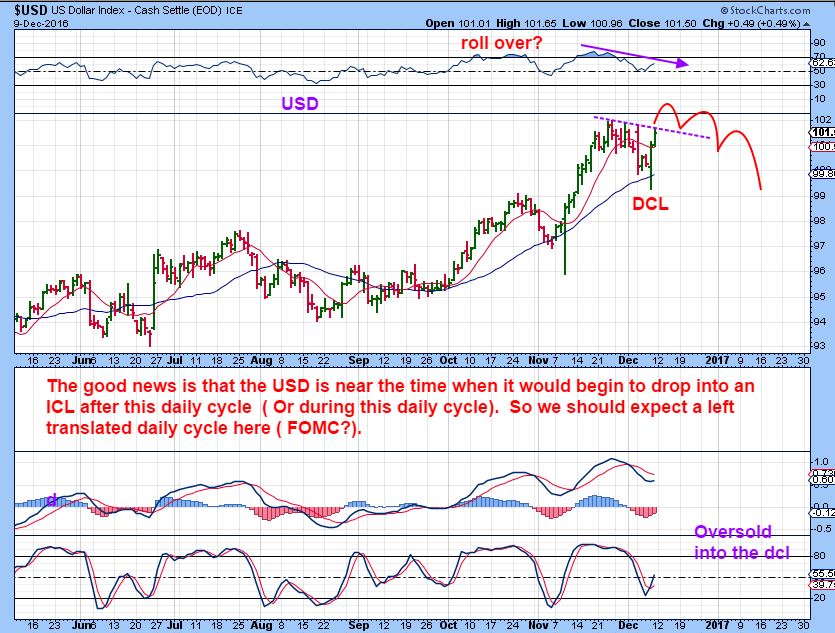
USD – The USD looks like it wants to break out. Please read the chart about its timing.
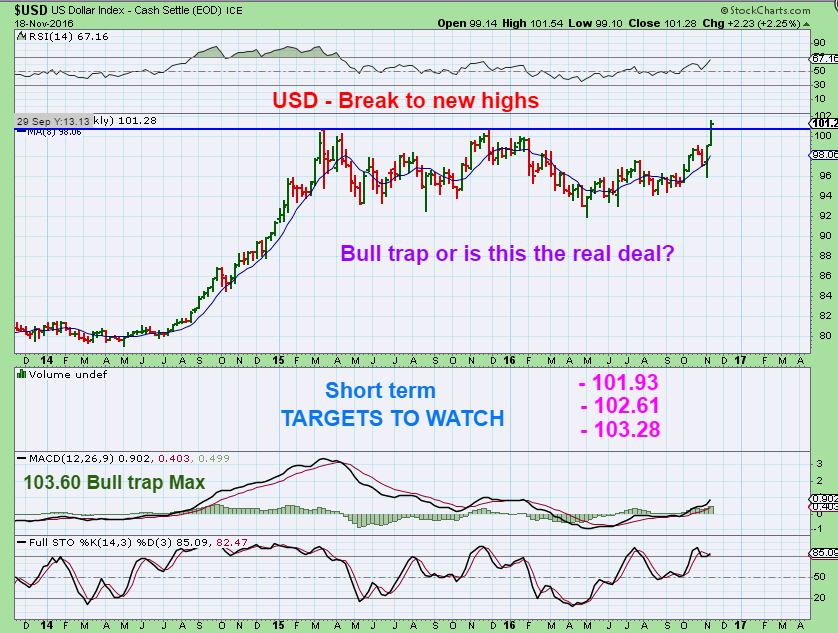
USD WKLY – Seriously, I have been saying this for weeks, but it still looks very bullish. These were my targets from Nov 16th. We hit 101.97 so far.
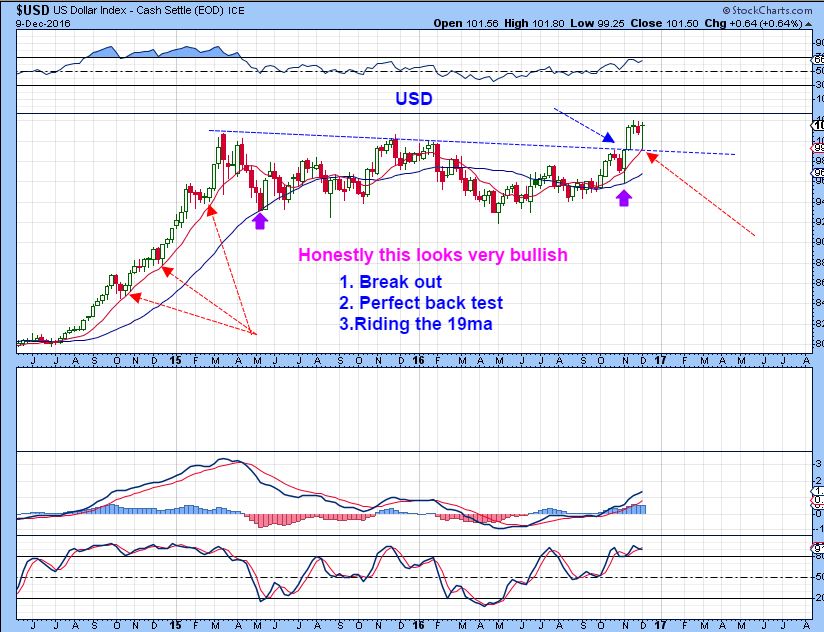
USD – I can now see a perfect break out and back test. Amazing. Even the Moving Averages acted as perfect support. A chart like this is bullish until it isn’t, and it is so far.
USD AND MINERS – Still, the strength of the USD at new highs did not put Miners at new lows. The USD and GDX did run higher together a bit this summer.

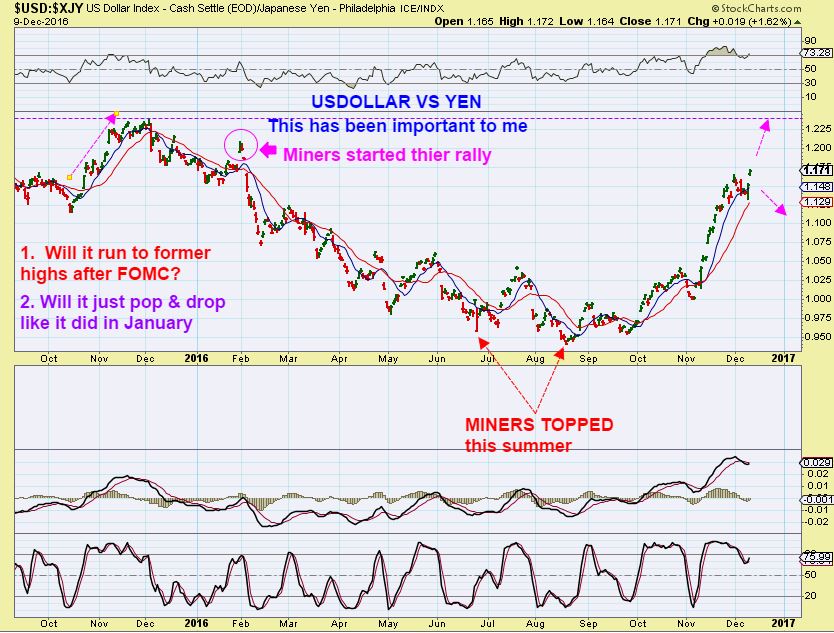
USD & YEN – The USD continues to out perform.
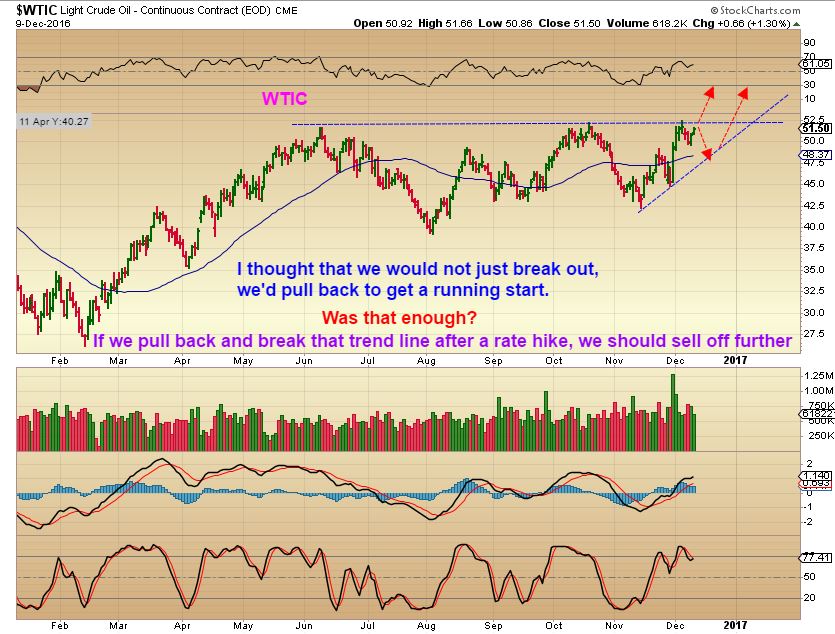
WTIC – My Oil chart from Dec 5th expected a stall, not an immediate break through.
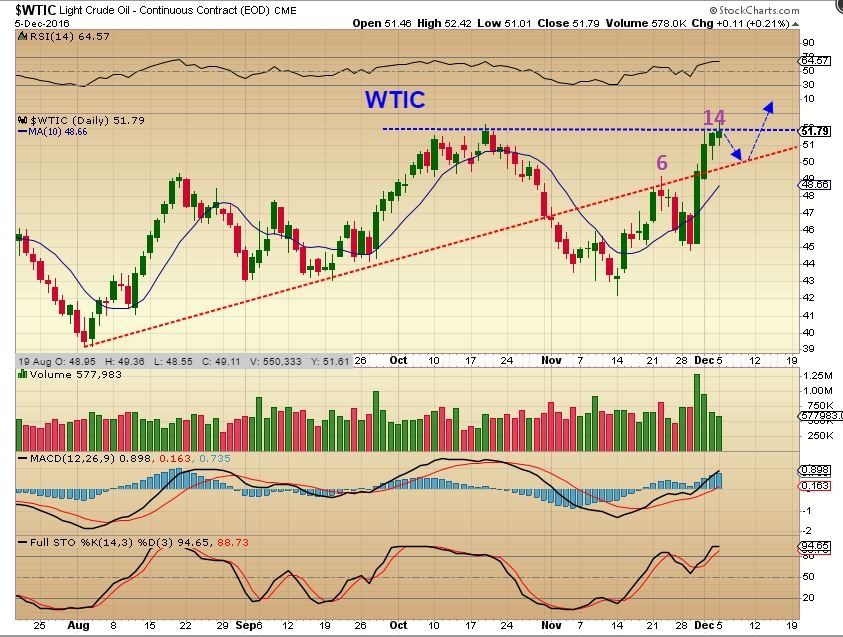
WTIC – read the chart.
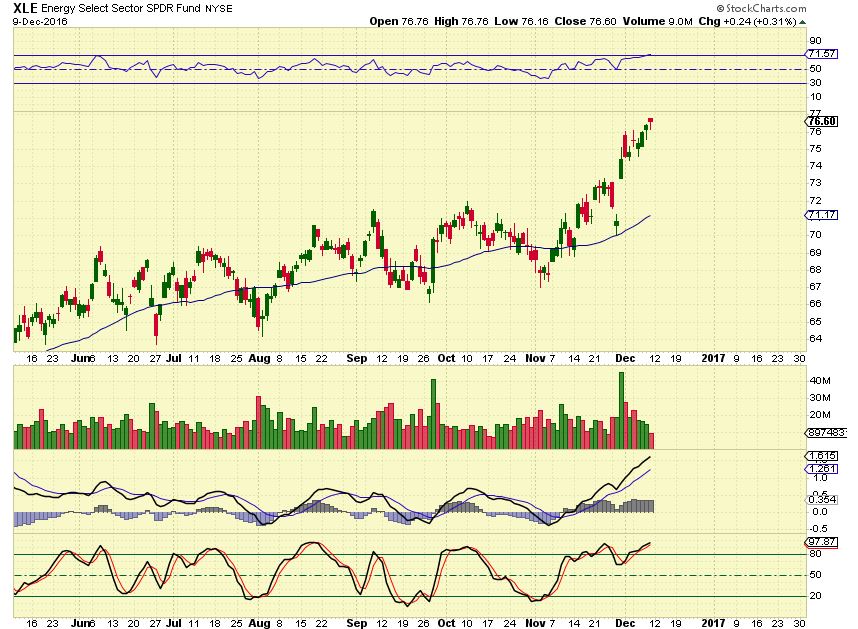
XLE – The Energy sector has already done a break out ahead of OIL. It is actually a bit extended, so extended energy stocks may begin to stall.
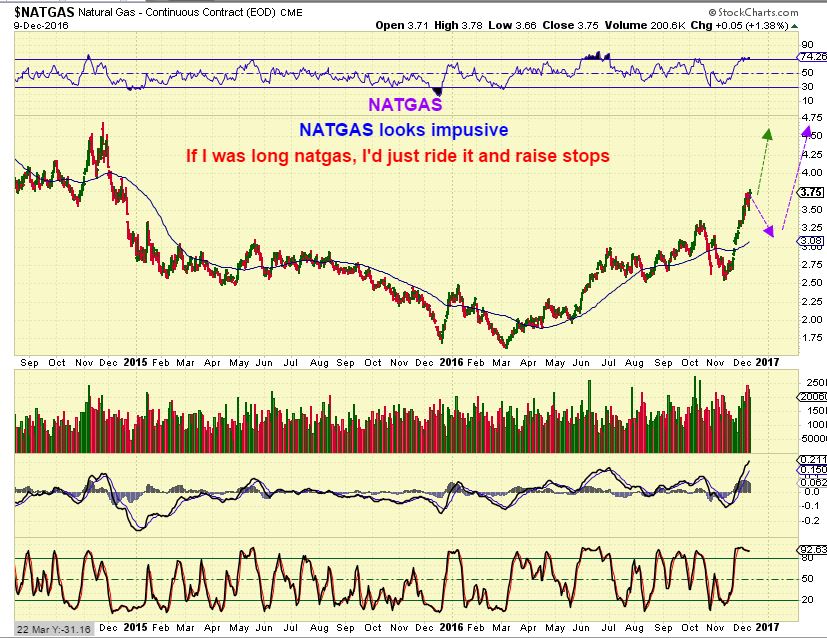
NATGAS – After a very messy low had formed, NATGAS has a solid impulsive move out of the ICL. Can we get that in GOLD and the GDX please? That was an ugly low too in Oct & Nov.
.
GOLD , SILVER, MINERS
.
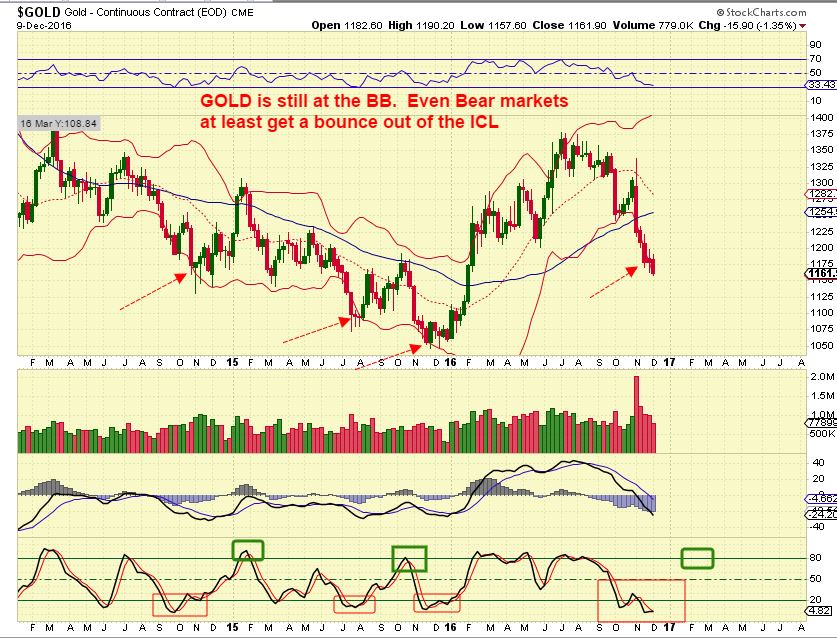
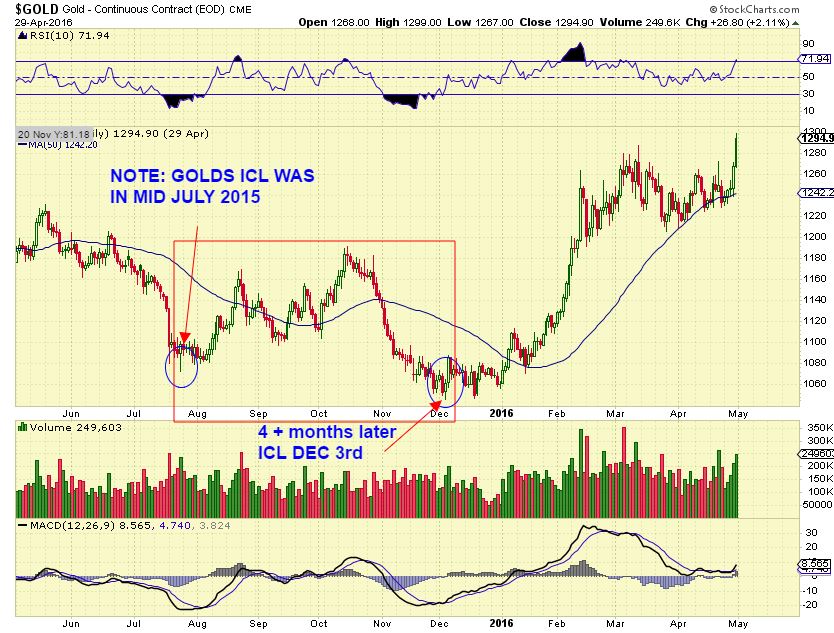
GOLD – Notice how GOLD cannot hold the lows or break that 10sma. It keeps breaking lows every few days. We have not put a swing in place, so we have no DCL / ICL. That puts us at Day 44. The MAY dip to the ICL had 45 days.

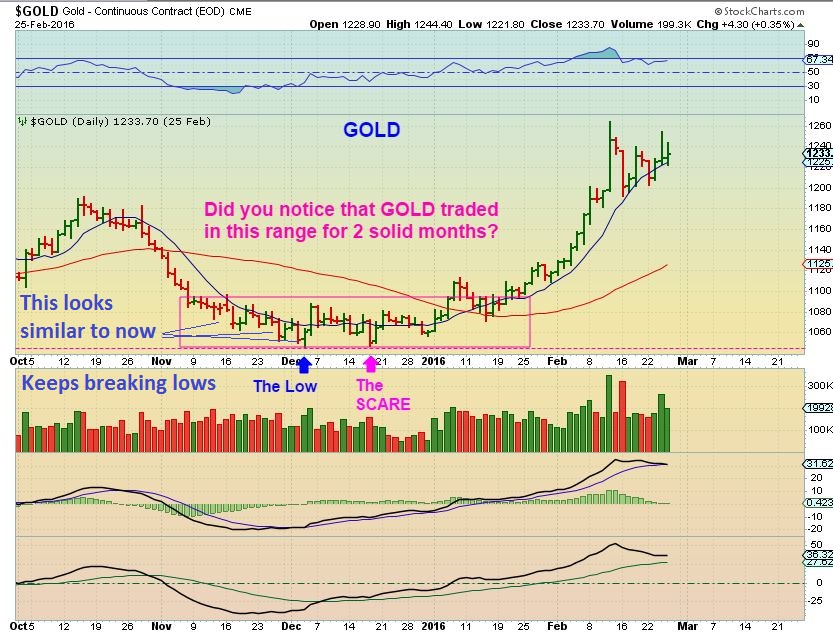
Notice : The DEC lows of 2015 did the same thing. Gold kept breaking the lows every couple of days, never broke above that 10sma until Dec 3rd. VERY SIMILAR TO NOW. This weakens the traders resolve and makes Gold appear weak.
I had pointed out that breaks of the Bollinger Bands on the weekly ( Bull or Bear market) usually result in a push higher. I used several charts in last weekends report to show that. If you missed it, see last weekends report.

In the bull market of 2004, a dip below that BB resulted in a multi month rally actually.
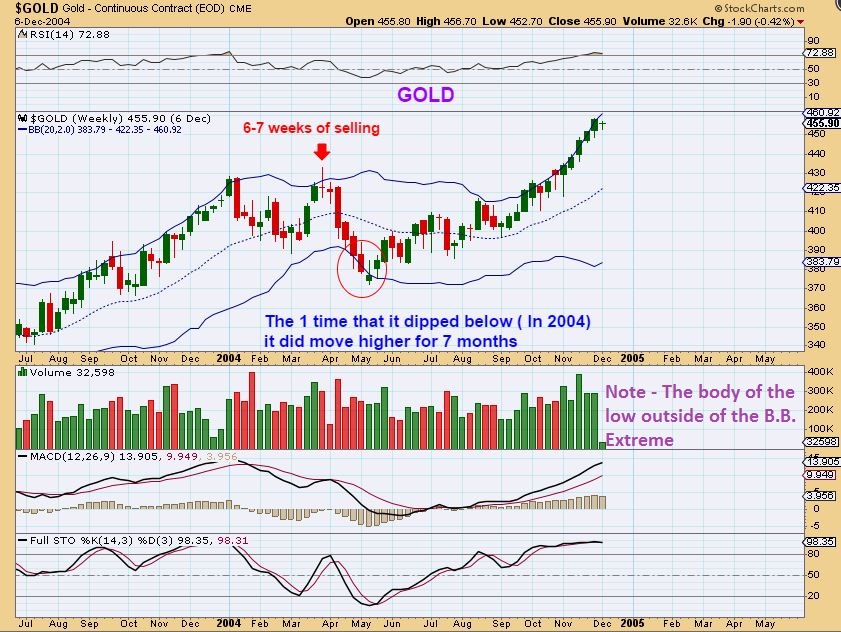
GOLD is still below that B.B. – I still exect a rally or very strong bounce.
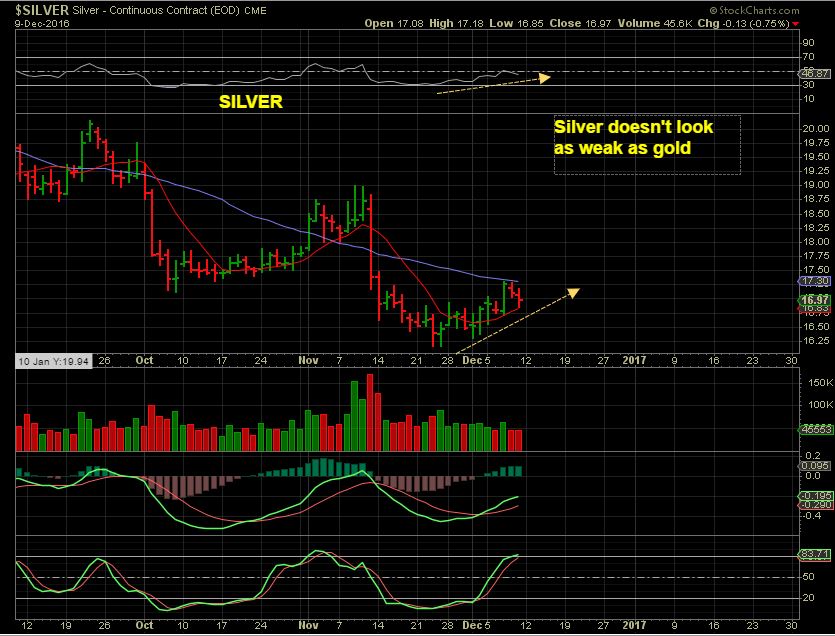
SILVER – Silver is no where near as weak looking as GOLD has been.
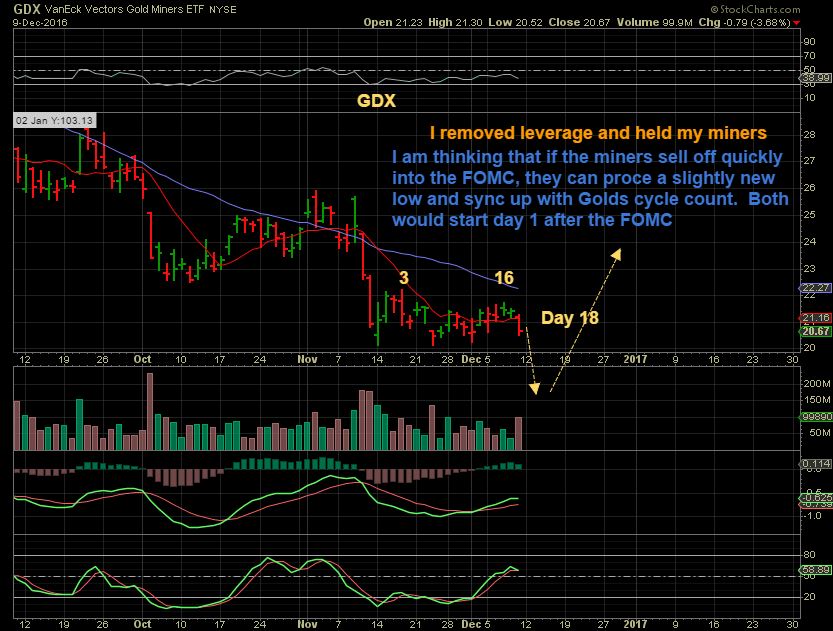
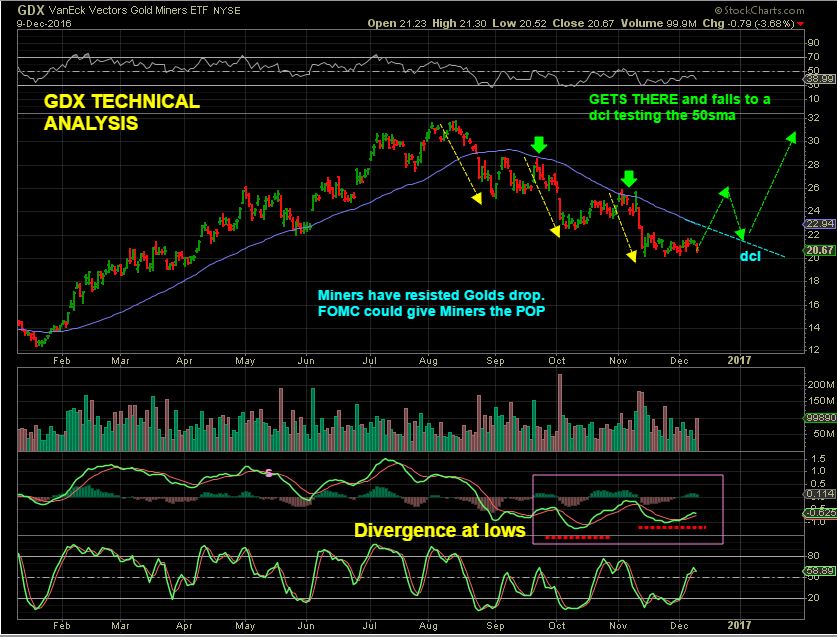
GDX CHAART #1 -Please see the chart. Just in case Miners try to ‘sync up’ with Gold and put in an ICL next week, I removed leverage.
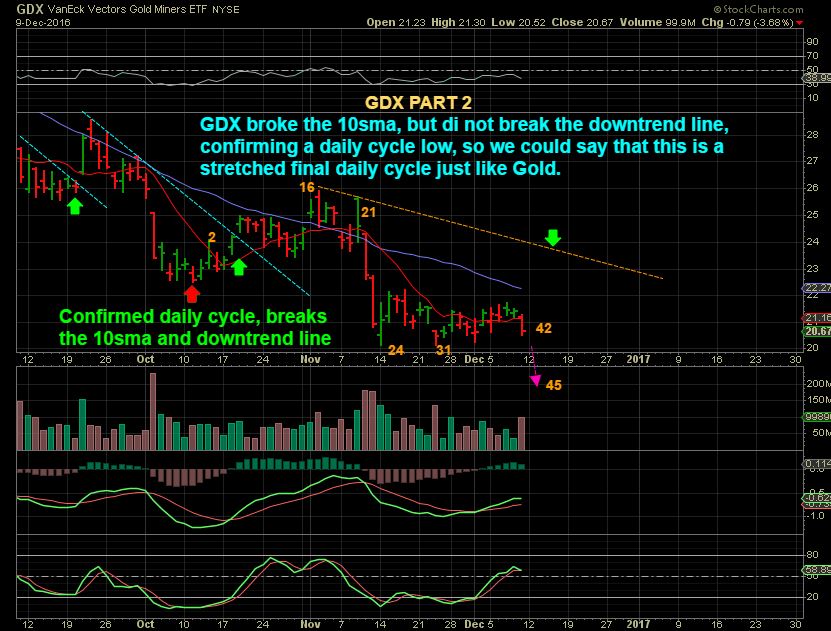
GDX CHART #2 – Read the chart, and notice that the MACD looks good.
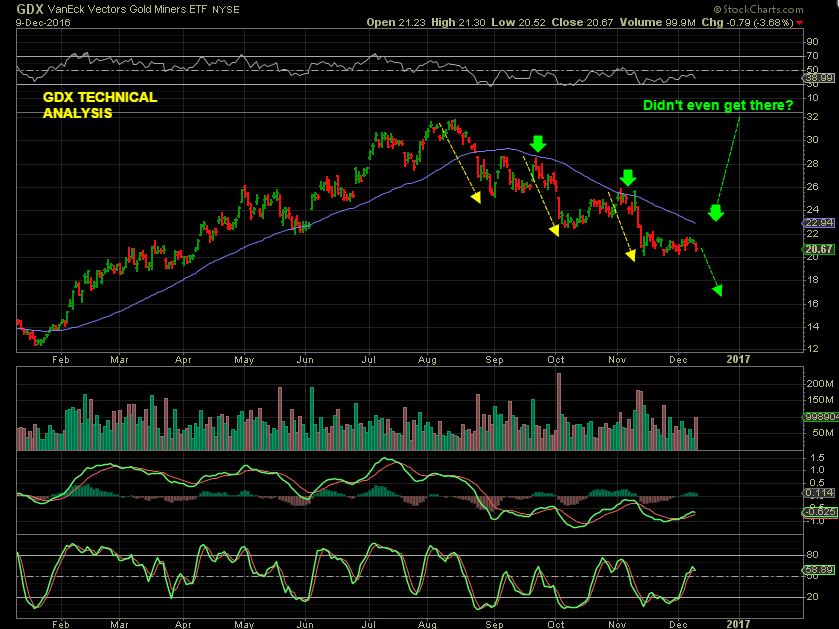
GDX CHART#3 – We usually tagged the 50sma.
GDX CHART #4– If Gold puts in an ICL with the FOMC ( very overdue!) , GDX may do this. I removed leverage to be safe.
.
Let’s discuss a few other areas of concern
.
I actually wanted to discuss this a lot more, since we are almost certainly going to get an interest rate hike on Dec 14th, this coming Wednesday. In the past the Fed has mentioned that after raising rates in Dec of 2015, they didn’t raise rates again because inflation wasn’t a concern and they didn’t want to slow the economy. Current conditions call for a rate hike, so now we will review last December 2015s Rate hike.
This was a news heading last year, showing that the FED raised rates on Wednesday Dec 16, 2015
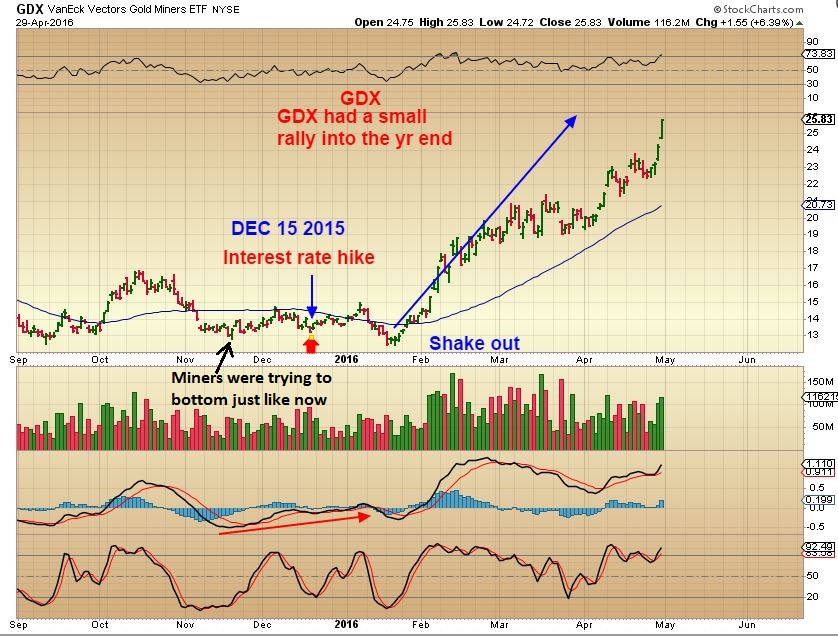
What happened to Miners back then? They were in the middle of trying to bottom at that time too.
GDX – December 2015, Miners were clinging to the lows from November ( similar to now), and after the rate hike, they slowly moved higher into the end of the year and through first week of January. THEN we saw the shake out slam down, though Gold itself never broke down. That slam down was NOT due to interest rates being hiked, it occurred in Mid January as a ‘shake out’ ( I have more info on that in a few minutes). Anyone selling there was too afraid to hop back in, and off it went. We rode that entire wave up in various Miners.
GDX DEC 2015 ZOOM IN – I made an error in the way I worded this chart. It should say that GDX went higher on the FED WED. Then it slammed down the next day, but that was the last lowest point in 2015. gdx slammed down for 1 day and continued higher. So after the FED, we got a 1. POP 2. DROP 3. Mini Rally. Good to know.
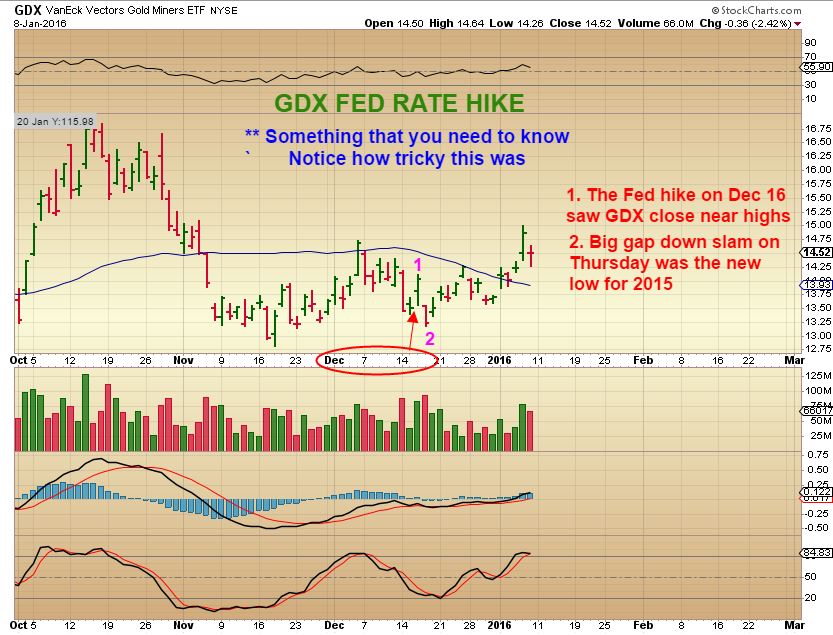
This is around the time that GOLD, which bottomed on Dec 3rd, had a quick shake out drop, but it did NOT break the lows. Gold bear market bottom was in place despite a rate hike that many reporters were saying was bad for Gold. Gold moved higher after the rate hike and began higher lows, higher highs. Good to know.
For the sake of time, I will have part 2 pertaining to interest rate hikes in the next report. Also the GLD:TLT thoughts that were requested of me. I want to be able to release this report on Saturday, and I have found something that may blow this case wide open.
It does, at the very least, clear up one matter that was bothering me and maybe you too. We will eliminate the impossible…

What a profound statement of truth 🙂
.
GOLD & MINERS ARE CURRENTLY OUT OF SYNC. THIS HAS BOTHERED ME WHEN IT COMES TO TRYING TO ‘TIME’ A CYCLE LOW, ESPECIALLY AN ICL or A YCL ( yearly Cycle Low). We wrestle with the conflict, ” If Gold just made a new low on Friday, then Miners must make a new low next, to stay in sync. It is possible, as I mentioned above in the beginning of this section. Both could hit new lows near the FOMC, and both are in sync and done dropping. However, Miners bottomed weeks ago and have held up above the lows. “Do they have to drop to new lows and match the GOLD ICL that should be coming with the FOMC MTG”
Let’s review:
GOLD 2015 – Please Note that GOLD put in an ICL in JULY 2015, and then DEC 3rd 2015.
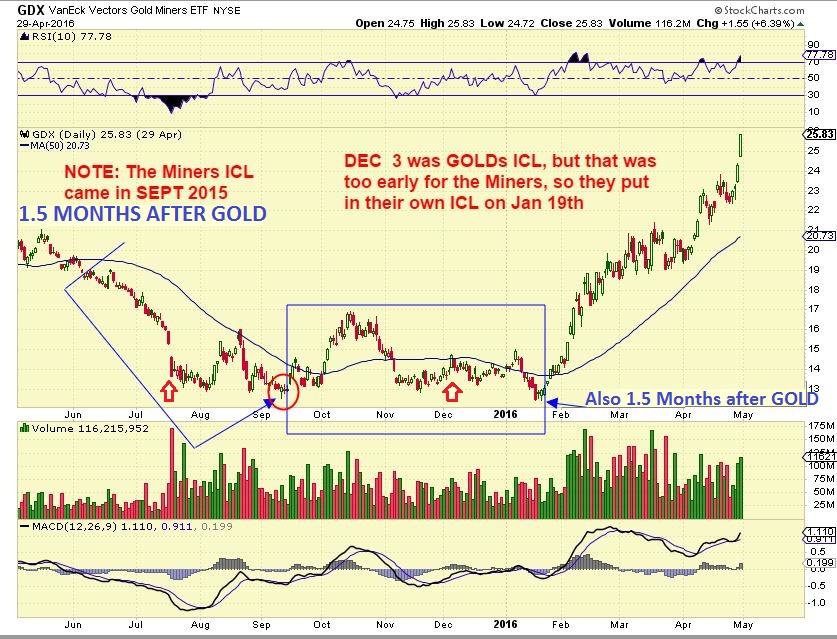
GDX 2015 – OOPS! Miners put in the ICL 1.5 months later in SEPT 2015. So when Gold bottomed on Dec 3rd, Miners had only bottomed 3 months earlier, it was too early for a GDX ICL. Yes – They were very out of SYNC, so Miners put in their ICL in mid January final shake out, despite the fact that Gold did not break down in January at all.
So we see that GOLD bottomed in JULY, DECEMBER and MAY 2016. Short and long cycles caused a bottom at the end of MAY. GDX bottomed in SEPT, JAN, and MAY. Finally in sync 6 months later!
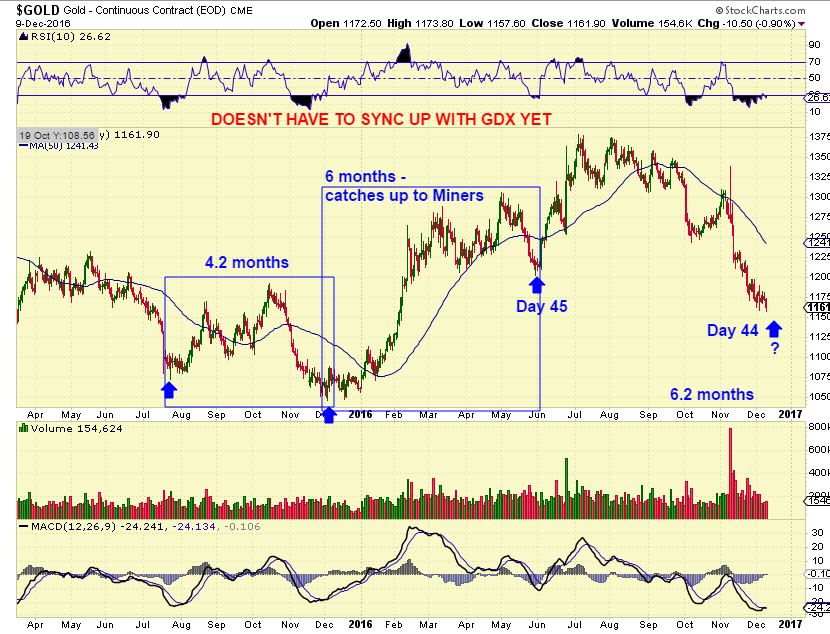
We see that GDX also bottomed in MAY 2016. It ran shorter cycles , but Gold & Miners eventually synced up 1/2 a year later in May. I do not have to over think it if they are not in sync right now. They can catch up later.
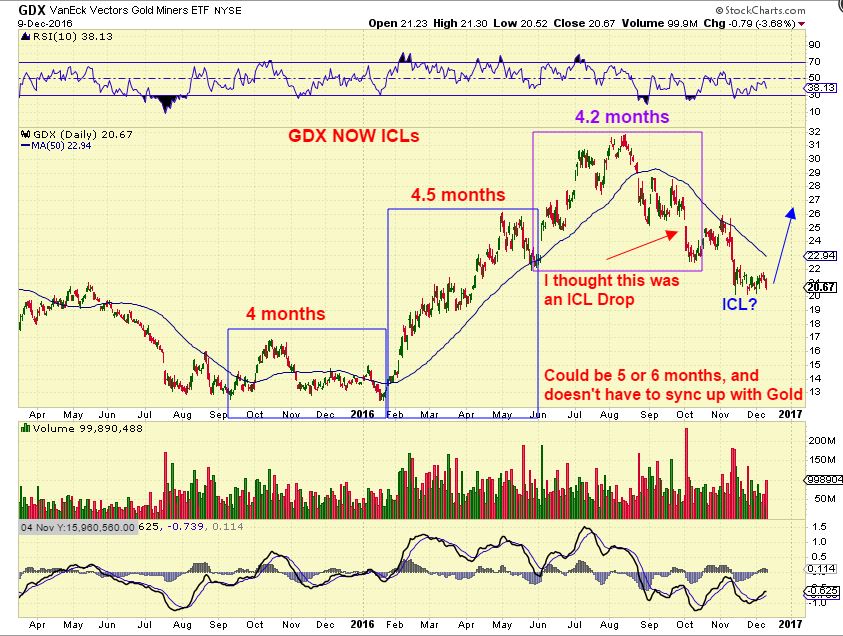
My conclusion is that right now some Miners looked to have bottomed and they have not been breaking lows even though Gold has. Miners and Gold are out of sync, and I have been wondering how this will resolve itself. The above information shows that it is possible ( no guarantee, but historically possible) for Gold to put in a stretched day 45 or so ICL, and Miners MIGHT have already put theirs in, since they are not breaking down. They can SYNC up at the next ICL. I have been pointing out miners that are not even breaking Oct lows, so maybe they are leading the way at this bottom.
It is hard to say at this point. We have the FOMC meeting this week, and to play it safe, I have removed Leverage from my holdings, and I have been trading Energy stocks on the side, while still holding my Miners ( And of course holding NAK didn’t hurt at all). We know that the Fed Reaction could get jumpy, but it is possible that GOLD will put in an ICL and if Miners do not break their lows, their lows may be in place weeks ago, ahead of GOLD.
We are at the moment of truth really. A normal ‘correction’ in a precious metals bull market is running out of ‘time & Space’ as far as I am concerned. This is it and if it fails at this point, then something else is going on. I want a rocket launch ‘short covering rally out of the lows’ soon, and when I bought the lows at November for Miners, I said we will have to see how this unfolds and we will know soon enough if the Bull market has remained with us, or is something else going on here. This weeks FOMC MTG may help to finally clarify that. The good news, Gold should Rally out of these oversold, B.B. busted, 40+ day lows, right? In 2015 it was jumpy tricky trading too, but the rally saw many miners run up 100-700% in 6 months. We were well rewarded for staying alert.
Bull markets seem to be continuing in ENERGY STOCKS and INDUSTRIAL METALS, so we will still have another playground to play in if this Golden Bull lies down and becomes inactive after this next move higher. We have already played in that area over the last couple of weeks and it has proven to be profitable. With pullbacks or break outs setting up in some of those stocks now, we can take advantage of a few more trades there. Enjoy the rest of your weekend!
~ALEX
We WILL make money once this precious metals bottoming process is out of the way. We may make money hand over fist in the Precious Metals sector. When Miners start running higher, they make tremendous %-Gains. Even if these lows bounce and roll over and something else is going on, other areas will serve us well. Recently …
Last week and especially Fridays ‘stock picks’ were almost all extremely rewarding. I started trading a few on the side as a trader, because I was a bit tired of waiting for the Lows in Precious Metals too. UUUU, PACD, AREX, NADL, NOG , TGB, etc. We will make money going forward, for now the FOMC meeting may hol the key to the ICL in Precious Metals. In 2015, the rate hike saw Gold and Miners move higher after an initial 1 day slam.
I will continue to find low risk trade set ups, but at this point I have been focused on a bottoming process that has been long, drawn out, and frustrating. We should be near the end of that process. These were a few from last week.
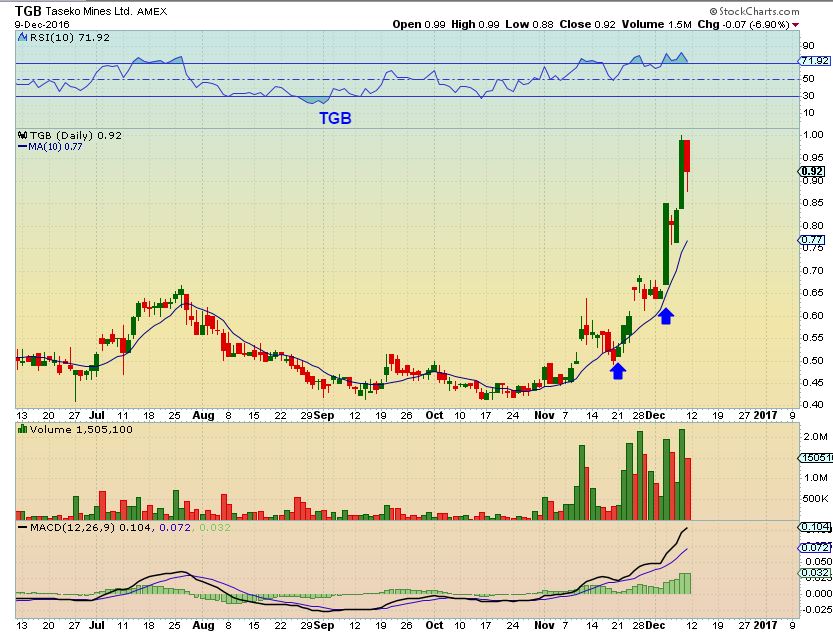
TGB has almost doubled from my original buy point shown here in this wkly chart and I also posted a daily chart then. Focused on Mining, I waited and missed it, but some here caught it. Congrats!
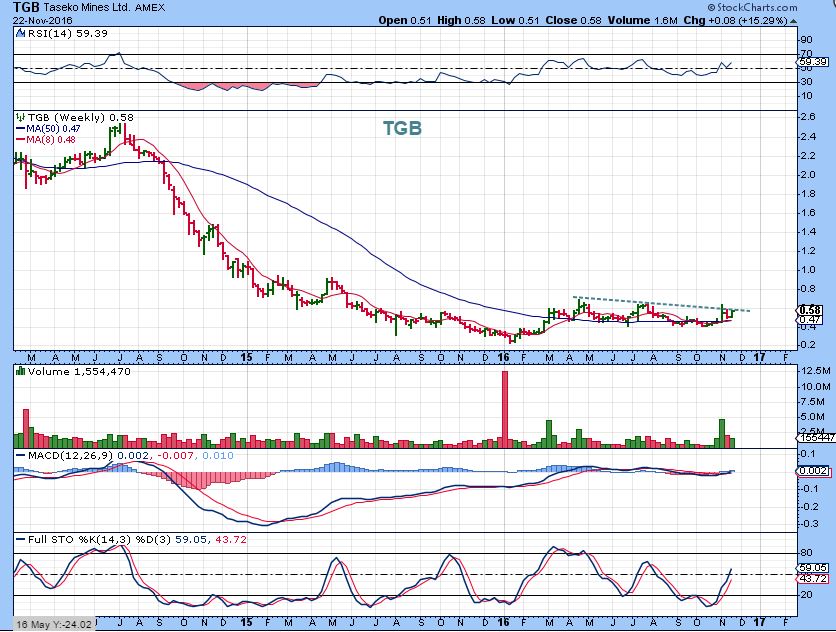
TGB NOW
PACD – Posted in Friday mornings Stock Picks report
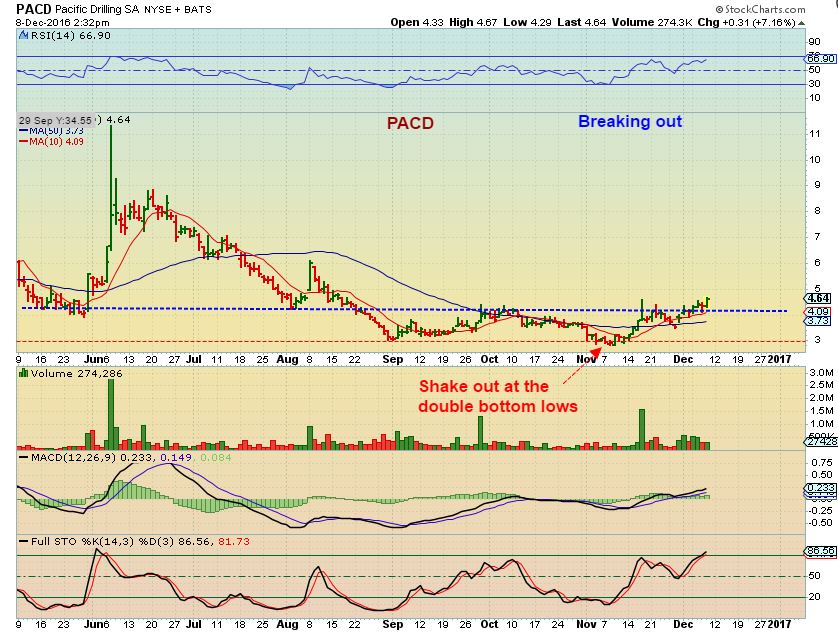 Friday s close

NADL – Posted in November at $2.97. It ran to $4 the next day!
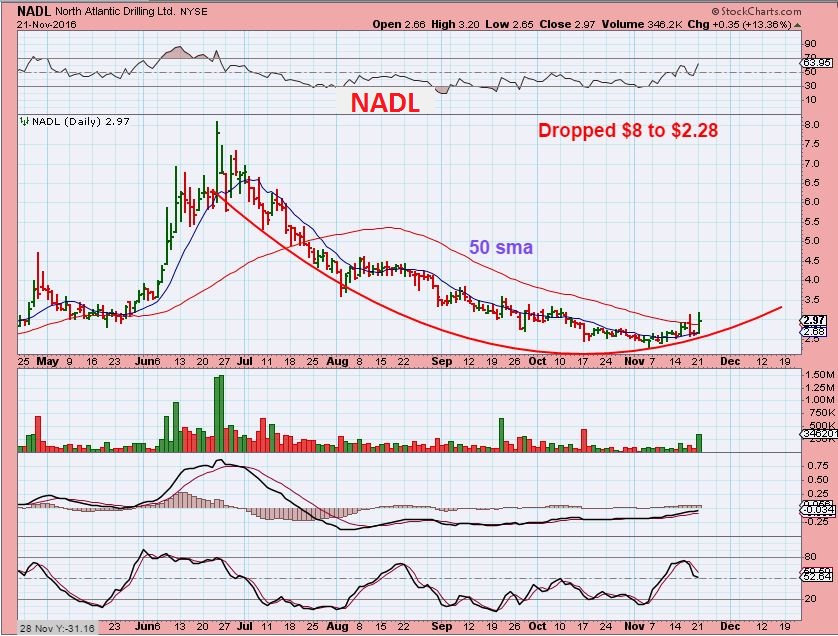
Posted again this Friday as it had popped to $4 and then went sideways as OIL sold off. This one moves FAST.
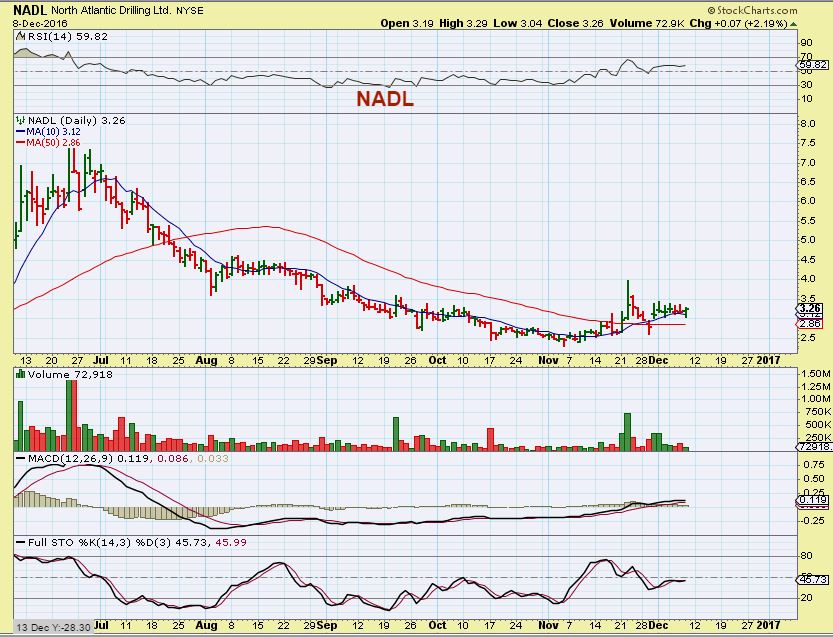
NADL FRIDAY – Nice pop, but it may just be beginning. It is hitting on the 200sma right now. If it breaks that, I expect more upside.

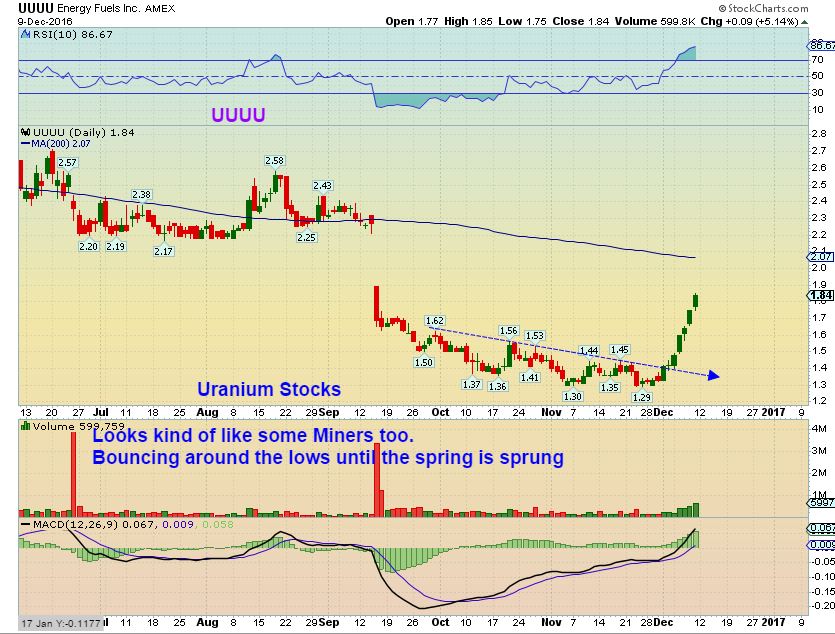
UUUU- Recommended Dec 5 th at $1.48 last week with URG , UEC, CCJ ( See also DNN).
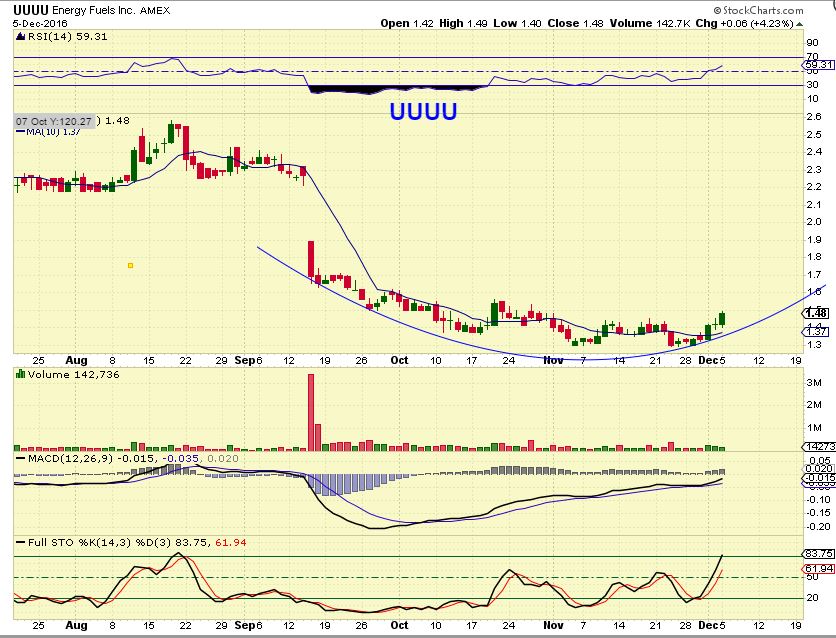
UUUU – 4 days later = $1.84
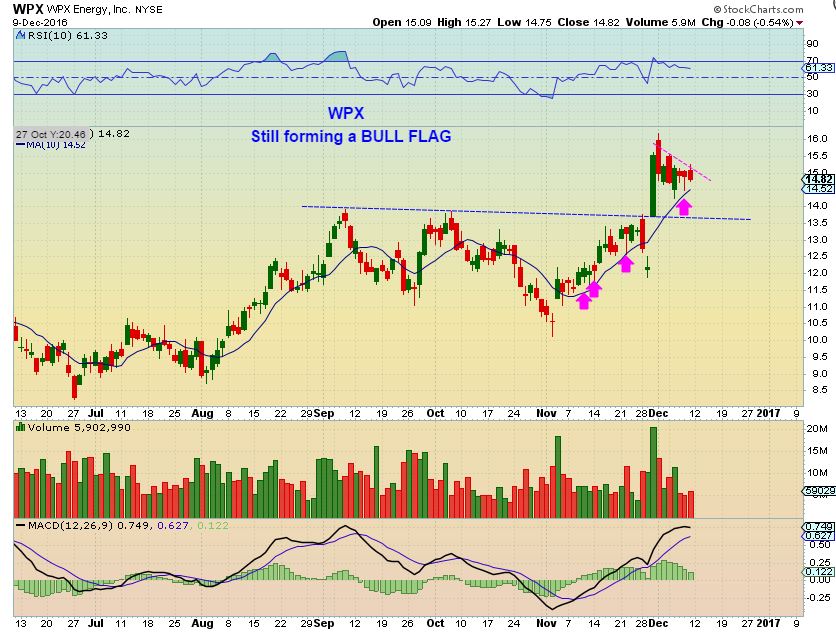
WPX – Some are still setting up, like this Dec 1st energy pick.
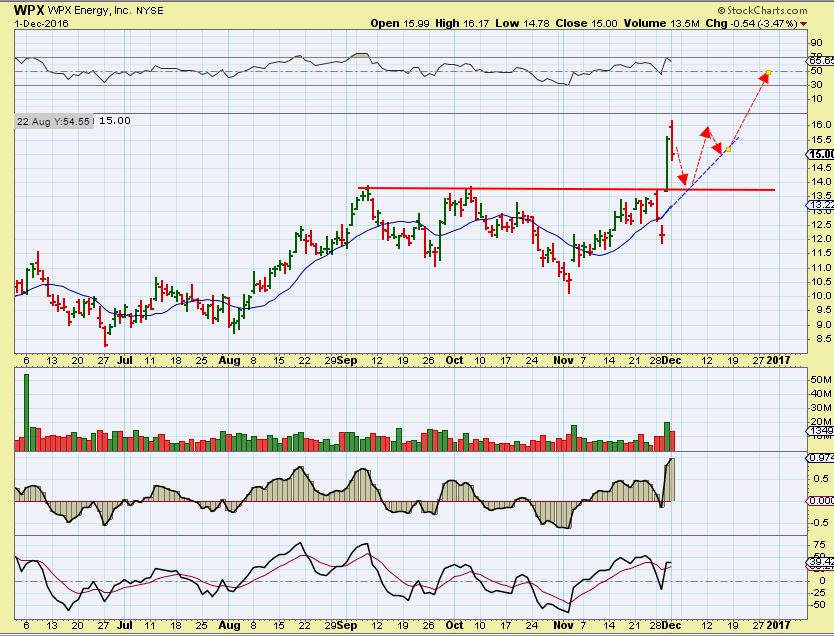
WPX – Possible Bull flag


Love this quote “When you have eliminated the impossible, whatever remains, however improbable, must be the truth.”
Nice one…
Thanks Alex!
Enjoy the rest of your weekend, should be a real interesting next week!
Thanks Zig-Zag – Enjoy yours too!
Yeah, I saw that and really liked it too.
I’m usually talking about possibilities and probabilities and historical fact.
Remove the “That’s Impossible” and what you have left is , “So it is possible”.
Warning, this may seem a little loony. Another guy I read follows a 13 1/2 month cycle in gold. The cycle is based on the apogee-perigee cycle of the moon’s orbit. Occasionally, like all cycles, they need to be adjusted to fit price. Several months ago he forecasted an October bottom. Since that was not THE bottom, he went back to the cycles drawing board for an adjustment. With a proper shift, he now sees a bottom coming soon, near the Fed meeting. Furthermore, full moons often (not always) mark turning points. The next full moon is on 12/13. Thus, for all, like me, still holding, we MAY only have a couple of more days to the downside. Optimistically, maybe the stocks will lead gold. In any case, I feel better about the end being near.
I’m not sure why that would be a warning : ) I dont know of anyone here that would be “Short”.
I’m expecting the low too.
You got it! The moon was the loony part. It is also a bit loony that he just adjusted his lunar cycle this month after missing the October bottom. It does look better now and seems to fit with the Fed and full moon. Whatever works. 🙂
lol – Well, I dont see how we could drop much more than this week when we look at all of the factors.
The interest rate hike factor ( They should raise, but even if they didnt) Seems to be the big news this week that will cause a reaction. SO overdue on timing , COT looks good, Bollinger Band crash on a weekly chart,some individual Miners have bottomed in October and still haven’t broken those lows, those GDX / GDXJ look like they may do a quick drop, etc etc etc
I would seriously expect that we should see a low and a multi week rally ( What kind of rally remains to be seen). Thanks for your input Gary 🙂 Enjoy your Sunday
Agree. However, one would think that the rate hike would hurt bonds, but they are already in the loo looking for a rally. Can gold/bonds rally together? Sweet mysteries of life. 🙂
Thank you Alex.
On another note – we have discussed the close correlation recently between bonds/treasuries and gold. They are moving in sync – almost tick for tick. Read a great email from Tom McClellan yesterday highlighting the relationship, and the recent COT report on bonds. Great chart in there and this quote…”Back in July 2016, these smart money traders were holding an all-time record net short position in T-Bond futures. They correctly anticipated the big price decline which unfolded. Along the way, they have unwound those shorts, and now they are at a multi-year extreme net long position, betting on a big rebound. That presumptive rebound should also lift gold prices, assuming that the correlation continues. And as I discussed back in August, that should also presumably bring a rebound for the Japanese yen. “.
I have learned the hard way that, over time, it never really pays to bet against the commercials. That bond rally is coming and may be quite near. That may also help as a catalyst.
Ur welcome MARKM
We are WAY overdue for an ICL in Gold. It should happen this week, and the FOMC may be the catalyst .
At times, I’ve seen GOLD react 1 day before in anticipation of what is coming. I expect Golds ICL this week. The only reason I removed leverage ( And I did not sell my Miners) Is because if GDX slammed down Monday and Tuesday to a new low, I could buy JNUG at $4 : – )
Have a good weekend
I saw the above too. Of course, this adds another mystery to the market. First, as he says, technically, they should move oppositely based on economics. Second, he adds the caveat “assuming that the correlation continues” as you quote above. BUT they sure look like they are bottoming together.
Another positive for gold shares is that FXC, the Canadian buck, also known as the Loonie (see my comment below also based on McClellan’s work), is in an uptrend and it bottomed before GDX last January.
The next 2-3 days should be very interesting. 🙂
Anybody watching OIL tonight??!! Headlines say it jumped 5% in Asia as OPEC and non-members strike deal…I see it as 53.84 right now….wowsers…..wish I had alot more oil right now!!! Glad I have some!
My thoughts exactly.
I bought a couple Friday, but I sold my NOG.
I was looking at buying more PACD since it broke out, more NADLE, and AREX and WPX have set ups that I like ( Actually many others do too).
I was just going to do some 3-5 days trades, but this might work out better now that OIL just made THE BREAK OUT.
Yeah, I sold my NOG a day or so before you did I think….WTI looks like bull flag, AREX, BTE, LGCY, PGH, NADL….looking at getting those tomorrow possibly (already have BTE and NADL but would like to add…)…depends on how much some of these might gap open as to whether I’ll get in…
I can’t imagine chasing with oil up 5% to start the week…
Alex, I always get confused about the Finviz chart which is I think the Crude Futures charts and $WTIC on stockcharts. This overnight move will look like THE BREAKOUT on the $WTIC chart but on Finviz it is still under the June high of $55…so is this a real breakout? Thanks
Refresh – Oil is breaking out
.
https://uploads.disquscdn.com/images/70b9f941faf7c085efa151ceee4d7c70ac12f3dc813a62340c2bfa9a37f0b16b.jpg
Thanks, Finviz just looks strange then, would you hold OIL through the Wed FED meeting or lighten up?
Depends on what I am holding. I’m not holding “Oil”, I am holding Oil or Energy stocks and I’d have to see what my stock looks like at that point ( Extended or breaking out?). Also Inventory reports come out on Wednesday, so selling before Wed may be due to that, and not Fed related.
Yeah anyone who took the post-OPEC trade is going to be doing really well tomorrow!
Uhh…ditto! Pretty much along the lines of what I was thinking by the end of last week. Hopefully, we can thatalk LAST shake out behind us and finally move higher in gold/miners.
I did remove some of my higher risk positions that were in the green last week. Starting small hedge, but I’ll happily throw a few bucks away to protect against 1 last slam down, will way more than make it up if we get a solid rally by end of this week.
Yeah, I’m waiting to jump back into gold as soon as it turns! 🙂
In this corrective phase on GDXJ from the Aug. top. Could we have; A 52.50 top to 41.11; B up 41.11 to 48.97 (clear 3 waves); then minor a down 48.97 – 36.96 (clear 3 waves); b up 36.96 – 43.54; then I usually look for 5 waves down in termination of c of C; I can clearly see wave 3 down 42.13 – 32.80; maybe wave 4 is done 32.80 – 36.52 and we are completing wave 5 down?
Maybe we are closer to the bottom than most think?
I think we are close. Heck, I thought we were close 2 weeks ago, too. I’ll overlay these prices on my chart tonight to see how it looks, thanks.
The bullish weather fundamentals for Natgas are all baked in by now. Should be wave ii of 3 here. The next DCL by the end of this month will likely be a buy opportunity.
Alex
USD or Can. Dollar?
I am holding cash and in USD right now in my account.
Would Can.Dollars appreciate more than USD from here on?
We know that the Can.Dollar is driven mainly by Commodity prices,
while the USD is mainly influenced by interest rate increases.
So now that inflation seems to be coming back and more so than interest increases can
match it, would it not give the Can.Dollar a better appreciation and outperform the USD.?
Do you agree with this, or am I wrong in some other way?
Appreciate your reply.
Hi Walter
I answered you last week when you asked in the comments section, and you replied back to my answer.
Did you not understand what I was saying so you are asking again, or did you forget that you already asked me? Sometimes I find that people read a report somewhere, then they ask several people about it, and later forget who they asked already so they repeat the question. Maybe that has happened here?
As shown in recent reports with the $CAD:$USD Charts, The Canadian dollar is strengthening and looks like it will outperform the USD. Look at a 2 year chart of the CAD:USD
Also I had used the $CAD:$USD charts in my reports to show how it could break above the 20sma again soon and be bullish, and then it did break above the 20sma. It looks set up to break out further.
I love the look of charts like WLL and WPX when they bull flag over to the 10sma like that. Using a 6 or 8 month chart, they have formed a bullish cup too. There are a number of Energy stocks that were set up that way.
MRO bull flag too
Just wondering: was silver’s low last night 16.66?
Maybe? I have $16.67
I tried a chart but couldn’t find one to show last night’s prices. I tried to eyeball kitco’s overnight graph. Thanks for that. Would you consider GUSH for oil?
For Oil shares, but I personally wouldn’t use it for anything more than a quick trade now. It is up 100% from the Nov lows and many energy / Oil stocks are extended. Oil / Energy stocks can run higher and some that were consolidating may play catch up, but …
A pullback could come swiftly and GUSH could take a %-hit
Good enough. I’ll continue stalking silver for better or worse and watching the yen…Just perplexing how just about every commodity has rallied strongly while gold and silver have gone the other way. I wonder whether Natural Gas is a good proxy of what’s yet to come: a sling shot of a move after a very stretched bottom…like so many other you’ve pointed out. It just seems silver and gold have been that much more pronounced to the downside as compared to some others who have rebounded smartly.
It doesn’t make sense when I see Energy and Metals prices shooting up so quickly, it is inflationary, and you would think that Gold would react very strongly to that.
We are so overdue for a low in Gold, that I am thinking that when it leaves the bottom, it may do as the others have. If it does, these Miners will double and triple again. I just don’t see how all of this inflationary action isn’t going to boost Gold soon.
Would you agree silver responds or is more sensitive to an inflationary uptrend vs gold ?
Well, I find that Silver usually leads Gold under any bullish condition.
I’ve heard that some are saying that Silver is holding up while Gold drops, because Silver has more industrial uses. I don’t go along with that. Silver will drop if Gold drops in a big way I.M.O.
I do not think you’d ever see Gold drop to $1000 and have Silver hold up. They ride the same Bull/ Bear
Alex, So the US Dollar has a bullish looking chart and looks strong! Gold you expect a break out or very strong bounce. Chances are BOTH won’t happen.
You removed leverage? Have you been holding leverage? We are on day 44 of golds cycle. 45 days is the beginning of the year cycle? is that the longest one ever?
To be clear, YOU expect the dollar higher for 2 days into the FOMC, then a drop and gold to rally strong! Correct?
I removed leverage going into the Fed Mtg, I held my miners because I feel we are at or near the lows.
It is the safest play, while keeping skin in the game
We’ve had two false starts in miners so far so if planning to go heavy at lows and front run, yes leverage would have been the call. BUT we ran out of time to put a cycle in before Fed. It’s no longer possible. Since that is impossible, what else is left? Long cycle. We could certainly flush, but there is more room to the upside once lows are in than to the downside. But I sure wouldn’t go long before 2PM Wed.
Cason, so you are sitting in cash now?
No. The way I have my accounts configured with longer term holds, I’m never 100% in cash, but yes I did raise cash levels last week. Enough to add 4-5 positions after Fed, as necessary. I was a bit too heavy before that now that we have really strung out this low.
I sure hope that we don’t bop around for another month like last year’s timeline, that would be unbearable!
Short term trade, I am buying this pull back, simply because it is not extended at this point. . It was up 22% at the open. Pulling back and looks set to break out.
.
https://uploads.disquscdn.com/images/165bac61da919e4135445a8e0ba15356f995429ee0732148d654d07f6ad07c75.jpg
Waiting for the 5 minute chart to get oversold and see how things look on MEMP.
Well darn…I thought I’d jump with you…but apparently, I jumped first!
Oh , Sorry, When I buy after a gap open, I buy the pull back, so I was saying that I’m buying this pull back, but it didnt look finished pulling back when you look at the 5 minute or 15 minute chart.
If it is going to break out and do what I ‘m thinking it would, it should still run much higher. Many of these little bull flag set ups have had strong runs higher.
MEMP pretty much did the gap fill and dropped to $0.55, but didn’t get oversold on a 5 minute chart yet.
It had a pretty strong bounce right now and may drop 1 more time and then be oversold.
I’m hoping then that it runs higher into the rest of the morning.
I hope it runs higher too. I really must learn when to jump in. I will start to look at a 5 min chart…and be patient. What approx time frame are you looking at when you say “short term trade”?
I am going back to daily chart for that.
If the trade acts as expected ( Like NOG, NADL, and PACD did), I will follow it higher and take the profits in a day or a few days. I took profit on nOG ( too early now in hindsight).
NADL & PACD are extended now, but they could do gap fills today and turn back higher too, tough call. Buying them days ago gives you the luxury of watching how it moves and still being in a position with gains.
So with MEMP as a new trade, it would take at least a day or two to see if it is going to do as it should.
REFRESH – Look at the 2 charts attached. When I bought NADL, it was exactly where MEMP is now, so in the next few days, I would expect an upward reaction. If not, I may step off and look elsewhere.
.
https://uploads.disquscdn.com/images/d97062eed21995054a97f583a6779e118573b3e0068d8e5f7a1b96731dd1ed05.jpg https://uploads.disquscdn.com/images/3e78391aba706df0a272390d6a7be21f253472f676890d55ef02f889430cf382.jpg
Thanks, I will be watching! Keep us posted as it unfolds please.
I bought MEMP, now I’m just waiting to see if it can get going higher soon ( which could be like watching paint dry)
Oversold as in below 30 RSI?
I use stochastics
CF, uraniums such as CCJ too overbought to buy at the moment? I’m looking for entry CCJ and URRE. Thanks:)
I think that CCJ is topping ( temporarily).
Would be a better buy near the 10 sma or even the 50 sma. Great run, but overextended, buying here could hurt
Alex, what do you think of ZN? Not a heavily traded one, but….?
I dont really like it.
LEI could be good long term…don’t know much about it, TX oil, seems to be poised for growth, financials not good…was up higher today and has pulled back…on my watch list…
I was looking at LEI chart too.
SGY, LEI, BCEI, DNR, PACD, NADL, MEMP, AREX, WPX were on a “Check the charts” list that I made up
Power move by silver pre-market but gold and miners don’t seem to care much…
GPL – nice chart, semi strong volume today
Wish I’d sold my NADL when it was up by $1.11 today! Now only up by .31….up fast, down fast
I still think NADL goes higher – It could be doing a gap fill today , but look at a 1 year chart.
Scaling out of my USO Calls beginning today….taking profits on 50% now.
Clearly 5 waves up in the currrent wave.
I remember you calling OIL to our attention weeks ago when we were all focused on miners. Nice trade Ken.
Have you been trading the energy stocks Bill, Many have just been breaking out- making 20-40% gains just since last week.
Alex, no I didn’t take any Energy trades (well except BAS). At the time 2 weeks ago, we were all talking about being focused on the miners and gold. I remember Ken talking about OIL, and yes, you did post a few charts that could break out, but I was under the impression that you were up in the air on Energy and Oil could correct at any minute. So, no I didn’t take any trades.
Bill
No doubt, We have been focusing on the lows being put in in the Miners. Many seem to have them in place. As mentioned AUMN, GPL, PAAS<, etc seem to be basing , preparing for a move higher. Lows are a process and need patience.
I'm sorry you missed that part of the reports lately on Oil / Energy stocks . Yes, 2 weeks ago, before OPEC, Oil was breaking down, in fact, In October Oil broke down. You would have been stopped out if you followed KEN when he bought on Halloween. He has been patient with his trades in Oil, and that paid off.
You'll see on the chart that Oil did change with that OPEC decision, in the last week or so, and that is why I have been posting trades in Energy too, because the set ups were playing out in OAS, WPX, AREX, etc.
I'll review it for you & others so it is clearer going forward.. Oil looks set up to go toward 60+70.
When Oil broke below the lower trend line in October ( from August – Sept – Oct) , it was bearish, and it did drop, even breaking below the Sept lows. Not a good sign. I was expecting Oil to run back up & only back test that trendline ( Which is where it could have been shorted). That back test occurred and that is when the OPEC decision changed the chart, because the trend line break was recovered. That is more bullish, and My charts became bullsih.
Plus I pointed out that XLE strangely never really sold off , it was in a rising channel that didn't break down. Energy stocks came into play.
https://uploads.disquscdn.com/images/dc8f39acd8b3df4de3ef19e8e30a4331b3ccad0eba550cd9f2ee99ebe508e476.jpg
Actually , here is something interesting. OIL vs OIL STOCKS in November reminds me of GOLD vs MINERS currently
Buying UCO, USO, Oil at the end of October would have been difficult as oil sold off.
Buying XLE or GUSH may not have stopped one out. The Oil/Energy stocks were holding up stronger from Early November onward.. The shake out came 2 days before the OPEC deal with big 2 day drops in OAS, LPI, ECA, WPX, etc . Then they just Gapped up HUGE on day of the OPEC mtg.
Seems similar to Owning GOLD vs Miners right now.
Alex, I went back and looked and you’re right, you did get more bullish as time went on about in the Energy sector. 60-70 a barrel is the first time I remember you giving a target like that? I remember this from 11-30. I guess it stuck with me as a probable negative outcome.
WTIC – Oil is acting exactly as I thought that it would. The OPEC meeting is Wednesday and if they do not come to an agreement to cut supply, I expect Oil to drop much lower. I’m expecting a break of the Aug lows too. If they cut supply, it could be big. ( EDIT: Oil up 4% pre-market now with possible OPEC news – I’m watching that blue trend line as resistance, but breaking back above the 50sma could be bullish if it holds).
Yes,
And Oil was still waiting on a break out, so I wasn’t really pushing Oil as strongly as I was focused on miners – So you are right about that. I know this bottoming is very slow and frustrating in Miners, so I wanted to offer trades in Oil & Energy since They held up well, and OIL recovered that broken trend line . I started offering Oil trades last days of November and last 2 weeks. I guess the problem was that I was more passive in those set ups instead of shouting from the roof tops, but they were breaking out and doing well.
As for the 60-70 target, I thought I put that in a report, I’ll go back and look at my Oil charts, because it would have been only within the last week of November onward.
And the quote above…Yes, It was at a turning point and an OPEC cut would be Bullish, otherwise I wouldnt expect oil to have the strength needed. And they Cut.
I’ll see if I can find the OIL chart that I thought I mentioned the bigger picture upside.
I did find these Nov 30
.
https://uploads.disquscdn.com/images/48a60951494c853a0e9db347d86b70cecd7f9c589b56ca3bb753b2bf30c0efe5.jpg https://uploads.disquscdn.com/images/544ee6849858df518a00858518ffca5074a1f891eb529c58cee3de9b6a42636e.jpg
I understood the jist but man, energy was tough. If we had gotten ahead of OPEC and it went the other way that pain would have been much worse than missing some of these setups!
Got it, I posted this in my Dec report.
.
https://uploads.disquscdn.com/images/61103ce6e1b59550303322a6b117f306bc88d37559798e58e5118196ebeaac05.jpg
From Dec 2 weekend report – My Oil charts were showing Oil as Bullish.
https://uploads.disquscdn.com/images/28953318c9aabc2c18748c4c5c4f22220d063e8c4286ed8810c5a9eb2ddcce05.jpg
Dec 5th -Slight pull back before a break out – Energy charts were bullishly setting up
https://uploads.disquscdn.com/images/0ec0b18fd8ad984a1a86ca240b97410bacc36dd80707c26dd21487eb6c13178b.jpg
Thanks Bill…..this one was NOT an easy one, I played the chart but this trade was Very risky with all the OPEC news to be honest.
Ken
Take a look at the candle on WTIC today.
Nice decision to take some profit. Even if it just did a back test of the break out and was still going to extend like a wave 3 – you could get back in lower. Locking in gains – nice
Thanks Alex.
My thoughts: Oil ICL due in late January or early February? Maybe a corrective wave into that ICL with one maybe two DCL’s left in this ICL?
Positive news is out so……
I am waiting to see if the Break out holds…..
EPE has really pulled back from the morning highs….some of these I’d wish I’d sold but maybe now is time to add..??
I’m not saying that this will repeat itself, but I just keep looking at this chart of SGY and that move last June. ( Which had a reverse split right before the last run up. That may have affected it). Crazy run.
https://uploads.disquscdn.com/images/e18c586aca5aa42125811340b8baf56a534f2463e96f972d1a4aa06d802f80e0.jpg
Alex, this one is too overextended to buy here? Wait for a pullback?
I dont know what SGY will do, and fundamentals may not be good, but this is not overextended. It could pull back within this flag, but not really because it is overextended.
Compare the JUNE RED FLAG to the one now. When SGY was at this price in June, the RSI & STOCHASTICS were higher than now and then it ran to $25
On the metals front….FSM and AXU up almost 4%..MUX almost 5%…I don’t have, just watching….
GPL 8 month chart really has nothing wrong with it.
Looks solid and rising on nice volume today.
I forgot to attach the chart. GPL really looks healthy considering the condition of the precious Metals and how people feel about them. October lows never broke down
https://uploads.disquscdn.com/images/db467ccd4df5e33ac5537fff635fe7d1ca2c4425ce9cd61edb5a9a90604cbc53.jpg
GPL really does have strong volume today. It looks like , at this rate, it will have 5 million + by the end of the day
The highest volume that it has had in about 6 months.
I added to my GPL at $1.48 , and now I think I have enough of that one. I’ve been buying since the OCT lows , I expect a cup to former highs, and beyond if this Bull remains in tact.
I know I know I said GPL was dead to me. But the chart looks too good! so I bought it! 1/2 position
GPL being added to GDXJ after the close on Friday. Along with GSS, KLDX and FF.T
Hey, Good to know, and I did not know that.
Thanks Kelkun!
EPE big back trace from where it was this morning…..
If you mean Gap open and dropped from highs, many of them are doing this. PACD and NADL too.
Ya, that’s what I mean…:)….now EPE has dropped all the way back to before open….only up a penny…wow. Huge up and down.
I think many topped ( temporarily ) today.
XLE was really extended
Been holding EVEP since late September and have finally seen some daylight, what a ride though.
Wow is right, and what a move today.
You actually have a break out from the June highs onward series of lower highs. Looks pretty good.
Trying small X here with a stop at the low.
Are you using the 10sma H50? It looks like that might be a place that it could turn higher, but it is extended – so be careful
Yes. Thanks for the comment. Stopped out at very small loss.
DRD- That volume looks real
TRX??? Up 7% & Broke above the 10sma for the first time in weeks?
EGO, MUX = Bullish
AGI — BOOM
VERY INTERESTING
AGI makes me think that Miners really are going to explode and move higher soon.
I have DGD for awhile. Just got a 3 day buy – good sign. My MUX has been great – on a weekly buy. My TRX needs to get going, now up only 7% again, on a daily buy, not 3 day yet. Thanks for the others.
And the sign said long-haired freaky people need not apply ……
…. well at least a little bounce would be nice here…………………….. ;o)
AGI – refresh
https://uploads.disquscdn.com/images/f30e462dd20e40e953aa9d4b2b5b705b75af5f8b135915e4666290c6aeb0119c.jpg
Alex, what do you think of JONE? Looks to me like it could break out nicely from that $5 area – looking at 3 year chart….?
It is a nice 3 year weely chart, and does look like it ants to break out & move higher over time.
The daily is a bit harder to time perfectly, but it looks good too.
DRD now has 1 million volume 1/2 way through the day.
I’m not seeing any news, but that and AGI & GPL look really promising ( As a sign of things to come. We still have the FED MTG ahead, and that could be volatile, but it is looking more like that may be a good catalyst for Precious Metals.)
BOOOM!! REFRESH – Another miner joined the burst higher, suddenly up 28%
.
https://uploads.disquscdn.com/images/d34a7156e698bae516cdd4005a292dbebcb76d9fa1899141bb5da5629b022084.jpg
This has to be viewed as encouraging.
We saw X, AKS, VALE, CLF, etc take off running, and it is hard to buy in once they get going, and hardly pull back along the way as they jump 10 – 20% a day.
We could only grab laggers like TGB, and look at WRN. I was stalking that one and didnt even notice that it took off 2 days ago.
Energy did the same, we caught the laggers PACD< NADL, UUUU, BCEI, etc ( Other caught SDRL, ORIG, etc)
NOW…If the MINERS are about to do that ( And MGH, AGI, GPL, DRD, and a few more kind f look like they may be signaling that kind of move could be coming near the FED MTG) , WE are ready.
# MORETHANREADY
Do you think gold will drop quickly at FED announcement…? Then pop back up? That seems to be what has happened in the past sometimes…..I have no gold, don’t want to get in before FED really, but then again…don’t want to get left behind…..hm, what to do what to do
I think you’ve probably addressed that in a report….this is really my musing out loud….should probably keep my talking out loud to just my room here 🙂 🙂
Too Late! 🙂
When I look back, yes, it might slam down to a new low or at least shake things up somehow( But I’m not sure that the Miners are going to drop much with it if it does). In the report above , review it again if you need a refresher, I pointed out Dec l2015 ICLows.. For Gold it slammed down Thursday, and that was the last low. Miners did the same, until they sold off in Mid January.
So the lows did not break back then. Could they now? Yes. Could we just rally on the news? Yes. It is VERY late in the daily cycle.
I can think of a few ways that it could play out, and they are all tricky. I was also thinking that Gold s low today could be a low, slowly climbing tomorrow, slowly climbing Wednesday into 2 p.m.
Then a quick sell off from 2 to 3:30 and many go short, many sell what they own, and it starts moving up into the close Wednesday. Overnight Gold runs up $30 because of a Hike signaling inflation, and Miners gap open like Energy on the OPEC meeting day.
That would be very hard to buy.
HOWEVER, IF THIS IS A YEARLY CYCLE LOW, you will NOT miss the move. You will be able to get in and sit for a few weeks and likely your positions would still double. You have been playing it safe, probably sleeping well, and no gains in Miners, No Losses in Miners.
You will do fine in the long run / big picture.
Thanks for the review! 🙂 ):) Yes, I haven’t been losing any sleep over gold 🙂 🙂 Not since I cut my losses and told myself to forget about it and remind myself that I’ll make it back 🙂 🙂
Hey, Tammie, do you have a bunch of buy stops in if gold takes off like a rocket? That is one way not to get caught up in the emotion. Often they hit the first hour very hard.
No, I don’t have any buys in…..I’ll think on that…thanks! 🙂
I threw a couple in to add to my positions. I wasn’t careful enough. One was not trading a million or so and they actually picked me off. Lesson: Make sure your stock has lots of volume. 🙂
Looks like we may gap big soon like tomorrow which would leave many behind? That’s how it’s shaping.
I just wrote up another scenario for Tammy below, but yes…at this point in “time” , Anything could happen . That is why I left out leverage for now ( Fed slam possibility), left on my Miners to have some positions to ride out of the lows.
I just am at awe how the Yen is so tethered to gold although it appears silver is leading the charge. It seems almost tic for tic. And now it feels almost like another rotation is at hand this time leaking some from energy to the metals like a handoff:)
I was thinking the same thing about the passing of the baton from energy to metals…..all my energy stocks looked so good earlier in the day..now….meh
Diabolical.
Were you referring to the ‘gap open and retreat from the highs’ scenario you mentioned on a couple of energy names? Not to worry about it.
Refresh – I meant the Day before OPEC energy stocks slammed down,
and then the huge Gap open the next day on many left buyers behind and those that sold out
.
https://uploads.disquscdn.com/images/13ecfa53f8ad82c9fec39c604b46fe166c966415a04117c9b1f10e75a2583ea2.jpg
Thanks for the transparency, trying to duplicate (but not in energy yet).
I didn’t have this on my list due to low volume. Not today. 🙂
The set up on GPL right now, looks similar to the set up in NADL and PACD last week. Similar, not exactly, but basically a rounding bottom that forms somewhat of a sideways move before a POP. .
.
Refresh for 2 charts.
.
https://uploads.disquscdn.com/images/bf9569c97e83d5d033249f76fe58284c5cfef2ea06b5c260449a2bf6b4daee4f.jpg https://uploads.disquscdn.com/images/0fa6912077452bcaae1941e7ffab8e5e2cd5f3692bfffcb40c0c94791d08800a.jpg .
DRD up 13% Now..
Who needs JNUG and NUGT?
Any word on what has happened to VGZ? I see nothing where I’ve been looking but seems to have fallen off the table.
I am hurting on that one too. The good news is that the last two times it corrected, the volume was higher.
I haven’t seen anything. I expect it to do well again once we have the lows in. I plan to re-enter but sold last week on the uncertainty of timing right now. It’s doing WAY better than TRX (which was actually up today).
Thanks, Cason.
MEMP…..Just got back….ouch. Alex what do you think of this now?
The daily chart looks normal., I am watching it using the 10sma. It wasn’t one of the extended ones, so I was looking at it as though it could still go higher. NOG did this at the end of November , reversing and dropping to the 20sma, but then it still went much higher.
MEMP is only 5 cents below my entry, so I will allow it to drop more if it wants to, but my stop would probably be below the 20sma. I didnt take a huge position, I was going to add on the reversal if it reversed higher today,
Most of the energy stocks that I am looking at got extended and gapped open and dropped ( That could be their temporary tops). OAS, AREX, UCO, etc popped and dropped
NADL PACD popped and also dropped, could be moving to their 10sma or still going higher.
Thanks.
might get a pullback in oil stocks
IWM dogi on Friday might be another clue for a pullback