
Dec 7 – GIDDYUP?
Today after review of the General Markets, $USD, and Oil, we will discuss the slow motion giddyup that we are seeing in the Precious Metals market.
.
SPX – November 29th I was expecting a small dip in the SPX, and I pointed out this possibility. It showed a drop t about the 13 sma.
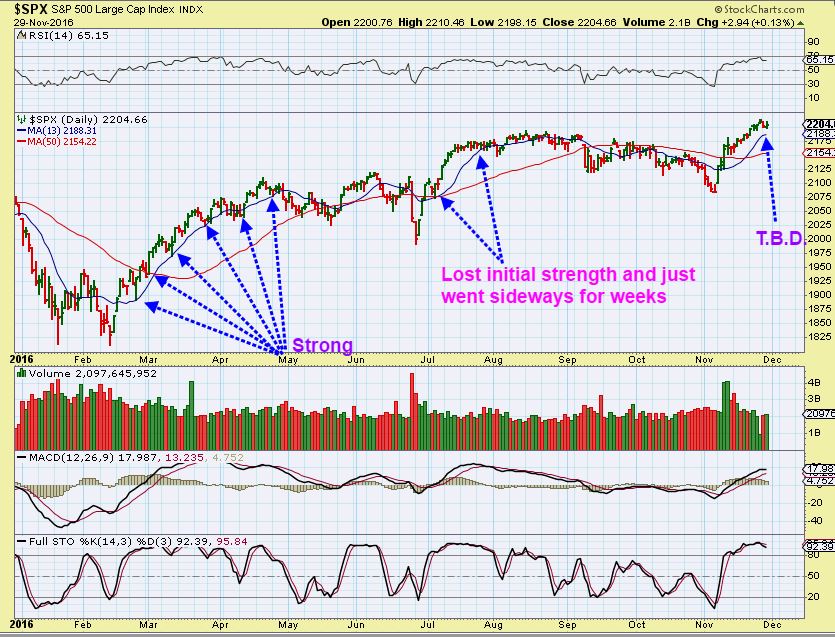
SPX – That dip came and it may be over already. Now if someone was ‘long’ they can watch and see how this unfolds. In the spring time the markets ran straight up. bouncing off of that 13 sma for a while. When moving out of the July lows, the SPX ran higher and then went sideways for months.
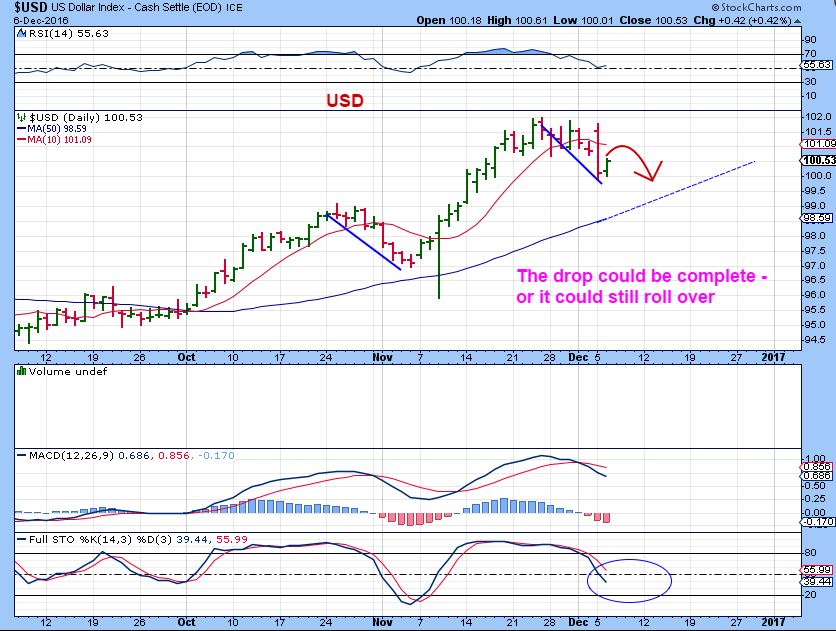
USD – This dip measures roughly the same as the October dip, so if it adheres to symmetry it may be finished. I would expect a bounce and a drop looking at this chart though. That may help Gold.
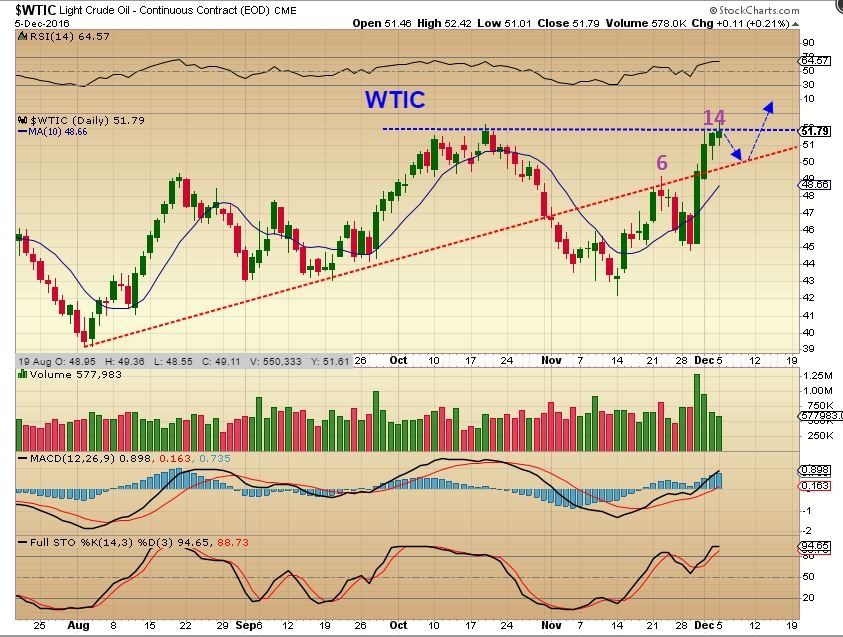
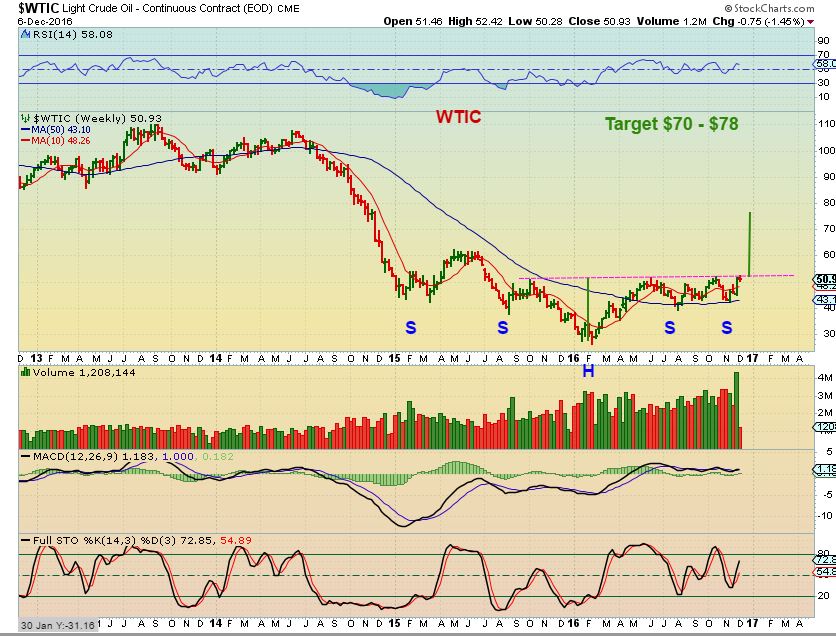
WTIC – My Dec 5th chart of Oil showed that We were about to break out to new highs, but I would anticipate some ‘reaction’ at the top before pushing higher.
WTIC WKLY– This looks like a very bullish set up. A double shoulder inverse H&S. The measured move over time would be a run to $70+. Plenty of Oil & Energy stocks shot up higher and I’ve been looking for a few good ones that lagged a bit.
NOG – DEC 2. I pointed out NOG as it dropped to test the 50sma after breaking out as a low risk entry.
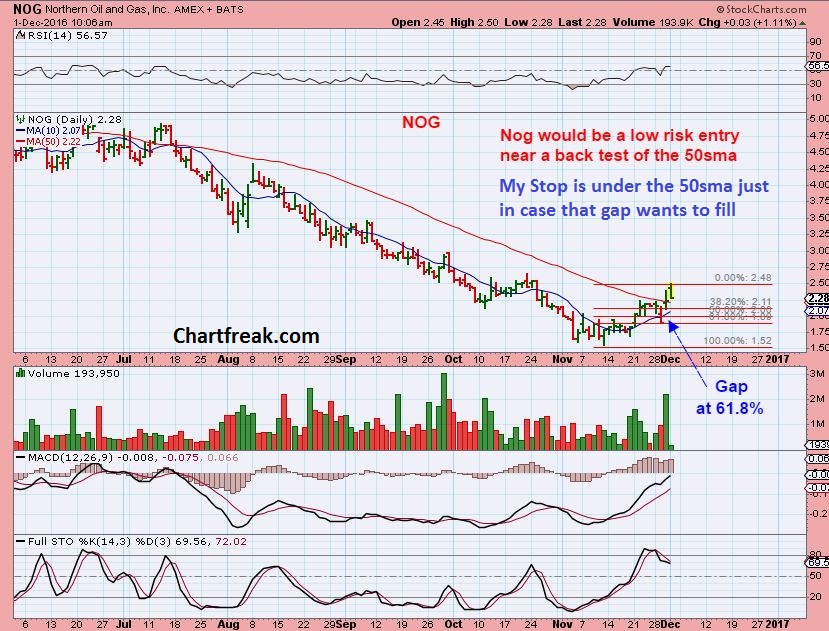
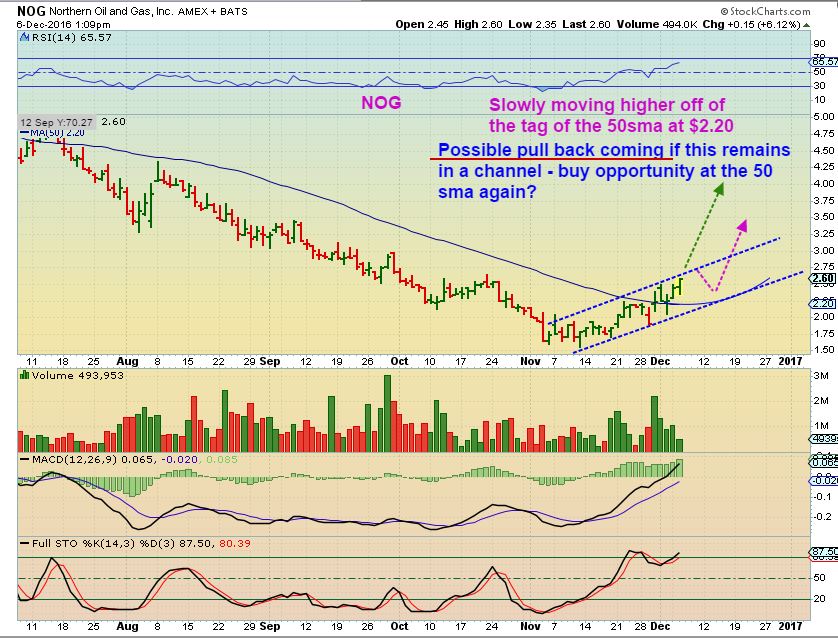
NOG – That trade is working out and I expect plenty of upside if Oil breaks out and runs. NOG closed at $2.65 today. Add on a dip.
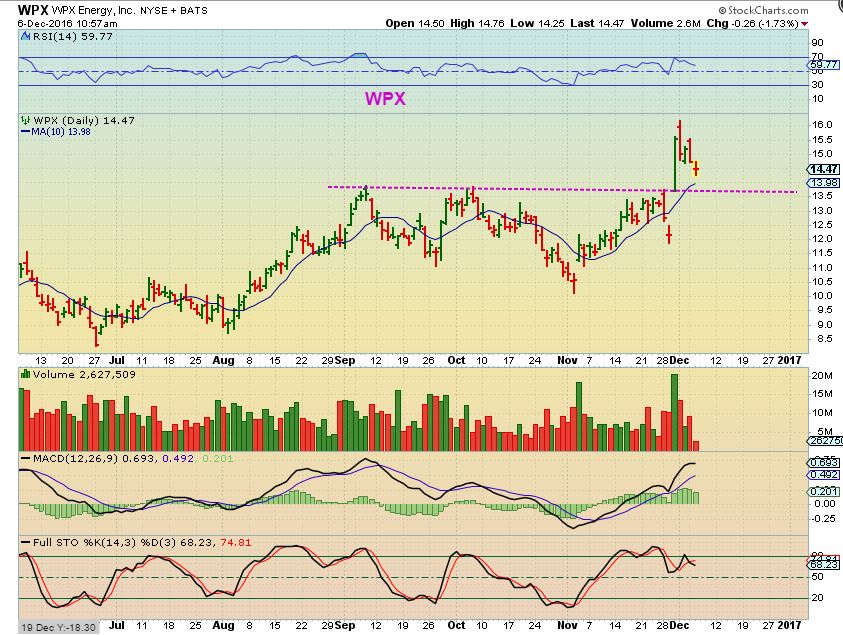
WPX – This broke out last week and I posted this in the comments section today. Buying a back test can be a low risk entry with a stop somewhat loosely below the magenta line & 10sma.
AREX – Some of us bought AREX and enjoyed a nice slow steady ride higher in August. Arex consolidated those gains, and now looks ready to continue higher. It rides the 10sma fairly well and could be bought near that 10sma.
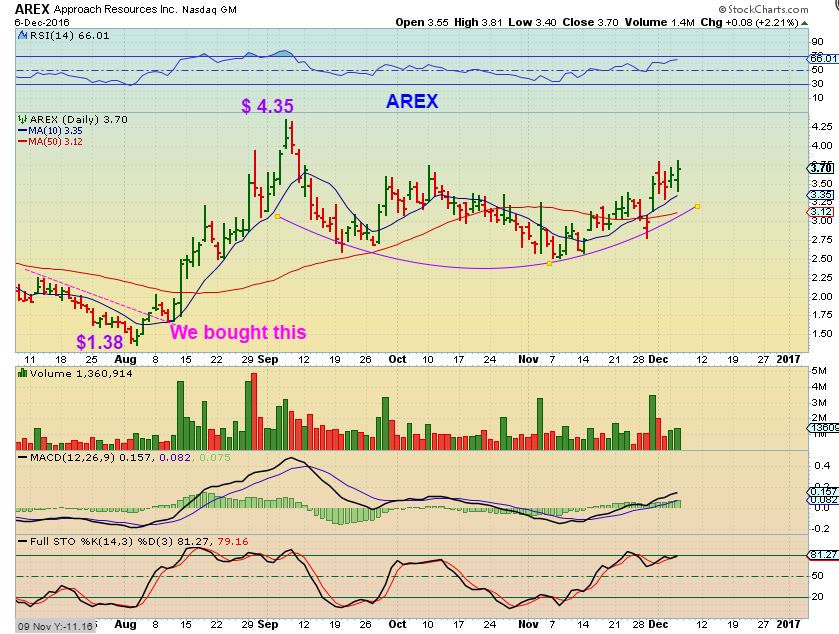
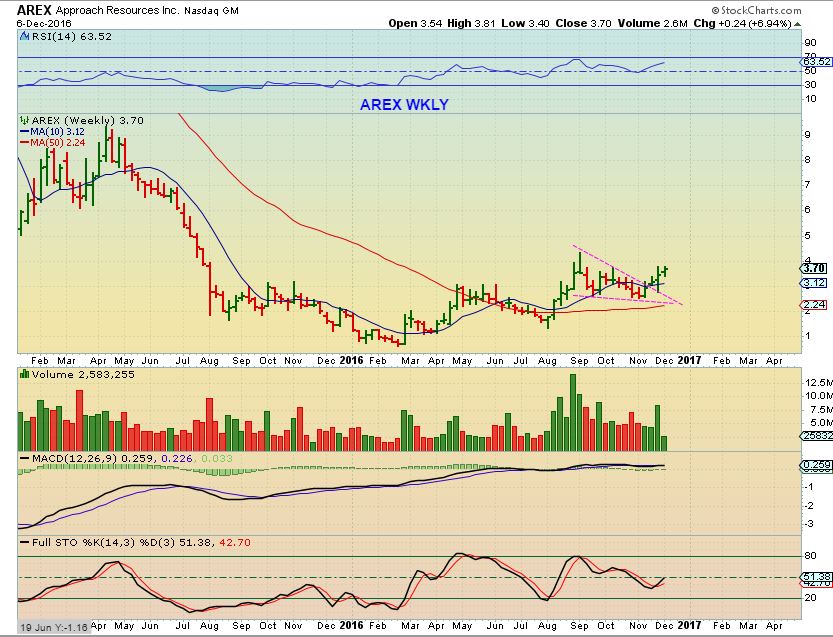
AREX WEEKLY – The upside potential is a double over time, so I wouldnt use a very tight stop.
.
GOLD, SILVER, & MINERS
.
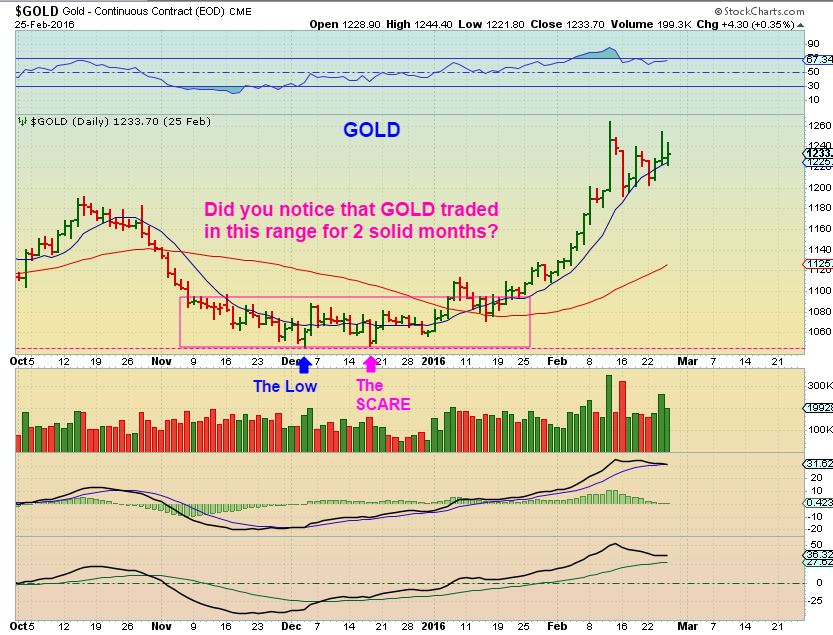
GOLD – Gold could have found its bottom on Day 40. I know many are discouraged that Gold isn’t just taking off upside, so we will address that here. The problem is that the miners seemed to have bottomed a while ago, but Gold is only on day 1 if these lows hold. Gold will only be on day 2 Today if the lows hold.
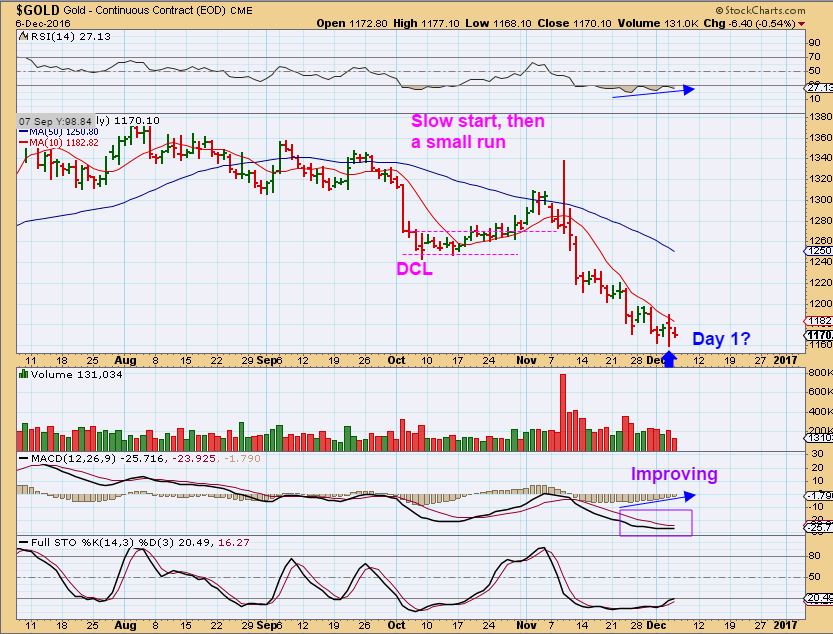
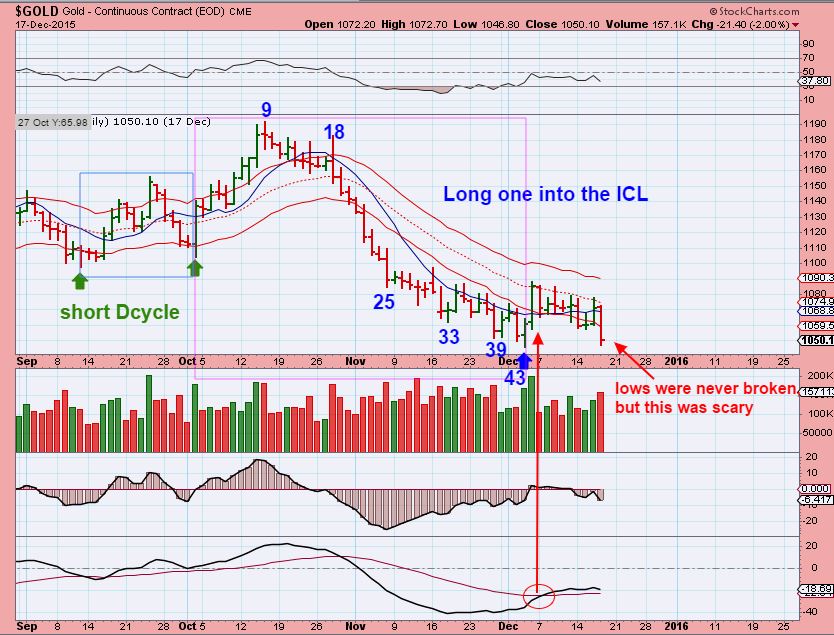
GOLD – That was a very long daily cycle, but I pointed out in a report last week that Gold did put in a very long daily cycle in Dec 2015 ( 43 days). These really should be the lows, we are very overdue cycle-wise.
SILVER – Silver also bottomed 2 weeks ago. So we have a rounding type bottom forming.
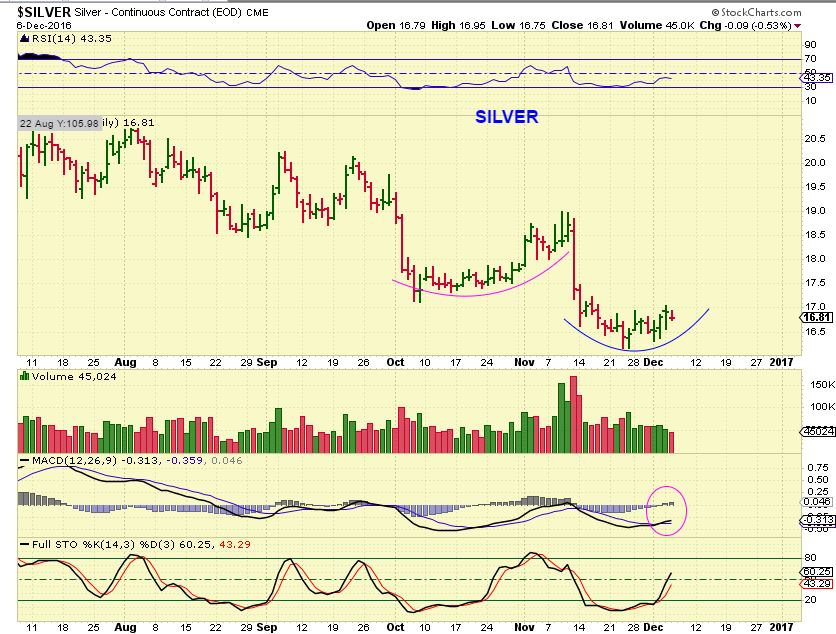
GDX is actually on day 15 – There is a lot that I can say about this, so I am going to just briefly throw out 2 scenarios.
1. We could see Gold have a short 20 day first daily cycle that bottoms at the end of December, since this daily cycle was very long. Then if the Miners bottom at the end of December too, close to the same time as Gold, it would just be a long 33 day daily cycle for Miners. This would sync up the timing cycle-wise.
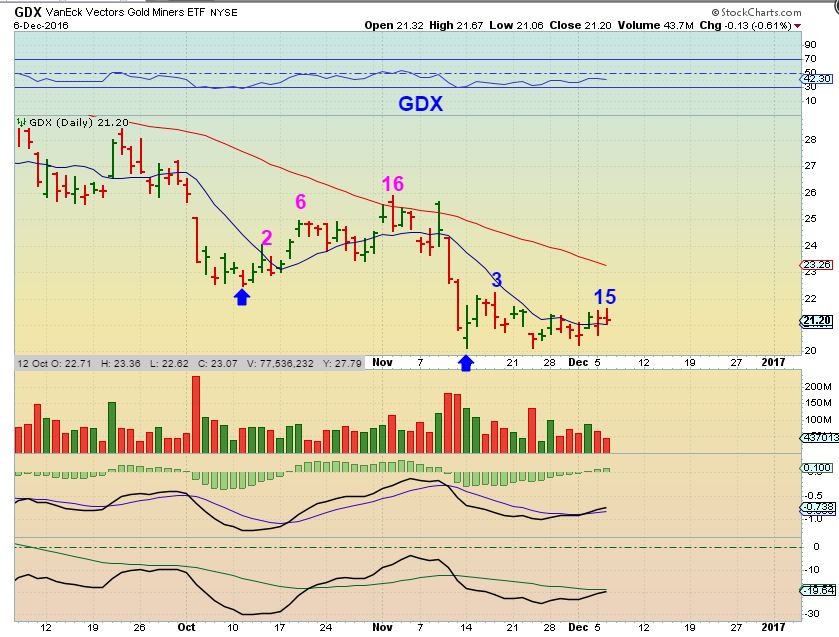
2. The 2nd scenario – I hate this one and even hate to mention it due to the anxiety that it may cause some here. At the Dec lows for Gold, Gold bottomed and never broke the Dec 3 lows. Miners went sideways for 40+ days and just when they looked like they were breaking out? It slammed down to new lows ( A shake out) and then took off like a rocket upside. If you rode this or jumped back in, it was extremely rewarding. many missed it, but we caught the lows here and rode many miners up 100-700%.
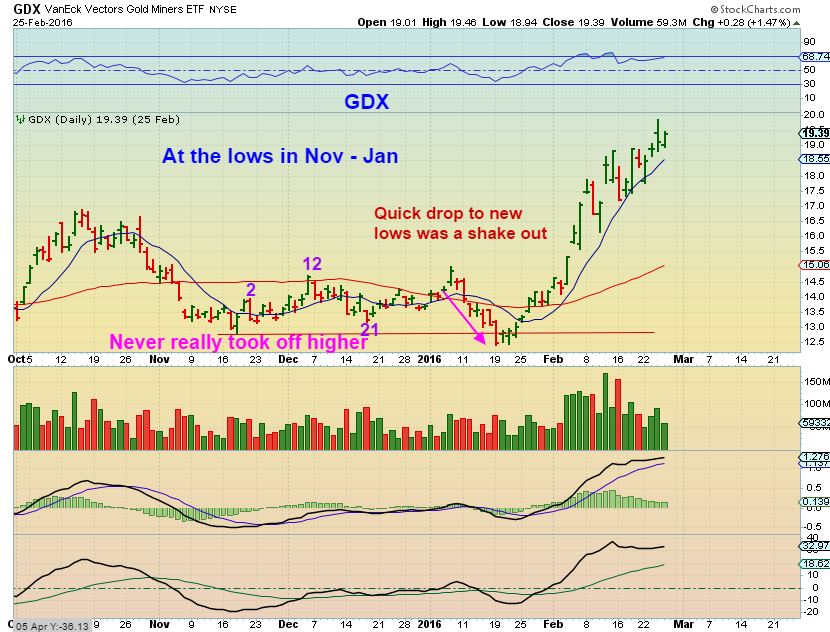
I HATE to mention the above scenario, because I know that it makes traders nervous or anxious, but it happened last year, so we have to accept that as a possibility if we dont rocket higher in the near future. As a positive note: We have been discussing several stocks like GPL, PAAS, RGLD, AUMN, etc that are holding up and looking bullish. They would probably not break the lows, but GG, ABX, NEM ( main components of GDX) are closer to the lows and could pull a shake out move if they don’t get moving soon. Time will tell.
.
Now look at the bottom in Gold last Dec 2015. Miners could also just be doing what Gold did here. Lingering at the lows.
Gold at the end of 2015 in this chart looks so beautiful really, but think about this …
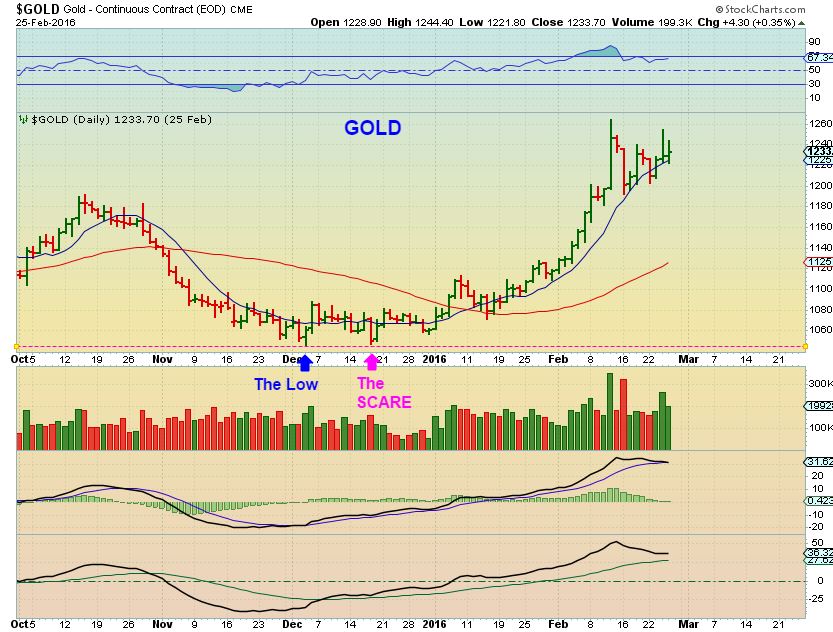
GOLD Spent what 40 + days at the lows basing out before shooting up higher? Miners have spent 15 days and people are nervous and uncomfortable, but they may just be doing this. Just a friendly reminder: Sometimes bottoming is a ‘process’ and it is frustrating, nerve wracking, boring, etc. Again, Miners might just be doing this.
.
HOW ABOUT SOME BULLISH IDEAS to end on a high note?
.
Good News – GDX is really just back testing a break out, and bottoming right now. Look at this price projection in a 5 wave move higher. We do NOT want to miss that because the Miners are lingering at the lows.
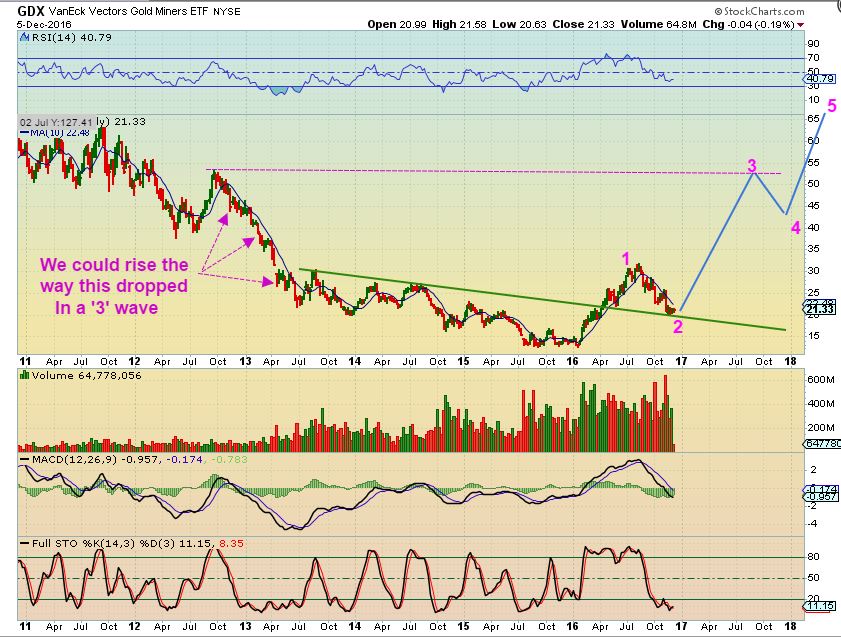
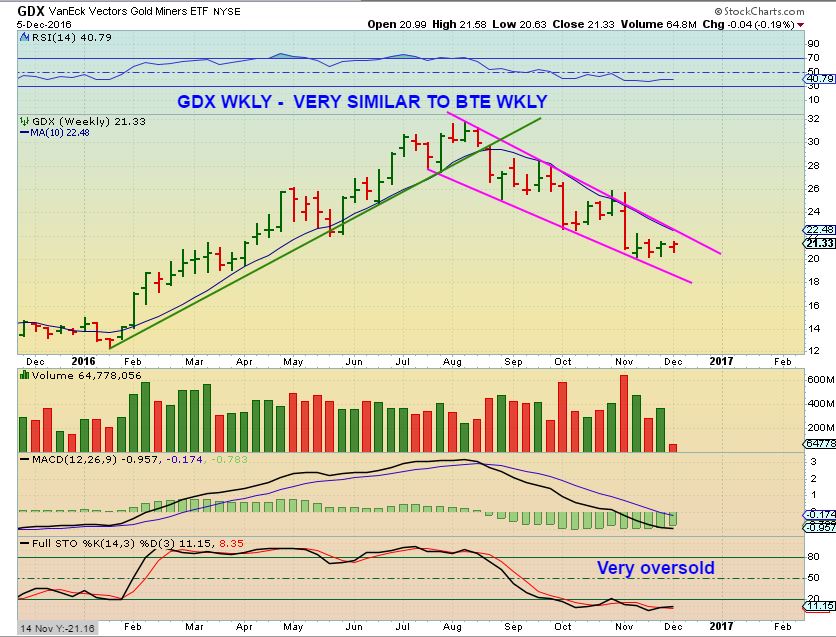
GDX – So I was told that GDX is in a downtrend. Yes, it is, but look at how quickly that can change.
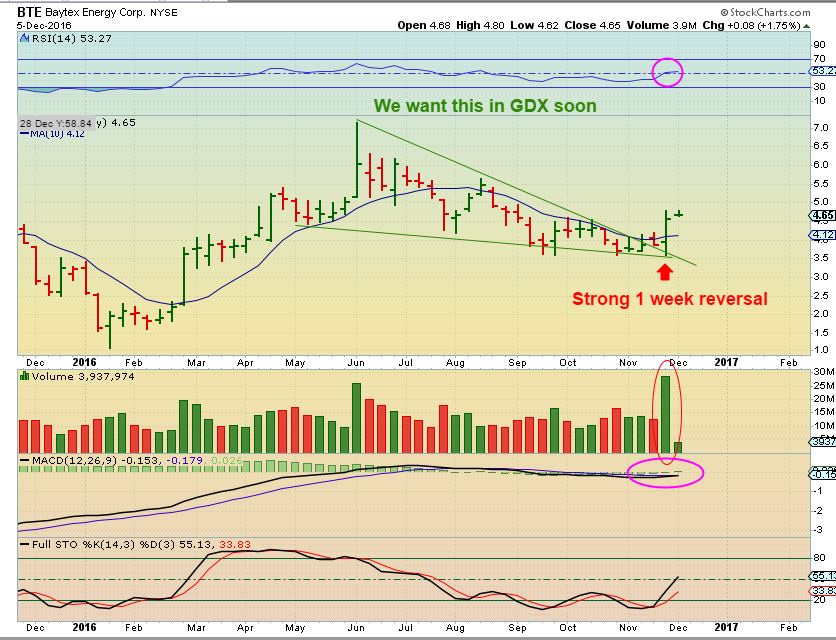
BTE – This looks very much like the chart of GDX above.
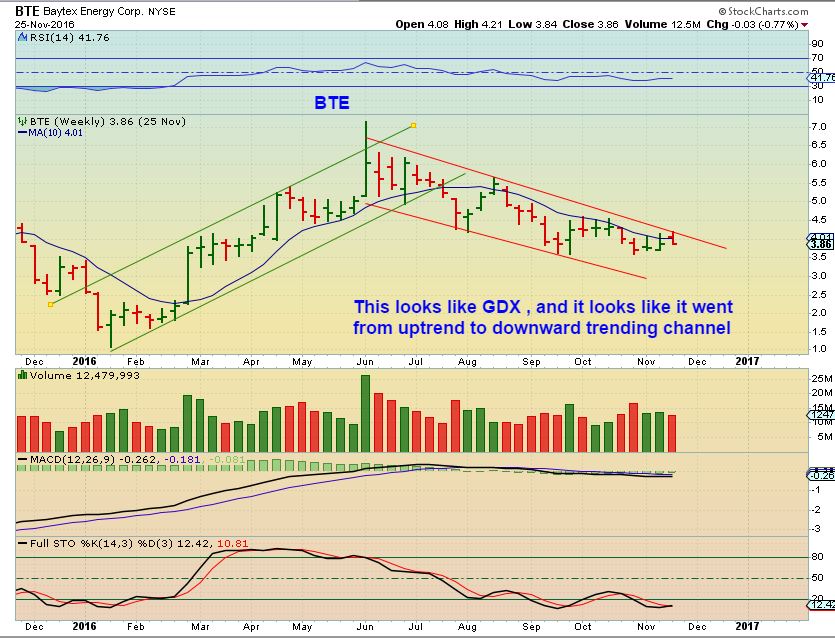
BTE – After OIL broke out higher with the OPEC decision last week, BTE surged higher too. Boom! So couldn’t GDX easily do this if GOLD broke out higher too?
.
Look at GOLD again, focus on
1. The run up into Nov
2. The slam down after the election. The question now is, “Are we bottoming?”
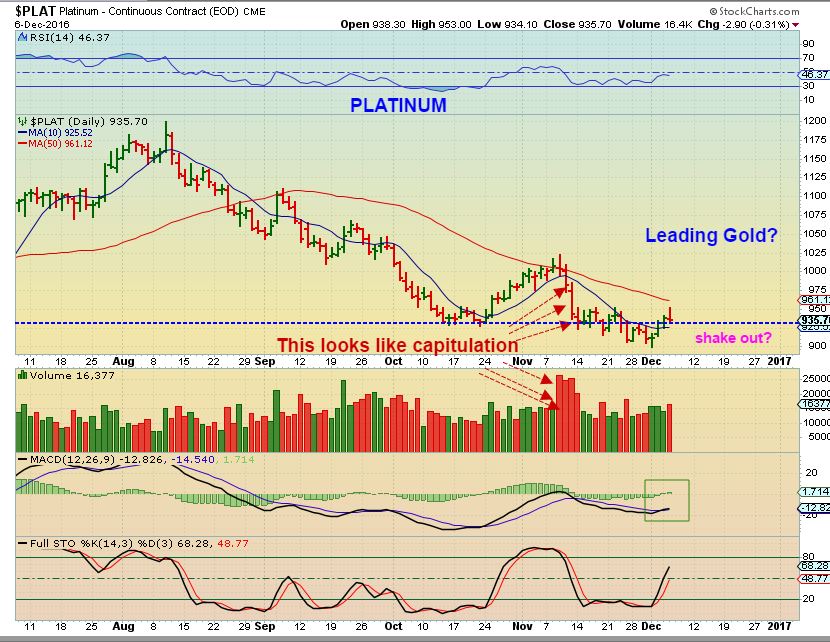
PLATINUM – Again Focus on
1. The run into November
2. The election slam down, and Platinum really looks like a bottom is forming. If Platinum is leading Gold, Gold should be bottoming too. Platinum looks like a shake out and has regained the OCT lows. The drop in Gold was much greater, possibly manipulated that way, but if it follows Platinum, it should be bottoming now too.
.
I saved my favorite 2 charts for last. I actually stumbled on this while just trying to get an overview of various metals. Let’s end this report on a positive note:
.
The Metals – We just saw Copper and Palladium take off and rally strongly to the upside. Before they did that, look at those bases. Those bases look very similar to what you are seeing unfold in Gold & Silver. Platinum and Silver even seem to have started to break out upside, while Gold is the last hold out at the lows. So…
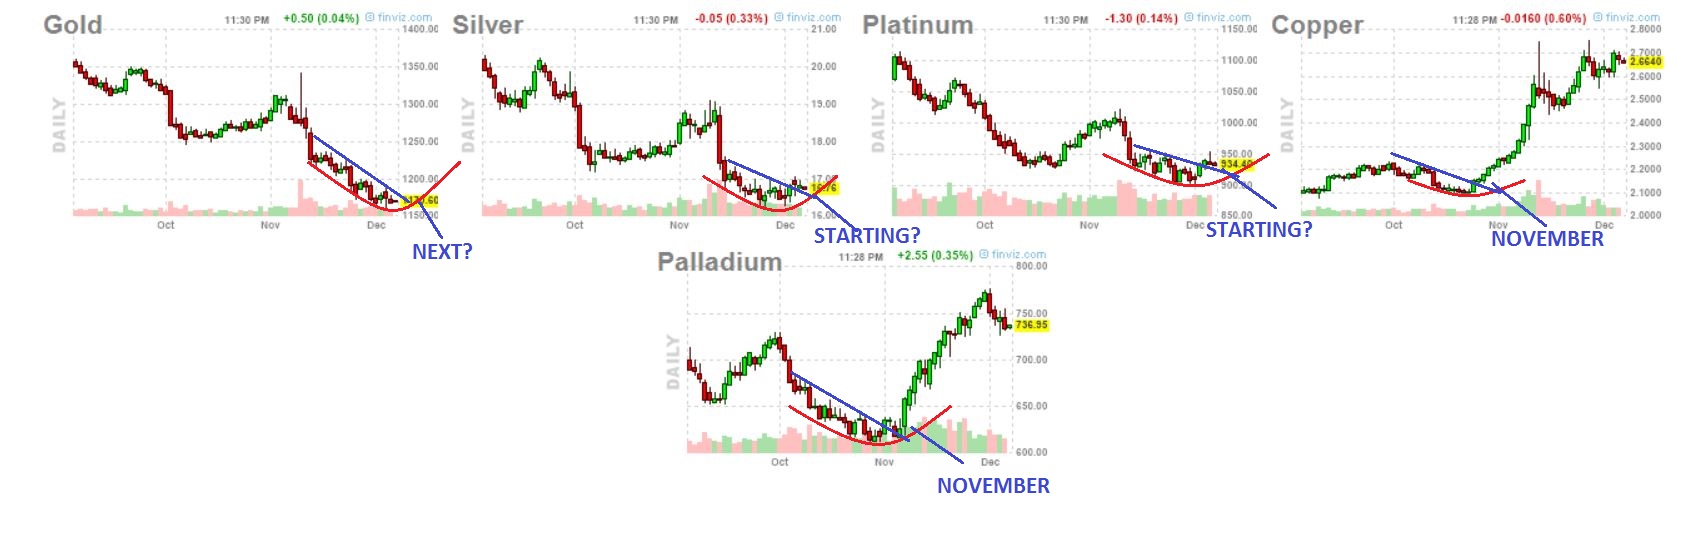
If Palladium and Copper had similar bases and after lingering at the lows, took off higher, my expectations are that Gold & Silver can do the same.
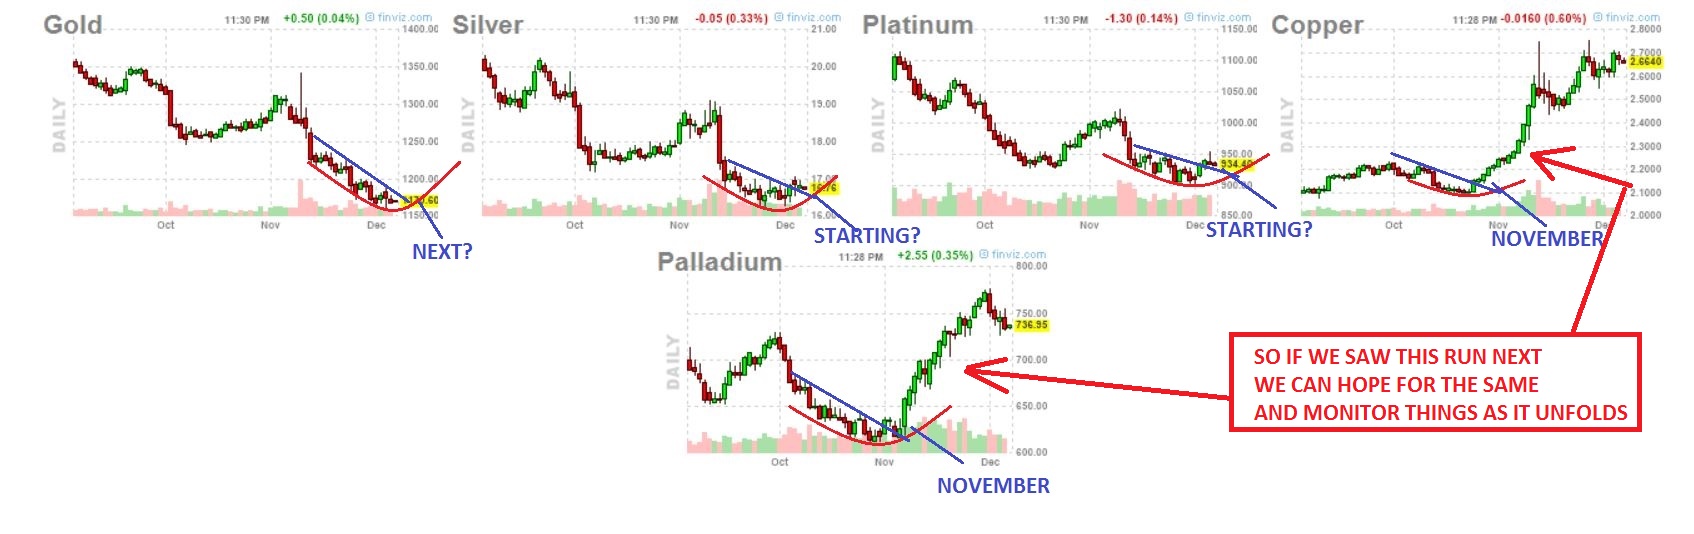
CLOSE UP – Do you see similarity in the bases? Gold could do as Palladium did.
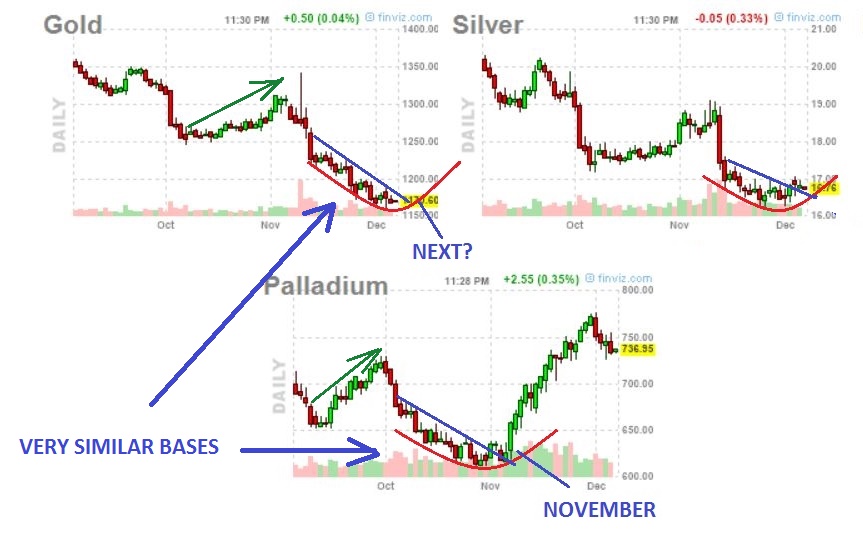
Right now we’ve been focused on the lows in precious metals, because this should be an ICL (Intermediate Cycle Low) and a YCL ( yearly Cycle Low), and the move out of these lows could be explosive and quite profitable. We saw this when we caught the last YCL and rode the Miners from Jan – April 206. I’ve also been pointing out a good number of Miners that seem to be resisting any selling when Gold or Silver drop. That said, waiting at the lows can be frustrating, boring, and even a little nerve-wracking. Patience often pays off in trading, and the timing is right. Use and Honor stops and let’s see if this week cooperates with our trading plan. Enjoy your Wednesday and thanks for being here!
.
~ALEX
.
I have some new readers that have joined us this week. I warmly welcome you to Chartfreak and thank you for joining us.
JUST A REVIEW OF A TRADE IDEA
,
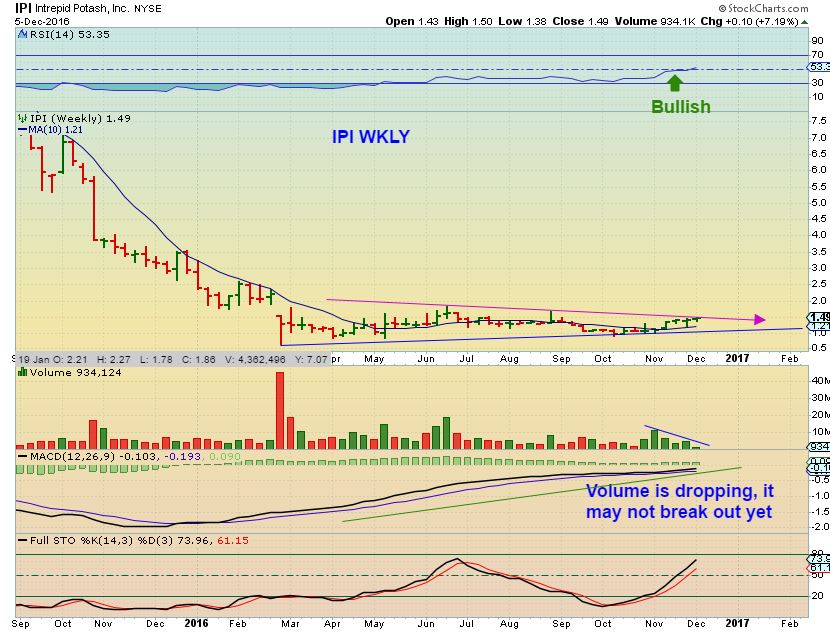
IPI – I posted this in the comments section Tuesday Pre-Market after ANN asked about it, and I received an email from Chuck, also pointing the set up out.
This would be a good break out and a ‘Buy’. Well, it broke out, closing up 22% Tuesday! Nice catch. Just like TGB, these have plenty of upside, but waiting for a pull back to enter is prudent at this point. Congrats to anyone that caught it yesterday.
TGB – I posted this in Nov and it broke out strongly, but may start pulling back now and back test that break out. I will follow it and post it if it becomes a low risk entry. Anyone that wanted to enter on a dip can see the upside potential if it returns to 2014 highs.
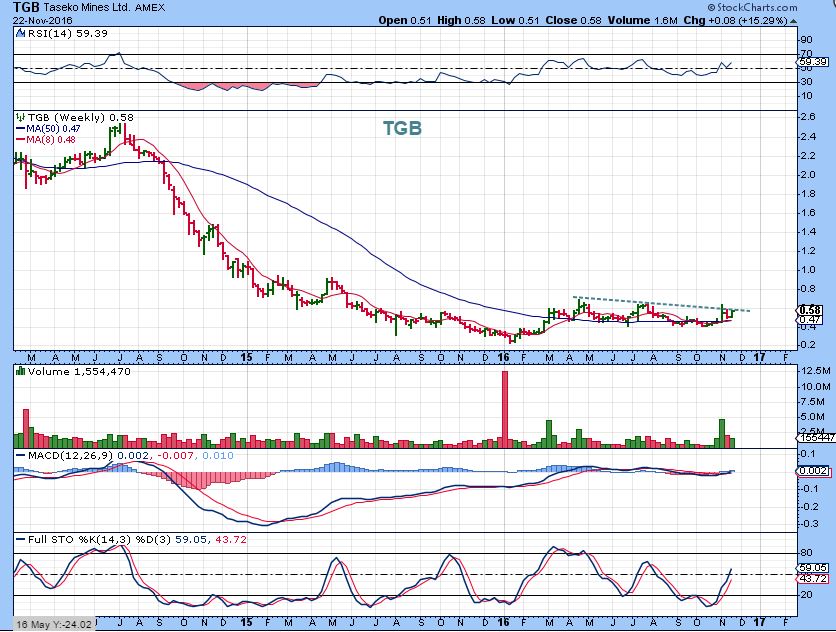


Alex, thanks for the (long) great report! Any short-term targets on TGB? I’m hoping for .90 but this may seem too aggressive for now given how far it has moved all ready. Thx!
Hi Deshy,
Actually I did have 90 cents as a short term target, but that was such a huge pop last friday that it may bull flag or pull back. A bull flag would actually be good, because that rest would be a pause and then it could go even higher.
super! Thx. Guess I’m holding this one for a bit longer;-)
Hi Alex, small question, on the last section – copper and palladium take-off, please. – One may make an argument that both of those metals have practical industrial application and were catalyzed to the upside by the expectations of the infrastructure spend. Would you need a similar catalyst to push the gold up, especially so steeply (in the absence of further weakness in the USD)? Or can it just shoot up just on inflation expectations? Last year, when the gold took off, we had the stock market dropping rapidly. Thank you!
Hello OO,
I did take into consideration the industrial aspect of Copper and Palladium ( I’m not really sure how useful in an industrial way Palladium is though? I know it can be found in catalytic converters and medical instruments, but I am not sure what the demand is ).
I do believe that the price hike in STEEL, COPPER, ALUMINUM, and other metals is caused by possible sudden demand discussed when Trumps economic plan discussed repairing the infrastructure. I also think that if the metals and oil are going up in price…this is inflationary. I’m still wondering if the current break out in the General Markets is a false break out or not too. The NASDAQ isn’t as excited , so I’m watching that area going forward too.
I am also planning on covering inflation rate hikes & Gold in the weekend report.
Finally – what I was really pointing out in the last 3 charts was the similar pattern of basing with Gold and Palladium before it exploded. Similar base often equals similar follow through.
Nice to hear from you OO
Perfect picture at the top! LOL
Yeah, I’m sick of rising that beast 🙂
Finally we can watch a nice POP in Gold & Silver pre-market , instead of a flash drop.
Maybe we’ll even get some follow through?
Out of nowhere too. Not even a down USD/Yen. Hmmmmm. Let’s hope it sticks. TLT getting a little bit of bid too.
Yesterday Pankef expressed concern about ABX, NEM, AEM, and GG. I decided to see what happened at the Dec-Feb bottom. Using the 50wma I found that AEM crossed up first (although it had a following dip), then ABX, then NEM, and finally GG. Although our current bottom is a hopefully a pullback bottom and not all golds actually got below their 50 wma, currently NEM is on its 50wma, then comes ABX, AEM, and finally GG is lagging badly. Apparently GG is slow to react. The other three were above their 50 wma about when GDX was. My conclusion: We are about at the same place we were in Dec-Feb. If we get a rally, look for GG to lag while the others take off. By the way, there are several golds above their 50wma, so I remain optimistic.
VGZ (own) is up 9%.
This one has huge upside in my opinion ( based on the charts I posted last week).
Hopefully a double as in June/July.
Alex, thanks for addressing the cycle questions/concerns and rate hike consequences. I’ll have to re-read that a couple of times today!
I’ll have more on the interest rate hike in the weekend report, where I have more time to address it properly. 🙂
I thought this was a right proper treatment. Especially mid-week!
GLD +.7, but SLV +2.3
Was watching some seriously good bids coming in pre-market. Let’s see if we can hold and then extend today. Need to get some of them shorts out this week.
AUMN (own) +8%.
Aw, man! AUMN!
just waiting…. ho-hum … TRX is gonna go rocketship
Believe it or not, I’m going to add just a bit more to my TRX as it lingers at the lows. I see a pattern that, if this breaks upward, It could really get good.- very low risk with a stop a bit below the lows : )
it sure feels like it wants to explode to the upside…….. mayyyy be wishful thinkn on my part ;o)
Starting to move. Just a matter of time
CDE might be ready,
https://uploads.disquscdn.com/images/2d7f662dd789cd7beb81ad73f3118657ab87bf9a8710b34e6d59cb221c24fdd0.jpg
This link isnt working for me Dom. Want to try again?
works for me
Yep, it worked this time for me too.
Yes, I was looking at the 50sma and a channel in this chart from my weekend report ( refresh)
.
We are above it, hopefully it holds into the close. It acted nicely around the 200sma too.
https://uploads.disquscdn.com/images/53b2689ab1a33b92dc191c4e98edfb93f379be72e72064395239c6798aa29b7c.jpg
yeah thanks chartfreak, I’ve been watching this chart you posted for the last couple of weeks
Some of these Silver stocks have nice potential if we can get this turtle turned into a bull again 🙂
I’m hoping for some serious short covering this week.
its a b/o on my 4h chart too.. i bought
https://uploads.disquscdn.com/images/451f3a073ff87f87bf53a0ee4f4d251f6ccec91e1f2df69e3360f12529577935.jpg
Anyone know whats wrong with GFI? Its the one miner in my basket that is really struggling.
The only news I saw was that a lead person resigned to join another company
On the hourly, it has a triple bottom and huge volume this hour. Possible shakeout?
I just got a tentative daily buy on GFI. It appears that all is not lost. It is lagging however as it was at the Dec/Feb bottom.
Now up 3% on what looks to be strong volume. Hopefully it can play catch up
also HMY also keep droping. Any problem with african miners?
I did see something this week about some new laws that are being passed which apparently will make life a lot harder for the S Afrcian miners including increased taxes. That might be it!?
HMY was so strong last spring, crazy that it is having trouble now. I bought near the GDX lows but HMY continues down. My worst performer not named TRX.
I was going to sell at breakeven, assuming actual gold puts in a low here. But now thinking I take the loss and find something better!
In my watchlist of 500+ stocks, 14 golds/silvers/copper are in the top 28 – nice. One concern: JNUG is up only 6+%. Need to see 10%, and hopefully 20% today.
I would LOVE to see a 20% day! We haven’t had that 1 huge pop day yet. But, I really like that we held positive in a day where gold pulled back b/c of market. My account ended up firmly positive. As long accounts we keep sneaking up little by little, it still counts (and not give it all back in 1 day either!)
NAK – and the beauty continues . 🙂
I know many here followed me in on that one and are still holding . Congrats for holding through the cup like consolidation period. That was difficult, even as a core position.
I only have a 1/2 position on NAK, if you see good opportunity to add, let us know. Don’t necessarily need to chase since I already have some skin in the game.
Some more good news: TLT (which has dropped like the golds) is up as is FXC. Buck down.
This pick from 2 days ago is breaking higher ( uranium). Could work its way to the overhead Gap, where the 200sma is waiting ( big move) .
.
https://uploads.disquscdn.com/images/b614adc4d025df34b0f898fb21593e5eb251ecc8bade1a398767671ff586275b.jpg
URRE is up almost 8%.
Yes, and UEC is popping. The sector is looking pretty good.
Just to mention in case anyone is currently using UWTI or DWTI in the oil area. But apparently they will be delisting on 9 Dec!
In fact just seen an update and last trading day is tomorrow 8 Dec.
So GUSH it is!
You seen that GUSH move since OPEC? WOW!
I’ve been watching it. I made a nice call at the bottom on GUSH and LABU. Good trades. Out now,. just watching.
First hour over. My acct is pulling back. Down 30% from best today. Not surprising. Now let’s hope this is not a one hour wonder. My AEM and GSV are actually red for the day. Let’s hope this is only a pause.
Boy Alex, BAS just didn’t work out!
Did we discuss BAS? I can’t remember looking at it recently . I remember BCEI, NOG, LGCY, AREX and a few others.
So ….when I look at BAS now , it doubled, went from about .31 to .65, has pulled back 50% to the 20sma on super light volume.
I worry about BK with this one though. I haven’t been trading the real junior low priced ones this time around.
I think the end of last week you said it looked ready to break out. I took and it and stopped out.
I honestly couldn’t remember, so I did a search through my comments.
Refresh
.
You’re right, I was reviewing many energy stocks that had popped, and kind of did mention it may be a lagger ready to go, but I was also nervous about BK ( Bankruptcy). Glad you had a stop, but this thing just doubled quickly, it seems to move rather big in both directions when it goes.
.
https://uploads.disquscdn.com/images/0e6a9c5d52ef8aaaad4cb4fc2b52868f8c4cea1f3e54e4065a24a31df8f75cc3.jpg
Glad you had that stop! This one has gapped nasty before and then stops aren’t much help.
Friends don’t let friends trade BAS! I’ve followed them for awhile. They could go BK literally any day now. There are better fish out there; large ocean. Just not worth the risk on this one.
Big gaps on most the miners. Fill first I would think on this retrace. Overbought on the 30min.
IPI is still chugging along at +11%. Look at the hourly. Wish I owned.
My 2 biggest miners are crushing me today. RIC and AGI I can’t believe how they act relative to sector.
You mean crushing your spirits here? I dont see them down, but they are still at the bottom.
Ha, I have RIC also. I had NAK and sold it and held RIC when we started to get the big draw down. Talk about picking the wrong horse?
grab a different horse from the stable………………. ? 😉
HB
Or do what I did and just buy pretty much every horse!! #BH
You don’t like RIC? I bought some GORO also.
… u said u picked the wrong horse… 😉
As I mentioned below, relative to the 50 wma, golds took off from the Dec-Feb bottom at various times. AGI was one of the latest ones to cross up. It still produced a double to the top.
If I may:
I think we can all agree that Gold is considered a “currency” in todays world (maybe even Bitcoin now?), since Gold is Not an interest bearing vehicle when Interest Rates (Bonds values moving lower) Increase Gold should Decrease in theory…….I think that is what I/We are seeing now….Bonds are Leading Metals.
I understand that the Yen and Euro will also have it’s “effects” on Gold but over the last few years Bonds have correlated much better…imho.
Would it not behoove us to start tracking Bonds, as I have been, going forward ?
Or atleast consider the impact Bonds might have ?
giggle (ken pounding the table ….. bonds … bonds … bonnnnnnnnds…………….. )
😉
LOL….Maybe I am missing something ?
u like the bonds (story) …. ;o)
#JamesBOND
I forget: Shaken Not Stirred ? 🙂
u got it ;o)
i like my whiskey straight up ;o)
Bourbon (single barrel) on da rocks !!
oh my……
w/ a cigar in your hand? giggle
I’d lick that glass clean ……..
While I wouldn’t disagree with the points you argue Ken I have seen various analysis of VERY long term trends in bonds/interest rates, which argue that a MAJOR (36 year?) bull cycle in bonds/bear cycle in interest rates is on the turn and we will now be looking at a new long term BULL cycle (rising!!) in interest rates. Given the more recent and very close correlation you are highlighting I’m not sure where that would leave gold unless of course that correlation starts to break down because of other factors!! But as you say something we arguably need to keep an eye on. My understanding is though that the really important factor is not nominal interest rates but REAL interest rates (i.e. taking inflation into account also). If correct then if inflation really does start to bite again and rises faster than nominal interest rates it would arguably allow for both rising nominal rates/falling bond prices AND rising gold prices!! Its all very simple really!!! Not!!! 🙂
Yes agree Chris, thanks for your input.
If inflation is on the rise, as I/we suspect it is, the Fed. will counter act and raise rates for sure, How Much AND When is the key ! If so: will Gold follow Inflation or Rising Interest Rates ? 🙂
BTW: the Fed Wants higher Inflation…..
I’m covering it in the weekend report
Clearly you have been reading my posts! 🙂
” When Interest Rates Increase Gold should Decrease in theory”
I will discuss this in the weekend report. I have done studies in the past .
Exactly. We can look long term and find times of looser correlation for sure. But in the recent sell-off? It was bonds leading gold. That was part of my issue with the sell-off (I probably did not articulate that well) – gold did not trade on its own merit but in the shadow of bonds and then secondarily Currency pairs. Therefore, the technicals didn’t really matter that much, allowing us the get much more oversold and stretch longer than we imagined. If only I knew that in September…
Alex, I’ve got AG and AUMN from back at your October low call. Hypothetically, do you think it’s better to add now on an up day, or wait for a pullback?
They are both acting correctly, and I usually add on pull backs. I was adding to AUMN on tags of the 200 sma.
When I look at a chart of AUMN though, this now looks like it may be building the right side of a cup. If I was going to add XXXX amount of shares, I might add 1/2 and then see if we get a dip & add again.
That’s just my style, but also if I was super heavily invested in AUMN, I would wait for the pull back or just enjoy the ride.
WAIT…I took a quick look, Iwouldnt buy it here
Refresh, wait for the dip
.
https://uploads.disquscdn.com/images/0ab600d3904cb9ecfb2dd183b74b5c82e7621a0dd78444f4ecc1a8d471483853.jpg
I need more AG myself. If we get a pullback, even 1 day, I plan to add. I love the chart and potential on that way. Also in AUMN as well.
Just found Alex and joined yesterday. This is the best site! So happy – good reports/charts
and good comment group that doesn’t make neg statements to each other!!!
My faves are AG, CDE and TRX. VGZ needs to catch up.
Welcome!
Hey SEER!
Welcome to Chartfreak & Thanks! Even though I wouldn’t put up with a lot of negative attacks and that unhealthy kind of trading environment, This group of traders / commenters are a top notch when it comes to respect. It’s like a little family that gets along 🙂
They are helpful and share ideas on trading that have helped them in the past, etc.
I also like your picks – If we are starting another run up in the Bull market after a multi month correction, those should do very well.
hello… :o)
congrats on joining…. be prepared to be dazzled…….. 😉
**by ChartFreak …..
And HASSLED…..
**By Maria 🙂
https://uploads.disquscdn.com/images/788d5b0c9709bb3b32cf021c76c291c87ac30967545d0dc8a082e849331d53c9.gif
why aren’t your pics embedding like in the old days?.
i have to open it in a separate window, which causes me unnecessary distress.
L…O…L…. Oh sog u r 2 much. 🙂 but this i do not know. When u refresh u dont c them?
how about now? (i hav this hanging on the wall..next to my special Cookies4Santa…
https://uploads.disquscdn.com/images/e02fd6bff1191afe43ff2da8201caec95116587b63faeea96d5401147b93906e.jpg
yay!.. that worked ok 🙂
did you do summat different?
btw.. i didnt even need to refresh to see that
… thats how i like my giffage.
Im on my cell now… B4 was at work…..
Or perhaps becuz they’re ‘G’ rated? 🙂
https://uploads.disquscdn.com/images/7cac26fc2cdfc0ca46e56cb74b72a765f87e7aa6f0649e00afeddfcb4364ffbf.png
hey.. how’s it going Tommy? 😉
#shesapinballwizard
Hey SOG! It’s going fine…I’ve just been waiting and watching…:) Doing some studying tonight on charts….past 2 days have been a little nuts at the house with folks here so haven’t been able to get on computer quite as much. I’m really biding my time…..timid about getting gold stocks still…..with FOMC coming up….so much to read up on tonight!
Tommy???!!!?
did you not notice?… its what Crawdaddy called you the other day.
i lolld
ah, yes! I remember he did that but I didn’t see you lolld…hahaha! My new nickname… https://uploads.disquscdn.com/images/063638820924d49931c809ce4d9211eb54cf7dcea6a9da0b167b5f339bdc99df.png
*AllinAdaysWork ;o)
I thought you were talking about me! :(………
Smirk -oops.. Did i say CF by mistake?
**Dazzled by Daz
Much better. Carry on ….. 😉
HA!!
Thank you Maria! How long have you been a member here?
Since inception… I had bumped intoCF a few years before on stocktwits… 😉
Maria was actually one of the very first sign ups. 🙂
I have VGZ and it’s one of my better performers, probably just got a lucky buy on it. It could break out and really run from here. GL.
Welcome! I think Alex has the best site around – everyone here is very supportive and friendly – and his advice and analysis is top notch – I’ve learned much here and hope to learn even more! And everyone has a good sense of humor as well, which I love! 🙂
Thank you! I think this site is safe to post our photos . . . now if I can only figure out how
to do that!
Thanks Tammy, for the kind words – You know that you have added a lot of goodness to this community with your posts too. I Appreciate it.
NAK looks too streched beyond 150 and 200 dma. I am thinkjng about getting out and reenter on pullback.
In Jul-Aug, NAK stayed overbought for 12 days. Let’s do that again.
If you see a spot to add, let us know. I’m looking to add more but not at the wrong time.
Sure
Maybe that helps.
https://uploads.disquscdn.com/images/9c44d1f5e44abdd9beee7c677021b4d81a5653a726309e20db428c818a6dc0d4.png
If gold stays above 1170 and then break above 1200, may bewe will
see 1300 again.
downside pressure remains strong
but st positioned for an upside bounce
GCG17 Feb Future Nymex
Weekly
The text on the chart see above.
junior gold shares starting to rise faster then seniors, positiv
Yeah, my best performers today we’re micro/baby miners like AUMN, VGZ, etc.
Gap fill time
Losing altitude on GDX/GDXJ. Nice to have a green day of course, and some individual miners are acting fantastic – but we need to pick up some momentum and see follow through.
Yen daily chart says it all folks. USD/Yen rally time and gold miners sell off. Ugh.
Let’s see how this closes. TLT/Bonds remain on the stronger side today.
The market just went higher and higher each minute. Look at the intraday, it wasn’t volatile and no pop, it just marched higher minute by minute. The market strength has absolutely kept a lid on gold/miners this past month. I’m just glad that we still finished green instead of getting clobbered. Really need stocks to take a break if we’re gonna get new money into mining.
healthy advance with equities, breadth, new highs vs new lows. It’s amazing
Yes, that looks like a real move after that 1/2 cycle dip
Yeah my comment from the weekend report was I was going to go long the 1/2 cycle low in S&P once identified. Then we gapped higher Monday and it was gone. Dang.
If it is at a 1/2 cycle low, It’s not “Gone”. It is the start of the next leg higher
I meant my trade idea. I missed my entry! Early today might have been a shot as well. But I wasn’t able to really watch and then saw each ended the day up 30. Wow!
I have plenty of positions so it’s all good. Though a bit more diversity would be good for me!
Ahh, gotcha. Didn’t want you to think that it may be a 1 day wonder type of thing.
Crude Oil Count:
My stop in my USO Calls will be below the bottom of blue wave 4, expecting wave 5 of iii to take profits. https://uploads.disquscdn.com/images/04c1c60c23122e3e85c2416b9f3aa8eb76fe7f03bf0c66b186f5624ddd05664e.png
I am not sure where that wave 4 bottom will be, maybe a test of the 10 sma?
Nice plan! Wave 2 was a bit deeper than 10 day, so maybe give her a little extra room? I’m pretty bummed I missed energy this time around, but I decided I didn’t want to trade ahead of OPEC and I’m loaded to the hilt with miners!
Yeah, with a possible rate hike next week, why not at least think about it, right? 🙂 lol
#wonderboy
Maybe even have a few comments on this chart from Maria…. 😉 https://uploads.disquscdn.com/images/f04aba5fe2453b6f6cb1925f4a9a83708d49e6990179f8f8f8dbb69f7a564d77.png
who is that ‘webmiztriz’ ….. ?? she’s pretty good
🙂
gotta few tricks up her sleeve…….
SURE
I am a bit mystified that UWTI is trading normally when it is going to be delisted. I would have thought that everyone would have piled out at the exits.
The chart of UWTI is a twin of UCO basically.
It still has to reflect the actual price of oil
I was wondering the same thing as Alex – so if it has to reflect the price of oil, does that mean the actual shares traded…might not actually be held by a real person or something? So there’s no way to tell how many shares are really “out” there with real people? Hope that doesn’t sound silly….:)
My understanding is that the more people buy, the more shares they issue to ensure the price equates to the value of the commodity. I would assume when selling is heavy they just take the selling shares out of circulation to balance the price. If it’s a close ended fund (which UWTI is not) then the shares are not adjusted and then price can move very far from the actually underlying assets. There use to be a close ended fund for nat gas. I remember it was always going up even though nat gas was falling. Since buyers outnumbered sellers, up it went : ). I don’t know if there are many closed ended products anymore.
How about VIX? – maybe the ECB is going to do something unexpected tomorrow
Very interesting looking reversal on the vix, even has divergence in the MACD
Alex, if you get a chance can you comment on what you think of the CIE chart? Thanks!
Now that it got back above the 50sma, it looks good. I actually bought this one and got stopped out this summer, and never looked at it again. IT looked like a bull flag / triangle pushing on the 50sma, so I bought it early ( Didnt wait for the break out above the 50sma) and it sold off instead.
It seems to be recovering, BUT I DO NOT KNOW HOW THEY ARE FINANCIALLY .
Alex: check out the YEN. The USDJPY just broke the critical 113.50 level. Fingers crossed:)