
11-30 Lining Up
It seems that many things within the market structure are lining up again. Let’s take a look…
.
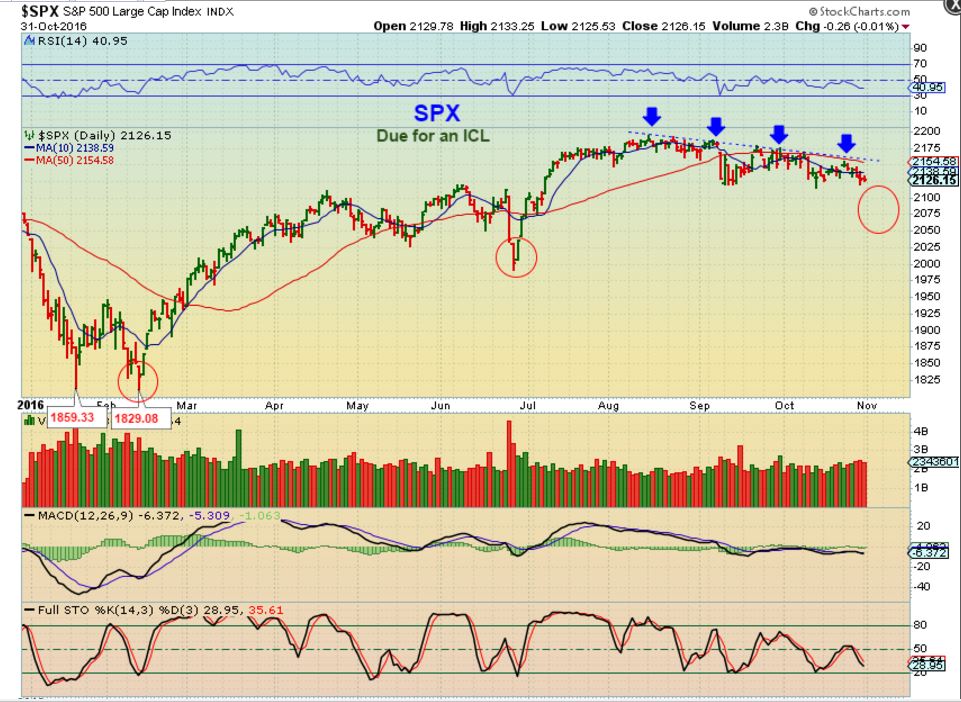
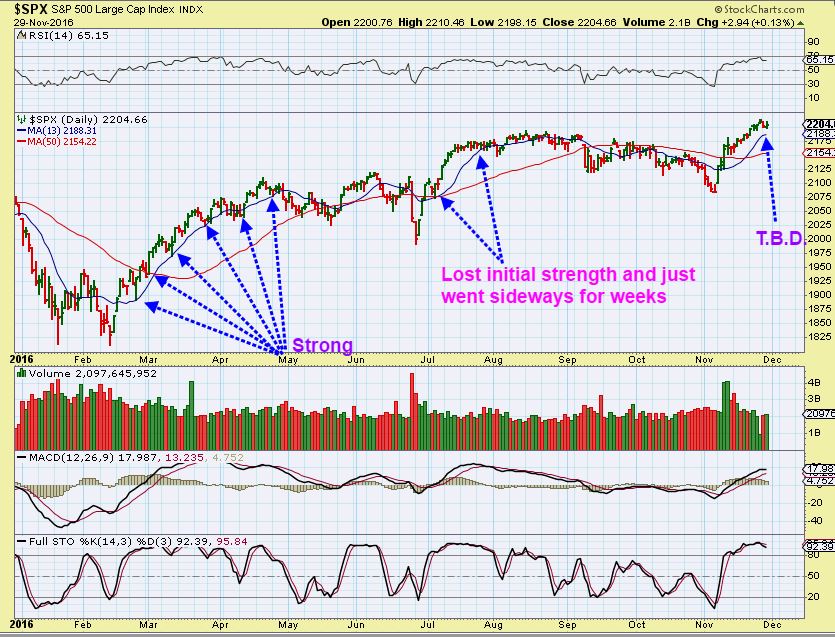
SPX – We did get our initial burst higher out of the anticipated lows as shown on the 2 charts below.
.
This was Oct 31 – Anticipating the trade-able low
SPX now – We got the lows and the initial run higher, but will it continue? Notice how the 13 SMA affected the first run. The 2nd run tagged it and then crawled sideways for weeks. No good trade resulted Long or Short for months last summer, and that may happen again. It can still be bought or held above that 13 sma.
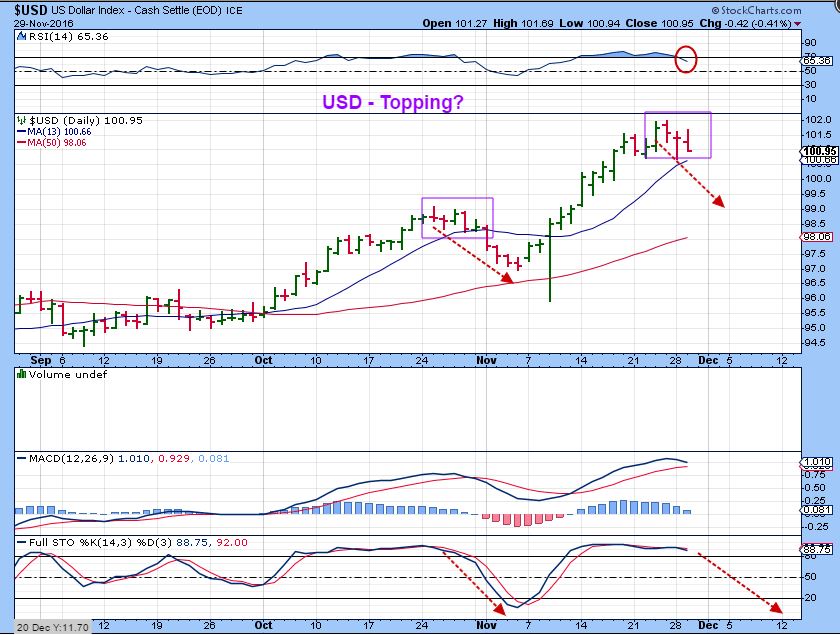
USD – I believe that the USD is starting to dip down and find it’s DCL. This should help Gold, and we will watch how Gold progresses going forward.
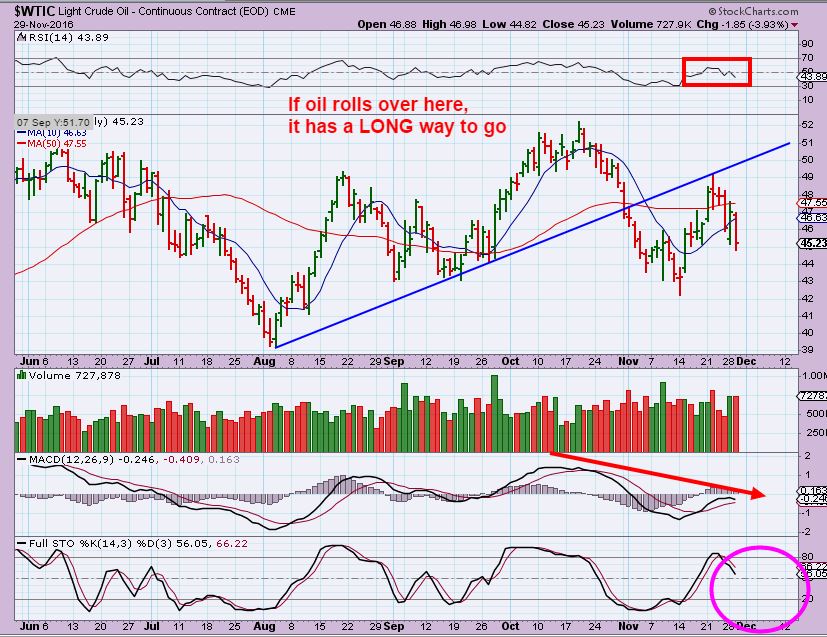
WTIC – Oil is acting exactly as I thought that it would. The OPEC meeting is Wednesday and if they do not come to an agreement to cut supply, I expect Oil to drop much lower. I’m expecting a break of the Aug lows too. If they cut supply, it could be big. ( EDIT: Oil up 4% pre-market now with possible OPEC news – I’m watching that blue trend line as resistance, but breaking back above the 50sma could be bullish if it holds).
.
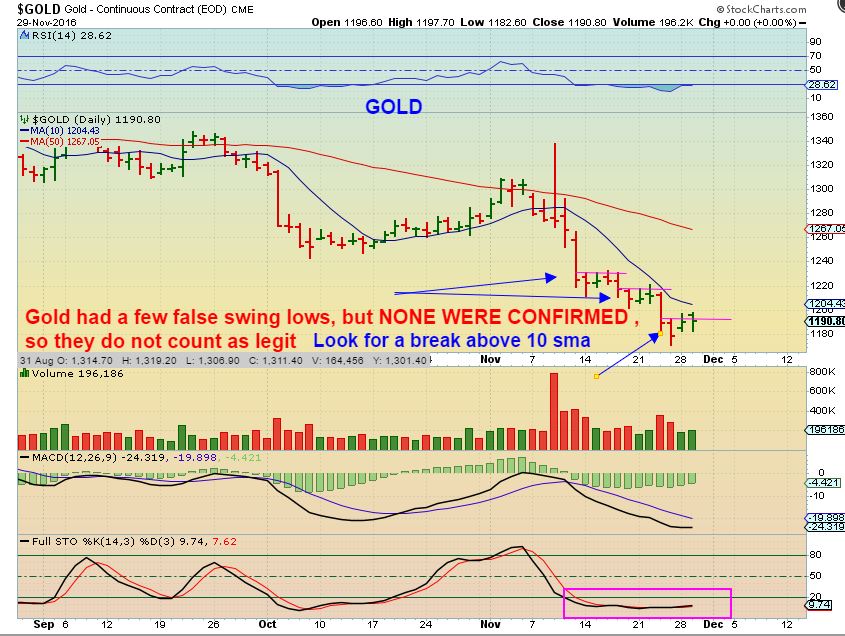
GOLD IS AT THE LOWS, THIS IS WHAT I AM WATCHING
.
GOLD – In cycles, you get swing lows and I ALWAYS say that it is ‘unconfirmed’, because just forming a ‘swing low’ is not reliable. We need a push above the 10sma as the first sign of a more reliable DCL. A move above $1205 would be satisfying. Gold is very oversold.
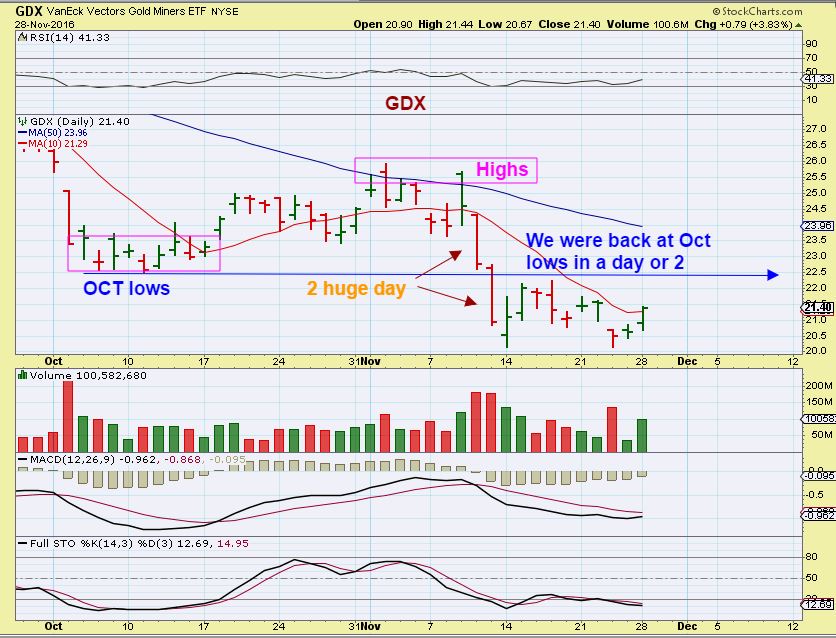
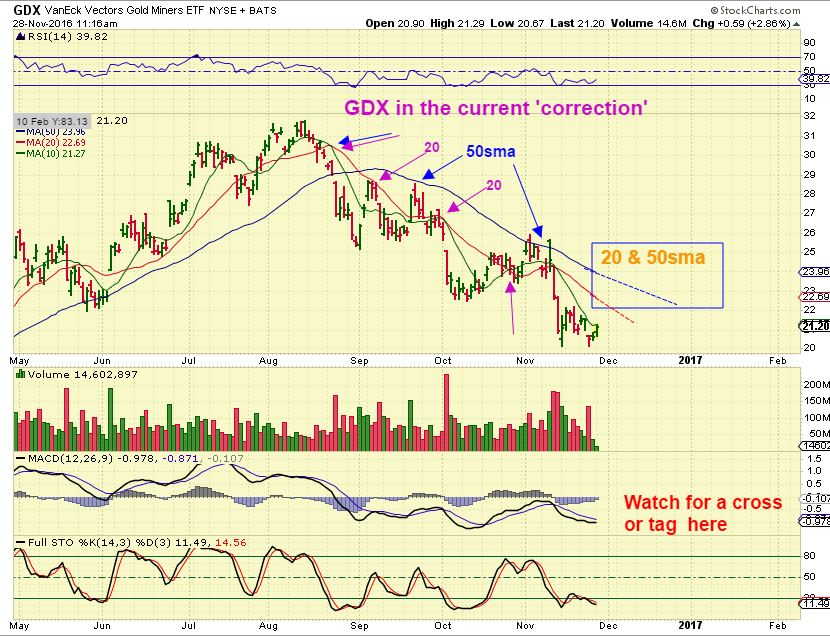
GDX – Again, the move out of the OCT lows was a normal looking daily cycle for weeks, so we may get that now. We have not had a major 3-4 week sell off like I keep hearing people say. This chart shows that it was a 3 day crash after the election.
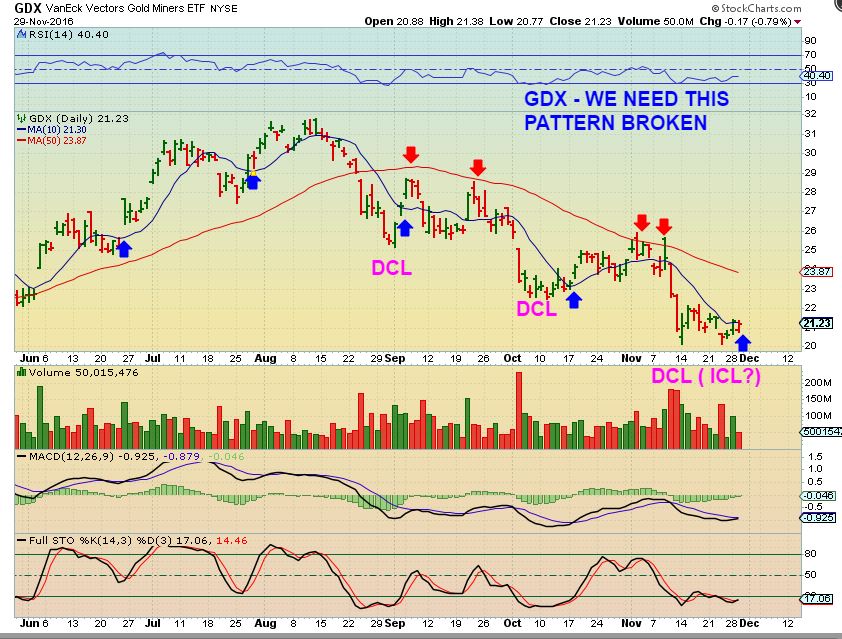
GDX – I want you to look here at what I am watching going forward, I will explain. GDX started an uptrend in January and the dips were mostly higher lows, higher highs. A normal correction eventually comes, and we dipped down to the 61.8% retrace level. That is fine. NOW WE NEED TO BREAK THE CYCLE OF LOWER LOWS – LOWER HIGHS. This is my final line in the sand, because ‘normal’ corrections do not just keep dropping all the way back to test the lows, that is a renewed downtrend until it is fixed.
.
1. Please note: After a DCL, we get a push back above the 10sma.It trades for weeks above the dcl.
2. In this downtrend, it cannot break and hold above the 50sma.
3. I suggest we focus on the 10sma, the 50sma, and the future prospects will become clear.
4. Anyone worried about a failure could sell at the 50sma until further confirmation.
The above chart is why I didn’t panic out in the sell off. KNOWING THAT WE WERE LATE IN THE DAILY CYCLE, I had no reason to panic and get emotional. We should get some kind of “Relief rally” at least. I expect a tag of the 50sma here. It may be an ICL that we are putting in and we just blow up to a new Bull run, higher highs and higher lows from here. If so, we have the all clear for weeks and even months as this runs higher …or… We have a persistent downtrend and we struggle going forward. No new highs, lower lows . At that point, we do what we need to to make money. The alternatives will be discussed at that time, it could even be a DUST trade for some. If the Gold Bull doesn’t act correctly, we may even have to leave this sector for CLF, CLD, SID, TGB, FCX, AA, CEBX, etc, and they should be pulling back and setting up by then.
.
Here is something else that we want to watch.
WHAT IF WE BREAK THE 10sma, BUT STRUGGLE TO GET TO THE 50 SMA in this daily cycle. Is that indicative of anything?
.
GDX 2012 Bear market– There is time to take a position, but if Gold or Miners act in a lack-luster way, it may be a signal that the bear selling has taken hold. The 20sma becomes our resistance too. Notice the 20sma and the occasional tag of the 50sma. In my opinion, we are at the point of looking for a Bull or Bear market clue.
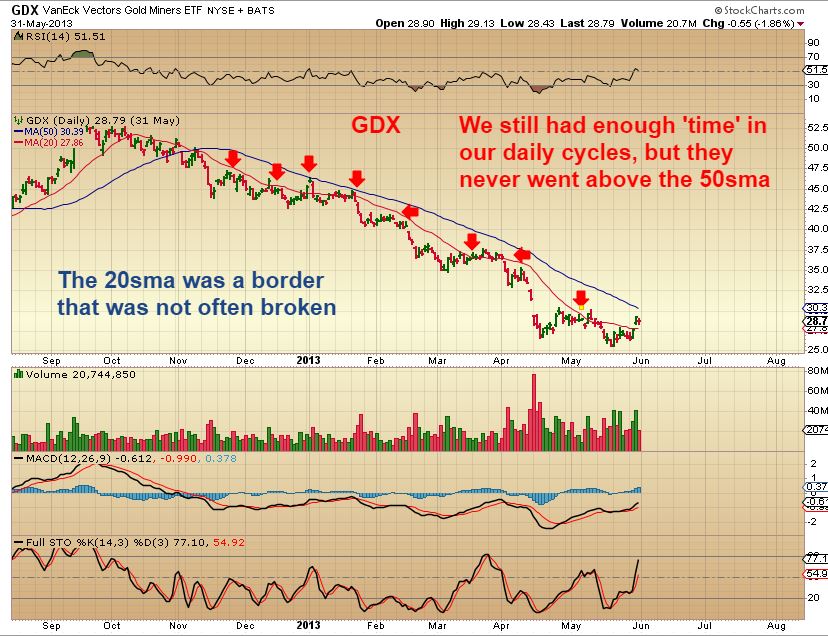
GDX 2012 ZOOM IN – We have time. We still had daily cycles with days of sideways moves holding price up. STOPS are the only thing that protect you when it finally decides to drop to each new low. SO WHAT I AM SAYING IS….we have a little time. You can take positions in your favorite Miners now…use stops just in case this remains in a downtrend and does not behave like a normal correction.
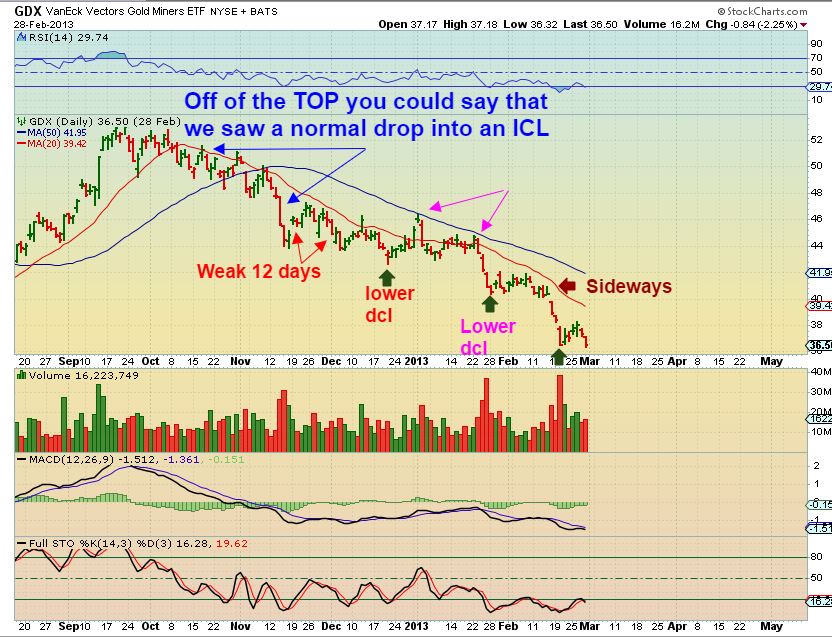
GDX NOW WITH THE 20 and 50 sma. GDX still bounced off of the 20 & 50 in this correction too, so let’s see what happens when we get to the 20sma. An ICL should take us at least to the 50sma.
Note to self: The GOLD 2012 downtrend also acted in a similar manner, we still had plenty of time to buy the lows, and then watch for a break out or rejection at the 50sma. Too much sideways action becomes a sign of weakness.
And again, I am at the LIMIT of what I will accept as a normal correction. If I get stopped out this time, I will sell anything that I own that is not acting correctly and I will then raise mental stops on my good miners like GPL for example. I will then have to see how Gold plays out.
.
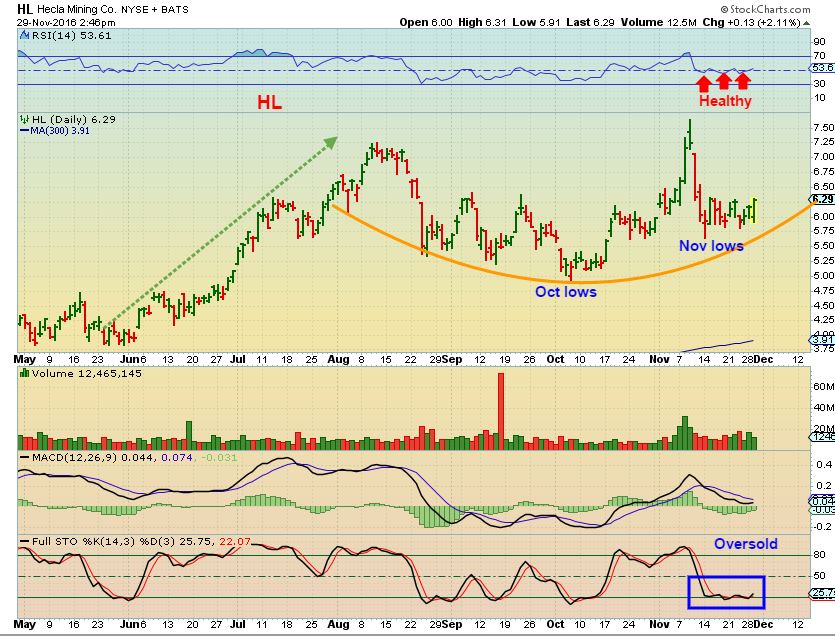
Do things look o.k. here after that Post election selling in Nov? After our 3 day flash crash, I’ve already mentioned that some stocks like GPL, GSS, HL, PAAS, and a few others resisted the sell off, and are even breaking higher. Look at …
.
HL – The OCT lows were never threatened. This could be bought here with a stop under the Nov 14th lows.
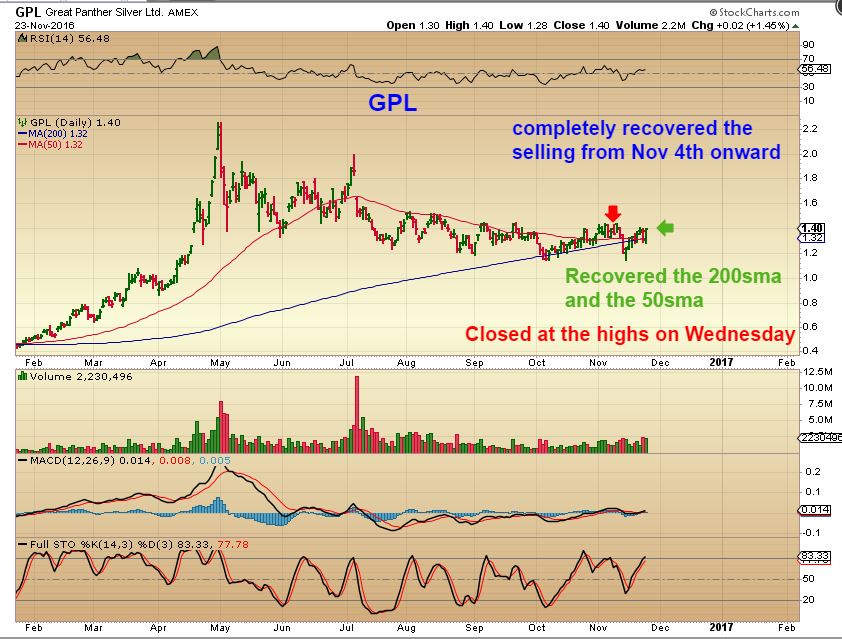
I posted this GPL chart from October through NOV as a stronger Miner – I was pointing out the bullish set up despise the post election sell off here on this chart Nov 23rd. It completely recovered that Nov selling and looked ready to break out from this base.
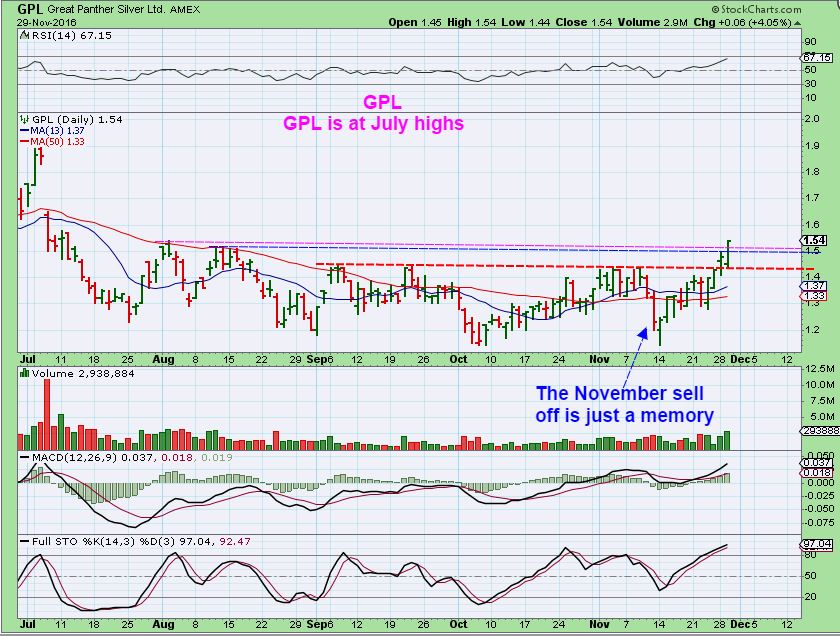
GPL Tuesday – While Silver lingers at the lows, GPL continues to break from its base ( read the chart).
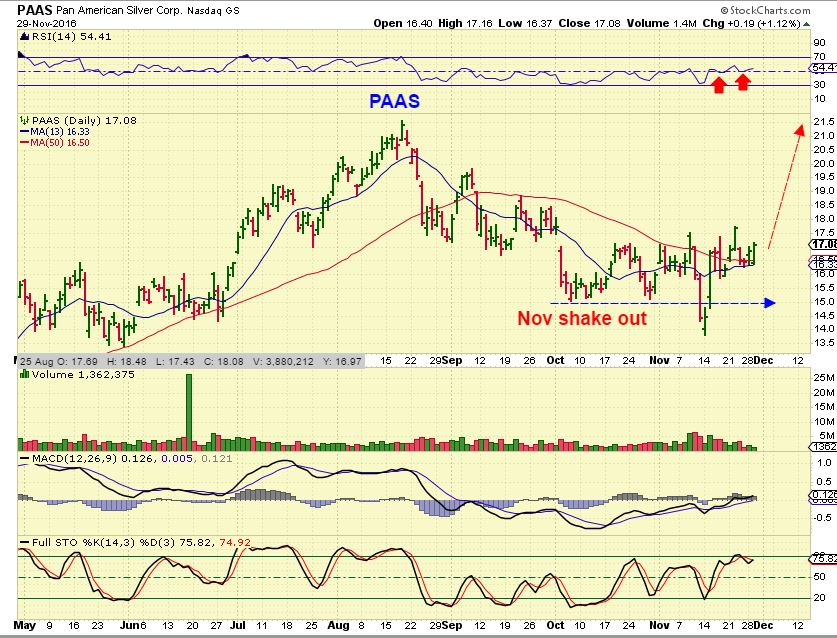
PAAS – While Silver lingers at the lows, this looks ready to go too. Novembers sell off is also a distant memory here, as a 2 month base has formed.
.
So this is where we are now, and this is just another one of the areas that I am watching as we attempt a recovery out of the recent DCL ( ICL). I see some Miners recovering and that gives added encouragement to the expectations ( or hopes) that this ‘correction’ is over and we have a very meaningful ICL behind us. If we do, the gains in this area will again be great %-wise over the next few months. Please know that this is a step – by – step process of confirmation, but the time to get in is always at the lows, honor stops to keep losses minimal, know your trading style and risk parameters. Buying now and being stopped out at the lows would not hurt that much. It’s a risk / reward scenario. With some stocks already recovering their sell off and others not breaking October lows, things do look as though they may be lining up in a bullsih manner again. This may have been a normal correction in a Bull Market, and hopefully it is ending. Time will tell. Enjoy your Wednesday.
.


Though the drop in Gold is not ideal this morning, rather discouraging, we are only at the same lows that Gold was yesterday at this point.
Nice pop in Oil so far
Its amazing how the price action for gold follows the same pattern of highs and lows each day at the same time. F5 https://uploads.disquscdn.com/images/db29b3cc28e87e2304a1d68ac1d1756b284885c92e2cbe0370a053d5d62334f0.jpg
Yeah..whats that tell ya.. 😉
meow
HB
$1180 now, we are in for lower lows Today! #HB
Are you worried about lower than yesterday or lower than Friday.
I doubt that we break friday, if we do, something isn’t quite right. The daily cycle would be just too long.
I think Lows are in place
And there is a spike in gold. $1186 now, holding promise. Alex, I like to see the pattern broken higher not lower, is all I am saying. Its curious how it tracks the same each day? Seems like we should be able to make money day trading………
You could make money day trading
Thx Alex and that’s my concern as well that we seem to be chewing up time and just not powering up. I would expect in a bull market for the moves out of icl and even maybe a ycl to have more power. Makes me wonder if we get one more low on big +divergences but we will have to see how this plays out as I do believe these next 3 days will give us our roadmap.
The difficult part is that Miners bottomed first, so if I look at a chart GDX, it seems to be chewing up time. Gold just bottomed and would be on day 3. GDX looks like it is on day 10 .
That would likely resolve over time, with both eventually putting in a low at similar times, but it makes the process difficult for me to monitor.
As for the idea that an ICL or YCL would have more power and just surge upward, I have seen both in the past. V-Bottom or long base.
Look at Dec 2015 to Jan 2016. That bottomed from Dec 3rd in GOLD based out and drove everyone crazy waiting for a sign of strength : (
Good morning Alex, Wow,if the miners are indeed on day 10, that means that they are due for a half cycle low soon. I’m as confused as the rest here . My best guess at this point is that we’ll need a catalyst to push this thing one way or the other,that would clear up the cycle counts and give us back some normalcy that was stolen from us on election night. I believe that the catalyst will have to happen soon, perhaps the Italian vote Sunday. Keep smiling!!!
I do not necessarily believe that a 1/2 cycle low would be due here.
Look at the move that eventually came out of the Jan lows in Miners. Almost straight up, no pull back necessary..
I think that if Gold took off higher, Miners would simply follow and have a longer daily cycle.
Good question, Em, I had the same one. Worried about the cycle time on GDX as well, but Alex’s response makes sense, following the plan in the post for now. 🙂
Thank you Alex for covering my question. The YEN seems to hold the key here and should give us some clues on what the USD and therefore gold is likely to do short term. It may be forming a bottom (same with the EURO) as against the USD on the weekly. However, things can still move higher even though overbought and I suppose that includes the USD. Can you give it a look see to determine whether the charts suggest we may be bottoming on those two currencies?
Yes, They do look to be bottoming, I have looked at them. The problem is….it is always a process and bottoming can take time.
Alex at this point are you suggesting that Nov 23 was the cycle low? Or is it the Nov 14 low that GDXJ put in?
Edit – you answered below as I was typing
Yes, the charts show Gold just bottomed Friday and I usually go by the metal, but since Miners didnt break the lows, they look to have bottomed earlier.
so if they both bottom at the same time i the future ( lets say Dec 23 for the sake of discussion), it will just be that Golds first daily cycle was shorter than the miners, but they could then sync up
This is how I’m seeing Gold currently., and this is an hourly chart. It honestly looks like the bouncing around is normal base building and hopefully this base is to launch higher soon.
.
refresh
.
https://uploads.disquscdn.com/images/8ae1a5eb35da61310d2fdcc3e95226a495cd2b23768402a33fdefe45114cf49b.jpg
agree… attributing that to backtest b4 leaving station…. even if just an abc … 😉
not putting no money on it but IF oil falls from here there’s a nice H&S painting out on the daily going back to August. It’s amazing what you can see when you want to (bias)…:-)
Are you talking about the same one pointed out in the report this weekend, or are you looking at something else?
refresh
.
https://uploads.disquscdn.com/images/7ce9aa6722f4a6ceac9d5ca94d36b0e1b9e3c67a303e0ab88a43d689d6209115.jpg
haha! Seems you need to teach some of us subs how to read:-) Sorry for pointing out the obvious…
Maybe I need to post less charts in the weekend reports so the important ones stand out as more memorable 🙂
no way…. i would love to print them all and make a book…. my sister works in the print shop and could easily bind it for me and then i could take it to FLA w/ me in Feb and read it by the pool …… ;o)
#CFette
All, I want to apologize for my boorish behavior and fear-induced posts last week. The recent price action is not what I had originally expected and when GDX came back to re-test the lows at Thanksgiving, I pretty much snapped. I made comments rooted in anger and frustration. That helps no one. There was no chart analysis and no fundamental story, just pure raw emotion, and that is not acceptable. I did not realize this until after the fact. I also didn’t realize how many new subscribers we have on here. Sometimes we get emotional or angry and need to vent (happens more often to some of us!), but this wasn’t the right forum and the comments went from unhelpful to down-right fear-mongering. And for that, I am truly sorry. I have many on here that I now consider friends, and don’t want to endanger that b/c I lost my cool for a few hours. I also did not want to shape the experience negatively for new subs, that would never be my goal. I’ll probably get frustrated again in the future. Especially if gold keeps just lazily messing around at these lows. But I’ll keep it professional. Or I’ll self-ban if I can’t.
GL today to all, and would someone please tell gold to stop sucking.
https://uploads.disquscdn.com/images/2303dcd92515367381264ff6cbc2cd95ec6af1aba518f6e22afcd090869d2928.png
Not necessary Cason, but thanks. I’m sure everyone appreciates that and I know that everyone here likes you a lot.
..welllllllllllllllllll .. let’s not get toooo craycray …. ;o)
That’s right…. repent and belief.
Cason….. thanks and be blessed.
Thanks, Guert.
I vote for the self-imposed ban. 😉
#BadSanta
That’s gonna happen if gold goes any lower. Grr…
promise no 3xers (when working) … life is much simpler & easier, less stressful ………. :o)
Cheers old friend …
*as in long time … not old as in SOG ……………… ha!
I just wanted to know if I was blocked or not…
Of course not….case… after all these yrs im used to ur rants….. 😉 not gonna lie …not a big fan of the barfing all over the feed…:o) ….buttttt i definitely understand the frustration that’s for certain. 🙂
Everyday’s a learning experience for us here in CFland…. https://uploads.disquscdn.com/images/cbab737704b24edc2b045d9177b9d8f5214fe04ad940954b52a742fa52eed6a8.png
I just have so much to say. If only some of it was useful…
But barfing random gifs is always acceptable!
Thanks for the apology. You got me to observe my own emotions and re examine my own viewpoints… at that time. I did not do anything rash…but I was more on alert. I did not think it was a bad thing.
Thanks, Nancy. Not sure how you stay so inspirational, but you keep doing you!
Cason, this has been very tough on all of us, chin up.
yup…
#BuildsCharacter
🙂
Glad that I am in good company but certainly wish better for you all!
You probably didn’t say anything that I wasn’t thinking in my head 🙂 🙂 I’m with Nancy – it made me think about my own emotions as well – so a learning experience for all of us! All is well. I did have a talk with gold but it won’t listen to me. 🙂 🙂
Thanks, Tammie.
Some of those energy stocks that put in reversals ( lower) yesterday, are up big pre-market on the Oil news.
That is becoming a fun sector to watch. OAS, CPE, WPX – etc
wow…oas …
hmmmm …. rest time?
https://www.tradingview.com/x/tuopNnQj/
Gold definition:
Schizophrenic
Good morning….. explain a bit more Alex if possible.
Thanks.
Just a joke G.
Just to clarify- if gold and miners hit a new low today together that will restart the count, but since it is so late in the cycle you think this would be bearish?
That is what I am feeling. It is so late in Golds count that if Gold makes new lows, I see it as problematic to the bull view.
Very strange…Gold dropping down looking like it wants to test the lows from last friday. Looks rather ugly, but
AUMN, GSV, THM, VGZ, AXU, still green (so far). Just odd.
Hey ALEX: Just looking at the weekly MACd on JNUG: unless it’s my imagination it looks to be bottoming with this consolidation over the last few weeks. Comparing this bottoming with that of October: the weekly MACd still had a severe downslope even when JNUG move higher during that time. But, now the angle of descent appears to be bottoming or at least very close to flattening out. The weekly STO has definitely flattened out and have begun to move up ever so slightly during this phase. Significant?
Sorry, I’m not seeing it on a weekly chart
I used a one and three month chart on stock charts. Like I said-may just be me.
Still seems all about the Yen. Relentless weakness translating into dollar strength. With commercials now long Yen, the weakness seems to be sucking in the momentum traders on the short side. Very oversold, but no relief yet. When that turns up, gold will get a breather….But unsure how long the current trend can move.
I agree about the yen, but gold playing with the lows is concerning. A new low puts the count for Gold on day 37?
I need to go back and do some counts on prior bull markets and see if they went that long. That seems a lot longer than what I recall
Alex,
Are you concerned that we only bounced for 3 days in a new cycle and have 25 more down days?
Why do you say 25 more days down. Did we break the lows?
We may still have 25 days up. Nothing has changed at this low yet. A break of the lows in concerning.
I meant if we broke the lows….yes…let’s hope for 25 more up days…..
thx
Yes, as I mentioned in the last couple of reports, If we break the lows, that is a concern. The 61.8% and the cycle timing are at my limit for being hopeful of a continuing Bull Run. So far, it could be a correction & shake out, but breaking lows from here is not healthy.
I then have to view the action as potentially more bearish and see how the cycle plays out while lightening up on positions.
Crude Oil:
Moving my stops to up protect profits on my USO Calls.
Currently in the 3rd. DC of this IC with about two more months left in this IC.
EW: Aug low (ICL) was wave 2 down, now in a wave 3 up.
May Russia pressure Iran to “get in line”. 🙂
i cant believe u just posted… i was JUSSSSSSST going to ask you if this is what you are looking at.. i havnt seen your oil count in a long time…. ive been tracking this OLD pattern.. kind of creepy same candles — hoping that this “3” or “C” starts acting more impulsive…. (please check my count – i removed the training wheels to ease ur old eyes 😉
TIA ;o)
https://www.tradingview.com/x/4eNC3Q6T/
Looks like fine art to me…….. 🙂
Count looks good to me……
wow… thank u kindly fine sir ;o)
I thought you would have been stopped out from the last time you posted that you moved up stops to protect profits.
I remembered you bought on Halloween ( Oct 31)
Nov. 14 almost took me out with the possibility of the TL break……I adjust stops almost daily…fyi.
Quite honestly I would have most likely held even if it did to see if the Aug. low held……
The Aug. low is KEY……….
I think in my mind I looked at it this way ( Maybe mistaken).
I looked at a chart when you said , ” For those following me, I’m raising my stops to lock in profits”
I remember on halloween you bought near the 50sma, because I was looking for a trend line break ( it broke later). So I looked on the chart to see where ‘profits’ would be that you were trying to lock in with stops. Halloween was when Oil was near $48. Stops would have had to be really tight last week to lock in any gains, and then Oil dropped quickly , so I just thought that you were out of the trade at that point.
Maybe you bought more lower on the drop & didnt post or I missed it, but I ‘followed along’ when you posted for us to follow along 🙂
I think I may have missed other buys that you have better profits in.
holy similar patterns……… sheeesh
https://www.tradingview.com/x/GjYGfXOw/
My stops are adjusted daily and “good for the day only”.
I do this in case there is a Gap at the open up or down (especially in OIL)….which gives me an opportunity to anaylize and adjust……Daily.
ie: the Nov. 14 gap down…..do I add to the position or place a daily stop below that TL or below the Aug. ICL…….I added btw with a stop below the TL for that day.
Gotcha, good for those ‘following your trade’ to know 🙂
we do all have varying trading styles, I use what works for me, and other might not.
i hear what you are Not saying…… 😉
I will be more careful in my statements the future…….
My stops were below the TL which never broke ?
https://uploads.disquscdn.com/images/0d14ee8768d2887ab7225ea47565290b38a74b13bff25fb4746c7b2ef654cdff.png
Oh, your stops were way own there when you raised them last week. I thought that they would have been tighter..
The trend line that I was looking at is the trendline of this Intermediate Cycle, starts from Aug Lows (ICL) to the next DCL, which I have been drawing in my OIL charts. That trend line broke later in the day of Halloween at the close. You can scroll up & see my Oil chart in the report.
Not important. I thought you were trying to ‘lock in profits’ from your Oct 31 buy, when Oil was $48., so I thought your stops would be closer to the buy price. thus I thought that you were taken out of the trade. You never said where “tightening stops to protect profits’ was, so you obviously were not taken out of the trade. Thats good, it could work out if OPEC cuts production.
sold NUGT 7.90 0.61 loss foooooey
The 3x ETF is tough at these lingering lows.
Some lows you jump on NUGT or JNUG and it just takes off upside and keeps running.
Turns out to be an awesome trade because you can just raise stops.
This low is one of those difficult lingering lows. I’m trying to wait for a break above the 10 sma.
I bought nugt 1-19 and joined here the next day. that was really profitable. I sure would like that to happen again. and it seems to me gold has been pulling back into the jobs report lately.
Excellent … (insert clip from Bill&Teds Excellent Adventure) ;o)
That GDX 10sma is really a ceiling right now.
Need to break through that
Struggling on whether to lighten up on some of my OAS calls today
For the gold optimists: Does the 15 min of GLD look like a shakeout to you? At least, so far?
I think so. I think we are seeing a retest of gold, Euro, etc. and that stocks may be putting a top in as well.
Thanks for the extra incite.
GDXJ NOW – REFRESH
,
not bad, but needs strength soon.
.
.
https://uploads.disquscdn.com/images/8fde0cb0d78c5085f3880632ef63cb70f48bd8649420bbe092e56dad3f0c1e43.jpg
Now dropping – still no confirmed swing low
That GOLD is getting so close to the lows from last week, and that is really preventing GDX from breaking above the 10sma.
The only good thing is that GDX is not back at the lows ( yet- I guess it could follow as the day goes on).
I think Gold just broke the lows
I have a fractional break on gold but with some nice bullish divergence in momentum indicators on my 4 hour charts. But no break in silver or GDX!! Very confusing but think this might be a final false break in gold!!? I’m sure we’ll know soon enough.
party at your crib!! 😉
Anytime. 🙂
I have the previous low at 1170.63 and Todays low at 1170.70. Near perfect double bottom….
https://www.tradingview.com/x/Xnx0r4Ct/
Not any longer….. 🙁 🙁 🙁
That was a quick $10 lower wasn’t it. I am so ready to sell the miners I have. When I saw that last night I told myself I would sell in the morning. Now, its recovering, Alex’s report, looking up maybe. I’ll hold unless we start dropping again. Frustrating.
My hard drive crashed so am on a friend’s computer. Can’t be on much. But I can say,… I am pretty POed at gold right now! COME ON!
a last flush today ??
FWIW
this is one guy who’s working with the tom Demark system who emailed me this last Wednesday
I am still about 2-3 days away from thinking that happens. Yes, GDX has a Combo 12.. but Sequential is on an 11 and
structurally still looks to move lower
For now its still right to be long USD and short Gold and Short the Miners. This might change next Monday/Tuesday. But
until then.. we should still move a bit lower in GDX
I own some DUST personally .. the 2x leveraged
Negative GDX.. and won’t be selling until early next week
Well…I’m almost done here with GC. Placed all the stops and my miners are now being hit one by one. Kinda like sniper practice. 🙂 If I get stopped out here so be it. Will just have to re-enter. But with the lack of conviction this late and that drop below not prepared to lose any significant $$ in the acct (all ready lost some). Always another trade…
May I as what are were holding?
I’m looking at MUX, PAAS, IAG, NG, GPL, AUMN and do not see anything would take out stops. Miners do not look as severe as I would expect with Gold making new lows…but new lows on day 38? That seems extreme
AUY does look like stops would be run/.
My acct is a sea of red like it suddenly hemmoraged. Amazingly, none of my stocks has broken recent lows. With GLD falling, can we be getting a positive divergence between gold and gold shares? I am not an expert on this, but the words sound good to me.
The Miners are holding up well, still holding Nov 14 lows, while Gold broke last fridays lows.
It is a bit puzzling when I look at the picture as a whole.
are we finally going to get giraffe neck??? 😀
https://www.tradingview.com/x/qCpNPr59/
https://uploads.disquscdn.com/images/d066e2243b7f6aebd792791a23bd0c4a1d344197725b7a424cf98cf5dae35f6c.gif
I almost sold everything today. Everything. But with GDX barely clinging above recent lows, I held on believing that we are just too oversold. But it hasn’t mattered yet. It should soon!! (I hope). But I’m at the final line, will just have to take losses and try again if it sets up later.
really big volume in UCO & USO…they do believe this move in Oil
I know we are so late in the gold cycle that to hedge now is likely a guaranteed loss. But having said this, is there a level below which you would pull the trigger and hedge based on the fact that we might have a flush back below $1100?
My position fwiw is to stop out below GDX 20.13 and ReEnter at the next swing buy signal.
For the Miner jrs. I bght. yesterday…..
One could do that, I personally will just sell and wait .
GDX lows at $20.13 should not be broken, though their daily cycle count is shorter.
Gold broke lows today and I dont like the 38 day cycle count. I need to check past bull runs and see if there is anything comparable, but I do not like this correction in Gold vs past corrections anyway.
Maybe GDX is leading ?
I still think PM’s are setting up for an ICL soon. Wave 2 correction.
Bonds in a down trend = Inflation
Oil increaseing = Inflation.
USD topping last week = + for gold.
Trumps future spending = Inflation
Continued money printing from the FED = Inflation
That’s the thing, Everything seems to be saying inflation…..except for Gold.
Gold should be bullish in inflation, and that’s why I thought this had to be a shake out, to allow big money to position for inflationary Bull in Gold.
Big money (National Banks with Fed backing) still positioning imo…….
Maybe a longer term outlook/investment is needed…..?
I agree. I am not a chart person, EW person, or a cycle person….that is why I came to Alex….but I have seen situations like this and Big $ gets their way….they get their positions set before it is allowed to run.
Maybe the big money is REALLY suppressing the price in the very short term to enable them to ‘back up the truck REALLY big time’!! That is a nice thought! 🙂
And a VERY bullish one longer term!!
Ken gets it, but how do we get everyone else to realize this as well? We need the very sudden rise in bond rates to slow. Want inflation to outpace actual rate rise for a nominal negative
Even if we are entering a bear, shouldn’t we get more of a bounce to sell/hedge into than what we’ve seen?
Yes, at an ICL for sure. A dcl can roll over on day 8 or maybe 11, but Gold hasnt had that kind of time.
We should bounce from here, but it is relentless
Yes. Only reason I haven’t sold everything. Should have a reactionary bounce higher we can sell into.
To look at it from another perspective that some use which is a volume contraction pattern, the last dip on GDX 10 minute was about 4%. That’s still a bit much and maybe it needs one more round trip until the sellers finally realize they have lost the battle.
Well, the loss I have been holding in DNR is looking better today, woohoo! 🙂 🙂
i just saw that pupppy… nice Tammy! i sold out ….
#MariaFloridaFund
I had too big of a loss or I would have sold already…..been hanging on for long time on that one….bought long ago at wrong time…..maybe I’ll actually be able to eek out of small profit before it’s over with…:) Only down $180 now….it was down…oh geez…maybe $900+ at one point 🙂
Looks like a break out from that base.
Many of these energy stocks turned around nicely today, after diving down earlier this week.
It really looks like buyers and sellers are about equal now and that we will just need to carry on this bottoming process until enough of the weak hands are gone.
The pressure on MUX is equalizing now. It was one of the worst and now it is one of the first to stop the slide. Now we just need volume to dry up. Same with GUY.TO. and AUMN
held on to guy.to all the way down…stopped out this am! ugh! if it moves in the other direction I won’t hesitate to jump onboard. seems like a fundamentally solid company.
I was in it in the past – haven’t read the reports in a while, but it was a good one if I recall. It’s down 43% now and the overhead is building up so not sure if I would take it now, but when it does get back up there is nothing but blue sky.
Cannot believe what a difference a day makes.
These stocks got hit hard with reversals just yesterday. Check them out now
LPI, , WPX, ECA , OAS, REI, CWEI, ERA Yesterday crushed, today rockets
Then again, RICE was doing great too, what happened there??
Check out MRO & WPX, LPI – yesterday to today. Crazy stuff
Check out the hourly charts of GLD and SLV. There is a big divergence. I don’t have a clue if this is positive or negative. But if the metals rally, it will be a positive divergence for me. 🙂
A minute later: I just found that I have many positive signals on my stocks on an hourly basis. These are pre-buys, but useful.
That and a few other things are encouraging.
dunno bout the abberant cycle count, but EW looks like 5 nice waves for a C since election..
just dont need the C.v to get overexcited
. … & yeah, yeah, i know EW counts are subjective & unreliable 🙂
https://uploads.disquscdn.com/images/7d5ed2057d38f950b0fa97d9d7a7aea5a6043f099631867fd4787f3eda3bf14e.jpg
I’ll take it at this point 🙂
yesterday, i was counting up to the C.iv and into the C.v.. and was gonna post, saying to maybe expect a lower low (or truncated wave) for C.v…. but thought that might sound too bearish 🙂
reality is reality – gloomy as it may be.
Don’t hold back on anything factual. My comment in the report yesterday was not about stating real possibilities. I hope that didn’t hold you back.
Yelling fire in a crowded theater and claiming that there is no way out, all exits are packed with explosives, we are all gonna die!! That should be avoided – lol.
giggle
🙂
this looks nice on my $GOLD 2H indicator https://uploads.disquscdn.com/images/577706b96f1240e500ae8588c8bc281723af359e0b76aa51cbc59ba35da7eb6a.jpg
Great chart SoG. There must be something good coming with all this positive info floating around.
So, lots of agreement about C.v but how do you know when v ends? Like does it just keep dropping (doing that now!)? I can count current waves no problem but when does it end by wave theory? Not until I can start counting 3.1?
So looking at UUP – very light volume, looks to be topping.
GLD dropped to new lows on MUCH LESS volume as Friday.
USUALLY, this indicates selling has dried up in the GLD, Buying is running out in UUP, and Miners are not taking out lows.
I’m not trying to cling to ‘hope’, but those are legit signs of continued bottoming, but also we see continued weakness.
I see glimmers of light at the end of the tunnel also in various ways. But as they say…’a watched pot never boils’, so maybe we all need to stop watching for a while and let gold do it’s thing!!? Lol
DEAL!!! I just want to put stops in, and go away to an Island to see a nice sunset, birds singing, with kettle drums in the back ground, and a fire & drinks. Come back and see where we are in a week. Maybe I;m still in and higher, maybe I’m stopped out.
too much to ask?
wow… nice …. with water as far as the eye can see…………………………………….
I’m there w/ yah…….
*in vision ….;)
Read my reply to Alex!! 🙂 🙂 I should try and send you a photo. 🙂
GRRRRRR … no taunting Mr…!!!!
yes… please do … though I L .. O .. V … E …D your other view with the steeple in the background too ;o)
I love my wildlife/park view too … but … u no .. water .. just ahhhhhhhhhhhhh
*cue Little River Band … Cool Change ..
” … I was born in the sign of water …. And it’s there that I feel my best ….”
I try and grab a really good one tomorrow and send you that. I will never be able to do the real thing justice but hopefully it will give you a good idea of what I’m looking out on every day. 🙂
… headin home now… gonna ‘uncork’ a bottle and hit the gazebo 😉
TTUT
Sounds great. Enjoy your ‘down time’ and I’ll be there having a ‘cold one’ or a glass of red with you in spirit if not in person. 🙂
Just tried emailing you a few i took the other day. Not great photos but will give you an idea. These were all taken from inside through the lovely big pictire window I have and take in both the other islands and the castle which dates back literally hundreds of years!! 🙂
ok thanks!
*got them
Ah that’s good. Had to send from my Ipad so not sure how that would work!
O…M..G.. gorgeous! u should post one ;o)
*it IS after hours now :oD
I’ll try but I don’t know how to post from my Ipad to here…only from my PC. So I’ll have to try and synch my Ipad to my PC and move phots across before I can post. That could take me some time!! Lol
I’m actually there!! 🙂 Currently between homes and staying with a friend whose house is on our north east coast and looks out across a few miles of water to the other small islands in our group. Sat there this morning at my desk watching the most stunning sun rise over the other nearby islands with birds singing in the garden. Admittedly no kettle drums in the background and no need of a fire as I have underfloor heating here. But plenty of drinks on tap!! Lol How lucky does that make me! 🙂 🙂
u had me at ‘miles of water’ … 😉
I thought you’d appreciate this. I am so, so lucky to have found this as my interim home for the time being. I have to just sit and watch these views every morning before I start at my screens and to make myself appreciate just how incredibly fortunate I am. 🙂
So this is frustrating with Gold breaking the lows on day 38?? Just seems too dragged out.
I wanted to go back and see if I could find a long Gold daily cycle , breaking to new lows slightly, in the day 30’s range.
I’m not done looking, but I didfind this early in the Gold bull 2001. It was only a day 33 low, but here is what happened
.
refresh
.
By the way, Miners did NOT break to new lows then. Similar to today, but yes, this is very frustrating.
.
https://uploads.disquscdn.com/images/32fe1c8b5f9b40ae78ed39ff6f2073789c623b7f441987142cddd7f6f79dca22.jpg
I’m seeing some big volume spikes on the 10 minute in some of the Canadian miners EDV.TO, ELD.TO FR.TO GSS GUY.TO
im gonna rename TRX ——> FFS
Thank you Alex for the continued posting and updates. Stretched does not seem to fit what is going on here – and not just in gold. Currency markets are at extremes. How about the daily new highs in the S&P – but only up .1%…..With oil up 7-9%, wouldn’t you expect more? Last day of the month – folks chasing the trades they regret not doing three weeks ago. just feels like the switch is about to flip. I know – hopeful.
yeah… last day of the week .. month … qtr. .. year … .. craziness ensues….
Why keep stretching? Why won’t it revert to the mean? Seriously, I am baffled, completely baffled, I just don’t understand why it just keeps going 1 direction.
OAS …. wish I had some!
There are many big winners in the oils. A thought occurred to me a few hours ago. Maybe folks are selling their golds and buying oils. 🙁
I sold it last month. Wait for it…wait for it…and bought…
JNUG
fml
So far, JNUG/GDXJ have pretty green hourly hammers at a higher low from yesterday. That’s a ray of hope.
GLD and SLV have ones too.
If the FED raises in December, which seems likely from all we hear, how will that affect oil prices? It seems likely that a rate hike has already been priced in to certain things (maybe?) but what about oil? Any thoughts?
So….I am down to just negative $95 on my DNR that I’ve been sitting on for months….! Now the question….sell while it looks so much better than it did…? Or keep holding hoping for higher prices….? Or will oil dip now that it surged so much? What to do what to do…..I always said if I could just recover most of what I had I would be out….but….now that the time is here…..?
hi tammie, not sure if this helps you make a decision but DNR is one of my 3 core holdings. have been in it (via LEAPS) since the february bottom. the 3.40ish area is a very important spot IMHO (see chart). this channel is significant, looks like we will close above it today for the first time in awhile. indicators pointing up, not overbought yet. fundamentally strong company, recent borrowing base redetermination completed in november. weekly is working on an IHS too https://uploads.disquscdn.com/images/591632d0e5123f0141ef71002f5ec34ea2a8e47b555ca944f07185caf54db672.png
I agree with ‘littletimeleft;
The chart looked pretty ugly the last 2 days when they threw it away like poison, today it is a strong volume break out, not overbought, and looks like it wants to run to $4.75 pretty quickly.
If it were me, I’d usually let it ride with todays sign of strength, and maybe sell partial position if it is good sized as it goes higher. Say you had 5000 shares, or 2000 shares, or whatever- you could sell 1/2 if it keeps rising and starts to look tired or place a stop on 1/2 your position and follow the rest with a mental stop as it rises.
Just another choice, you have to do as you see fit.
Hold at least part, this can normally last 2-3 days of excitement. If you get a topping candle then you know to sell. Otherwise, sell half and trail the stop on the rest.
Alex, you often suggest that we set stops and honor them. Would you share what your strategy is when setting stops? Do you set just under support? Use stop/limit orders or market orders? And so on… Also, most of us know that the market makers/specialists can literally see on their screens all the stop orders and therefore know exactly where they’re grouped. But now we also have all the computers with their algorithms and their programmed-in knowledge of human behavior. Do you have any idea how this affects stop orders? Thanks.
michael, the 2nd half of that question is always on my mind. I have read that hard stops can be seen and at times algo’s or even your own broker will match your stop with their own trades and then flip it after you’re out. Not Cool!
I use mental stops most of the time, but they are in my mind WHEN I TAKE THE TRADE- the reason is I am not hopeful or emotionally attached to the trade right when I enter, I can clearly see 1. what I expect it to do and 2. Where it would be acting not quite as expected.
My stops vary. Sometimes right under support ( Like I buy a back test of the 50sma in a bull market, stop under the 50sma, not too tight). Other times, I’m taking a trade and use loose stops if I’m in the middle of a good bull run, because usually the bull will buck up & down but continue higher, I dont want to get thrown off. Other times, I use tighter stops , if I take a trade and it is getting a bit later in a daily cycle, etc.
Its partly what I expect from the trade, its partly what I refuse to lose on this trade & the set up is good enough that it shouldnt drop more than 5% or so, etc.
I hope that helps. I should plan on discussing this further with charts on a weekend report when I dont have so many other things to discuss. The main point is, riding a stock down 20% below your purchase point gets extremely costly if it is done repeatedly, you can always get out and reassess with funds – buy back in when it is acting correctly.
IF I’m holding a loss and the stock isnt acting as I expected, that baby loss can grow & grow if I do not cut the cord.
I went back into EGO and VGZ and TGD at this mornings lows with stops. So far they are holding…. last week’s shake out put a chink in my armor but didn’t kill me 🙂
New name —Breaveheart Crystal 🙂
Gold down $15 and GDX didnt break the lows. It sounds good.
I’m still uncomfortable until I see GDX close above the 10sma.
HEY – Both EGO & MUX are green and actually looks kind of good. I looks like a little base trying to break through the 10sma.
i like PAAS …..
I know it’s not a confirmed swing but I feel it’s a safe play for me ….. if I get stopped out I lose very little, but if I don’t … (well I don’t dare think of the upside yet) risk vs reward play (not suggesting that others follow)
All my new purchases are mostly ok. It’s the lingering ones a options. Ouch!! #WishIHadWaitedLonger
… as long as your eye doesn’t start twitching…. lol https://uploads.disquscdn.com/images/2e20c0e7e0cb9979fe3a90bca868fbb9b2f38f6af888f618c32be5b90a3f5598.gif
Kind of weird. SLV closed at 15.65 for the previous 3 hours. Same number so far this final hour.
Didn’t someone on here say yesterday something like, ” Wednesdays I’ve seen gold down, maybe after Wednesday?”
Hhhmmmm
yes sir! every Wednesday gold is down, so the COT does not reflect that for 10 days
I just got back home and put on CNBC in the background, and all they were saying is how markets are at new highs and great performance with Trump rally ( And I agree, they got juiced nicely), but Check out a chart of the QQQ
Many of my hourly pre-buys have become hourly buys, a good sign. My acct is less negative than it has been most of today. Only MUX is green for the day. SLV has a good chance of finishing at 15.65 for the last four hours. Let’s have a good rally tomorrow.
GImus, I was just wondering how reliable these signals are? Thanks!
I have no statistical reliability evidence. I have three signals in my watch list that I watch for each of hourly, daily, weekly.
One is RSI 1. When it is 100, that gets my attention to buy. Two is my signal formula based on the 5 ema. Here is the formula for the line I invented on TC2000: 100*(c-xavgc5)/c. Using TC2000, I ask when this line is moving up. If it is, it gets my attention. Those two are what I call my pre-buy signals. Then, when the 100*(c-xavgc5)/c line crosses the zero line up, I have a buy. As above, I get these signals for an hourly first which alerts me to watch for a daily buy signal. If a stock gaps up, this may happen very fast, but usually they go hourly first, then daily kicks in later, then weekly. The signals can come and go during the day. But they focus my attention on certain stocks that are ready to move. I have set up alerts for many stocks to tell me when I get daily buy signals. If you don’t use TC2000, you can construct this (I think) on freestockcharts.com – both are published by Worden.com. This is all based on the 5ema which is a good (not perfect) trend follower for me. The BEST example of it is the 5wema on the weekly AG during this year. My rules are to buy when a bar closes above the line and sell when it closes below the line.
I hope this helps. Currently I will only buy gold stocks that above their 50 wma – those are the strongest. Also, I always check out the stocks that Alex recommends.
If the above interests you, ask Alex to give you my email address and I will help you as I can.
I hope this answers your concerns. Gary
Thanks for sharing, Gary, may look at implementing that sometime (stupid work gets in the way sometimes).
current advance is weak, internals are weak.
I meant the last couple of days
Just got back home from dinner with friends (different time zone to some!) and after almost four hours since i was at my screens to see that gold may have moved a whole $1 while I’ve been away!! Clearly I have missed some serious action in the PM’s space!! 🙁
I just scrolled through my old energy/ oil stocks list
Wow – I seriously cannot believe how some of these got killed yesterday, and are up 17-28+ % today.
And the charts look really good, many have bases.
This is one crazy market lately.
OPEC Deal was essentially factored out. I for one, did not think we’d get agreement. This was completely binary, no chart hints for explosion. Going ahead of this was just gambling.
Another piece to our puzzle I just read: “Bloomberg notes this morning that the
precious metals exchanged-traded funds experienced the largest redemptions among all asset classes
tracked in November, so far. SPDR Gold Shares are experiencing an outflow of $2.22 billion, on pace for
the largest monthly decline since 2013. These are the conditions that one expects to see at or near a
low, as investors capitulate to the prevailing trend.”
Agree…..Sentiment!!!!!
We likely the last 2-4% standing (at least kneeling). We should soon have company for several months. IF your labeling is correct, it will be a 3!!!! If your 1 is an ‘a’, and your 2 is a ‘b’, we still will have a nice ‘c’. We win in either case.
Yep !
Needless to say if if if the Dec. Lows are taken out then all bets are off !!!!
Do you mean Nov.?
Dec. 2015 lows……
Thanks.
Only reason I haven’t sold everything and moved into a cave. So oversold. Get out now and miss at least the relief rally. Then regroup and re-assess.
GLD flows usually a lagging indicator. Fwiw
Gold Count:
The chart is an ugly duck but atleast I have now counted 5 waves down of C of the wave 2 correction within timing for an ICL. Still could go down a tad more so……wait for a swing maybe before considering ? https://uploads.disquscdn.com/images/d221512a8e9b41bf756e712d6c0b0d1f2a82671ec72efc2b28628defa6d776f9.png
Great chart, thanks Ken.
Your welcome Glmus.
Someone else can throw in the DCL’s in the current ICL…..:)
SWEET… ive been watching rangold (GOLD) and it is sooooo much easier for me to count that .. super clean … i was going to ask you to check it … but i think we have same count… i will have to expand ur chart to read it … lol
https://www.tradingview.com/x/1x9nQuP1/
I have not, I will now though. 🙂 very nice count !!
Crude Oil:
With the OPEC and Russia’s agreement today WITC should Not take out the low of yesterday which is $44.82 if all are following the agreement…..good luck with that. 🙂 ….. so tomorrow’s stop will be placed there…..FYI.
just down right embarrassing for $GC. Set a new low…like a sad bird with a broken wing that can’t fly 🙁
I know. Recovering now, bear flag or shake out? I’m posting the pivots now. I’ll find out at 0600 tomorrow morning!
I’ll get the report out soon. Almost done
Go man go…….
smirk https://uploads.disquscdn.com/images/ab81759bdd4a12c7e40ecca5fc93bed1488d1d2726400524fd9b457929bf8211.gif
DONE! : )
Yes, that was me
Lol
Keyboard cat. My fav!
Ok, this is not random fear-mongering, this is gonna be facts!
Gold and silver got slammed at beginning of Asian trade.
Silver low so far tonight is 16.26, trading hours low 16.42 from today NYC time. Gold low 1262.169 tonight so far – trading hours low 1270.056 today.
Either a slam with recovery or a bear flag that breaks lower tomorrow, I don’t know which yet. No big moves in $$ and now gold recovering to 1170.
If we get another breakdown in gold tomorrow that will be too much for me. I’ll sell out at the lows and try to get back in on any recovery. Hopefully Alex has better analysis than me tomorrow morning. I’m left with hope only, no positive facts, sorry!