
Nov 26th Weekend Report
There are many things to keep an eye on going forward, lets take a look.
.
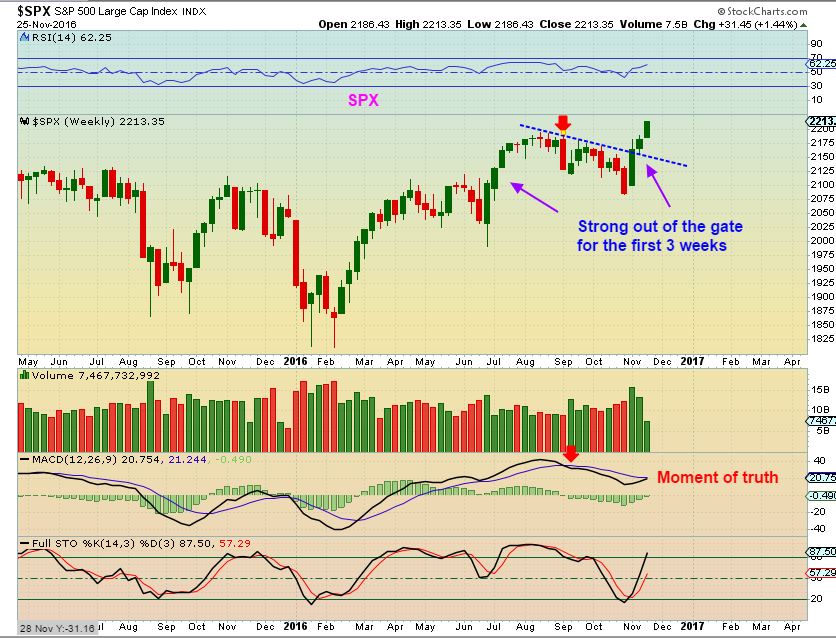
SPX – The SPX has had a very strong 3 week move coming out of the recent lows. We did see this in Feb 2016 and that became a real nice run higher. We also saw it out of the June 2016 lows, and then it stalled and rolled over several weeks. Are the U.S. markets renewing their bullishness after this past election? It does look good.
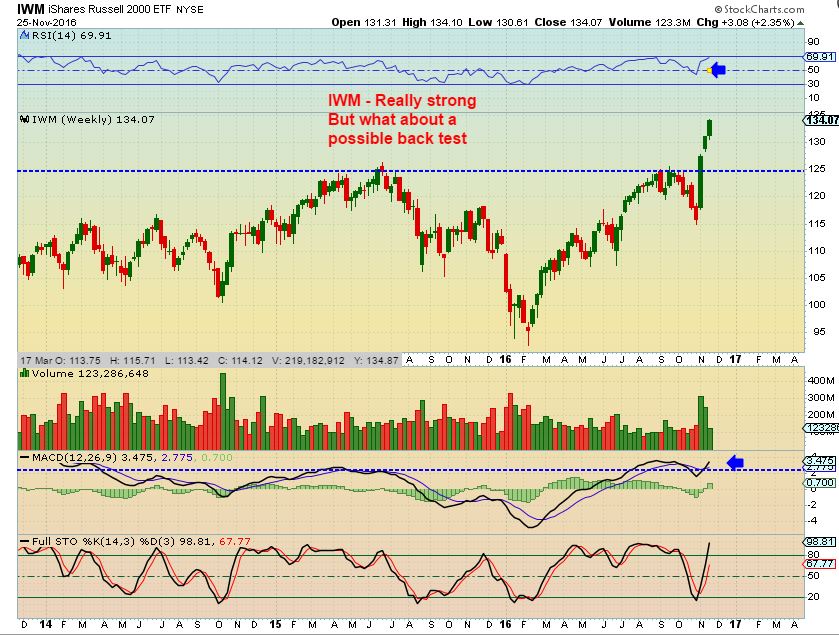
IWM – This inverse H&S consolidation has had very nice follow through. A back test may offer a great lower risk entry in this area down the road.
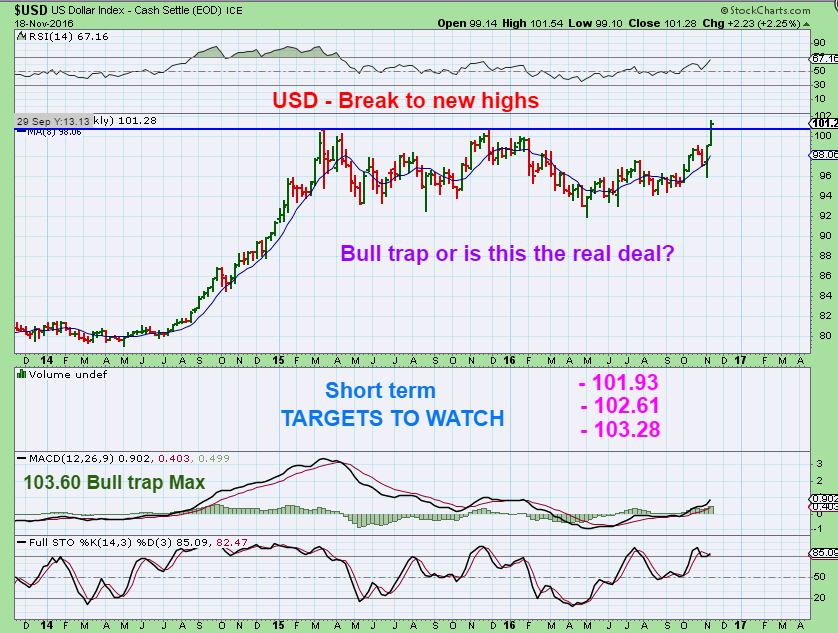
In last weekends report, I used this chart to show the break out, and I did have 3 potential targets for a daily cycle high. The first one was 101.93, the second was 102.61.
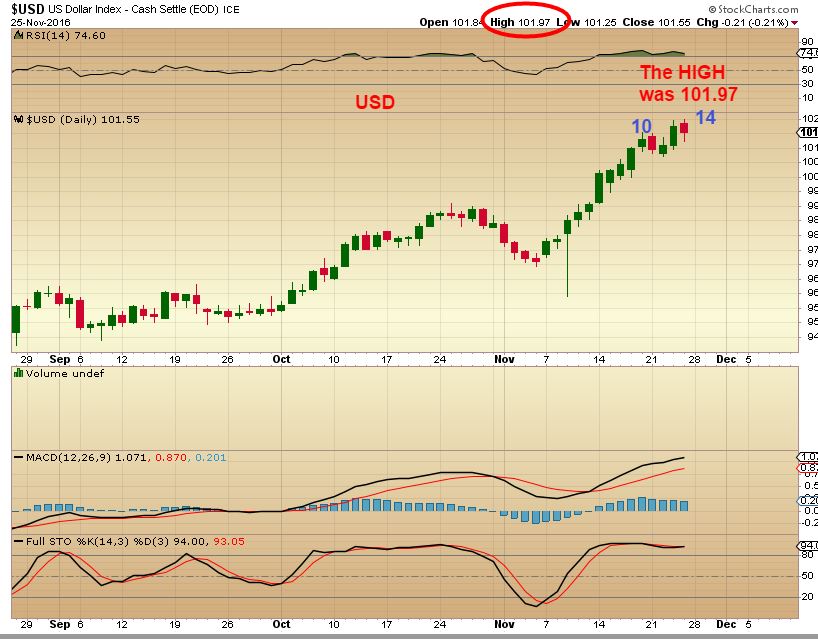
The USD hit 101.97 Friday, close enough to the 101.93, but also the 102.61 is right above. On day 14 we are near an area that I would expect a daily cycle top and a dip into a dcl (and this could help Gold to bottom). We’ll monitor the USD as time goes by.
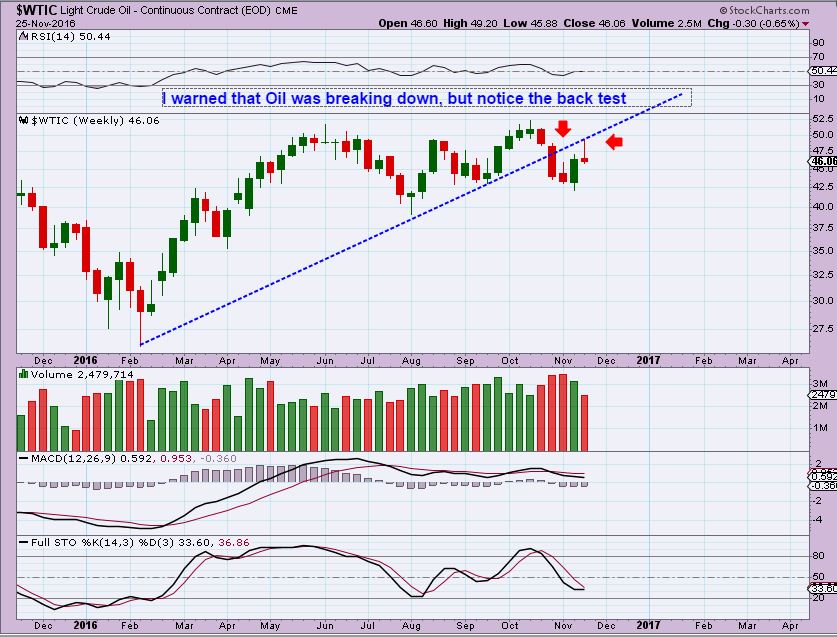
WTIC WKLY – I have been saying for weeks that based on what I see, Oil would be weak for a while. I mentioned that we should get a back test of the break down, and then be cautious. 3 weeks later, that is still what I see happening.
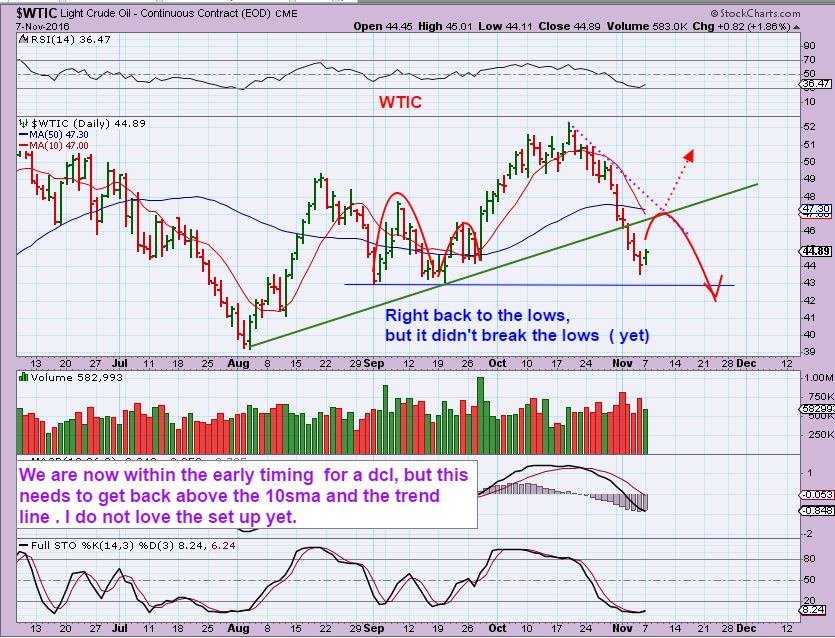
WTIC- Way back on November 7th, I foretold that we could possibly see a H&S pattern form with a back test if it didn’t break out, so I was cautious on Energy after a daily cycle bounce.
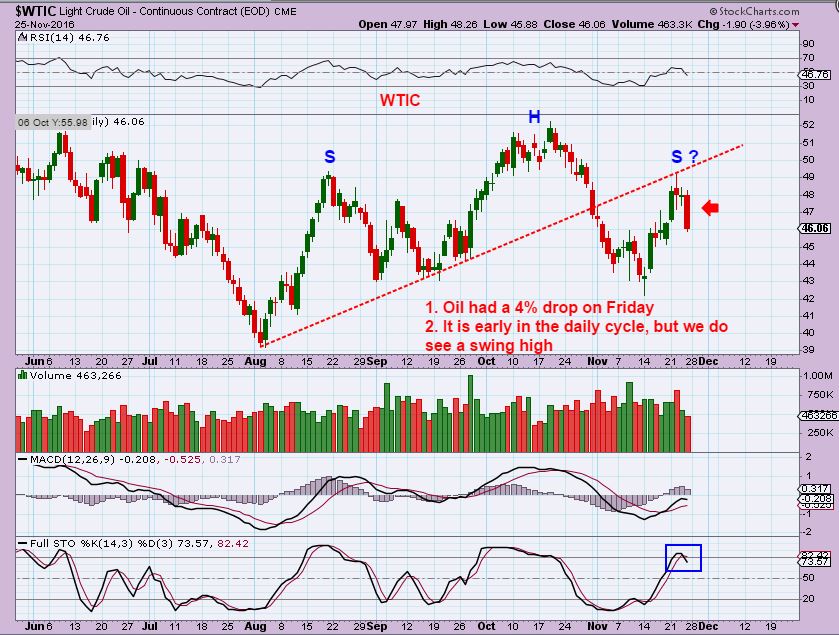
WTIC – The daily chart shows that yes, we could be forming a H&S now with that back test.
It is still very early in this daily cycle, so
1. Oil could bounce around for days and then drop, or
2. Oil could head lower in stair-step fashion for many days if it doesn’t turn bullish quickly. It is overbought too.
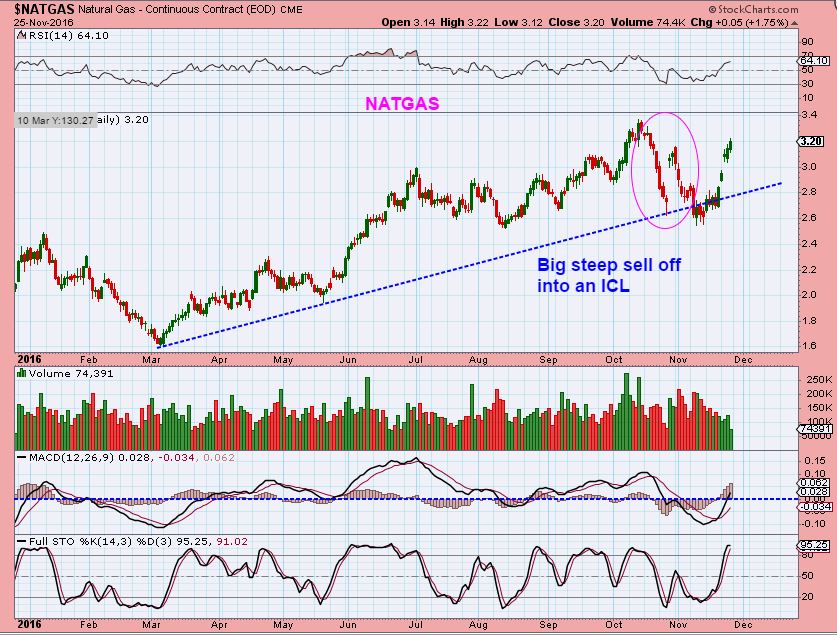
NATGAS – Natgas experienced 2 sharp selling collapses into what I believe was an ICL. Notice that it then recovered almost all losses in days once it got its floor in place. THIS is what I would like to see GOLD do, but I am getting mixed signals with Gold, as you’ll see in this report. Time will tell. For now, I just wanted to point out that a drop into an ICL can be dreadful as we see here, and then it could recover in days. Note: It did spend about 8 days under than trendline at lows. Gold could do that too. Time answers all questions.
.
GOLD , SILVER, and MINERS
.
If I tried to post EVERYTHING that I researched so far, it would take so much time to write up that this report would not be released this weekend. I want to be release this report Saturday, because of the sharp market movement post election. It may take time for our readers to digest both sides of this coin. That in mind, I hope to share just enough to accomplish that and be able to release this report on Saturday.
.
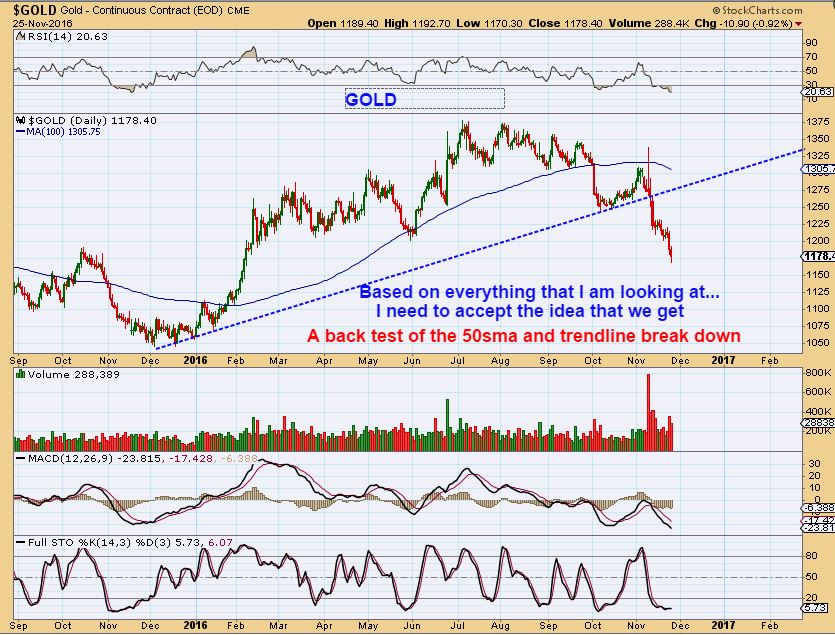
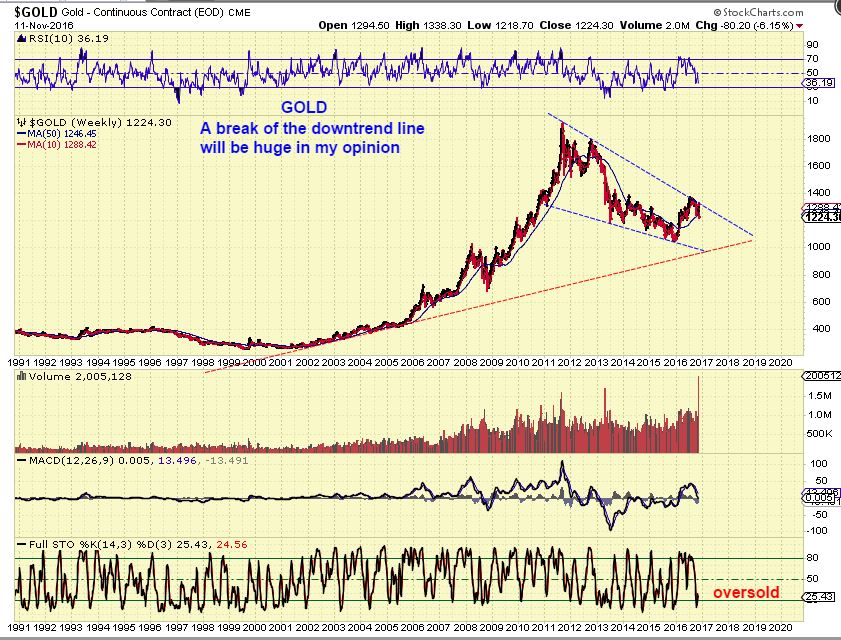
GOLD – Let’s talk about a break down in Precious Metals and things that I will be looking for.
.
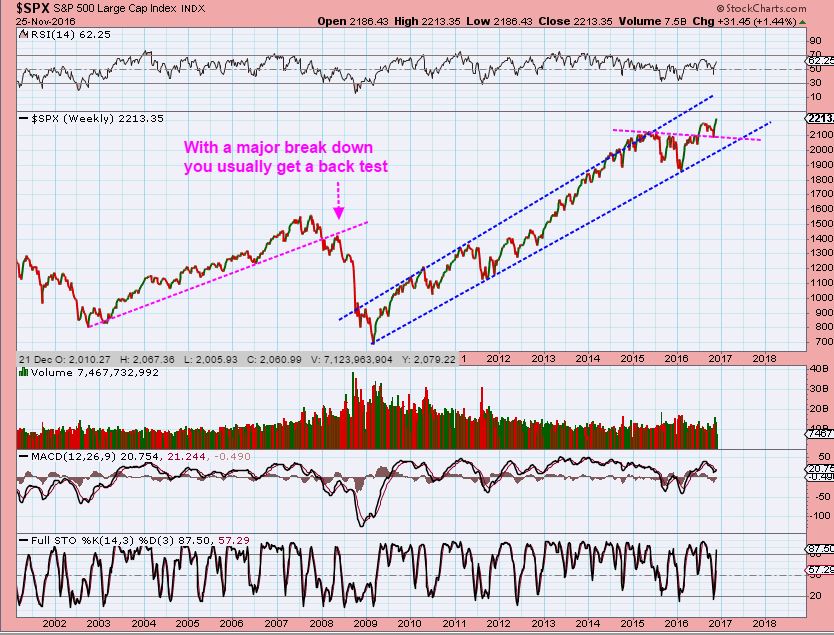
Usually when you get a break down, you get a back test of that break down. It is odd to consistently watch it happen, but it almost always does. Using T/A and Cycles, you understand what is happening, so it is not magic it is probable market movement after a break down. First, lets take a look at examples. This is a break down and back test on the S&P 500 in 2008.
I just showed you this one in OIL, and it was called out before it happened. In other words, they are expected.
Why? A back can be an oversold bounce, a daily cycle that is just too weak to get to new highs, a dead cat bounce out of oversold sentiment, etc.
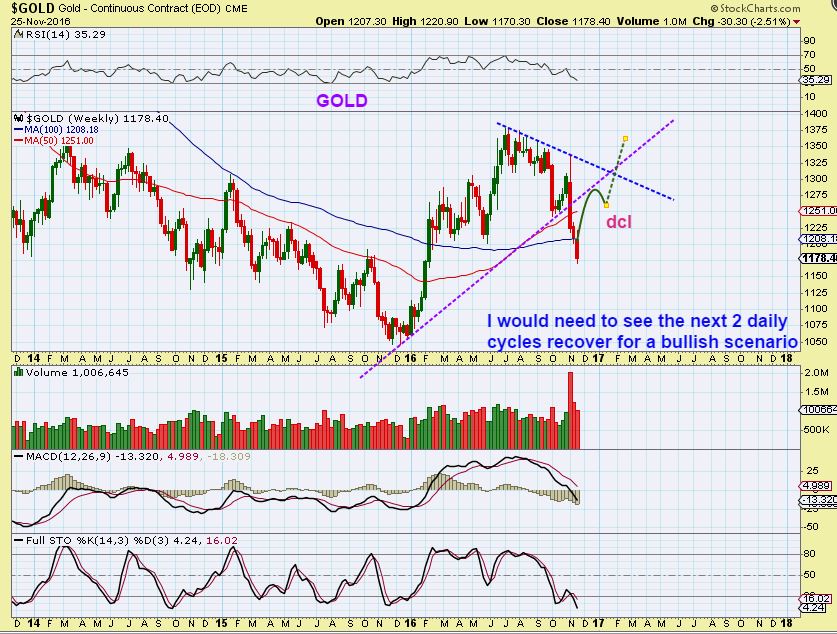
Gold broke down like Oil above. I’m not panicking, because it can recover as a shake out , or as mentioned, Gold should back test that break down during the next daily cycle. This is why I said last week, We need more time to see if this is really a change in character for this sector, or is it a shake out below Mays lows. IF …
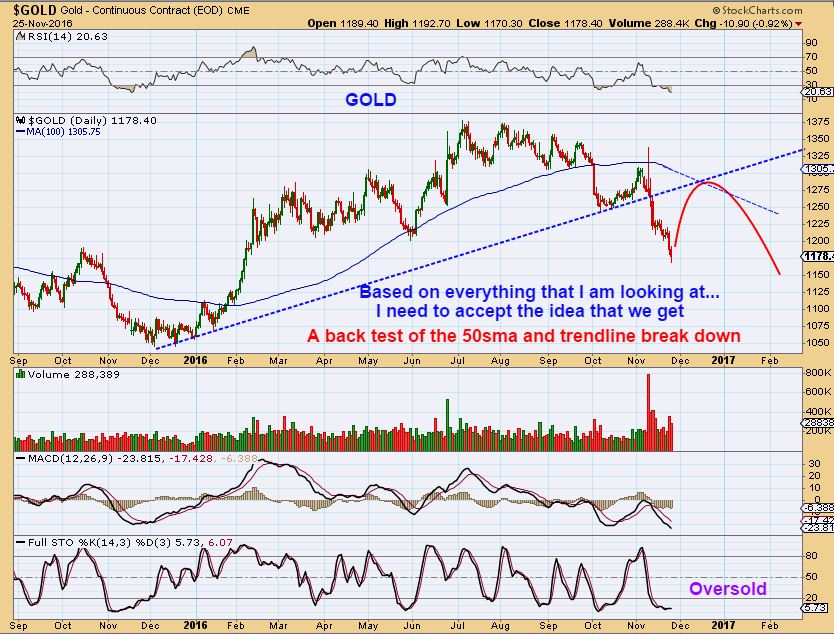
IF it is a change in character, we should still get a bounce higher that may look like this.
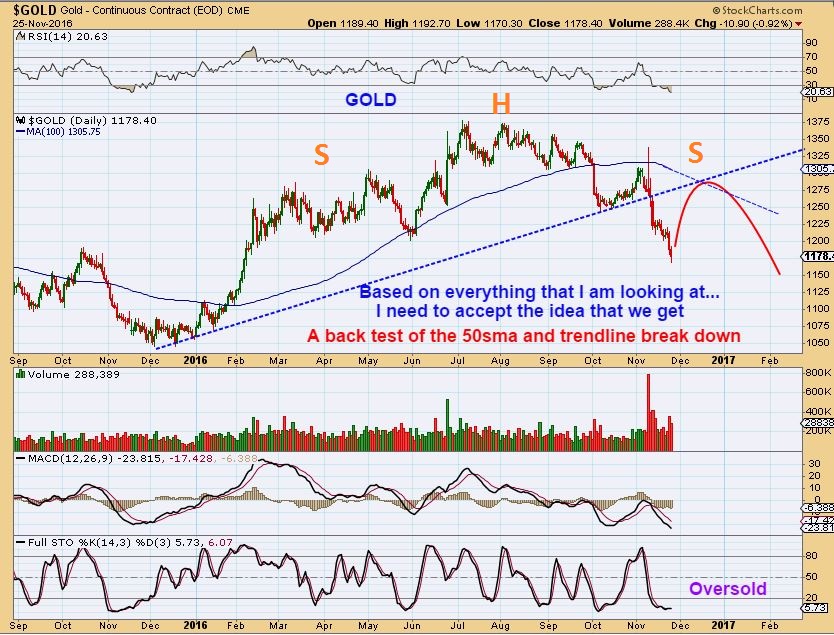
And in fact, morph into this pattern at the same time.
The Gold Bull recovery could look like this after a move out of an ICL, if the break down is not a change of character.
Recovery of that BLUE TREND LINE is KEY.
SILVER – Guess what Silver did too? So next week is important to my analyses. In fact, the next couple of weeks may be the key to what is going on. I know that everyone wants to know the answer right now, but the markets are based on ‘time’ often.
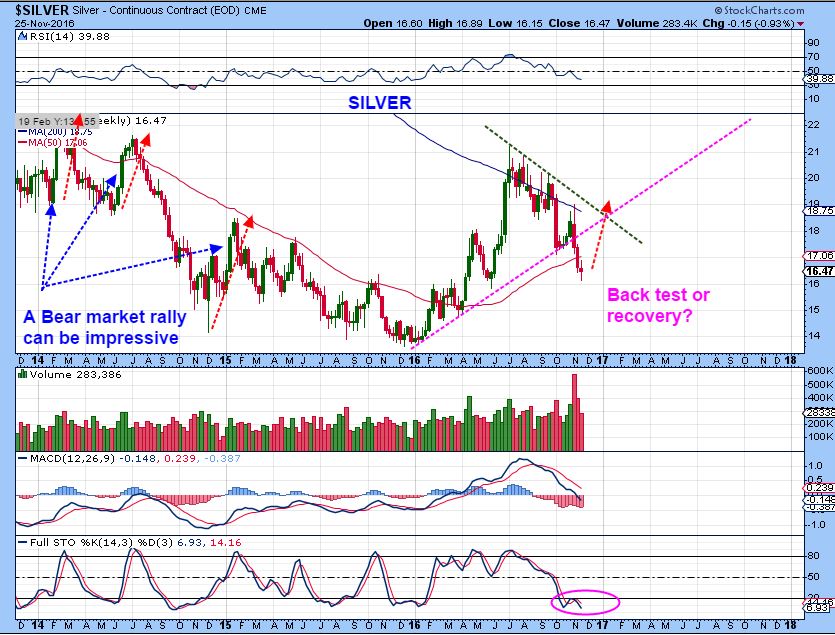
So, a break down is usually a bearish sign in my book. It can recover as a shake out, or back test and follow through to the downside is confirmation that something bad has cometh this way. Right now, it is NOT ideal for a bullish outlook, and it has me cautious and watchful going forward. We will dig deeper, because a break down can come with ‘clues’ attached, but first let’s take a look at Miners.
.
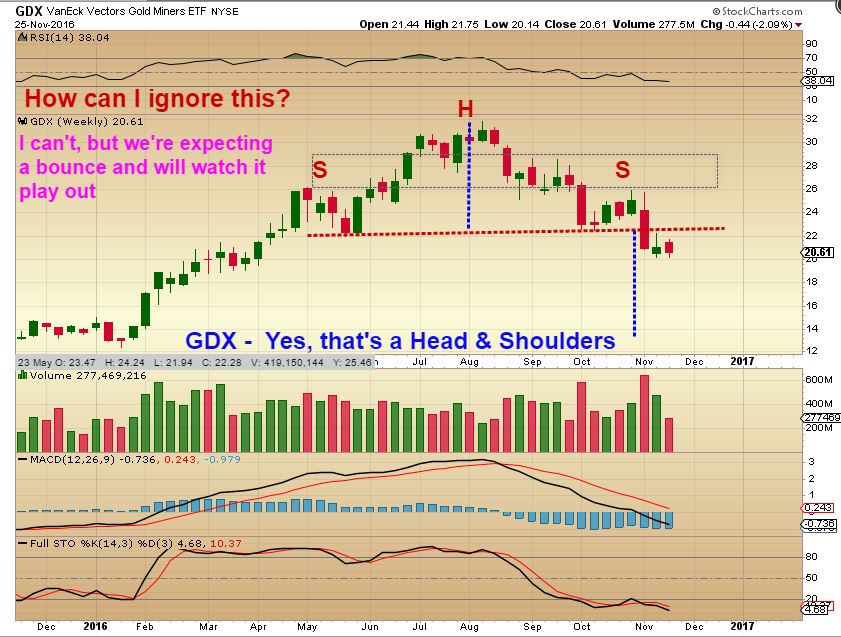
GDX– This chart was Wednesday, and it was in my Friday report. The 61.8% retrace has been hit. While Gold broke to new lows Friday, GDX held the these recent lows. My Friday report even pointed out some Miners that are not breaking down at all. I expect a bounce now out of a daily cycle low.
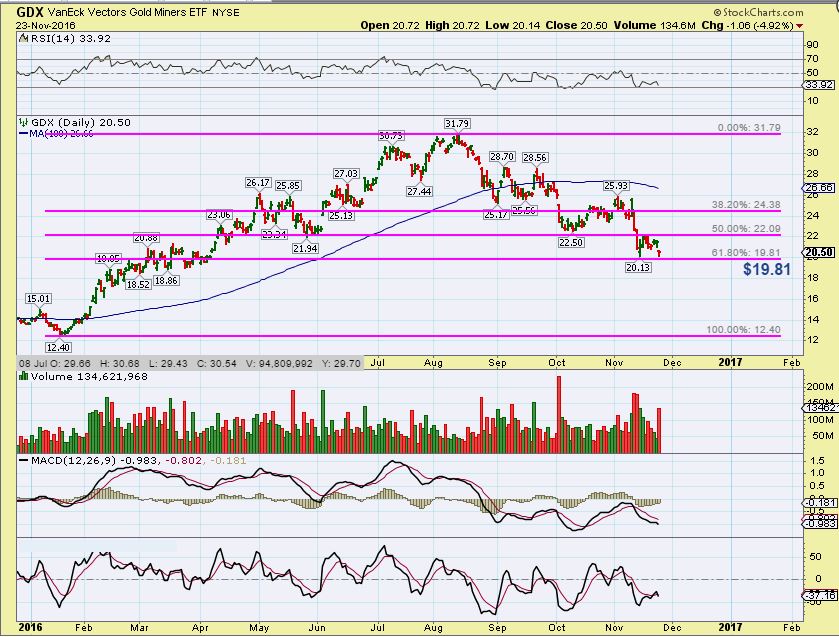
I expect a bounce here ( DCL or ICL). I want the GDX to hold above this support ( yellow area).
GDX – we do see a H&S and the neck line broke . Huge implications downside if this is not invalidated on the next rally higher. This is truly where “TIME WILL TELL”. Selling the rally and watching what happens is a choice that may suit some best.
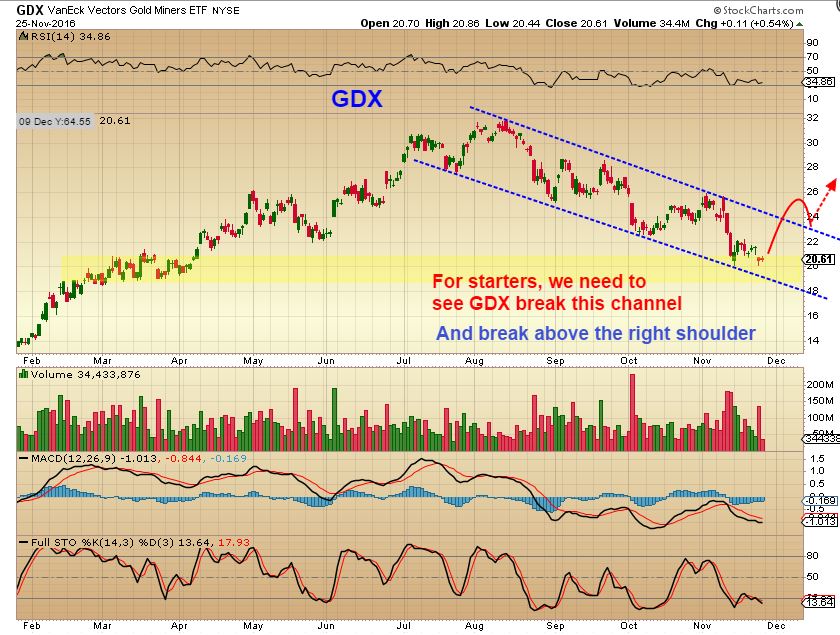
GDX – This would be the ideal outcome for a bullish recovery. This is a down trending channel, and any further downside is bearish in my opinion. let’s allow the market to tell us what will happen. Yes, unfortunately, that takes time.
That is the Precious metals market at a glance. That is a surface view, but it may not tell the real underlying story. Lets just go a little deeper for a few more clues in the underlying story. There are good and bad things that I am seeing. This is where I have to try to keep it a bit brief, so that I can release this on Saturday.
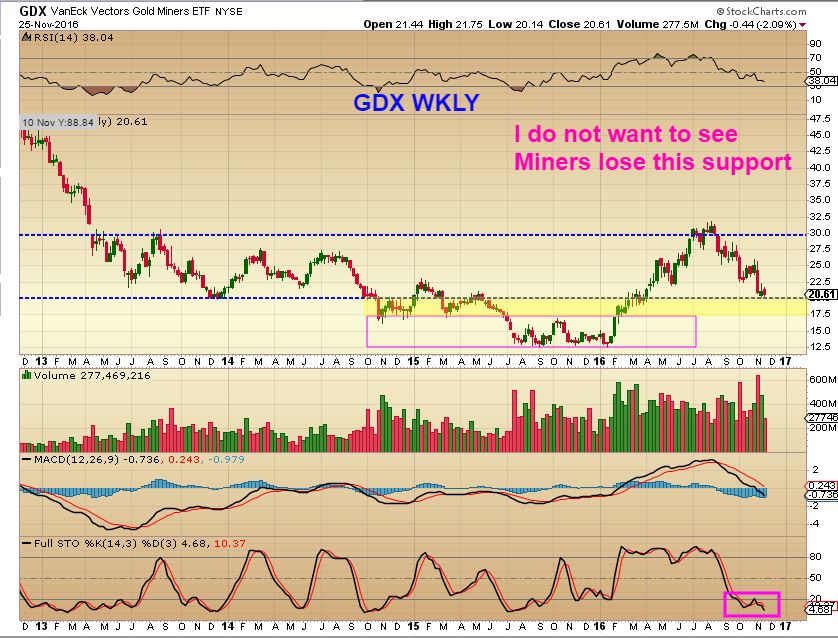
In prior reports I said that there was something specific that I was looking at in the HUI expected pull back. It Never closed below the 100MA on a weekly basis in the first years out of the bear market selling. It did in 2005, but by then a long consolidation was needed. I wanted to see this hold for the HUI.
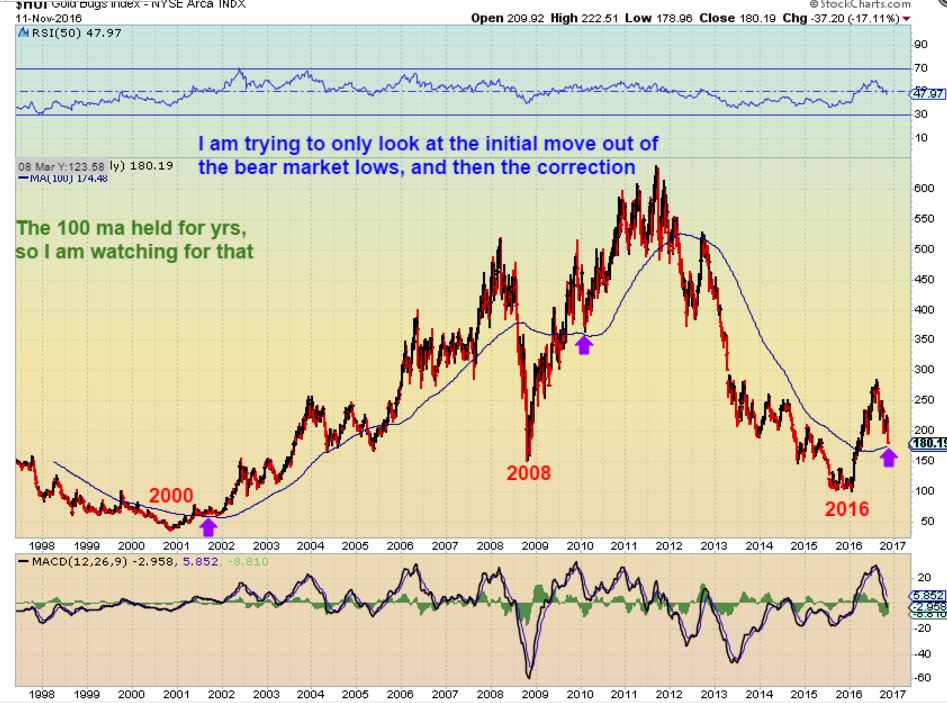
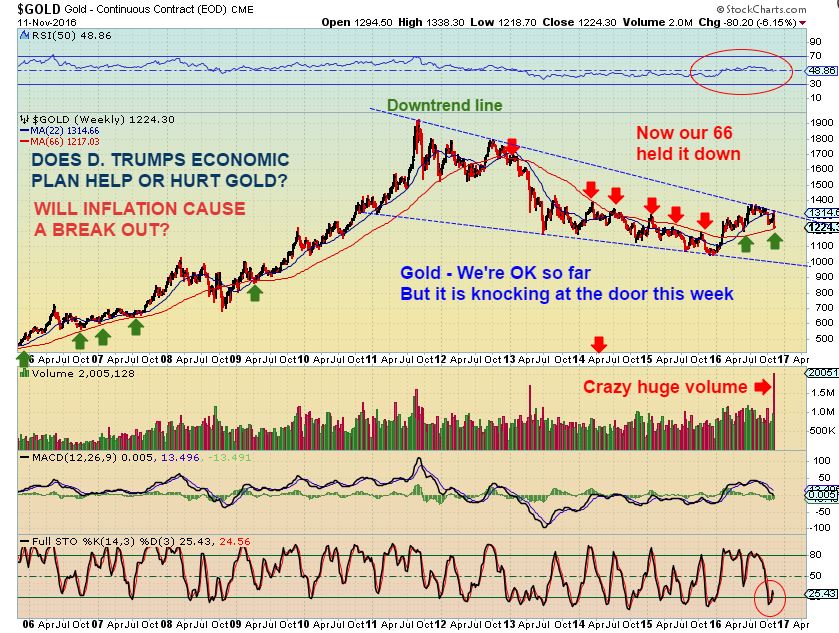
HUI did not close below the 100 last week. That was encouraging, because it was back tested in the past, but no close below it in the first few years. Was this a back test?
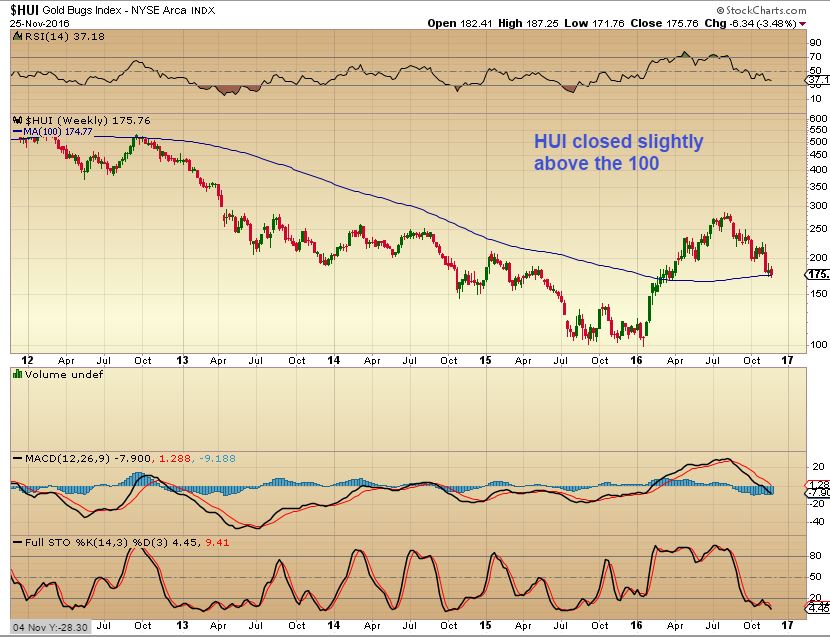
Look at the blue line here, it is the 100ma on Golds weekly chart. It did act as support and resistance often. See the red arrows.
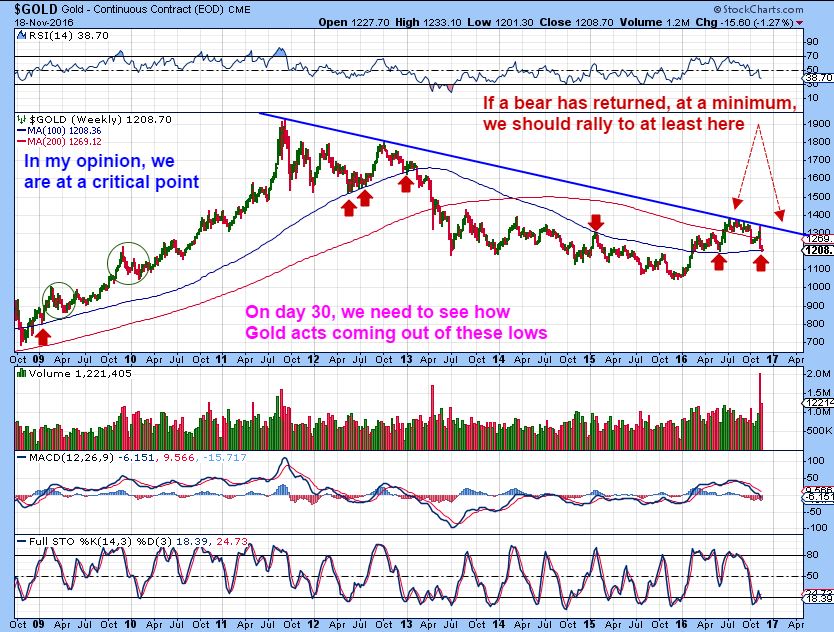
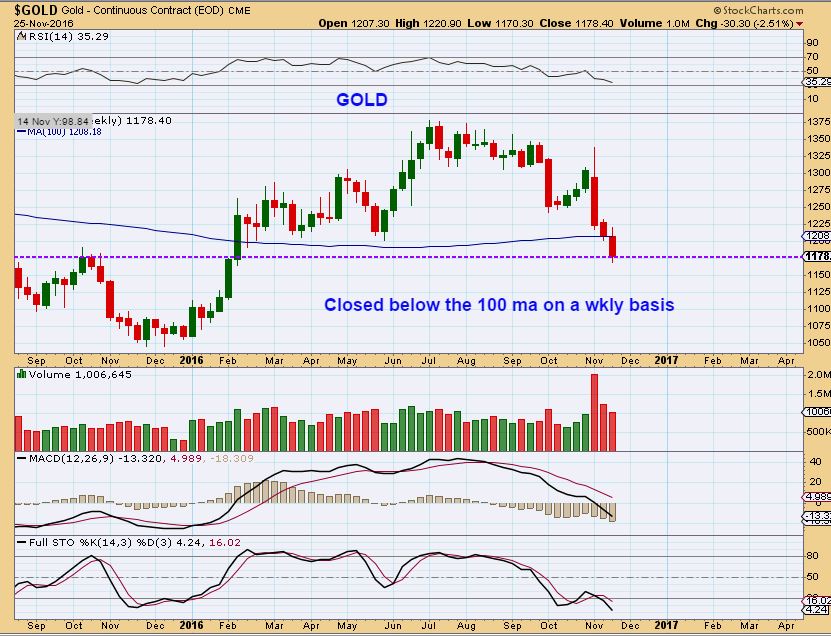
Gold closed the week below the 100ma (blue line) . That wasn’t encouraging. It may not be the end of the world, but it is a sign of weakness to me. A crack in the armor so to speak. The purple support needs to hold.
This is where it gets a bit uglier. I’m not going to simply wear a Bullish hat just because it fits. I see something concerning.
.
I did extensive research last Dec and again in February, and showed a decades long relationship that GOLD & the YEN have shared. I also used the GOLD and the USD to show a change taking place there. I used step by step charts to show the relationship of Gold , the Yen, and the USD in the past, and updated it at the MAY ICL for a June report. I will share just a few of those charts and their bullishness then, and I will show how they are looking as of right now.
In Dec 2015 – I had shown that when the YEN bottoms, GOLD has bottomed in the past, so I expected that Gold would bottom. I used this and other charts to show my conviction that the bottom in Gold was near.

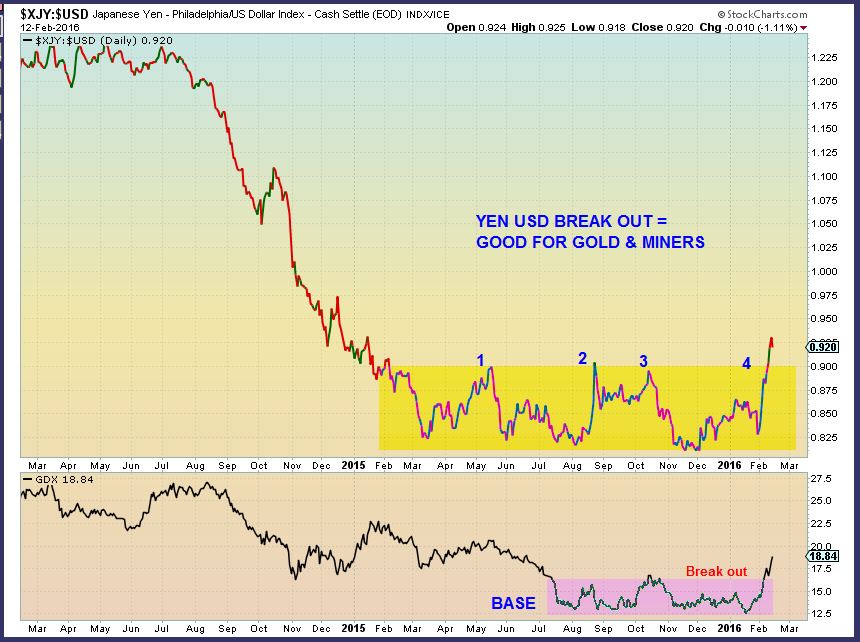
In FEB I pointed out this relationship to Miners. The lower box is GDX. This is the YEN VS USD.
KEY POINT: AS THE YEN BROKE OUT AGAINST THE USD, MINERS BROKE OUT. KEY KEY KEY. I had called the lows in Mid January to many Miners using Technical analysis, and this break out was confirming the Miners lows in February.
I hope everyone follows this so far. So I had been watching the YEN VS THE USD, The YEN & GOLD, and GOLD & THE USD and a few other areas. This chart below then showed important break outs that actually corresponded bullishly with GOLDS ICLS, or MINERS starting to break out higher in the next run.
Notice that I said that the FEBRUARY USD VS YEN CHART showed that a drop in the dollar vs strength in the yen would cause the Gold bull to re-emerge. (Do we have that now? Will it return?)
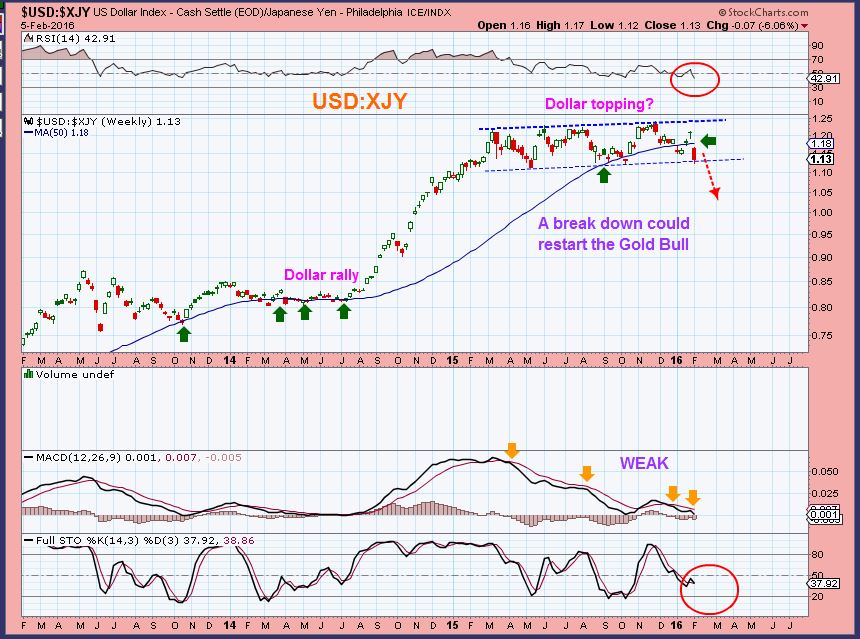
And in the Feb 5th 2016 YEN VS USD CHART – A bottom & now a break out in the Yen / USD above the 50sma is BULLISH for Gold & Miners. This was KEY to my studies at that time and added confidence to all of my other work.
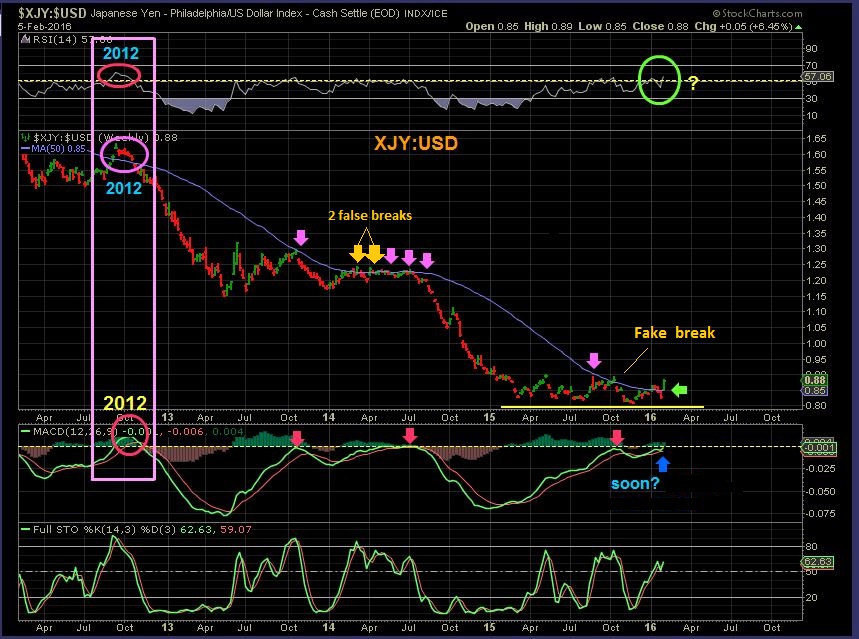
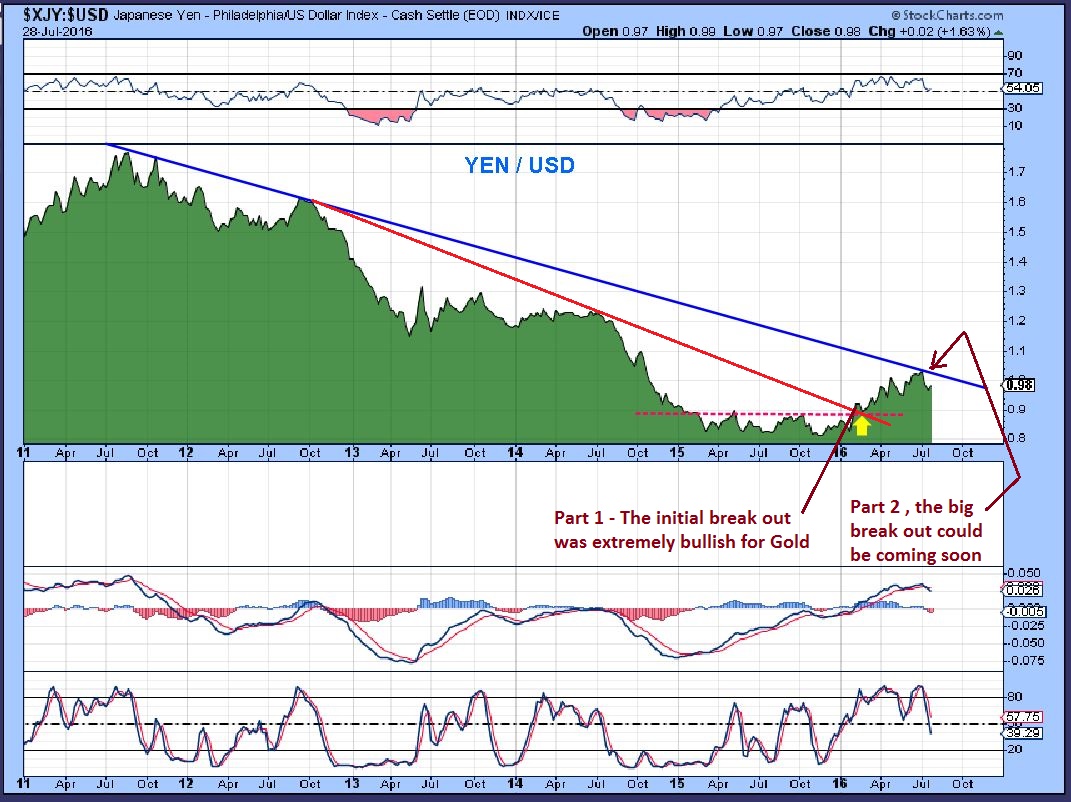
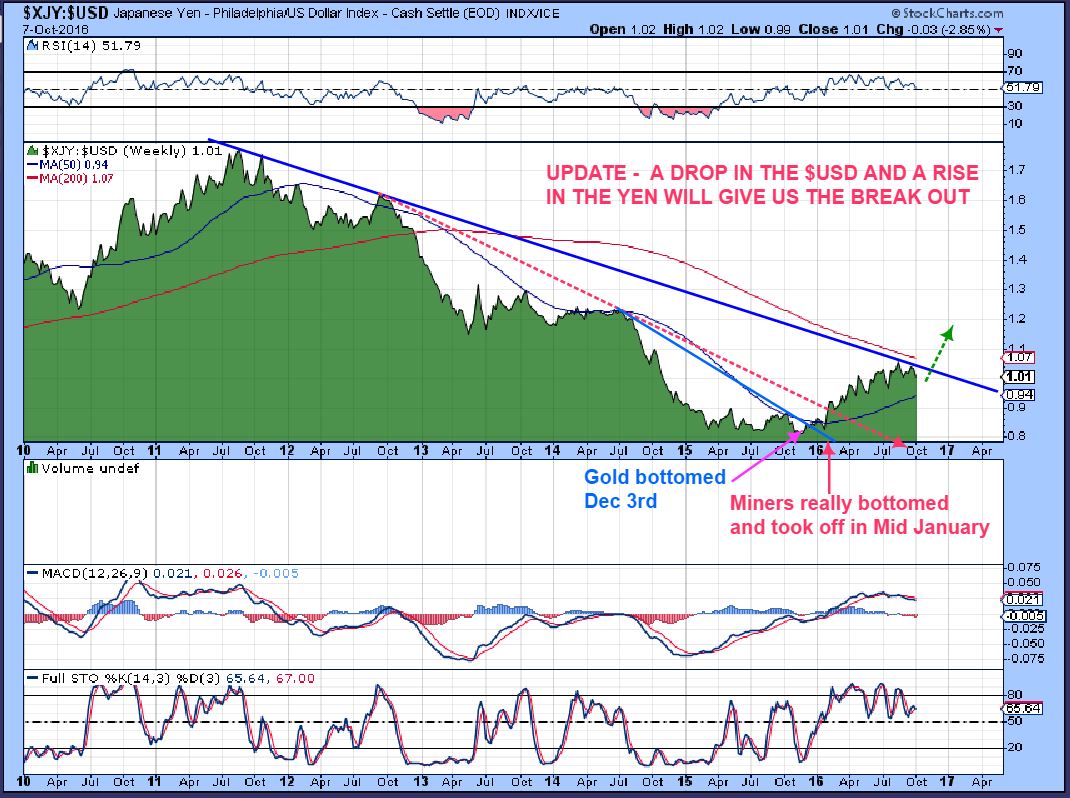
YEN VS USD – This summer when the MAY ICL was in place, I looked again to see what I could find. The first break out of a downtrend ( red line) was near the ICL for Miners in Jan. Now the XJY:USD was possibly topping in July at the blue downtrend line, so I mentioned lightening up on Miners this summer ( hold core) and getting ready to buy the dip. This was in line with the thinking that a Bull market has emerged and a big break out was coming this fall.
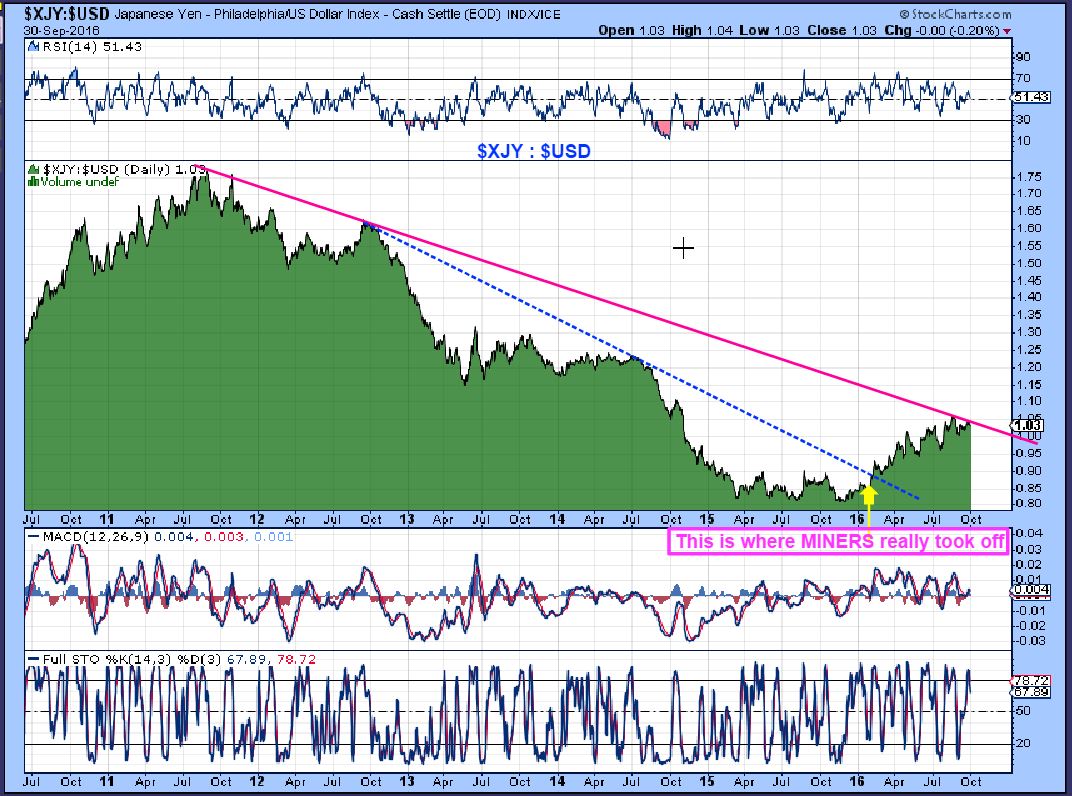
I re-visted this in September , seeking out a possible ICL in late Sept or early Oct. I drew up this chart for myself. By now I wasn’t adding this to my reports, because I had many new readers that didn’t see my Dec & Feb Yen reports about the Yen/ Gold/ USD. The point is this…
AS OF SEPT & OCT, The bull set up was still very much in tact. IN FACT, with this chart I was even more bullish that a HUGE break out was about to take place. A break above the MAGENTA LINE after the ICL was in place. VERY BULLISH.
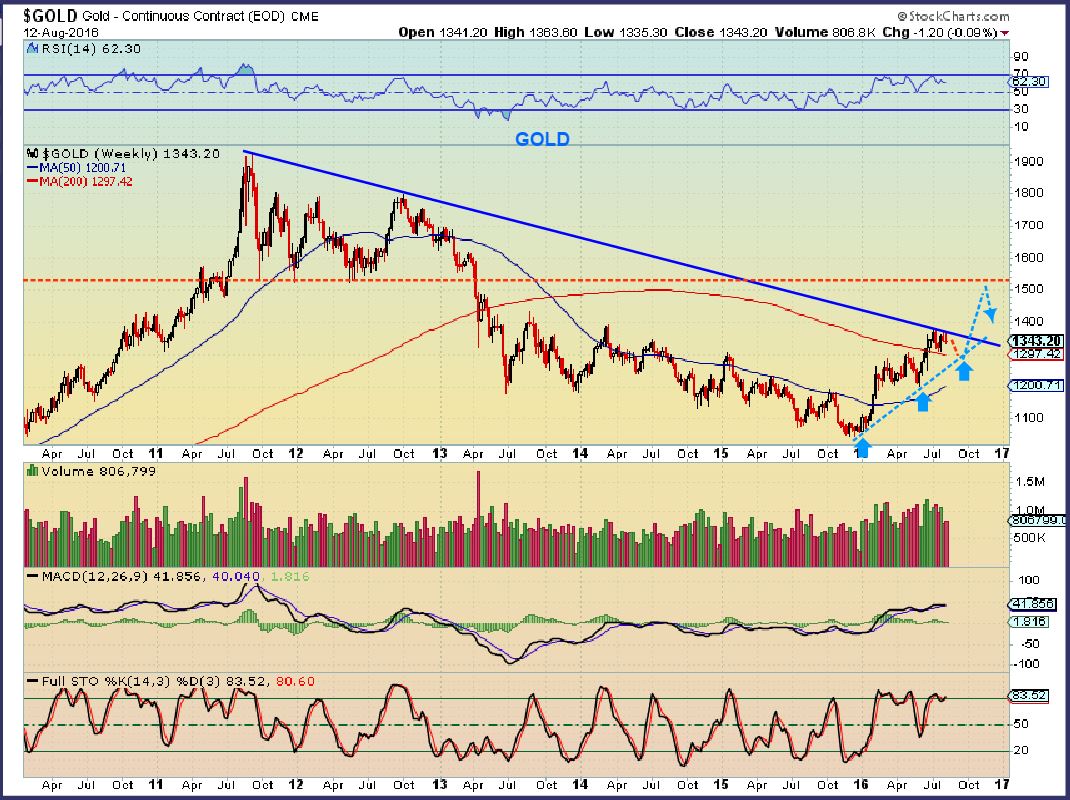
I showed the important break out that should be coming to my readers this way on the following 4 charts. A very important break out in Gold would be coming too, but it should be accompanied by that break out in the YEN : USD.
NOTE: Even after the Trump slam down, Things were not broken yet.
In October : I expected the ICL in October to break GOLD from that down trend line, and the XJY / YEN to break out too. Through October everything was lined up very bullishly for a huge move higher.
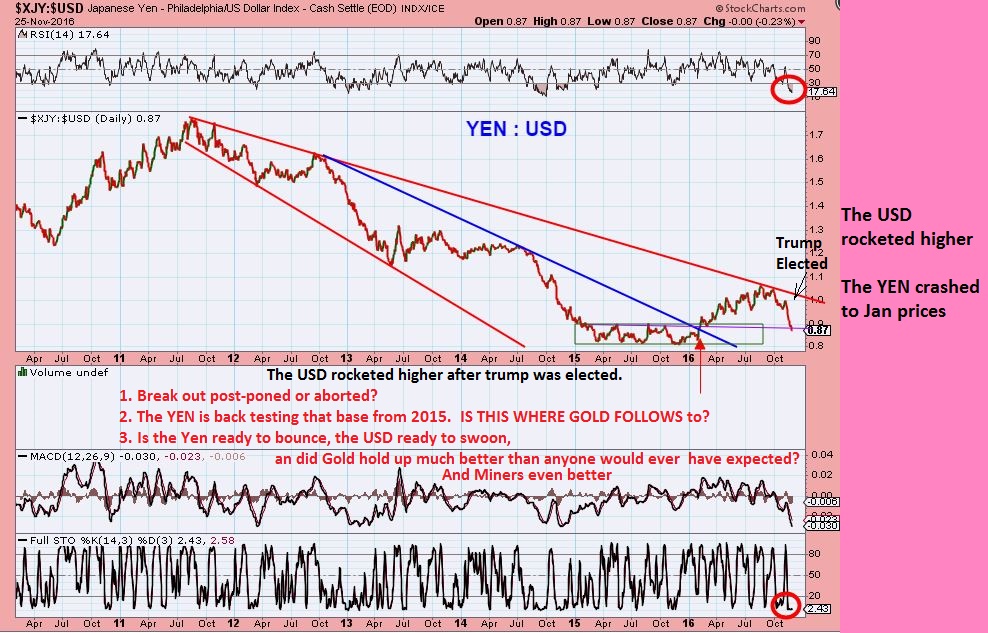
SO THE USD : YEN – The KEY to the success of this Gold Bull in much of my work, was absolutely fine going into what I called the ICL in OCT. Everything lined up ….until D.Trump won the election. What does he or his policies have to do with Gold, the USD, or the Yen? TIME WILL TELL the whole story, but here is how the story goes in my book. The first 2 Chapters of the Gold Bull ( 2 Bullish ICLs) were great chapters from dec 2015 to Oct 2106, and then I see this…
.
XJY:USD – YEN/USD crashed to Jan lows rapidly. Gold didn’t, so does that mean Gold is stronger because the YEN & USD are about to reverse direction? Or did Gold hold up because an ICL is due, and will eventually follow the Yen lower? Please read the charts ( Click to enlarge if necessary).
Please understand, I have been doing this for almost 20 years, so I don’t panic. It is important for me to look at the markets without emotions, and just find out what the reasons might be. I was being asked real time ” What is happening and why?” I can throw out any random answer or ‘guess’ to just satisfy the moment, but honestly it takes time to know what is really happening here in the big picture mixture. Is this just a Knee jerk reaction, is it a shake out to fool the majority, or is this a real directional change? We are now programmed for instant messaging and instant gratification, but unfortunately it often takes time for the real picture to develop. No one likes those old Polaroid pictures anymore, they want to click the & see the picture instantly, but the markets just aren’t that accommodating. Trust me, I’d love to know exactly how all of this is going to play out now too, my curiosity is killing me. Time will tell, it always does.
For us, trading became very difficult short term when the sell off suddenly change. The big picture quickly becomes hazy, so it is important to adjust back to your comfort leve That is at times all that you can do. I have said it before, there is no shame in lightening up & waiting for the clarity to present itself, even if it means taking a loss. Just don’t ignore the stops that you had in mind when you took the trade and refuse to make any changes. I understand all of these feelings, I have been there too. For me, I just didn’t get stopped out of any of the positions that I bought in Oct , except for MUX and JNUG. That is an odd coincidence that I bought several miners that didn’t break their Oct lows. Other stocks have dropped and stops should have taken traders out of the way.
Conclusion: Something might have changed in the precious metals market, and I see it clearly in the Yen/ USD trading. Is it a permanent directional change, or is it just an anomalous moment in time? The next move by Gold & the Miners should answer that question in my opinion. A trading plan is something that should not change. November saw exaggerated market moves, they are rare, but they do happen in todays fast changing environment. This recent smash down activity was pretty much unexpected by me after October bottomed and moved higher. I was using several methods of market analyses and the bullish set up was very good going into the election in all areas of my research. A break of the May lows as a ‘run the stops’ was expected as a possibility all along, but once I saw Octobers lows, I went in heavily and Nov 4th & 5th was like a flash flood when a dam breaks. Now you can see from my report that going forward we have both bullish and bearish hallmarks now. As of early October, I loved everything that I was seeing in this sector. Very bullish characteristic with a super break out possible. That changed quickly, and time will tell if it changed momentarily or longer term. This may be a sell the bounce scenario with the next DCL.
If something has changed, we will change with it. We are seeing construction metals and their stocks moving quite bullishly out of consolidations. Buy the dip may be the next move there for FCX, CLF, VALE, etc. Some have been mentioned here that could be bought now, since we also see weekly break outs. See last weeks reports. If the Gold bull remains in tact, it could be that the YEN got overdone to the downside while the USD puts in a topping process, but we don’t know yet. It is not a healthy big picture to me. The break down now looks real with the above Yen charts showing it in one way. The YEN crashing to Jan lows and the USD breaking to new highs was rapid and bearish, yet Gold was able to hold the 61.8 retrace, and Miners held also. If the USD tops, The Gold bull may be fine and the Yen will resume upward movement. If the USD runs to $120, Gold may test those lows in the mean time. There is a lot to take in, huh?
.
I will try to put more in the Monday night report. This review is part of my Bigger Picture Analyses, and we do see sudden winds of change creeping in. Follow through one way or the other over time will be the next real Key.
.
Enjoy the rest of your weekend!
.
~ALEX
.


Great report Alex. Glad to see the USD:Yen analysis. I don’t think you can paint it any clearer than this. Sometimes the markets just don’t present easy answers. As always, it’s not what the markets do that matters, but how we as traders respond to what the market gives us. Trading is not about “predicting” but rather “managing”. Good luck to all!
Thanks Simon,
I wish I could share every single thing that I look at in my research, but the reports could never be written that way.,
One of the main points that is glaringly obvious from this report and all of my other research is that in 2016, everything was still setting up Absolutely screaming bullish for that big picture break out.
The rapid election move in the USD / yen and Gold pushed it back – now I am seriously hoping for a recovery and for that break out to still materialize, but I hoping cautiously now 🙂
Hi Alex, thanks for your analysis. I think the move in Yen leads gold by a few weeks. As you have said we will have to wait & watch. https://uploads.disquscdn.com/images/0721cd50f55bf739f87972acda02a44e28b18c7c207cfab15684afa9fe7e2c19.png
As long as Yen holds… I think we’re all watching DXY, which is close. Pound, Yen, Euro is the massive part of the DXY weighting.
My report in February went back and showed many relevant time periods of the YEN & Gold relationship.
Usually the Yen did lead.
Who was the first sub to post about Natgas possibly hitting ICL? OH yeah, it was this guy!! https://uploads.disquscdn.com/images/f12a34f9e308607baa4bdafa00e8690edfcafe582867d133ea698bdc3dab58db.png
https://uploads.disquscdn.com/images/fe75d08318a7fbfe0c16368bfe9ea9c2e453056fcdb4e49067c2126809b58a27.png
🙂
Was 2 days early in calling the top though https://uploads.disquscdn.com/images/120cf11ddef0133f46d29a6add622e06bb6ccb72c3af8767b559ea082979c5cf.png
And now I think we could be here. https://uploads.disquscdn.com/images/935f763e1a91e6ed1ba4be60b2f2adaf260c7d7ea15c4d21eaf207e225e276a2.png
UH OH. [nice charts by the way]
I like the way the fundamentals are shaping with the winter season starting. Much lower amounts of gas produced in USA compared to this time last year; nat gas currently priced for a fairly mild winter. If we have any weather surprises at all, it’s all to the bullish side. I see the waves that have but a $1/mBTU wipe-out right now seems unlikely based on fundamentals. That’s a big move. That said, I’m not buying long at this juncture.
Great to see Cason back in the groove!
Hopefully? I’d like to see GOLD and MINERS get their groove back!!
I agree with Johnny but also want to comment on the very well chosen graphic! Cute pose.
So are you still positioned long? Maybe I need to read the report again but I am confused what you think now. Everyone in the world talking about the hs top.. could it be that easy?
Hi Rm,
Yes, I recommend reading the report again, it was long and it is possible that you missed a few things. in fact, I just re-read it when I saw your question to see if it was clear or not. I feel that it is very clear, so maybe looking at it again would help.
I never sold out during the sell off , because what I bought and held is not bearish looking. I did lose positions in MUX & JNUG, and I assume others were stopped out too, but I bought and accumulated NAK from a long time ago, GPL, AUMN, etc, and oddly enough they didn’t sell off with the Gold drop.
I also expect a Low at anytime now as mentioned in the report. I think we are selling into an ICL and we are quite late in the timing. In the report I am saying that we need to see how things move out of these lows. TIME WILL TELL was a reoccurring theme in that report, and also what to look for as ‘KEY’ was in that report. I pointed out a possible back test of the break down and from there we look for weakness or strength. Sometimes you get a V-Bottom that just blows right through all upside targets and keeps going leaving everyone bearish behind, at other times, we get the start of a sell off and a back test will be the next highest point. Time will tell us what is happening, a change or a violent bull market shake out. I did NOT see one quite like this, however, in the move out of the 2000 lows .
I hope that helps
Gold may have bottomed https://uploads.disquscdn.com/images/0b333c179952232d4517dda9062ad5a4abc4ded23a76361cea73d32b1faf64de.png
https://uploads.disquscdn.com/images/cbb7df375e1ced263434e8f4239a9dfa67bda32ced6d3e0245a3951ba6cde3ea.png
We closed above the important 1180 on weekly.
Might come a spike down to 1160, but surprise me if we loose the 1180 weekly
https://uploads.disquscdn.com/images/bed834aa896845408621ff2edebd27baa863452e2859ad8e13fddeb99972805b.png
That’s been support for YEARS, MUST hold. MUST. We can’t afford even a single day closing down below there.
Two sentiment items I read this weekend:
1. Commercials are very long SFrancs which has been bullish for gold in the past.
2. Gold puts are very expensive relative to calls, which can speak to an upcoming low in gold.
I am not an expert in either of the above, but things like these keep me looking up for our gold/silver shares.
The sentiment is BAD right now. I’m seeing gold newsletters that are essentially now claiming “still in a bear” and that we really need to question the bull in gold thesis. I’m unsure myself right now. If we can get a decent bounce, I’m certainly lightening up.
I looked at the Miners Bullish % Index this weekend. 7% right now. The January low was 15%. The last time it was this low? The Summer Slamdown from summer 2015. Lowest reading in 15-months. SO, while this has been just a horrible, horrible time investing and gold and miners, shorting into the hole here doesn’t make sense. We are way overdue for a rebound.
*F5*
https://uploads.disquscdn.com/images/c4013e8d408da4312304798915909199a78fbbd691f5717200cad76baaf5dc89.png
oh come now cason…hava little perspective sonnnn … it has not been horrible horrible… how could my account have tripled if that were the case .. case ;o) granted im off from my peak… but .. just sayyyyinnnn…. hasnt been ALL bad..;)
Hmmm…I was specifically talking about the last 3-4 weeks. And, yes, it was THAT BAD. Glad that your account is doing well (and WAY better than mine). I missed the metals move in the winter; I caught what I still could in the summer and made good gains there but I gave it all back now. All. Energy was iffy for me. Did great in the Aug ICL but overstayed welcome in USO/UCO but did well with OAS, WPX and others. Diversified and base metal miners have been my best trades of the year. Hoping that PMs can catch that soon. This is big right now, it has to move up now.
It seems to me that the divergences are rather large, if not huge. 🙂
Thanks for sharing the BPGDM.
Well, that would be good! Thanks for sharing.
Hunting for divergence, trying to hold the 400-day.
F5 and read the chart! 🙂
https://uploads.disquscdn.com/images/427e9fe176d2ed38f5824c249b1d3291b76ba4ceef84e6998bcae8aff0e6cd61.png
gold and silver are starting the evening trading session strong… hope that bodes well for the week.
I also like to look at $silver:$gold. The miners typically do well when that ratio is strong… and the ratio bounced off a lower channel line early last week.
I used to use that one but haven’t recently. Usually a good sign of speculative money.
Hopefully will stay strong by the morning. I’ve seen this in the past where there is a trend change they make the big move at night if the big boys are already positioned.
Don’t have time to post new charts but pull up a ‘price by volume’ past 2 years for GDX and GOLD. You’ll see that 1180 and 20 are both KEY, heavy support. MUST HOLD.
check
amrs gettn spunky..;)
Uco or USO put in a nice reversal, back above the 10sma.
I believe that OPEC is meeting this week to discuss cutting oil supply.
Oil may rise into that meeting, but I’m not thinking that they’ll make any progress (again)
is dcix gonna go like glbs?
They do like like twin charts , don’t they.
However DRYS hasn’t popped like that. I think now that the hype is over, they are much more of a gamble
omg GLBS…. what the… 😡
Up 100% now 🙂
Just be careful if you try DCIX or DRYS or another – STAY SMALL
yes daddy… i did .. 😉
just a trade.. i think a ‘b’ … but ill take an impulse…lol
yes, good to see some volume on this move up….looking to break the handle on the weekly C&H
vroooom vroooom
🙂
it is now above where I sold my 2nd half 🙂
https://uploads.disquscdn.com/images/029bcf0befd4785759742325926db79a32f0af68dcadeec31f34b82bc7f88259.gif
Not funny Scooby, but it does go to show you how these things work.
I owned a lot of this one too. Made great gains- but I do not own any now and my last sell point was lower than now, and this does look like it wants to go back up to the former highs.
I am debating re-entering a small position now & maybe add if we get a pull back to the 10sma like NAK did after its first jump off of the 50sma. It dropped for 2 days , but that was a gap fill too.
Look at AMRS with a 50 & 10sma. Pretty normal looking now. It looks ready to run
;o) … agree
I’m talking to Scooby 🙂
https://uploads.disquscdn.com/images/503ad424c5923ab61db3873f69a1dc9ca2ce0b9b0e5c9a7d30308c7a7df343c4.gif
It wasn’t a silly question, it was a long report and it was a long few weeks.
A lot to digest really.
THM and VGZ (own) are up nicely for the golds. My account is creeping up nicely, but not the explosion I was hoping for.
Last night I saw Gold steadily climbing up $12 and I honestly thought that maybe the train left the station – I thought that it could be up $25 by the open and leave most traders behind in a major shake out.
Looks like the train is back at the station. bummer.
Watching GG, ABX, NEM to break above their 10sma, and then GDX GDXJ may do the same.
I tend to be an optimist, but … JNUG is up 8% in a slow, steady grind – see 10 min chart. More of my golds are getting daily buy signals. We did not have a big first hour sucker rush, then fade, but we are continuing to grind higher.
Yep. Nice action so far. Hopefully it can be sustained for the entire day and then get some follow through.
I agree guys, we really need to move off of this bottom and a slow move higher is a good way to be less convincing and leave people watching it rather than participate in it.
Being early in Golds daily cycle, it should give us a few days to watch it too.
I will be discussing that in the next report – what I are watching for the next week or 2
I think today is precious metals futures expiration day – if so, prices may stay relatively pinned down for the day (?)
Thanks for your input. I appreciate your education, experience, and studious approach.
looks like NAK about ready to bust a move ……….
I was looking at that since I own a bunch.
It does look like a bull flag on a daily chart, but the weekly kind of looks like it needs to pause for a while.
Tough call on that one.
Actually, on a weekly chart, it isn’t even overbought yet on the stochastics.
thinkn maybe 1.14 .. but not sure it will get there….
You are looking for it to drop? (NAK) or are you talking about AMRS again?
nak
https://www.tradingview.com/x/MZOdemCi/ like that….
Ok, thx- I wondered why you said $1.14. Gotcha
Thanks. That 10 min slow grind up for JNUG has morphed into a pullback now. Something to watch.
Trying to stay positive, but I see a flat bottom triangle in the hourly chart of JNUG. Flat bottom is typically a continuation patter! 🙁
Of Course, it could be a double bottom, which would be awesome.
dbl bottoms? o my
#HB
😀
Thanks, Bill. It may be that JNUG/GDX have finished their 10 min correction. Busting above 7.12/21.31 would be a great sign. If the correction is NOT finished, we could have a and b waves in place with wave c to finish. Gary
JNUG/GDX are close to hitting a new high for the day – check out the 10 min charts. GLD is also popping on the 10 min.
gold looks like it’s just finishing the right shoulder on an inverse H&S on the 10 min
Yep – Refresh – Shows up on the kitco chart too , Dave 🙂
.
https://uploads.disquscdn.com/images/fb65302d620a4d9bbb4f467f312a0913dcb3e10770c27d1b22a0ea564271d646.jpg
nice …………………
Thanks for the inverse H&S, Dave. JNUG/GDXJ happily broke to new ten min highs on the day, pulled back a bit, and are taking off again.
1 year wkly charts :
CENX pulling back, (broke the 10sma on a daily so far) , maybe a more meaningful pull back to the 50sma daily or back test the weekly break out?
SID trying to break out on that weekly chart that I showed last week. TGB too.
WRN is also a copper stock, the weekly chart looks good, but the daily always has lighter volume than I like.
TMQ – Trying to make a move on the weekly & daily charts, lagging a bit
CLF, X, AKS look overdone to the upside on weekly charts. A pullback may be a buying opportunity. .
Not sure why TRN not participating. Alex, does this one look broken to you? Also, this would be the start of the first daily cycle, if things pan out, right?
TRN? Are you looking at Canadian or US markets.
Is this the first daily cycle? It should be a move out of an ICL, so yes. I really need to see how this unfolds to know for sure exactly what is going on. I’ll cover it in future reports as we go along.
TRX, Tanzanian Royalty Exploration was what I mean; I fat-fingered it lol!
Thanks for the correction. I have been holding this one way too long hoping it will rise with other golds..
ditto …. been a D .. U .. D .. D .. for sure … 🙂
I think Alex has it nailed. I will buy more once I get a weekly buy (which will take more than a few days).
Another way to view that charts is this way…
1. Miners peaked around July / Aug – TRX did too
2. MIners had a multi month correction, TRX found the next level of support
3. IF IF IF The bull remains in tact, this correction should be over and it would seem reasonable to conclude that it will rise again when Gold does.
Thanks.
…yeahhhh ….. i guessss he’s okay….
https://uploads.disquscdn.com/images/d310bebae38a224bf4dbba21a8f702171e8564fc741020a9752bc3d8accb98cf.gif
I can’t hit the I believe button yet. I did that a few weeks ago a I’ve paid dearly. I’m really gonna need to see stuff work out before I spend any more cash.
Barf!!!
peace out man…u R only allowed 1 barf per day in CFLand…;o)
**act like a duck https://uploads.disquscdn.com/images/ad93ad811c99edc64a6538b1c8ef6def582ac89c20b661aee0b5b96e52403c58.png
TRX is not participating today, but the chart is not broken.
refresh
.
On the weekly it is actually quite oversold. If the bull market remains in Gold, I think that this will do well.
It is currently in a support area. This is a daily chart
.
https://uploads.disquscdn.com/images/2f1d8109afad0c61b6df37453567ff6b8be28ec3feca4cab3fb0ab655e50e4f0.jpg
can someone tell me what is so compelling FUNDAMENTALLY about TRX?
No – But you saw how it ran from April to August, correct? I caught that move.
What was so fundamentally compelling then? The same as now.
My worst current trade and I got it nowhere near the top. Barf-tastic!
JNUG/GDX are pulling back short term. Check out the 30 min chart. Nice cup, could be forming a handle.
As a day trader I view it this way
-and would look for re-entery possibly tomorrow ( Only as a day trade)
.
Bearish rising wedge, break down and back test. Sell the back test, MACD confirms weakness short term.
Refresh
.
https://uploads.disquscdn.com/images/f9c74748dcbbbd162b90d998c1596a8033edc37320504d9795de69e67ec2bf40.jpg
If the lows are in place, we could get a Gap open tomorrow, and that day trade would be finished.
GDX intraday alternative: If this one plays out, It would go sideways and consolidate until the MACD started to move upward and show strength.
Or the gap open tomorrow would be nice again
.
https://uploads.disquscdn.com/images/753f76b2dd7fe8915ca2b1bb607a3a2cf3fbc809d37f31735ae931b9ab56054d.jpg
A close above GDX $21.28 gives us our first close back over the 10sma since the election results were released. It is also another part to the composite sign of a DCL confirmation.
Closing on the highs for once sure was nice!!
VALE – Turned into a nice little champion after that May to August to October consolidation
Alex, Do you own it?
I do not anymore ( I sold all of my Metals)
ALLLLLL of them………..? as in 100% cashola?
No, I didnt men all cash – I sold my stocks of Steel, Aluminum, and Copper
I own Miners
Ok… Just clarifying Freak … 🙂
#crayCray
YIKES. Look at GLBS on a 10 min chart. A round trip today.
Up 100+%, Down over 30%.
Talk about becoming seasick
Actually much worse.
what a crazy dump THAT was…. w o w
WHOA – OIL had a reversal to green today
CHECK OUT CPE, LPI, OAS, REI, WPX, CWEI, and more of the good looking ones- XLE & MORE are screaming “Don’t believe it” with some pretty big bearish engulfing candles or at least large reversals off of the top.
We will leave it to you to explain. 🙂
Yes, Scroll up in this weekend report and read my first 3 Oil charts. It does seem to be playing out as expected since October. It was odd that those stocks were looking so strong , when Oil was failing.
OPEC actually meets Wednesday I believe – this may be an unloading ahead of the results
Yep, makes sense. Thanks.
Here is an article explain shipping. Of course, it is the writer’s opinion.
http://www.insidermonkey.com/blog/shipping-into-some-profits-why-shippers-took-off-491137/?yptr=yahoo
RE: TRX i understand the Value in TGD, THM and AUMN. Can someone please tell me the fundamental value in TRX? I know it over sold … but why are people here so bullish on it. Where is the fundamental value in the future?
Hi Robert – If you think that I said that I was fundamentally bullish on it….you are wrong.
That huge move from April to August- yes I caught that. Very rewarding.
Fundamentally nothing caused it, and nothing has changed.
In the past, I have owned stocks in this sector during bullish times that were explorers, they made absolutely no money, ran up hundreds of percent. I am a chartfreak, not a fundyfreak.
If the BULL remains in tact, this will likely set up and go higher. I will use the chart , not the fundamentals.
Alex…. i was just wondering if TRX has any possibilities for the future. NAK has huge possibilities as does THM and others… is TRX purely a speculation or does it have future possibilities… When I go to their web site it’s not clear.
Well,
Jim Sinclair is a big part of the management for the company, and he is a gold guy. I think his experience draws investros in, but are they profitable? I do not know for sure.
The things that I was reading last spring was that they had trouble with some mines in Africa being threatened and overtaken by locals ( like Mine pirates)
Then they defended themselves in court and I believe they applied to protect their mines with force and things seem to be fine now. I stopped reading about it last summer, so I would need to update myself on the company too
Thanks Alex yes it’s hard to see what they really have… With NAK if they get approval eventually, it’s a winning lottery ticket
I agree – That or being a huge buy out target.
If a larger company like let’s just say NEM wants to try to cash in on that property and already has equipment and resources available to move dirt, they could easily justify trying to buy this company out at a huge premium to current stock price.