
A Balanced View
It’s a holiday week in the U.S., and Monday didn’t bring much in the way of change since the weekend report. On Wednesday we do have the release of the Fed Minutes however, and that may be the catalyst that we are looking for in one area. 🙂 To the charts…
.
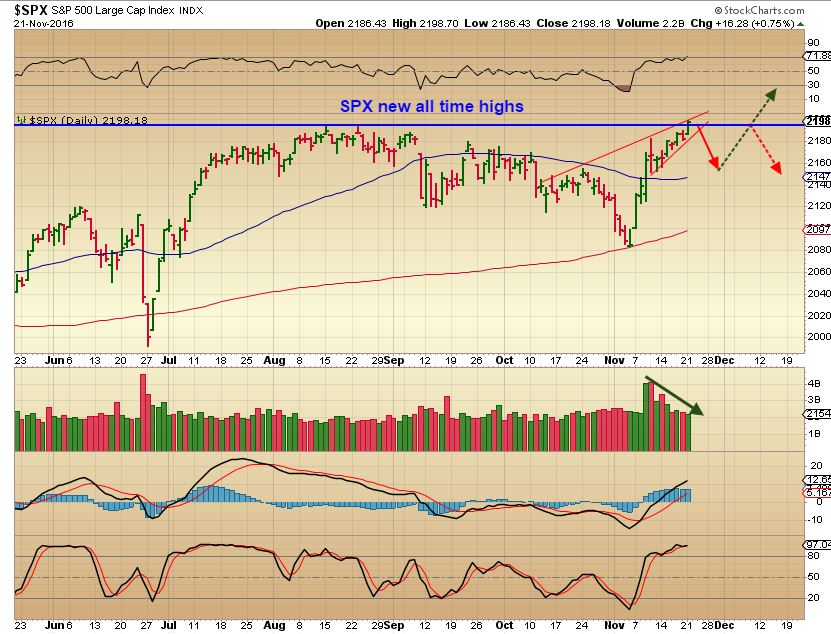
SPX – The S&P broke to new highs. I was thinking that it will take a rest, but have you seen the IWM? It looked similar to the S&P now, but it is just continuing higher each day. We may pull back soon, but it is also possible that light holiday trading may just keep it floating higher ( See the IWM). If that happens, it may be on the following week that we see a consolidation or a pullback.
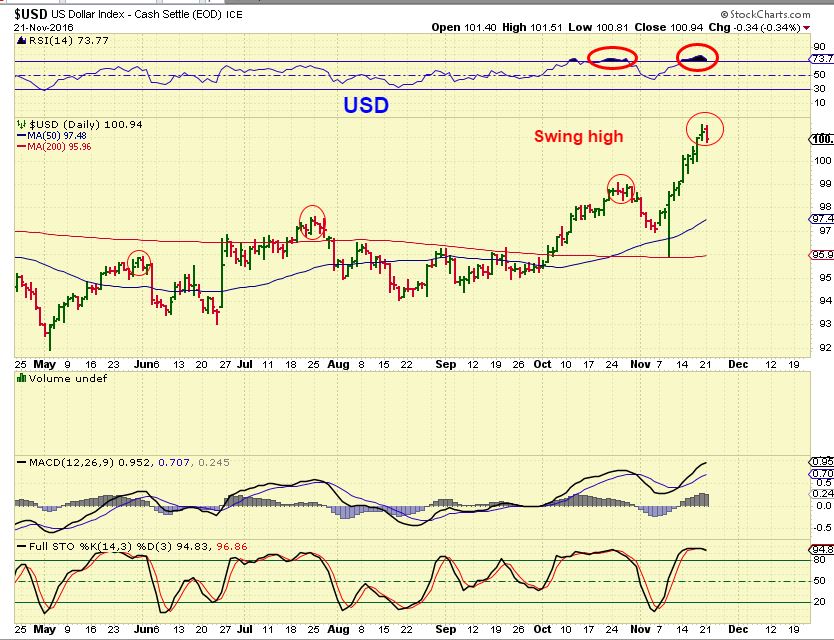
USD – 10 straight days higher finally dipped lower today. This puts a swing in place (unconfirmed), and may be the start of a pullback. You can see how the dollar runs higher and then suddenly, seemingly out of nowhere, it just starts to pull back.
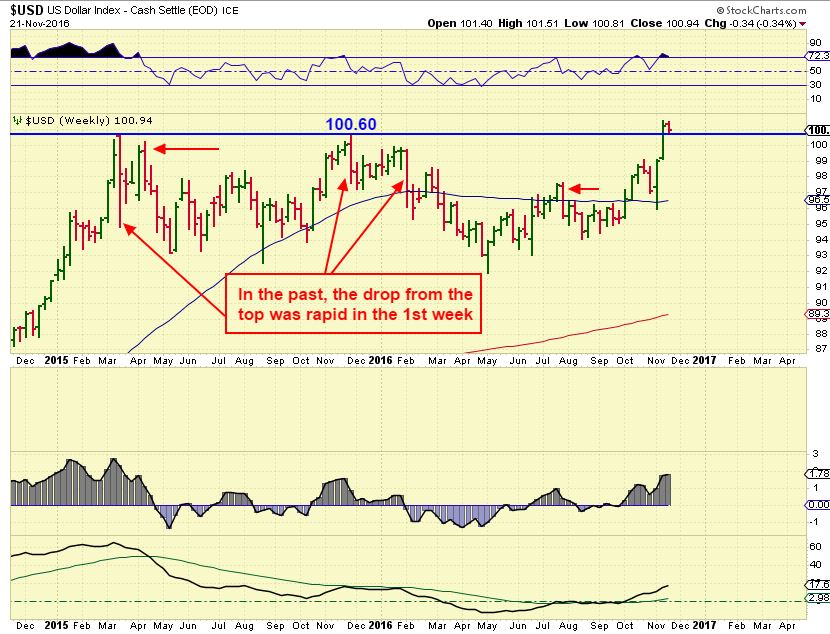
USD WKLY – We may or may not be starting a dip into a dcl.
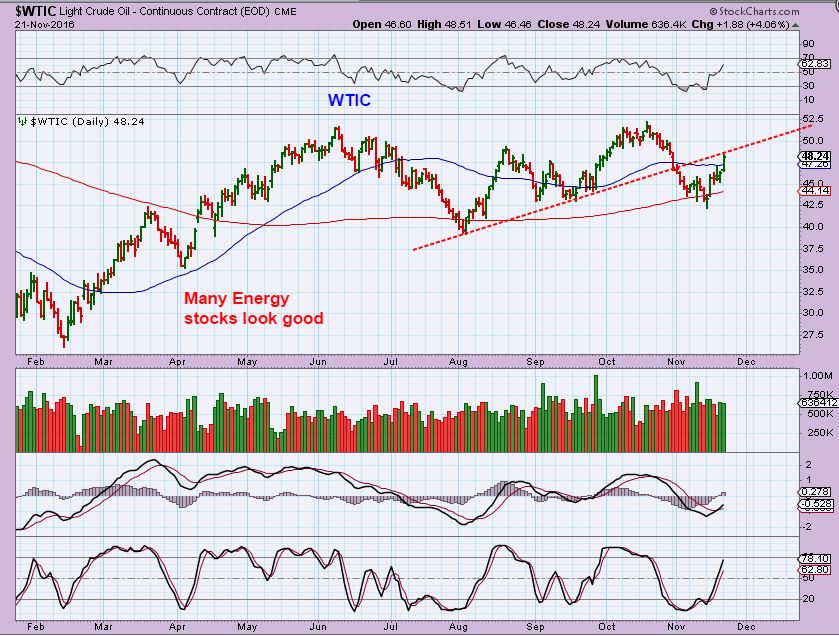
WTIC – Oil looked rather good on Monday with the follow through out of the DCL. It has back tested the break down of the trend line. I have discussed my thoughts on Oil, saying that since it broke below the last daily cycle low, it should fail. It should not break to new highs. I do see many good looking energy stocks. Some beaten down seriously since this summer look like they want to recover, others that I have outlined as my favorites in past reports ( CWEI, OAS, WPX, REI, RICE, etc) continue to hold up well and are even breaking to new highs.
.
I commented this way at the end of the day. You may want to look up some of these charts if you’re curious. Along with Energy, VALE, FCX, CENX, CLF, TGB, AKS, X, SID, HBM, and other stocks mentioned in prior reports look like they are putting in bull flags and consolidating for possibly another leg higher too. For now, I am focused on the Miners, since I believe that they are at the lows and have good upside potential.
.
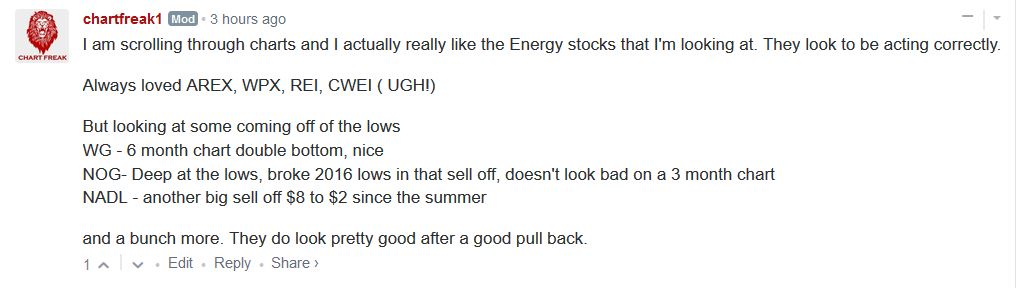
NADL – This looks like it may be coming up out of the lows after a prolonged sell off. I do think a ‘trader’ could ake a stab at it here with a a stop right under recent lows or $2.50. This could move very quickly.
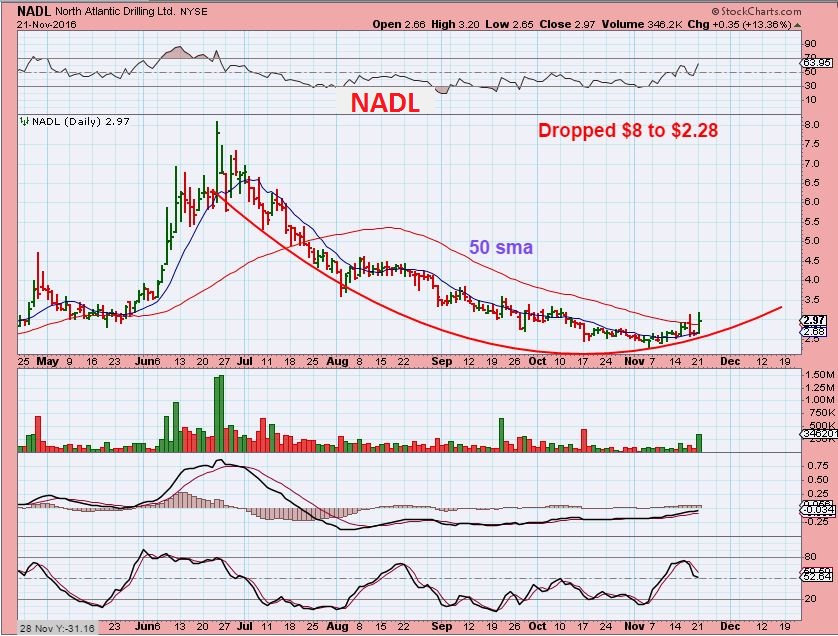
OAS – One of my former purchases, it continues to be one of the healthier energy stocks, or ‘buy the dip’ candidates. It continues breaking to new 2016 highs.
.
GOLD, SILVER, & MINERS
.
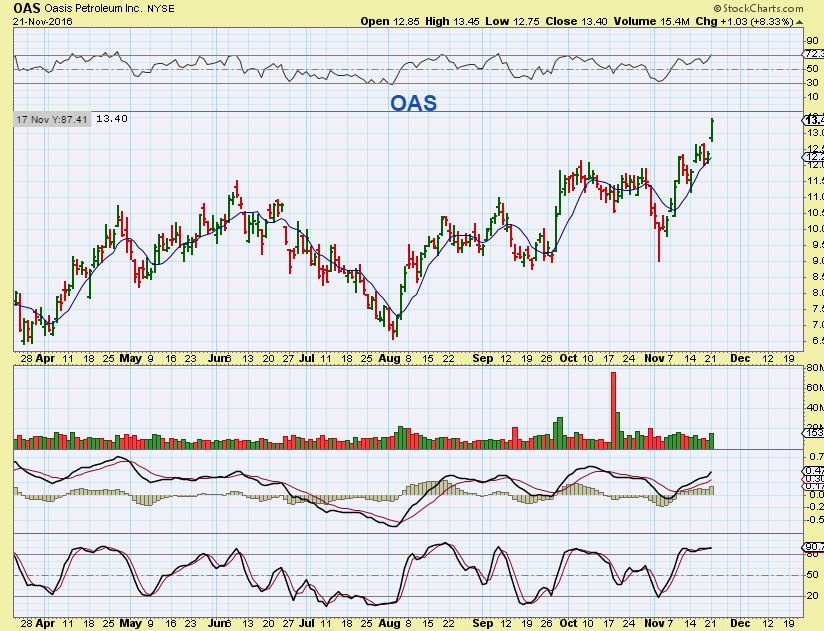
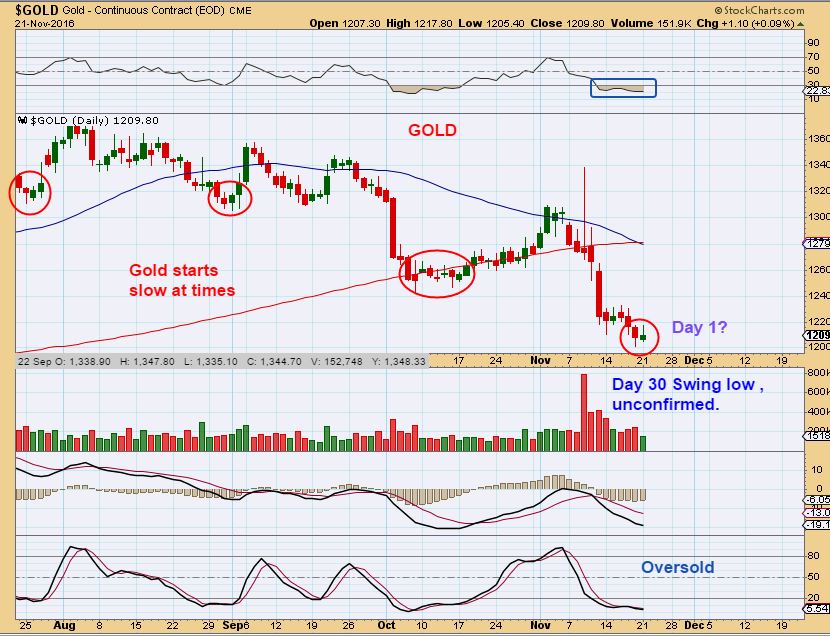
Recall the Inverted Hammer candle that can show up as a reversal at the bottom of a sell off. It can act as indecision at lows, and start a move higher.
GOLD – I see an inverted hammer in Gold & Silver now. Day 30 may be the lows. Look for a move above $1217.80 to surpass Mondays highs.
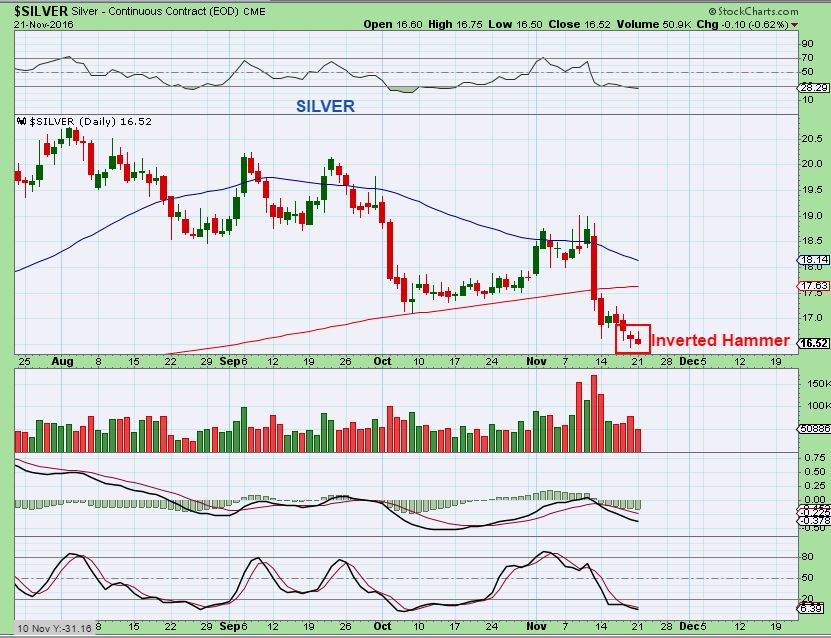
SILVER – Ditto, look for a move above $16.75 to surpass Mondays highs.
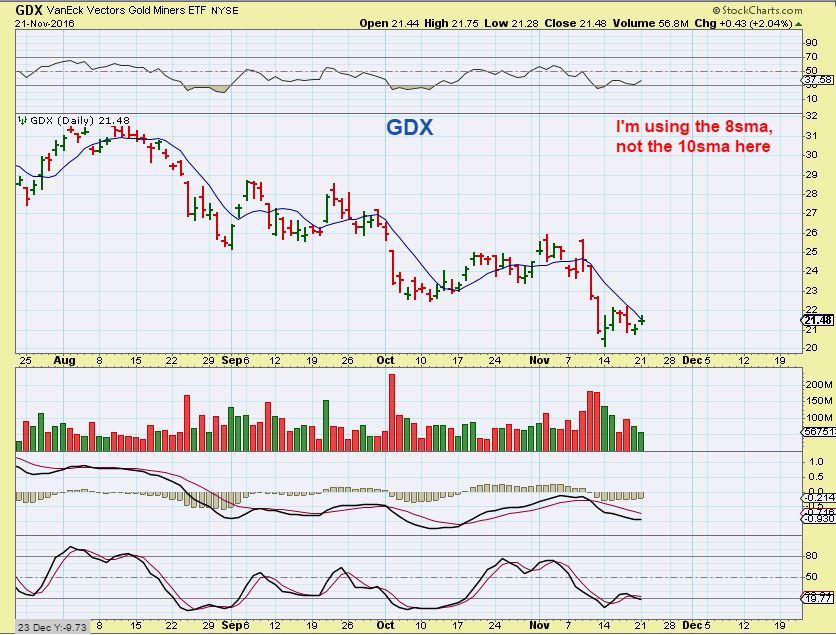
GDX – Gold sold off midday and GDX tried to fill the gap, then it recovered a bit. I am looking for a break and close above the 8 sma for additional confirmation that a swing low is in place. Should we be concerned about this low Volume lingering at the lows? Let me show you why I am patiently waiting for this set up to play out.
.
I am NOT worried about a lack of strong follow through and a lack of strong volume, because when I look at prior lows under similar conditions, I see the same thing. This seems to fool many people into selling, thinking that there is no strength.
MAY ICL – Lingering at the lows for 5 days with low volume.
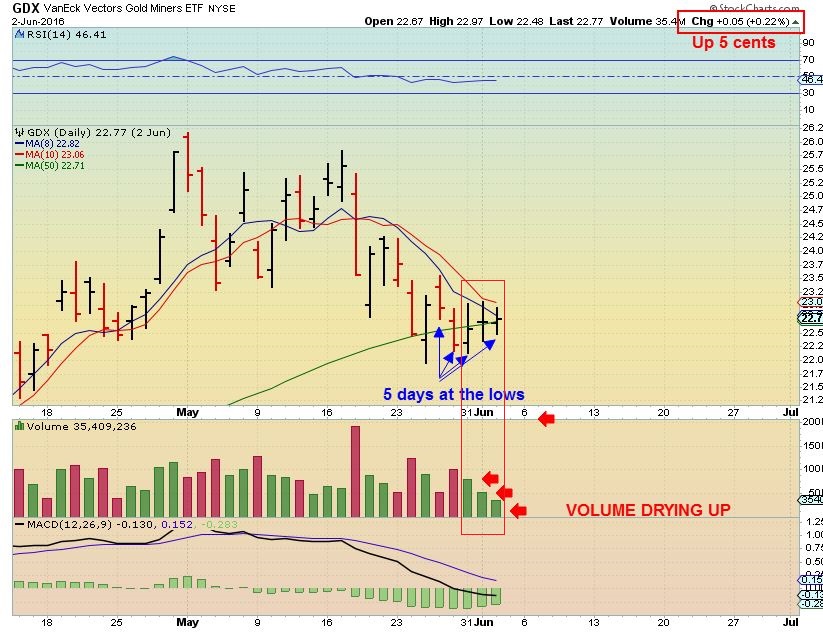
MAY ICL – BYE BYE
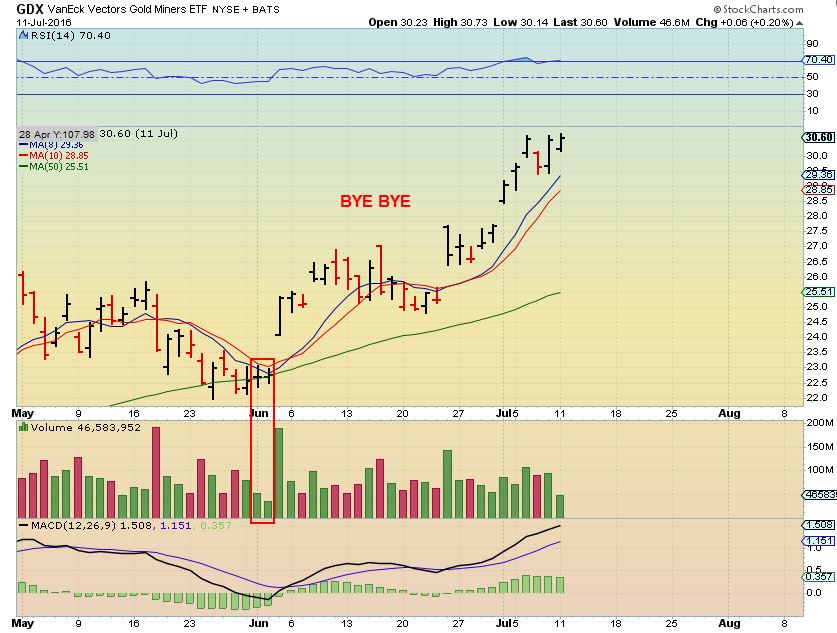
So nothing has changed since my weekend report, there has been no damage to the precious metals charts. Cycle timing is calling for a low in Precious metals, I have many reasons to believe that we are putting one in at this time. I am patiently waiting for the Miners to make a directional move, and we continue to have a balanced view of things. The Fed Minutes are released on Wednesday, and that ( inflation talk?) may be the catalysts for a stronger move in Gold, Silver, and the Miners. Enjoy your Tuesday trading.
.
~ALEX
.
An Idea for experienced active TRADERS
.
I’ve been following many of the metal stocks that already took off and put in some great gains. I was watching for a pull back and a low risk trade set up to form, but they are holding up very well, simply bull flagging. If you look at a chart of VALE, you can see that it bull flagged to the 10sma, and then broke out higher again, even though it was extended. Then it dropped back down and back tested the flag. This is normal action, but it frustrates non-traders with the constant up & down movement. I will show examples of what we are seeing in this area, and while it can be tricky to trade, experienced traders may find some set ups that they can manage on their own. I am focused on Miners at this time.
.
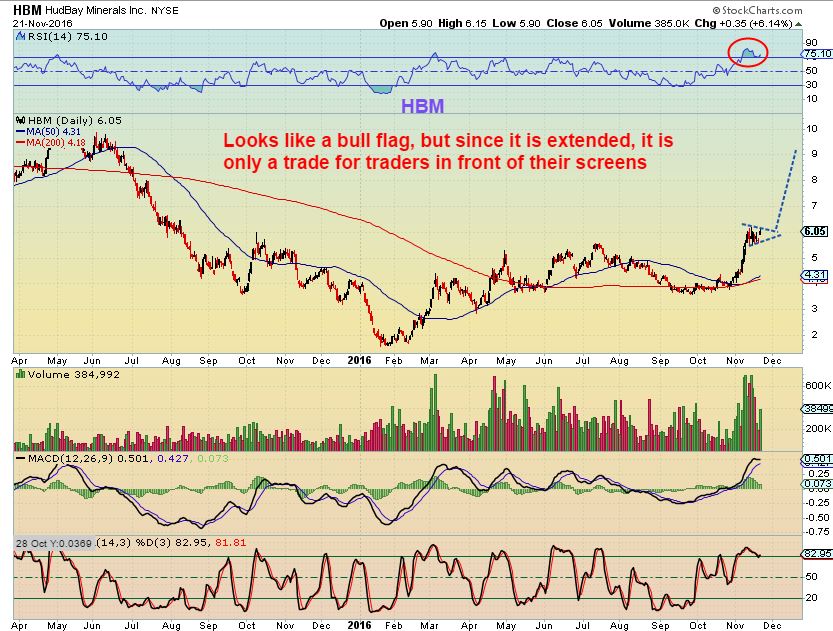
HBM – There is a copper company that we traded last spring. It almost doubled on the recent run and has bull flagged. It looks extended above the 50sma, but it can run higher, because the 10sma has caught up to the flag. I can’t recommend it as ‘low risk’, because once extended, they can get ‘whippy’ and stop out the inexperienced traders or ones that cannot be in front of their screens all day. See a 3 month chart of VALE for an example of ‘whippy’ .
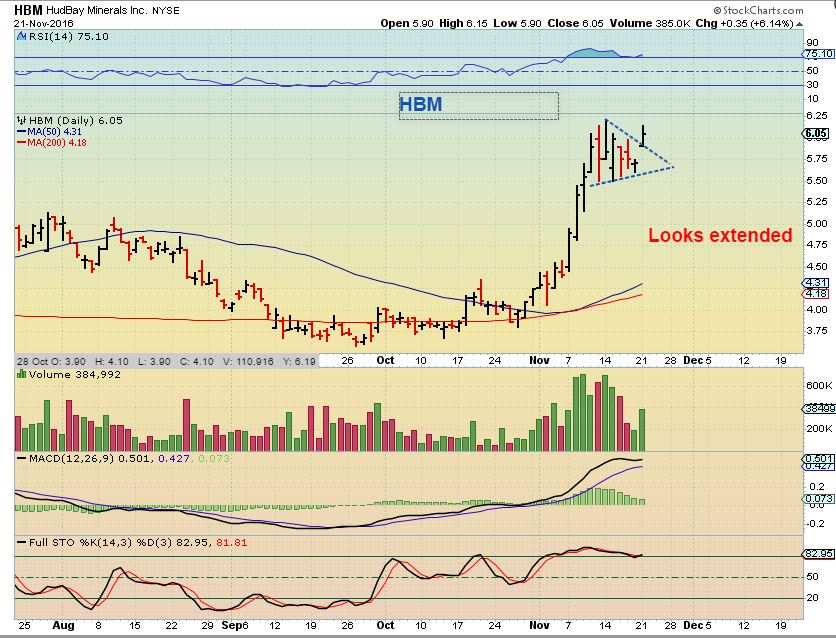
HBM – The longer term potential is great, but how it gets there remains to be seen. Again, if you want an example of the ‘whippy’ action, see a 3 month chart of VALE.
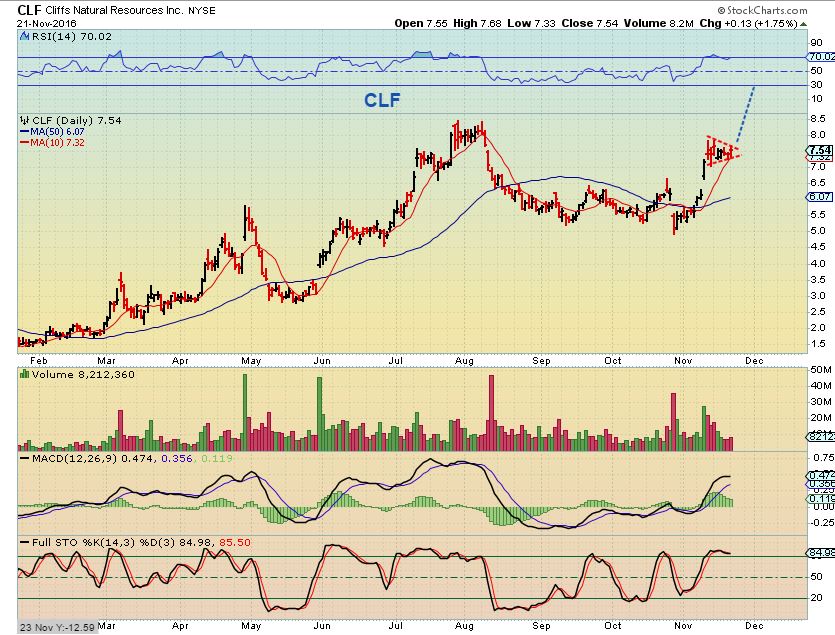
CLF – We traded CLF in the spring time, and after a quick run higher in November, it is also bull flagging. This is a bit of a low risk set up, because your stop is below the flag. This is a good example of why BUY & HOLD works too ( from January), but it is very hard to do for many. Those sell offs in May & August were brutal, but here we are nearing the 2016 highs again.


Alex with this dcl extending to the max time frame does it become more left translated with time?
I guess so, but I’m not sure that it matters in any way.
Alex,
do you think there is a chance of more downside here? or having a lot of people expecting downside will be enough to rise in pm land?
Gold on day 32 should really limit the downside.
A break to new lows makes it day 32, if the lows do not break, it may be day 2.
ASM down by 19% in pre-market.
They came out with a bought deal offering…..
Blood red for me already….now getting worse! GGGGRRRR. I hate these “offerings”. Eventually they recover,… but
I hate those offerings too. I know why they do it, but it ruins a perfectly good set chart up
Alex, back in May you were pretty convinced the ICL was in for GDX. Now that we have a lower low, are you convinced that the May low was a 4th DCL and we are now finishing an ICL?
Hey Bill,
I read this 3 times, I dont know if it is written correctly or not, but I dont understand what is being asked.
The first sentence makes sense. The second one is confusing, sorry.
I am asking IF the previous reported ICL in May is now considered a 4th DCL?
No, nothing has changed for May
Sorry, not May I meant October lows? No wonder you were confused. I knew drinking at work would catch up to me. 😉
Oh those Growlers!! LOL
Yes, Oct lows being taken out indicate that this would be viewed as a final failed daily cycle leading to the ICL. It no longer makes sense for Oct to be an ICL, because they dont roll over that fast, even in a bear market sell off. You usually get 2 daily cycles higher and then a drop in a bear market.
dang… GDX vs. 2008 bottom — still tracking the exact candle count .. eerie …
https://www.tradingview.com/x/qsn95Jh1/
Interesting chart. Do the turquoise candles show exact matches?
tx. no.. my arrows do….
What are the 2 turquoise candles?
from a different indicator i use in tradingview
Thanks…I thought I was missing something important
GDX just tagged the lower trend line. That could be it. Silver did the same
https://www.tradingview.com/x/DtPDVLe6/
Maria, how do you overlay these charts in tradingview? I am new to tradingview.com.
i dont have time now.. but one of these nights I will show u… 😉 sorry at work now
dang.. now i have Eagles stuck in my head.. 🙂
*could be worse things swimming around up there… 😉
No problem. Take your time. Thanks Maria
Aniket, on the left side of the Tradingview screen are a list of menus. One of them (7th one down I believe) has a command “Bars Pattern”. Click it, then click where you want to start and end the pattern. Tradingview then overlays the pattern in between your start stop. Then you can drag it where you want. Vio la
tx pecos 😉
#HB https://uploads.disquscdn.com/images/fa5538d2035f461260b7ab345ab88df5a7bc5e302f0106c8cf74e4c71f2f4838.jpg
Sure thing #HB
Oh! Excellent.. Thanks Bill
Maria, How do you like these candles on JNUG?
https://www.tradingview.com/x/1fHvhSPt/
interesting… where did u borrow those from …………
Look up AKS or X – Pretty similar move. I dont think that it is exact though.
Those are JNUG candles from October. Recent pattern repeating, same stock. I like the way all the retesting lower trend lines held this morning! Now we are moving higher.
At a glance, (I looked at a lot of charts this weekend) the yellow candles look familiar to me
Like AKS or X
BAS +20% again today….
I look at BAS in Sept and Oct, and see that it was up over 50% a couple of times, but still just dropped to new lows since then.
Could be short covering? Not sure. Can’t tell when or if it is really going to get going.
The NYSE has accepted the companys plan for continue listing on the exchange subject to quarterly reviews.
Net margins not that bad actually….
Maybe it’s ‘basing’ – with POPs like that, pretty interesting for a trader.
Agree……
Pot stocks are mainly going in the toilet. May be due to Sessions.
Yep, think so.
NADL ( Shown in the report) is up over 20%. looks like it was up 34% earlier.
Released earnings today
Todays selling has most Miners only down 2 or 3 % ( GPL is down more, I own that one).
encouraged to see CDE, MAG, PGLC, NSU, THM, AUMN, GSV, AKG, NGD, AG, FSM, SLV, PAAS Green at this point
asm -22,10% we need the fed with infationary talks
Yes, it was mentioned here earlier, they did an offering for financing.
Does anyone want to buy this base? Looks more bullish than bearish to me. ( refresh)
.
Double bottom with rising MACD at lows. Possible inverse H&S.
.
https://uploads.disquscdn.com/images/48f8fe5d3b15eeca77c7bc1f03e1ac3661639ab0570ed99d20fc7a0c41be428a.jpg
Can’t figure which stock it is
GDX 15 minute : )
I think we’re going green soon – may just be that noon time bounce?
Nice 🙂
Yeah, Just a different perspective – beats looking at it down 30 cents – lol
Good morning Alex…. .which chart stock it this @ 35.00 ????
THANKS>>>>
GDX
Noooo….. I think its GDXJ @ 35.00
GDX is @ 21.25
Thanks Maria.
lol … i tried.
i read alex post below… fast…
Thanks for trying, I did say GDX
if at first u don’t succeed… read the directions 😉
measure twice..cut once..
etc ;o)
Because I thought that this was GDX, I bought NUGT at $8.30 for a quick trade, now I’m stuck inside of this thing rising higher : )
no complaints, maybe I’ll just keep it
that was advice for me…. not u.. giggle
Good eye Geurt.
I was looking at both ( they both look similar), but yes, this is GDXJ, and I expected it to recover. this is a bullish set up short term.
vale new high +6.4%
Alex,
PPP would you consider that stock basing or bear flagging ?
Could be either, reaching out to tag the 10sma. Can it break higher? Not so sure. but that has been a terrible miner for 2016.
If anyone was thinking of buying it, i’d advice waiting to allow it to prove itself in some way. The 1 yr chart is way below the Jan 2016 lows.
thanks
It has been a terrible miner for a lot longer than 2016! I have that in my old account from many years ago, so far down in the red it may never revive!
Kinda the reason I was watching it …. 🙂
Oil:
OPEC has a semi annual meeting on Nov. 30 “seemingly” heading to an agreed production cut between the members …. Iran and Iraq are the wild cards though ….
Yes, I heard that Russia was agreeable to cuts, but I think this is the 3rd time I’ve heard this.
The shipping stocks have been crazy. SINO $2 before election went to $14 now back approaching $3. DCIX from about $3 to $26 now in the $4s. GSL from $1.20 to $4.50 now $1.70s. Geez.
How could you skip DRYS!! CRAZY!
DRYS shows a print high of $435 and didn’t know whether that was real. They did have a 1 for 15 reverse split. If it is it went from about $5 to $435 now back below $7.
I’m anxiously waiting for the miners to make some exaggerated moves.
That is an understatement on my end.
It’s just another wasted day at the lows when this happens.
I saw the selling today and thought , “Another delay of game!”
The day isn’t over yet!
Something is stirring. My acct is green, JNUG is green, I am getting some early buy signals.
I got a buy sign near the lows, look at that chart set up below 🙂
Alex, did you get your proven GDX buy signal? 8ema cross over I think?
Bill, what time frame are you referring to? I checked my daily 9ema and GDX has not crossed that yet, but it just crossed my 5dema. The 15, 30, 60 min have all crossed their 9emas.
Im looking at the 30 min chart. I am watching the pennant for a breakout. I am not watching EMA. I thought I remembered Alex using EMA in his GDX indicator.
https://www.tradingview.com/x/qZnfFylT/
im diggin on this pattern actually …
https://www.tradingview.com/x/qBFiDMTg/
I actually got it on Oct 12th, and then again Monday.
I dont use an 8ema cross though, I think that was our occasional commenter Steve Tytler ( And a few people here thought he was from Aerosmith) 🙂
That would be so awesome if you had Stephen Tyler on here! (No offense to Mr. Tytler). And I saw that and saw the same thing. Picture kinda give it away… 🙂
I’d like to see GDX look like this after the FED MINUTES tomorrow. It is almost an identical bottom pattern to GDX now.
.
https://uploads.disquscdn.com/images/0a3a3c9d59dcd4a37bf846cd504b3ff50acc2b8e3303b3e03a1ce7f10e19d81e.jpg
just to compare.. heres an update of that 2H GDX chart from early october, when we were last awaiting a breakout https://uploads.disquscdn.com/images/b2204710202cd7332ef357a606dd4cbd940a1013c9909f2f8b0422674d08ae9f.jpg
yes please daddy 😉
PAAS definitely looks like it put it’s lows in on Nov 14th with the earnings report.
It just ran from under $14 to $17.50, but it looks like it wants higher price.
Anyone that wanted to own a healthier looking stock could consider that one.
GSV up 6% again too, off the lows of Nov 14th and soon to be attempting to overtake the 50sma again.
NSU – Break out
LABU, Bull Flag forming……….
https://www.tradingview.com/x/4TAumcFY/
I see a head and shoulders in your bull flag : /
I see it too, thanks
Where do you see this in your chart (LABU) BILL ????
Ooohhh…. I owe you a lot of respect.!!!
THANK-YOU !!
We were talking about possible HS pattern, see attached. Looks like we got that this morning and now going higher.
https://www.tradingview.com/x/oPCr2eOQ/
Looks like it got filled.
https://www.tradingview.com/x/oPCr2eOQ/
Thanks Bill…. are you not afraid for the big cap down @ 32.00 ?
Could fill the gap!
I think you could buy with XBI hitting and holding the 50-day at $62.92 which is about $1.70 lower in XBI. With 3x that is a 8.15% move or about $38.61 on LABU based off of today’s close.
That is a MONSTER gap below. You would HAVE to have a tight stop here. You give XBI $1/share of wiggle room, after that you’re out. Make sense?
https://uploads.disquscdn.com/images/0e7f2b26b9907fffea05c44732a5fc469dd6dfb210e70774c6ea5df55f0ece98.png *F5*
Dear Cason…… many thanks for your help and input to explain a good plan. You are right to make a tide stop at say 62.00
Let me think about this plan Cason. I really appreciate your idea.
Have a good night rest and hope to see you tomorrow.
Again…. Thanks Cason.
Alex,
I noticed ( if the quotes are correctly in my system) that gold had it’s low at 1201.50 late May, 2 days ago it went down to 1201.3
this low is lower than the previous ICL – does that means we have cycle failure ?
it was also a left translated one ? not really one to be ahppy about : )
I have seen this before. I’d rather see it hold, but things were so jumpy around the U.S. elections that wee got big moves in all directions last week.
Gold is seeking out a yearly cycle low, and it can break prior ICLs like May, just not the DEC 2015 ICL
how many ICL s are in a yearly cycle? 2
I don’t like the way gold is acting. Went back to a full hedge via Dust. I’d rather be safe and miss the 1st.move up than to be naked and suffer the dreaded gap down in the after hours trading. Bawk,Bawk,Bawk!!!!!
Yeah, no kidding. If Alex wasn’t so sure, I’d probably be shorting all of the pops (and would get fleeced IF we ever go back up. If). Good thing I’m not doing this on my own…
Maybe you could just take a small short position …for the rest of us? : )
This is a long boring bottoming process, but Fed Minutes tomorrow….MAYBE we get some action.
I know SOG would at least love it. Need to help the rest of you guys out of I can.
This bottom is KILLING me. Ugh.
1Hour MACD on GDXJ is positive for the first time since 11/4/16.
Now the question is, will it hold?
It needs to! I ran out of patience weeks ago!
Alex, Mr. Market must’ve read your report – did GDX close exactly on the 8 day MA?
Even though there was some nice movement upwards today in all of my positions (except NAK and AUMN was flat), I am leaving the stops where they were this morning to give them some extra wiggle room. I don’t want to be knocked out at this time and fully expect to see a mix of red and green as we go forward. It was a great day to go skiing – (because I didn’t have any wood to chop). I don’t want to add and I don’t want to get stopped out – so patience is where it’s at right now
Same boat, wish I was skiing though.
Breaking news from MarketWatch!
X, CLF Steel and base metals fly on upgrade from Chart freak Financial Services! Freaks push to new 52-week highs!!
I sold both way too early, hope you’re still riding!
I am! I sold half of X near $27.5 to lock in some profits, but man I started screaming higher again today. Thanks goodness I’ve had these to float me while miners continue to disappoint and frustrate!
Yeah, wish I’d had some…..but…they were going up…..didn’t want to buy high….then they just kept going up….now…..I’d really be buying high….arghhhh
That’s what happened to me with miners last winter. Got locked out. This time I’m in way early and then nothing.
Still have CLF — GS upgraded CLF and from now on pay attention to GS upgrades. Mnuchin/Treasury). My next bet is Lucas Oil stock goes up .,,
Can you ask them to upgrade JNUG, please? I’m dying here. Tortuous.
I thought Morgan Stanley upgraded them?