
WEEKEND REPORT- RECALCULATING ROUTE
Have you ever been driving along using your GPS and you decide that maybe you’re going to take a short cut to your destination? The GPS detects that you have left the designated course and immediately needs to compensate by announcing, “Recalculating Route!”. Well last week sectors of the markets took sharp detours right after the elections. Using over 50 charts, this weekend report will discuss the road we find ourselves on now.
.
SPX – Nov 1st , Expecting a trade-able ICL, maybe in the 2070 area.
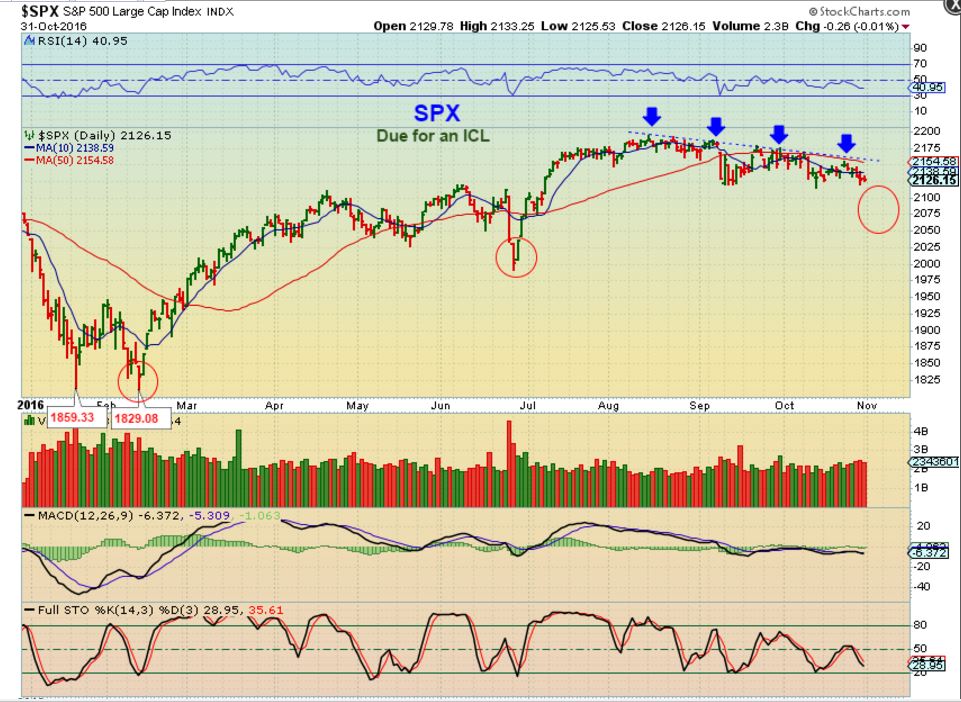
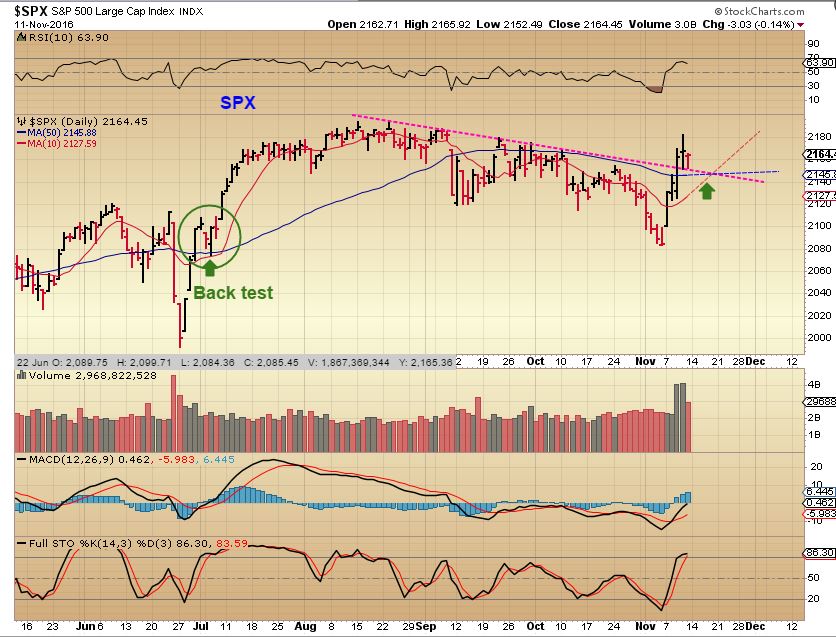
SPX – The ICL seems to be solidly in place, with a break out from the downtrend after the election results were in. Futures shot down immensely during election night, but the chart simply reflects the time that the market was open. Volume was huge after the election.
.
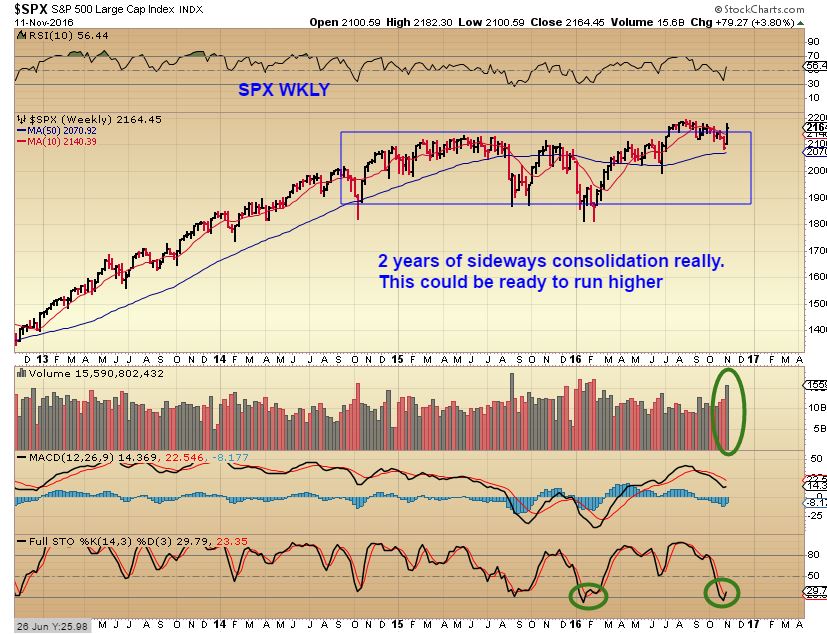
SPX WKLY – This could be a huge breakout from a 2 year consolidation, and it is oversold!
SO here is my current thinking…
Recalculating route: Trumps policy has been to promise to build a better infrastructure, add more jobs, boost the economy, etc. Can he do that? Time will tell, but this 2 years consolidation of indecision seems to be breaking out with confidence at this point that the U.S. economy is being invested in. I DID see some changes with the election results, however, so let me quickly discuss that. Obama promised better health care, and after his election health care stocks did well. Will that now change? Trump promised infrastructure repair and Metals stocks blew up higher. We discussed X, AKS, FCX, VALE, STEEL, ALUMINUM, etc in reports last week, and their explosive moves. The bonds seem to think inflation will come about too, and wouldn’t inflation be good for Miners too? Gold shot up $50 after the election, but gave it all up in 3 days falling toward a Dcl ( which is likely extending into the ICL. We need to look at the path of many things and see what the markets are telling us. Lets continue…
.
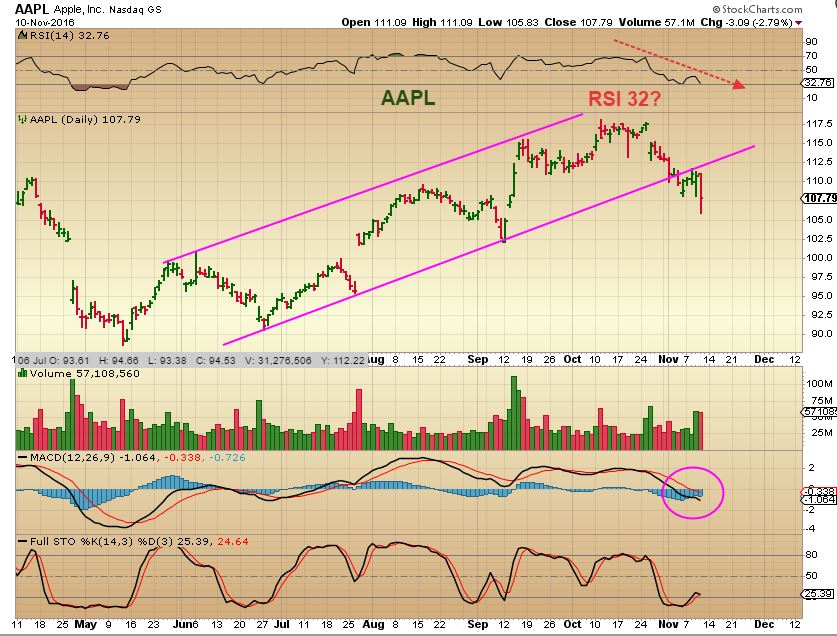
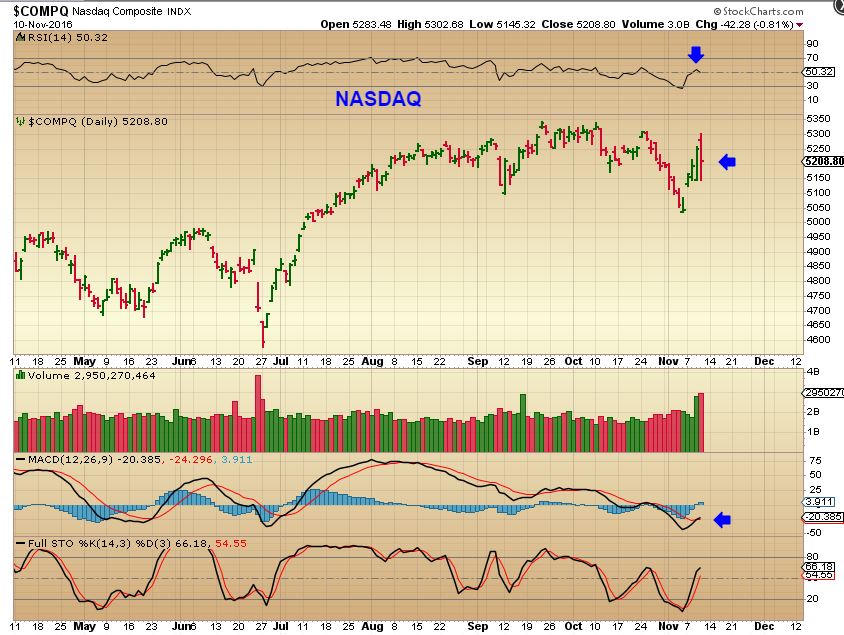
NASDAQ – I pointed out the sad looking charts of GOOG & AAPL last week . Will Tech suffer now? Should some Tech investors be recalculating their route? Time will tell, but what I am saying is that we may be seeing some shifting and we have to be ready to alter our route if necessary.
NAZ daily Thursday, I didn’t like this drop and Tech did seem to be having trouble, but Friday it went green again. So lets look at the weekly.
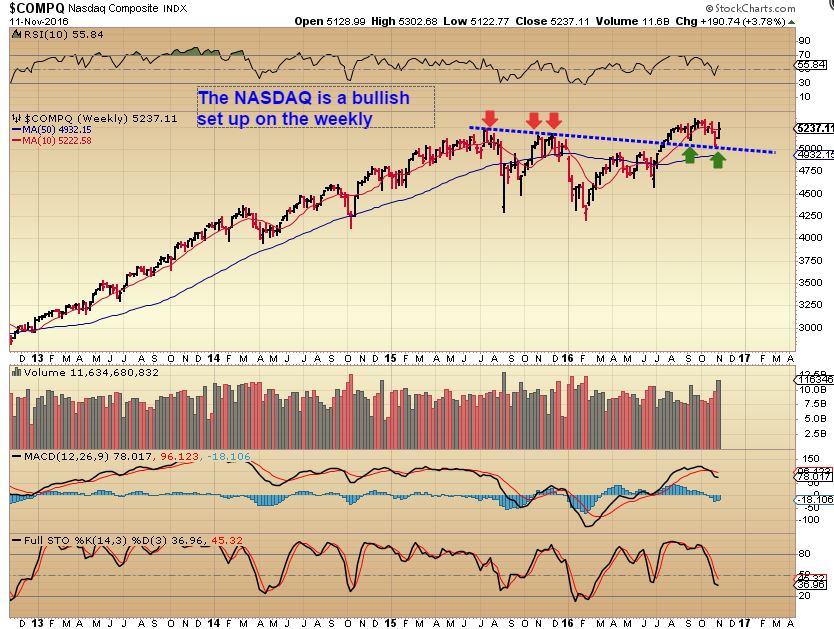
NASDAQ WKLY – This is still a bullish weekly chart, so the ‘trouble’ that came up after the election may just be a bump in the road, NOT a change of direction. Time will tell.
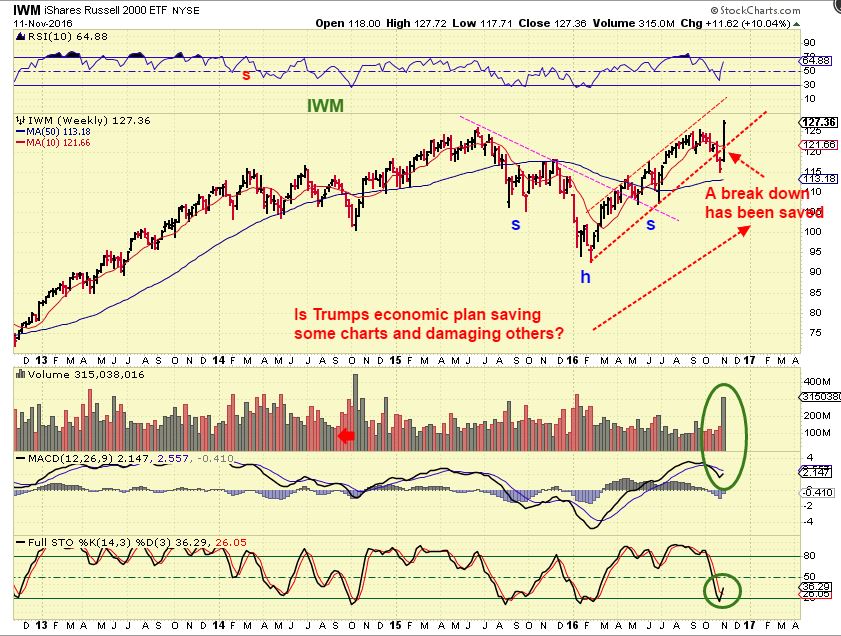
The IWM actually broke down a week ago. This election week it recovered. Was that a shake out? This is how a Bull Market throws people off ( Think Gold & Miners too). This chart was a false break down / shake out.
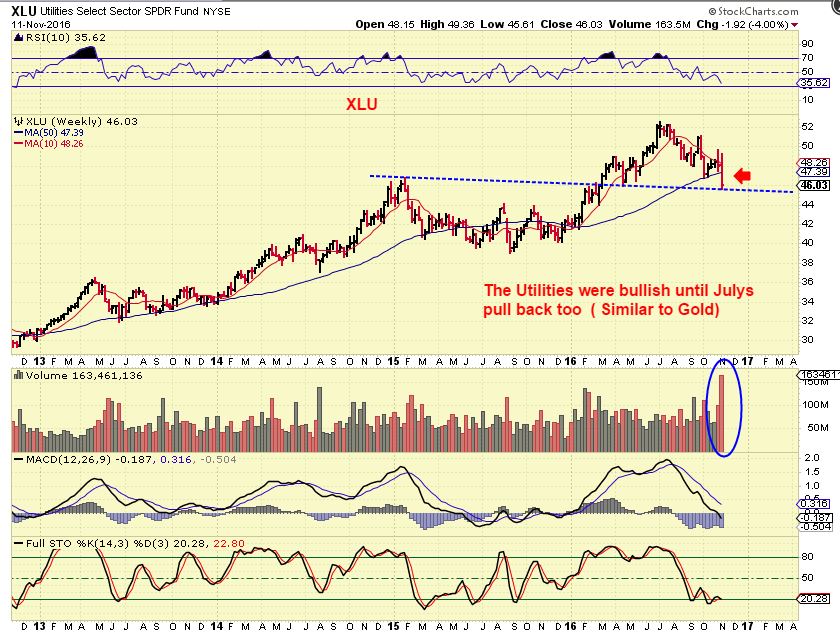
XLU – The XLU looked like it as breaking down From July to now, after a very bullish run from Jan to July ( Sounds like Gold, huh?). This week it crashed after the election results. The Big picture says to keep an eye on it, but it may still be just a back test and consolidation before resuming upward. It is oversold on the weekly. This break down may recover.
USD – The USD is due for a pullback using cycles, but currently the chart looks like a bullish break higher.
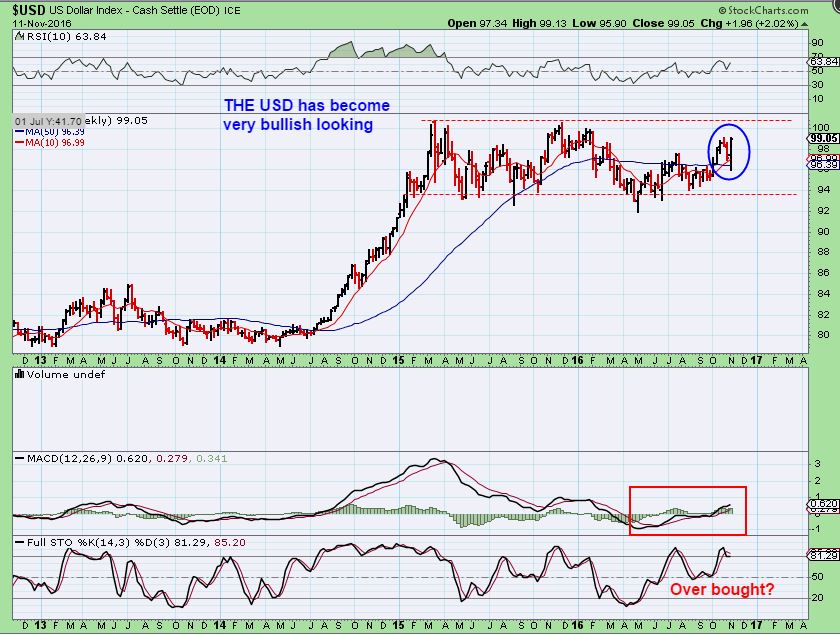
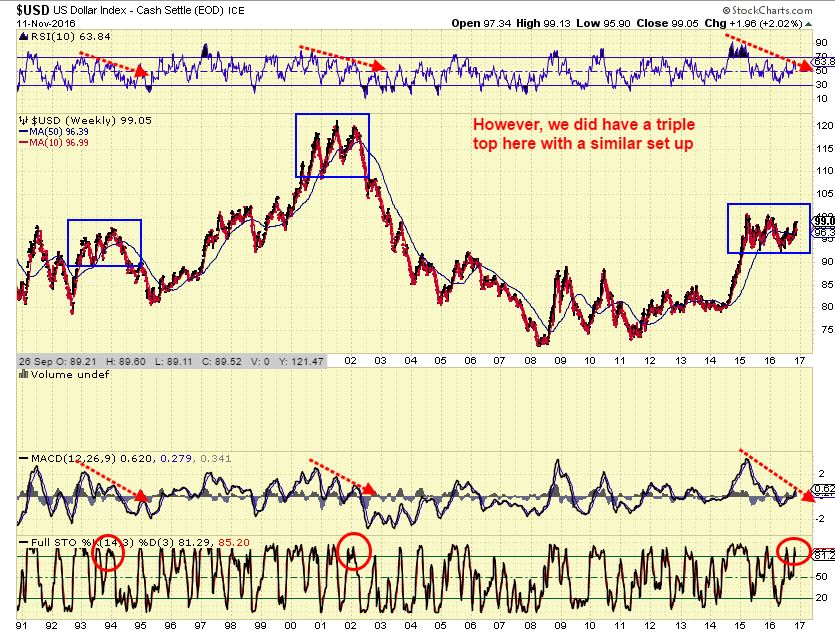
USD – We have seen this type of top before, with divergence. I am of the thinking that when the Fed sees markets breaking higher, they may actually do another interest rate hike in December. The USD may roll over with an interest rate hike. Trust me, I have studied Gold during times of interest rate hikes – It was bullish for Gold.
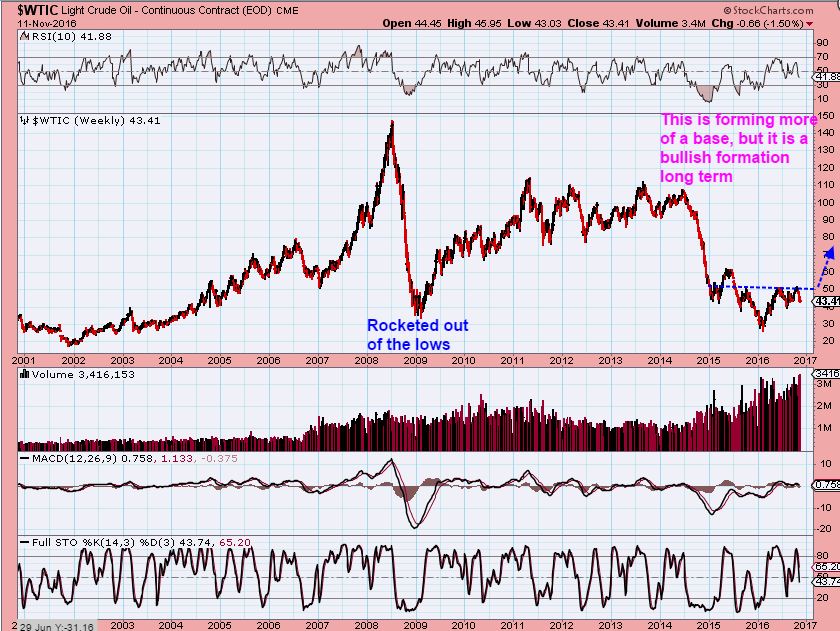
WTIC – Oil continued lower as expected.
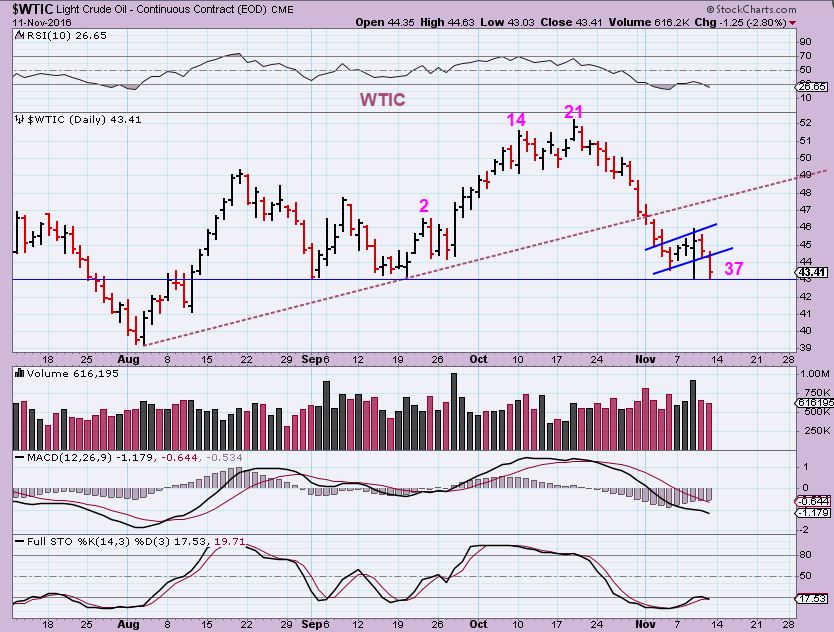
WTIC – Oil broke the intermediate trend line, so it is falling into an ICL. The weekly chart has plenty of room to drop, we’ll have to see if it can bottom & turn higher, but I would watch for a back test of the trend line, since a dcl can do that and then the real dip into an ICL would be deeper.
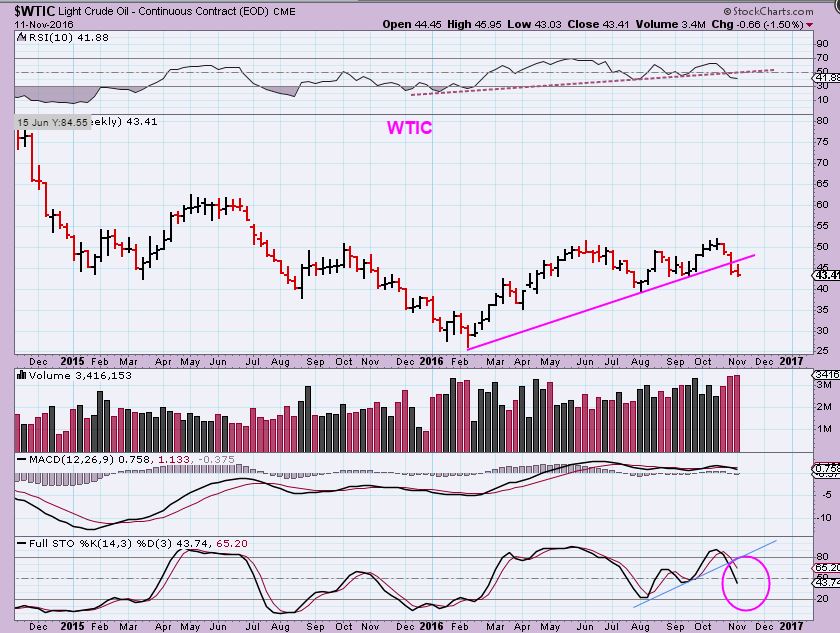
WTIC BIG PICTURE – We are not rocketing higher like 2008. I originally thought that we may see the same type of move higher, but Oil is putting in a bullish base. This looks like an Inverse H&S.
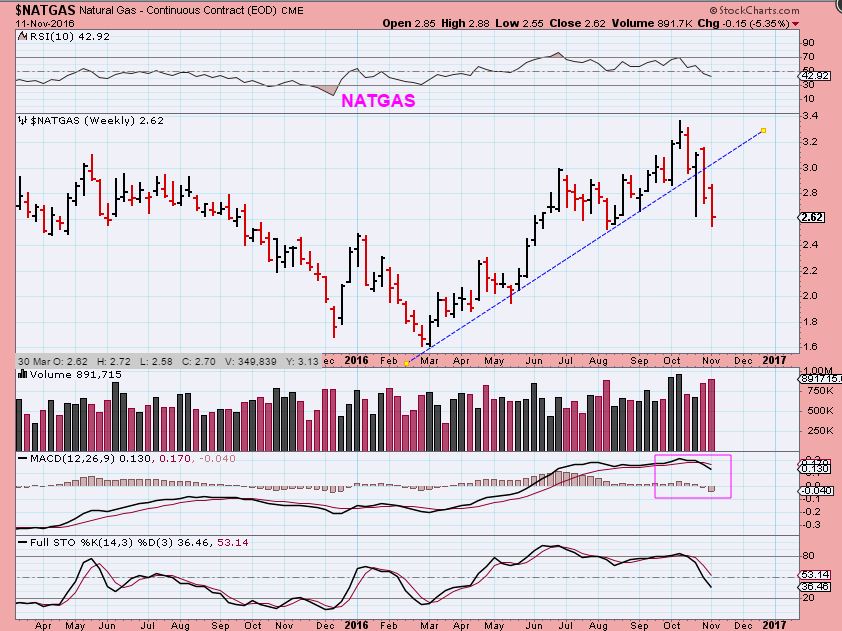
NATGAS – Natgas also began to break down.
.
GOLD, SILVER, & MINERS!!
.
Huge question this week has been, “Is gold still in a bull run, or did the Elections alter it?” Do we need to recalculate our route and go short? Will Gold finally drop to under $1100, and Trumps election is bad for Gold? Lets examine 1000 charts and see what we can discern.
.
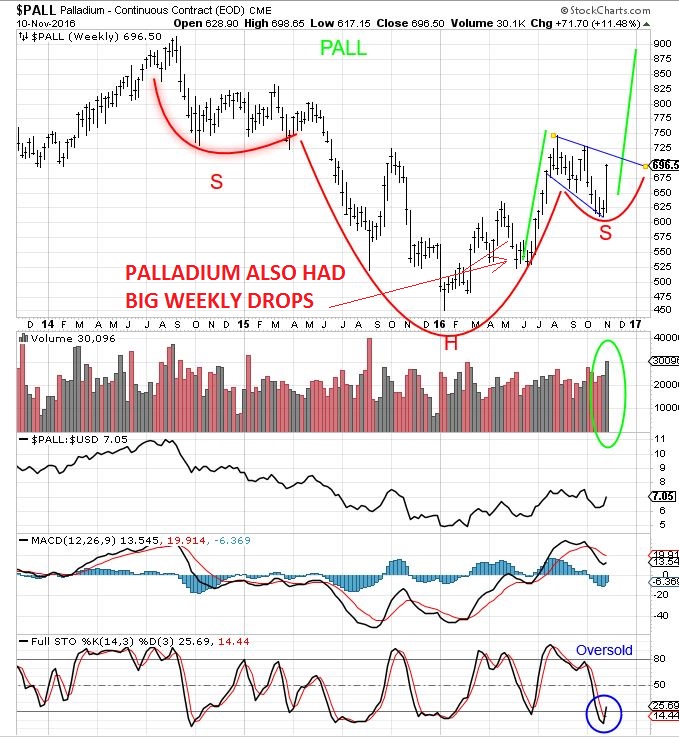
PALLADIUM looked bullish to me, it seems to have bottomed in October.
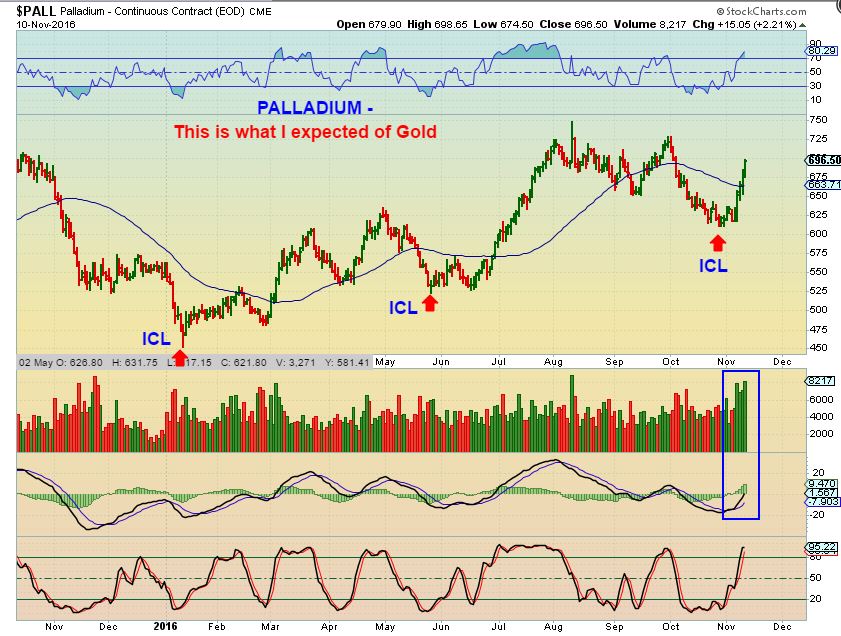
It dropped pretty sharply from July to November before it took off higher. Is it leading? Gold was doing that too, dropping from July Highs to now, and we played the daily cycle ( unfortunately, the last DCL did not hold as an ICL after the election, we need to examine that now.
GOLD – After the elections, Gold initially reacted by shooting up $50. We then saw 3 days of solid selling, as the ‘timing’ was correct for it to head into a dcl. We knew that, but I did not think that the Oct lows should break. Why? Everything that I compared it to as former ICLs was actually happening, but Gold certainly did break the Oct lows. Let’s examine GOLD.
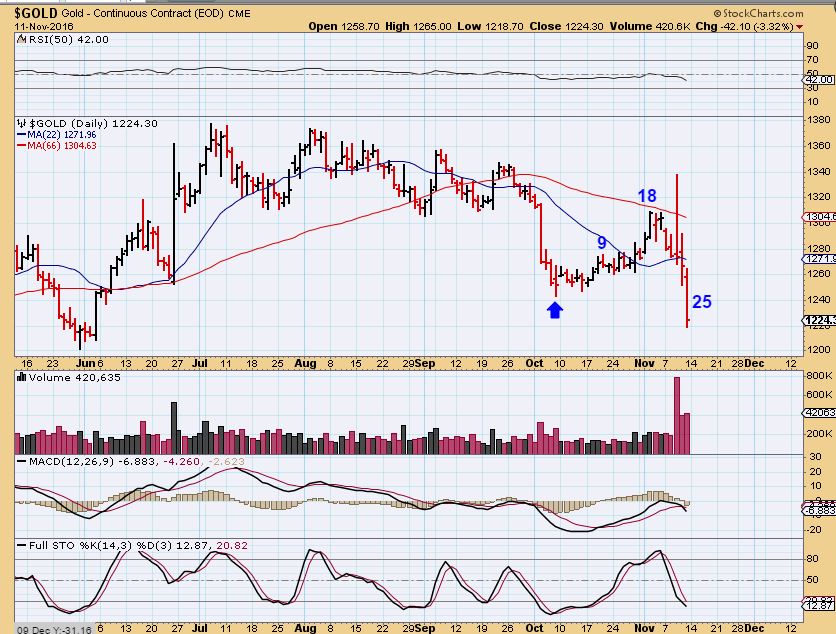
GOLD – The selling was normal for an ICL in October. With the Election results, is Gold now bearish and breaking down? That is important, we will watch this very closely. I want to discuss scenarios.
Could “they” (Big Money) slam this into an extended ICL to run the stops? A perfect shake out that will have everyone believe that the election of Trump is bearish for Gold, and give theirs up? In my opinion, the election of Trump is NOT bearish for gold, but again, we will watch this closely. In order for big money to scoop up a bigger slice of the pie, they would drop Gold & run stops. When the job is done, they mop up positions and it runs higher quickly.
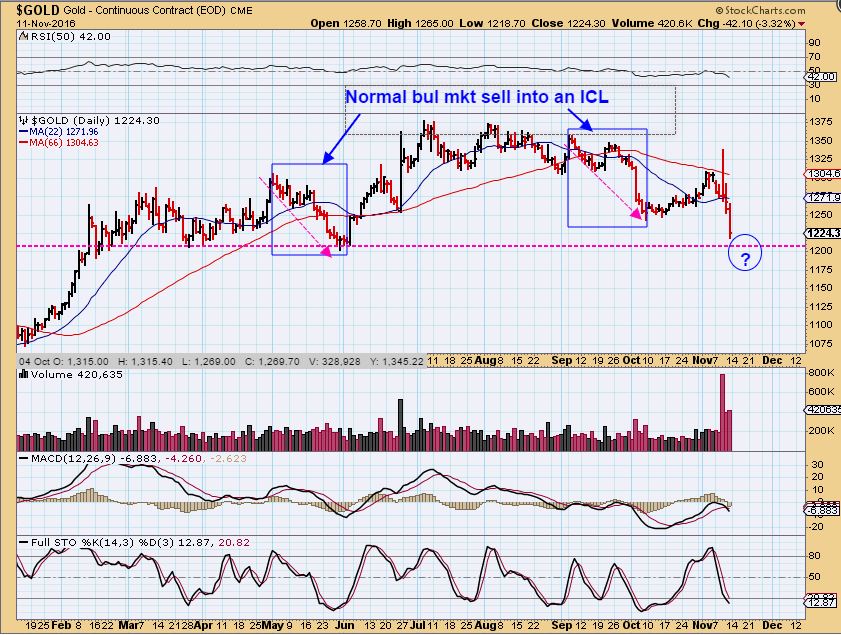
GOLD – I would personally hate to see Gold at $1150 due to the fear that would come with it, but a normal back test would do that and would run the March & May stops. When gold breaks the daily cycle low, it is looking for an ICL eventually. When the Intermediate cycle trend line is broken, it is looking for a yearly cycle low. We seem to be doing that now. Note: That trend line was already back tested, a drop below 1200 would actually be enough to run stops, the back test is not necessary. Then we’d look for a recovery.
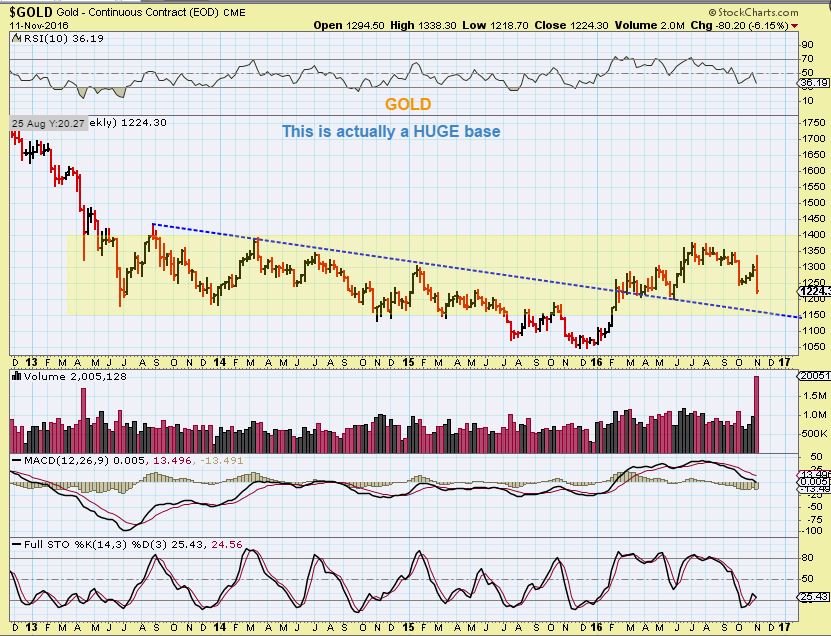
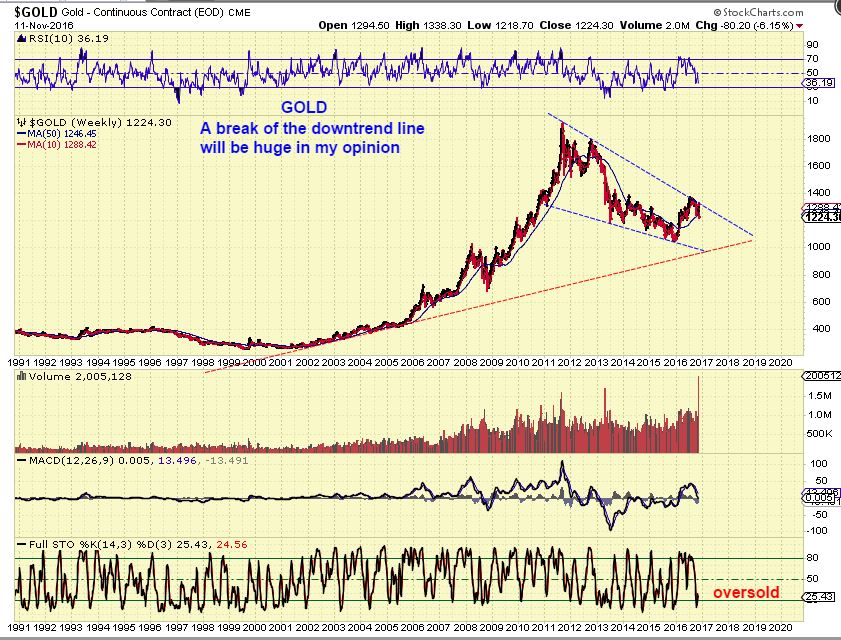
GOLD WEEKLY – Gold was hitting long term resistance. Often resistance is hit & hit and then a pullback gives it a running start to finally break out. A break above that trend line will be very bullish. We can watch for that. A drop to the red dotted line would not be pleasant at all ( in my opinion). I do not expect that drop though. We are oversold on the weekly though, and due for a DCL ( ICL ).
GOLD IN A BULL MARKET
.
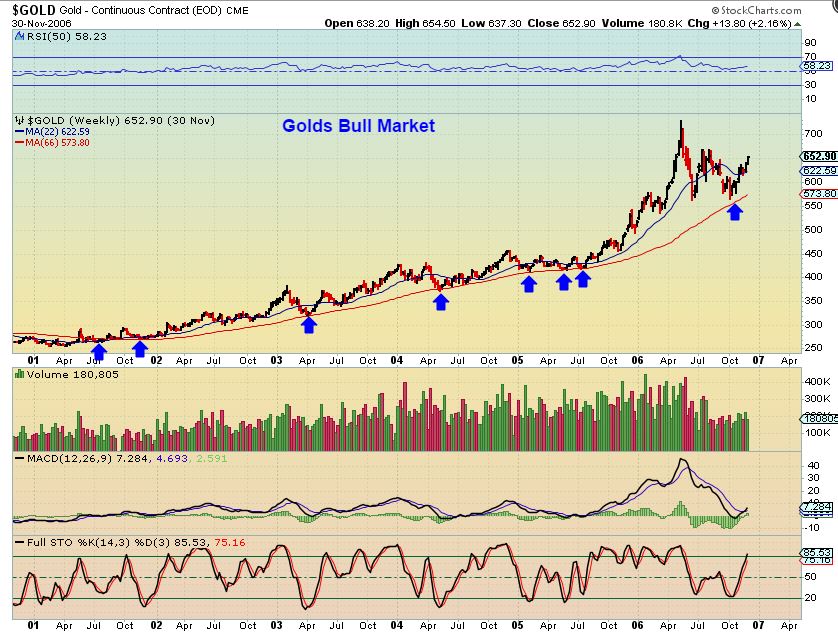
GOLD CHART #1 from 2000 – 2016 peak – In the past bull run would often hold up at the 66 MA. LOOK AT THE 66 MA here in the bull run of 2000 – 2006. Steep drops have dropped to the 66ma repeatedly. At times I use the settings 22, 44, 66 ma for longer term reasons, because the fluctuations can be large in a long bull run ( look at 10 yr charts of AAPL, PCLN, or NFLX if you need proof that Bulls buck a lot).
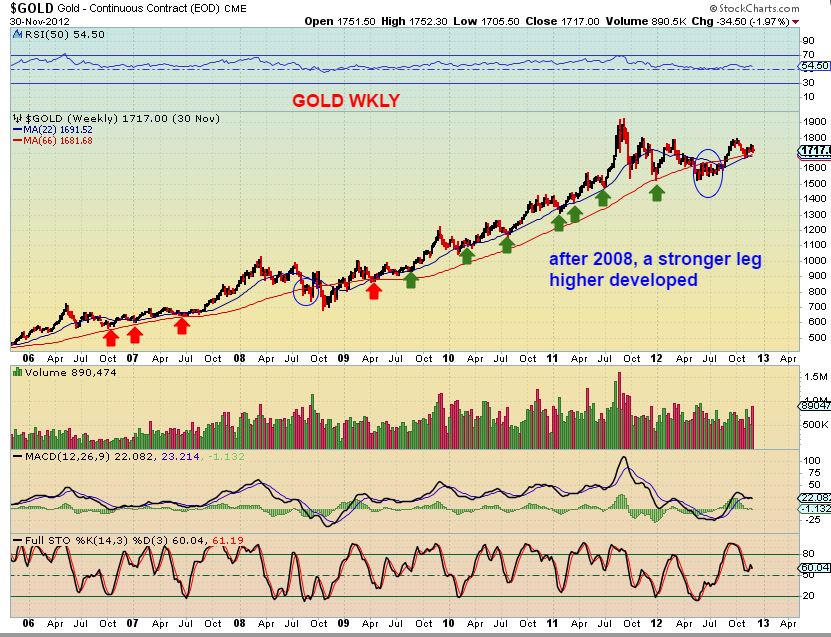
GOLD CHART #2 from 2006-2012 peak – This steeper run from 2008 onward actually tagged the 66 within the first year, and then held the 22 from then onward. We are now within the first year of what should be the resurgence of the Bull.
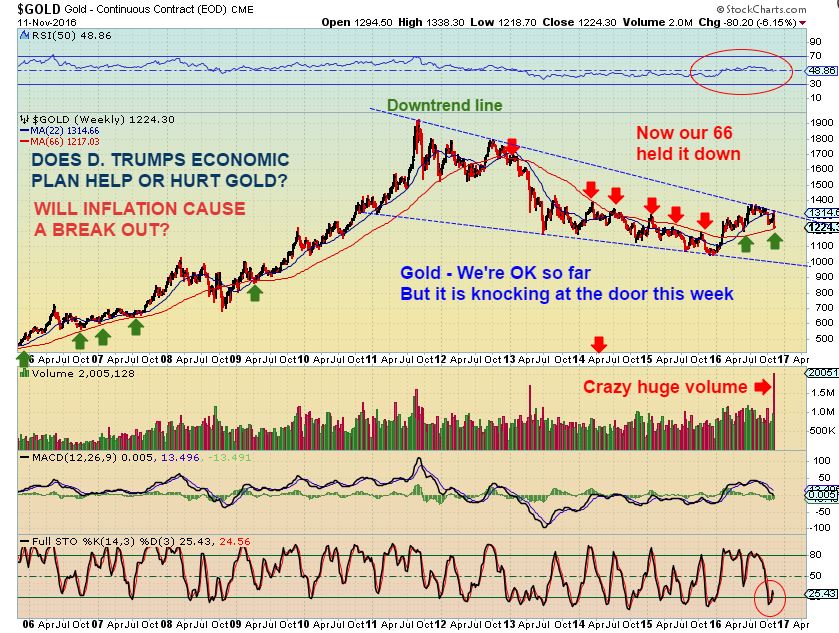
GOLD CHART #3 – Let hope prevail. That 66 became resistance in the bear market ( red arrows), and then support in the new bull run. We are there now, slightly above it. A quick drop for that stop run below 1200 and recovery is fine, but if Gold trades below the 66 ma for too long? We need this support to remain in tact in my opinion. Right now, Gold is above the 66MA.
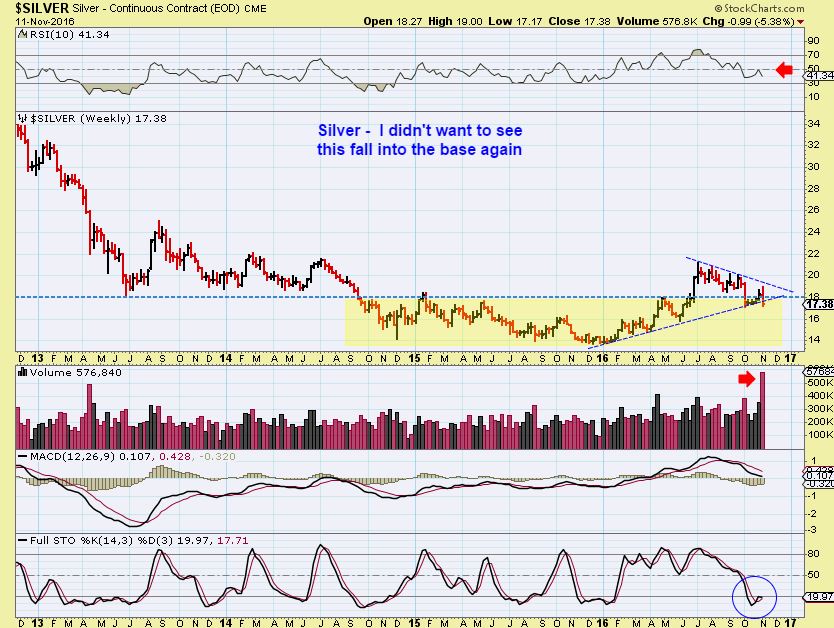
SILVER – Silver is breaking the intermediate trend line. This means it could be looking for a yrly cycle low, and then we would expect a recovery if the Bull remains active.
.
MINERS
.
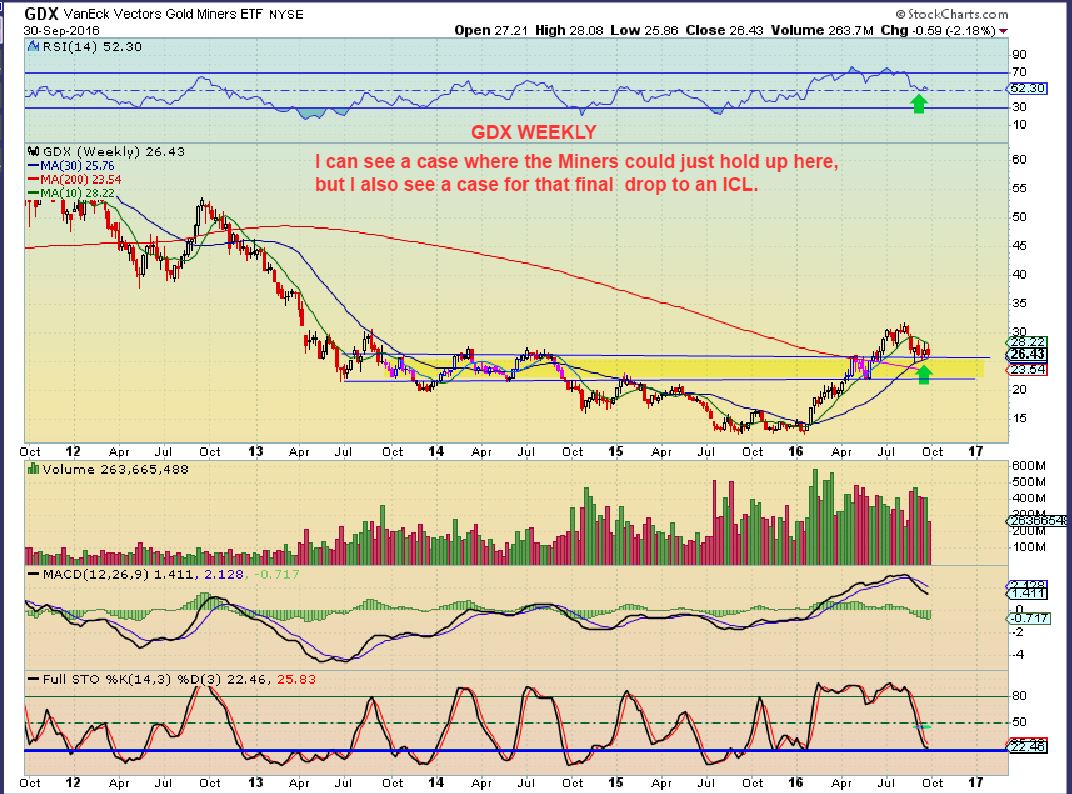
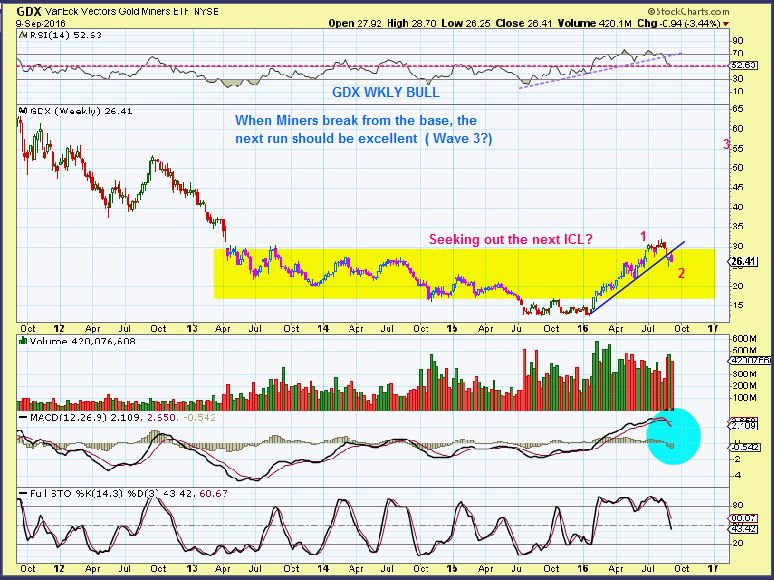
GDX – In September I drew this expectation. I wanted to see strength and for this to hold, but also knew that we could drop into the yellow area for an ICL. My Sept charts show that I was discussing an A-B-C down at that time, to about $22 area.
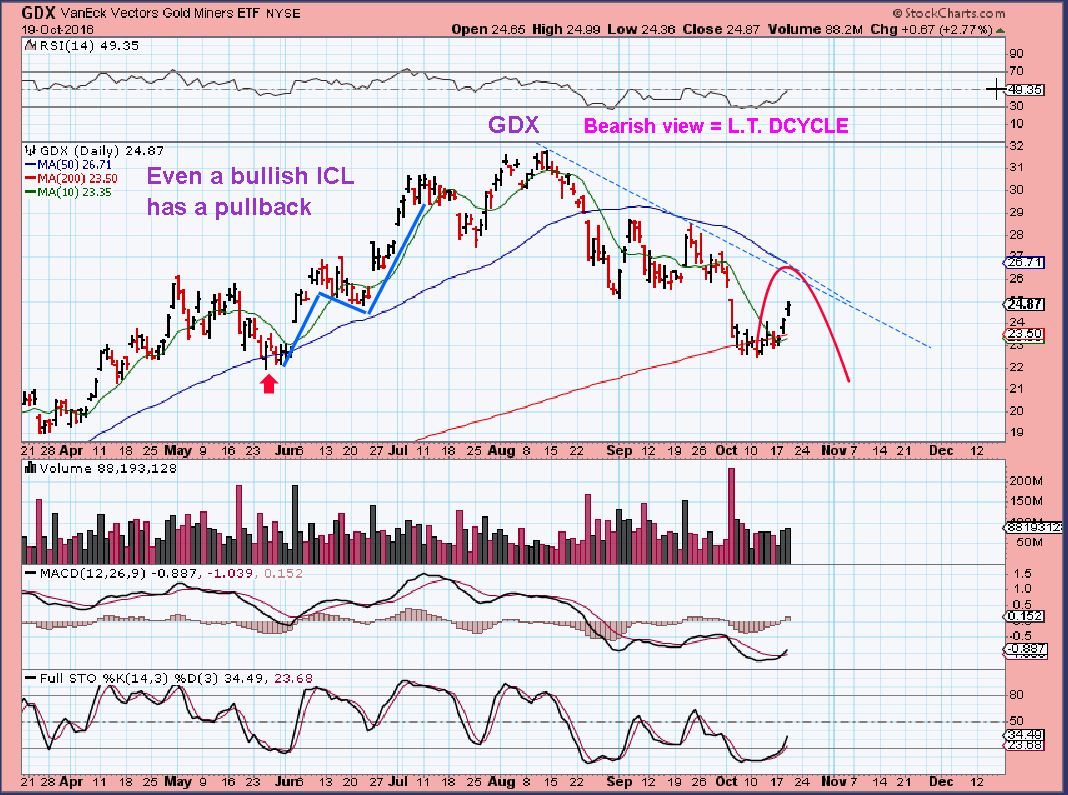
GDX OCT 19th – When buying the OCT lows, I said that I felt the selling had dropped it into an ICL. I pointed out that a L.T. daily cycle would mean one more deeper drop. our daily cycle was R.T., so I was deceived into holding on believing that the OCT lows should hold on. I was wrong, we got this instead.
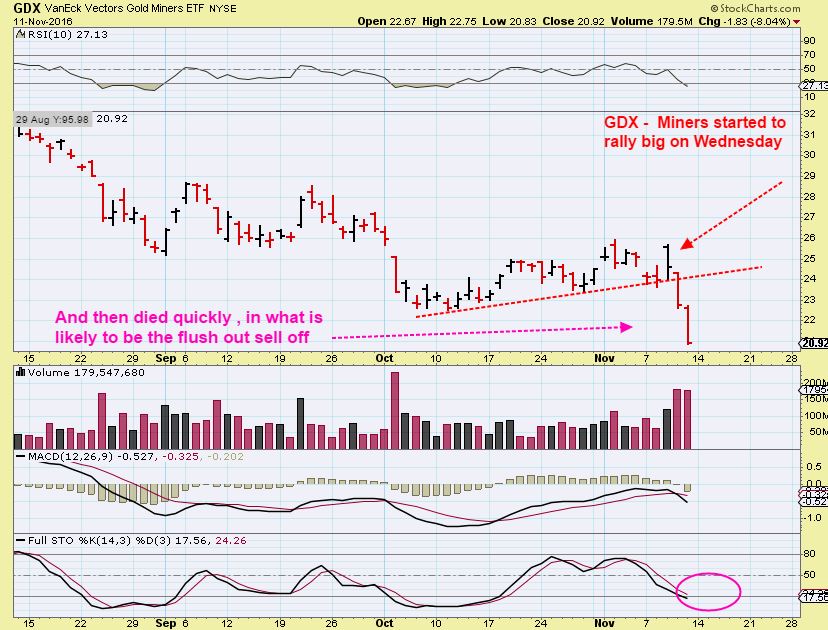
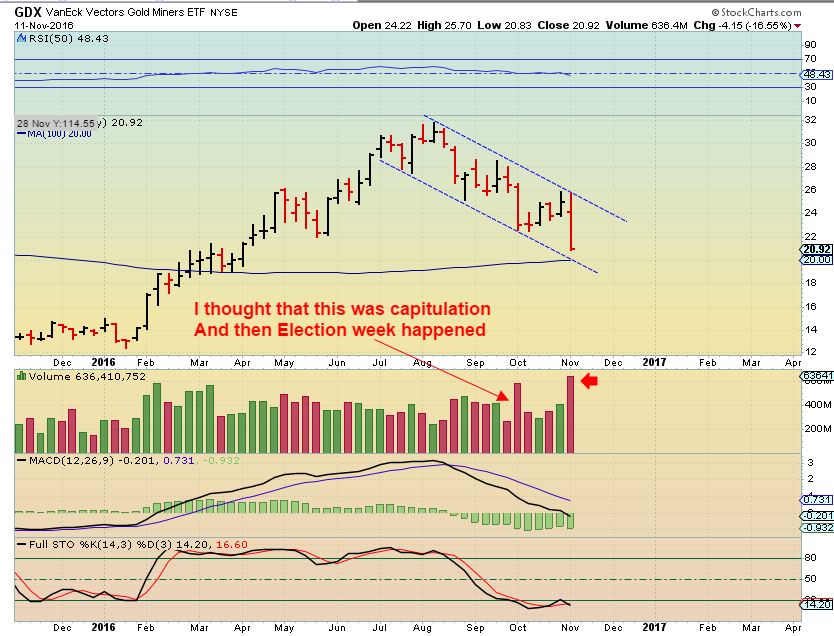
GDX NOV 11 – So here we are, with Miners rallying Wednesday after the elections, and then taking a 2 day puke that felt like 10 straight days of selling to many. They were big drops down, because for GDX, 8% is big.
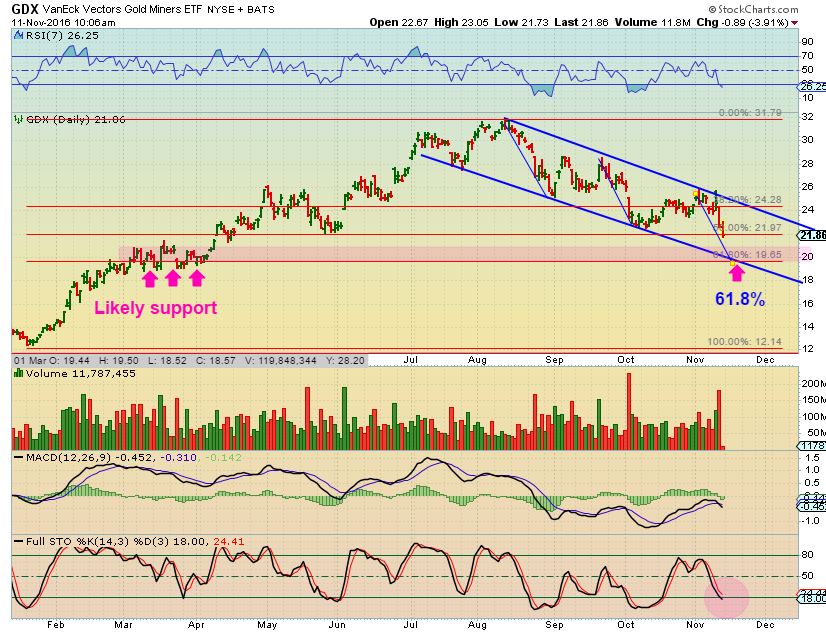
GDX Friday intraday, I posted this in the comments to show possibilities in this sell off. 50 – 62% pull back is possible in Bull markets. That would mean more selling is possible next week to get us to a DCL ( ICL?). Notice past drops of equal length with the blue lines. You never want to be holding leveraged positions in these kinds of drops, but at least you can see that they do recover in the coming bounce. Please examine the chart and then lets continue…
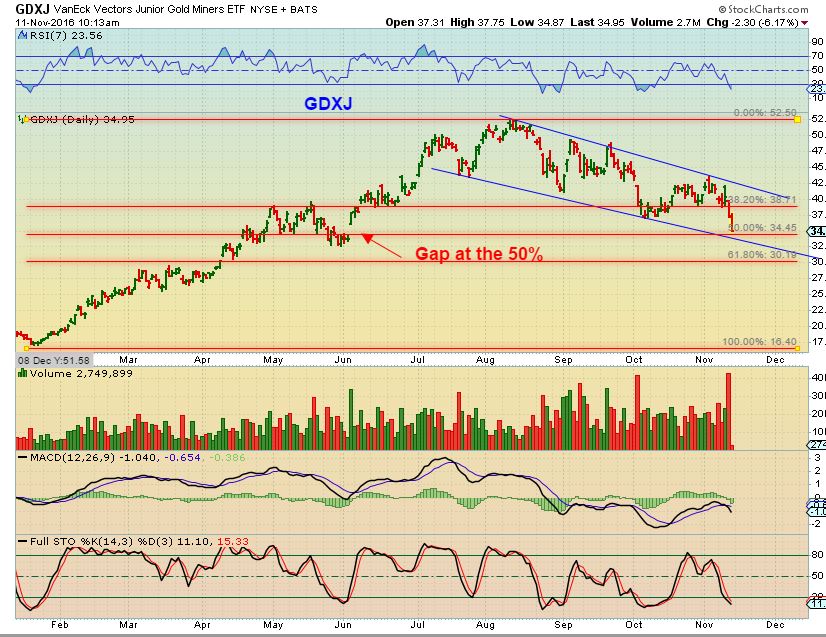
GDXJ – Same set up. 62 % pullbacks of an entire yrly move can take place in bull markets. 50% is excellent if it holds.
GDX – Capitulation drops often lead to lows and a bounce. We may drop this week and then see a reversal in the same week.
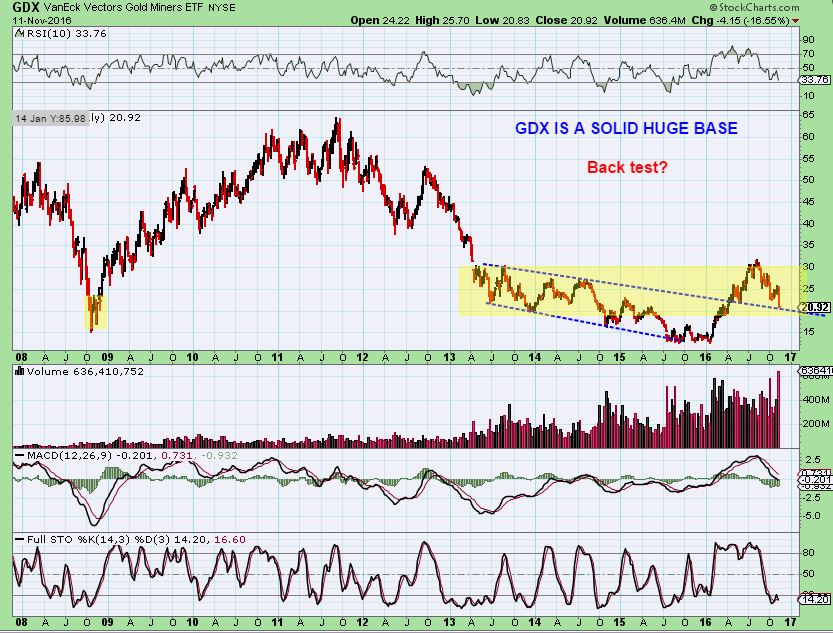
GDX – Is this a back test into a yearly low?
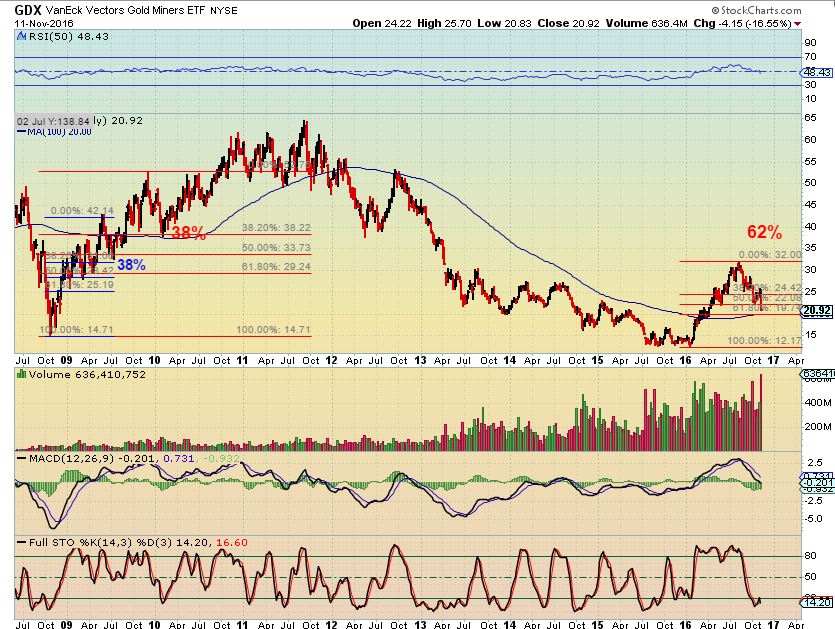
GDX – The dips in 2009 & 2010 were not steep, but the ride higher was much bumpier. They were 38% pull backs. This one has been steep from July, but it was also quite a straight up shot from Jan to July.
.
MORE RESEARCH AND FACT FINDING HISTORICALLY
.
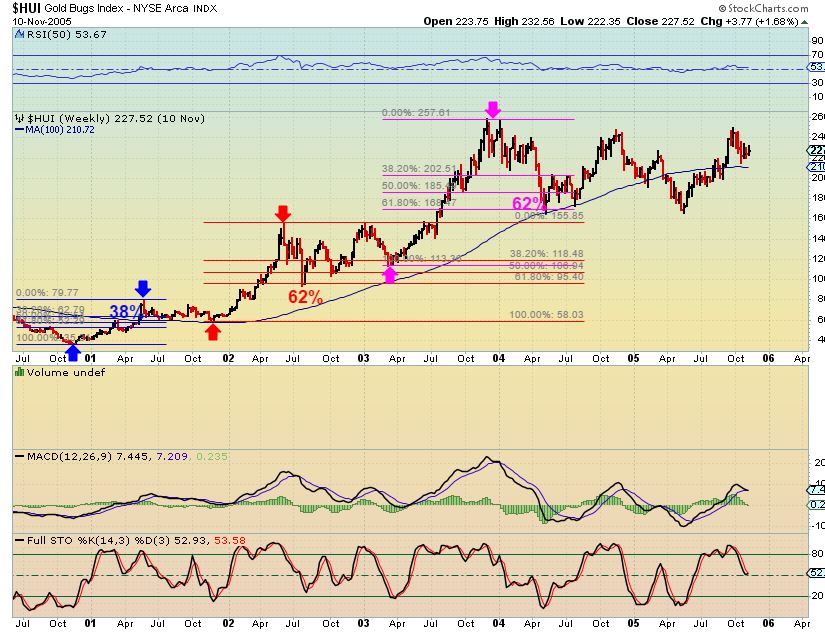
HUI FIBS – The HUI did put in steeper drops in the bull run, even 62% pull backs. Those must have concerned many buy & hold investors. Look at the 2004 drop. This is a weekly chart, 4 straight weeks down.
.
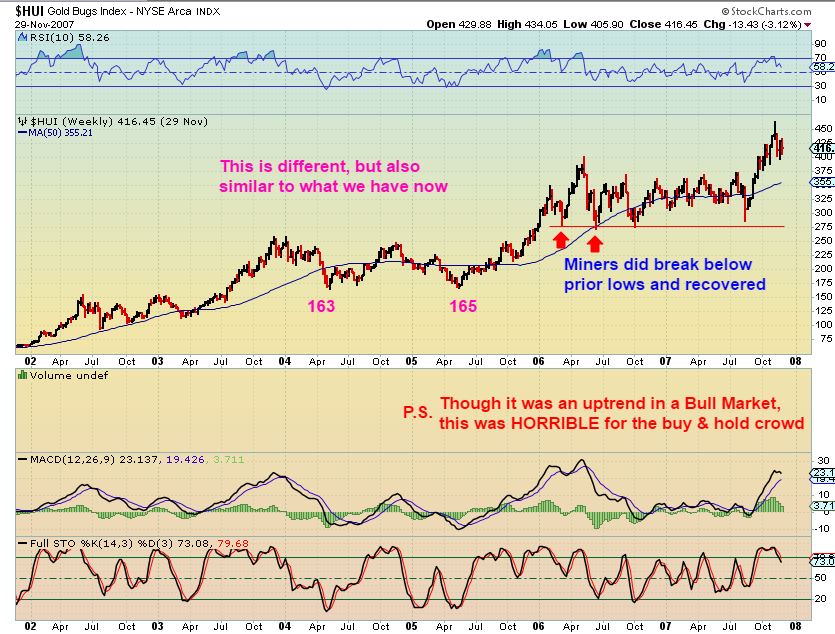
HUI – Lows were broken and recovered and the bull remained in tact.
.
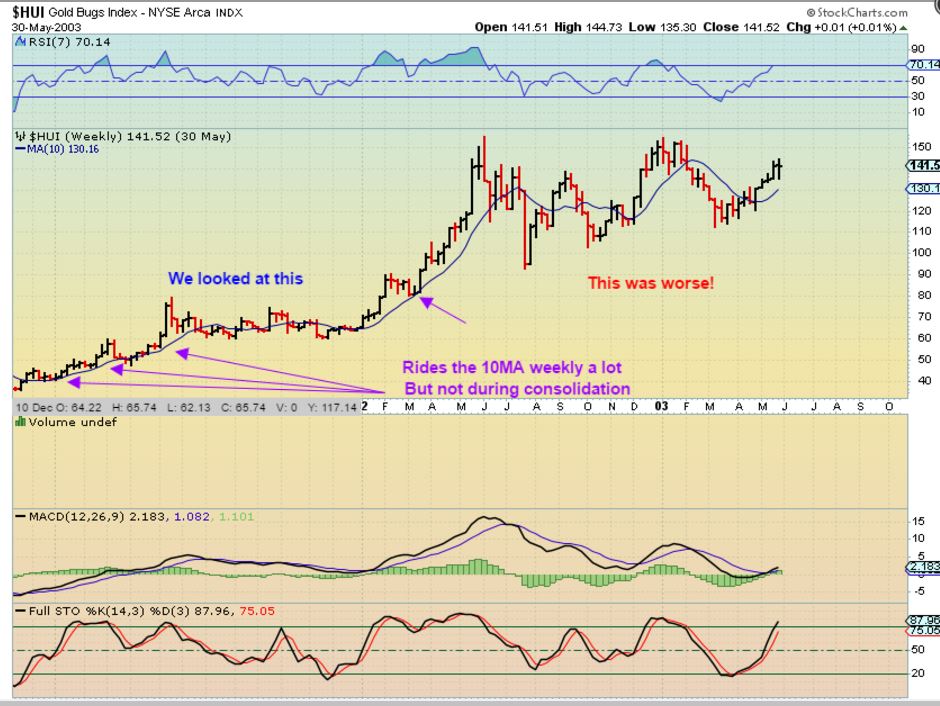
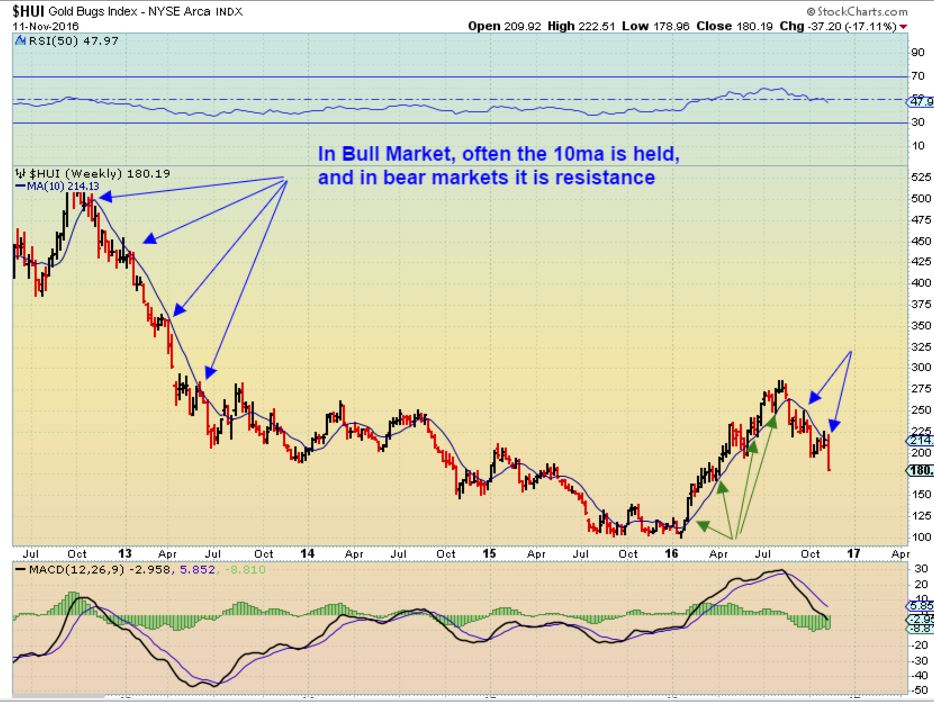
HUI – I was asked about the 10MA on a weekly, because I use the 10 MA for short term bull runs. The 10MA can be broken in the steeper sell off.
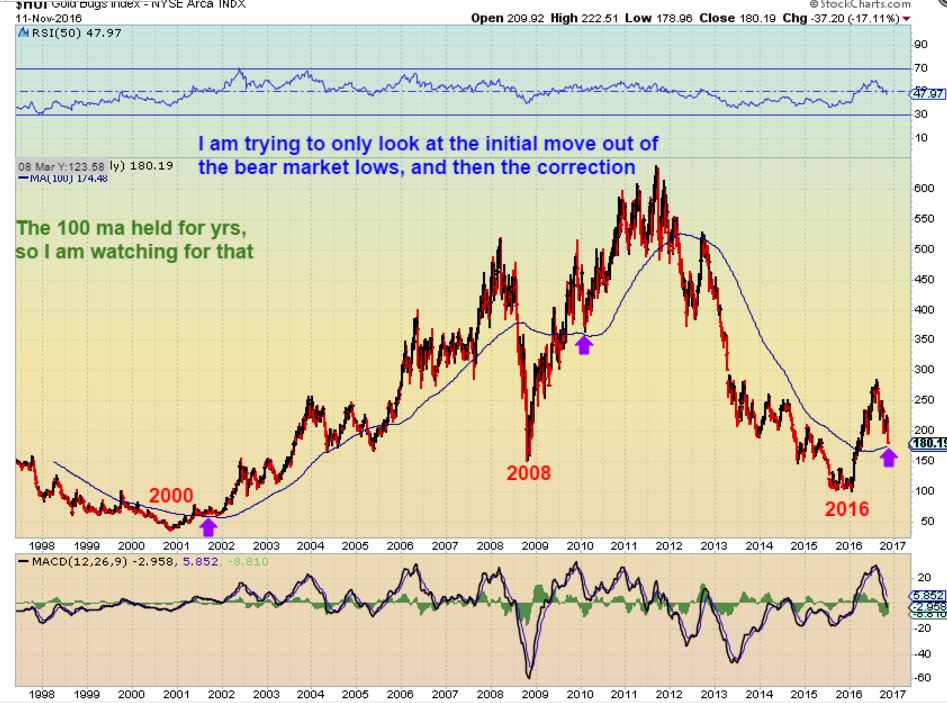
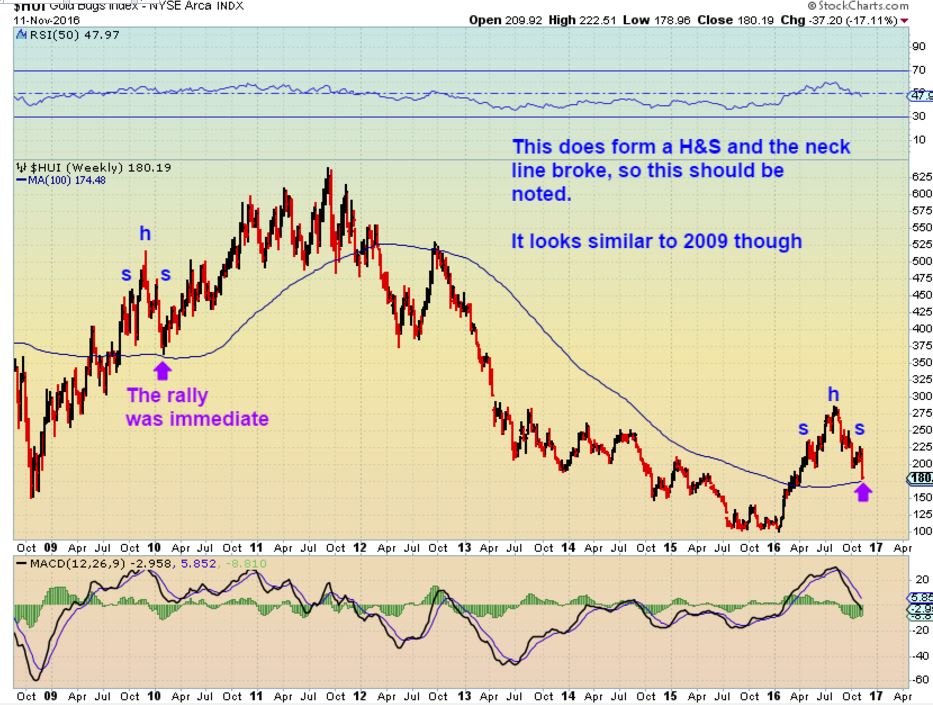
HUI – Here I am ONLY looking at the first part of the move out of bear market sell offs. In 2001 and 2010 the 100ma acted as support. HUI 174 is where the 100ma is now. Notice that that steep sell off in 2010 looks a lot like the one we have now.
HUI CLOSE UP- I see that H&S and it does concern me since the neck line broke last week. HUI back above 200 will negate it.
HUI – This bothered me. The 10MA is now acting like resistance at each daily cycle high. We broke above it after the Election results, and I was quite happy about that. Then the drop started.
.
Is this Sector ‘Finished’? It’s time to look at the reasons why we can still be bullish.
.
Miners are reporting earnings that are beating last year and showing signs of recovery. Are they all now crashing down?
.
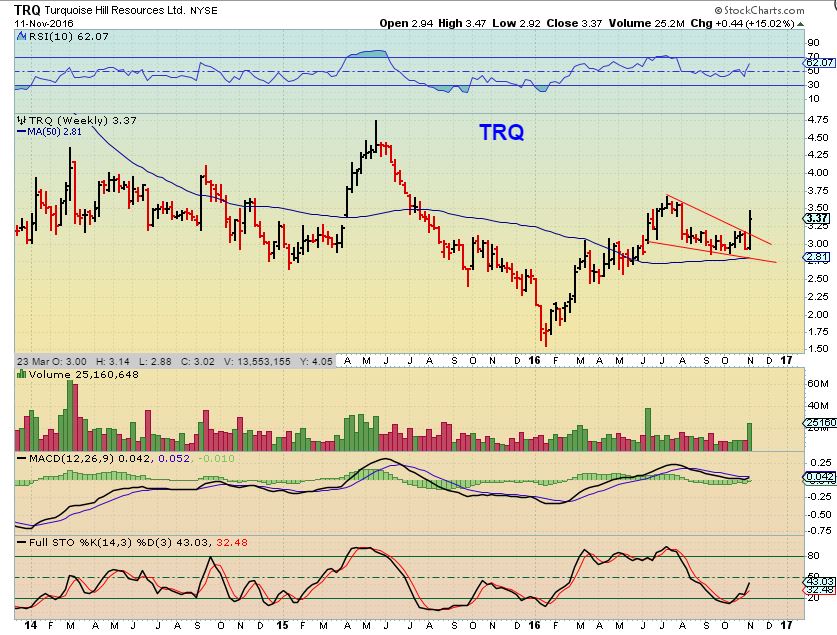
TRQ WKLY – This and a few other Miners does not seem to think the bull is done.
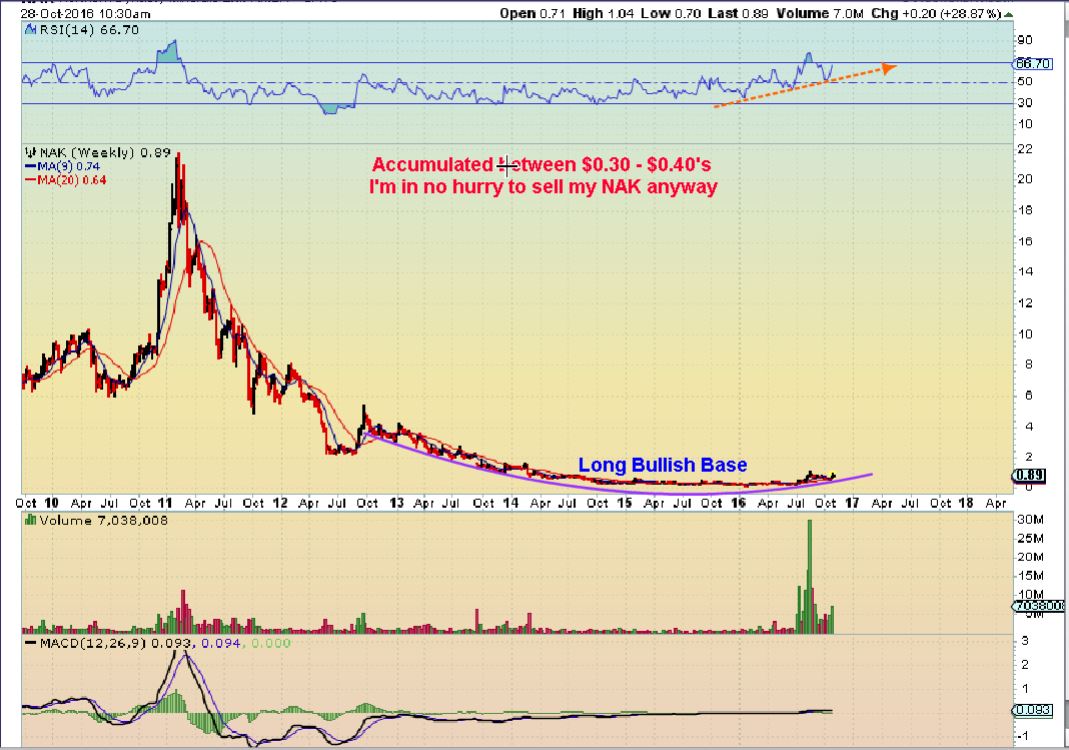
On OCT 18th, NAK hit the 62% retrace point ( like GDX is now). People hated owning NAK then ( like Miners now?).
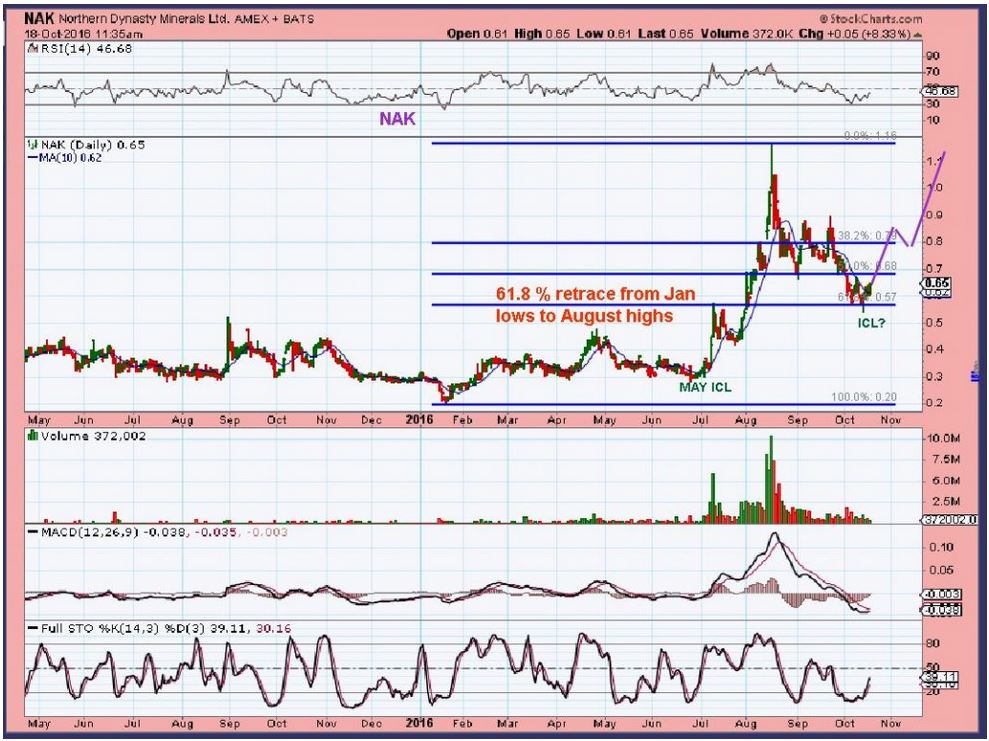
NAK – NAK turned higher off of that 62% drop and is still recovering.
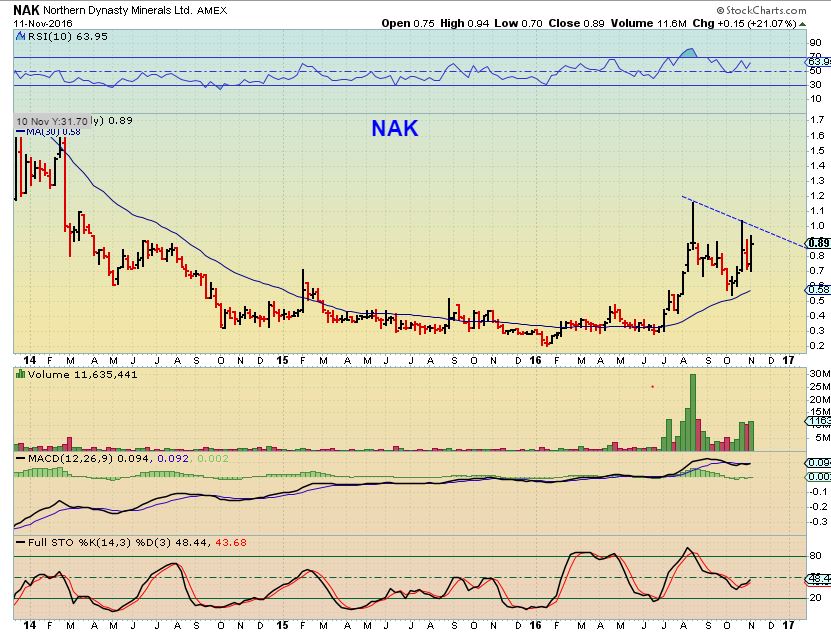
NAK – I drew this on Oct and I cannot say enough about the implications if this plays out.
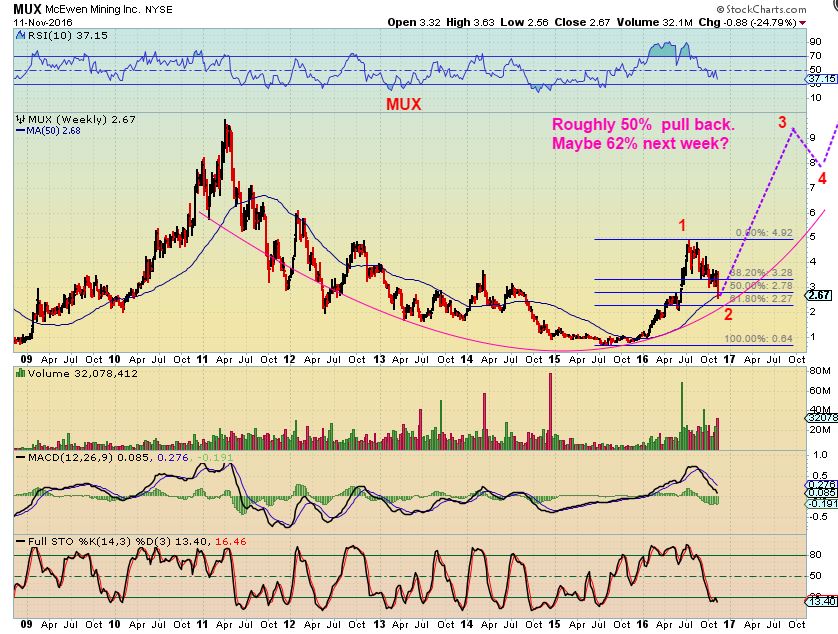
MUX – I broke a rule and did not allow myself to be stopped out of my MUX position above $3.00. I bought it in October, rode it higher to above $3.50, and yes, gave up more than just the gains. It is now at $2.67. It is often painful when I break my own rules. I am now in the RED. Why didn’t I sell? This chart is 1 reason. I will sell the bounce out of the next daily cycle low if it doesn’t act correctly, but I expect that it will go to almost $3.50 on a bounce (overhead Trend line).
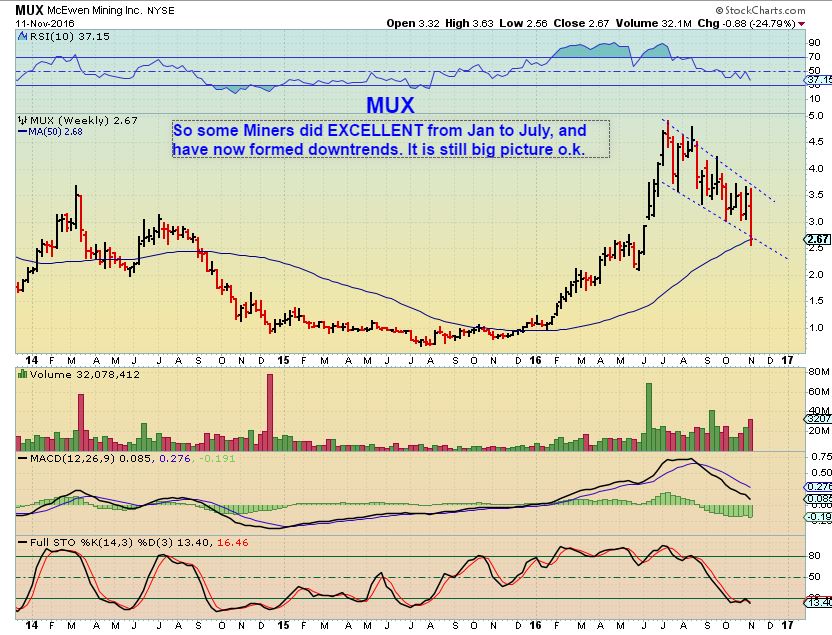
MUX – I also made a lot of money on the first run higher, so I felt that I have some “House Money” as a cushion. The 62% is $2.27, so not allowing my stop to take me out was probably human error – emotions – hope.
1. If this Bull remains in tact as shown, I will never remember that mistake.
2. If this bull dies, I will never forget it, and I will have to learn from it. 🙂
.
Some miners seem like they are breaking down in a big way though.
CAN THEY REMAIN IN A BULL MARKET WITH THIS SELL OFF?
.
When I was posting how strong Steel and Copper looked, look at what CLF did.
.
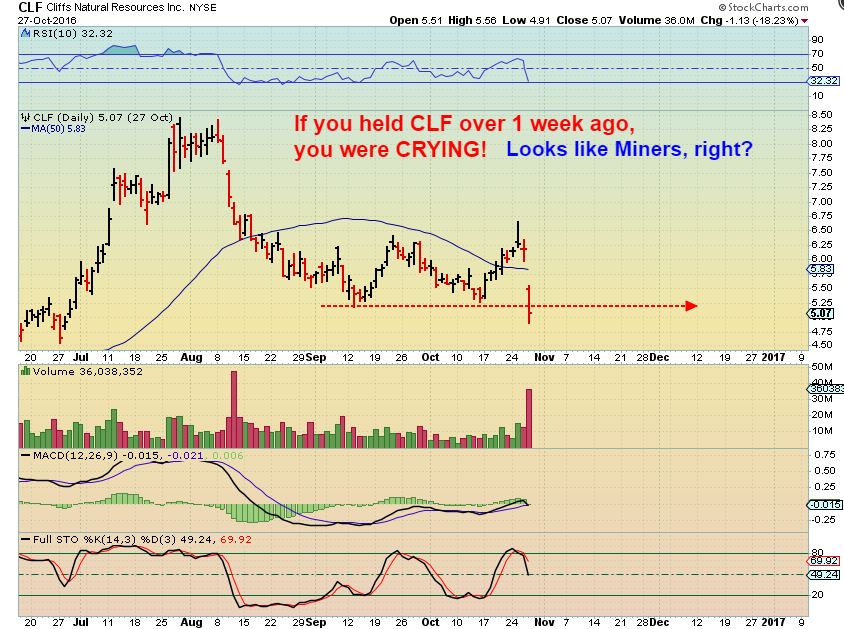
If you owned CLF just over 1 week ago ( like Miners today) You’d be crying. Look at that volume, it looks a bit like GDX now. Hopeless? Bear market? ” I’ll Never buy this piece of crap again?” I am reading that in the comments section for Miners. “I just want to get out and go away”. Maybe so, look at this horrible chart.
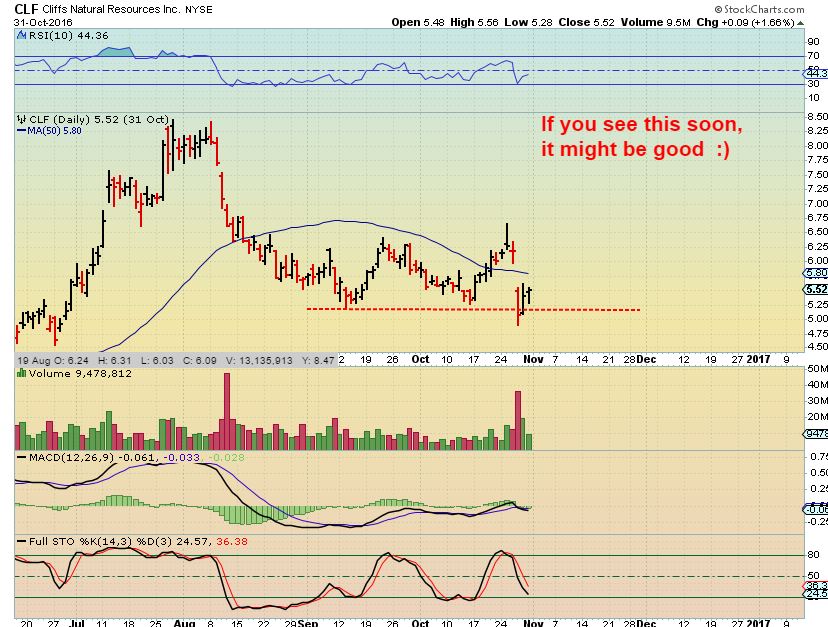
CLF – Will Miners sell off Monday a bit more, but start to recover the shake out lows? Was that a stop run in CLF, recovering a day or 2 later?
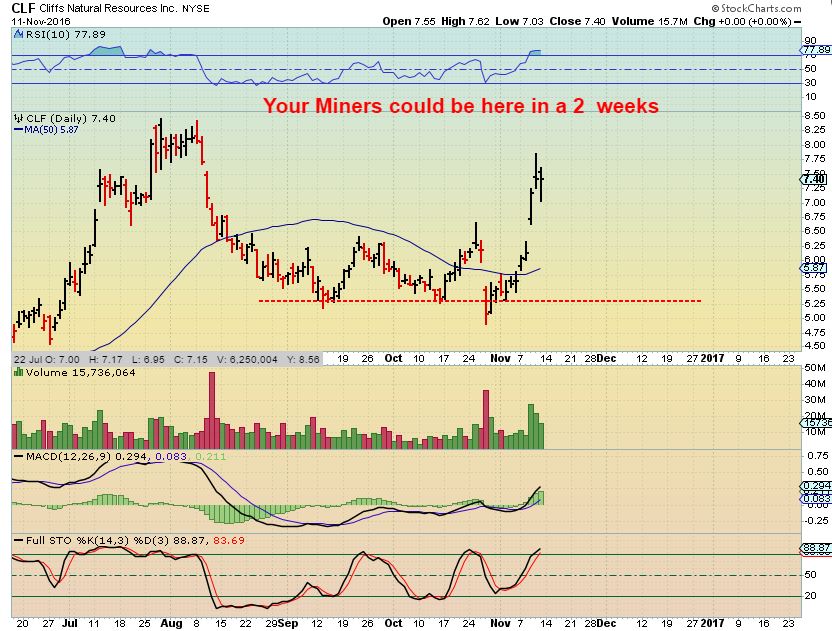
CLF – Is this possibly what our Miners are going to look like, going into the end of the year? Was that a stop run to panic bulls out as STEEL looked Bullish? Are we in a stop run now in Miners?
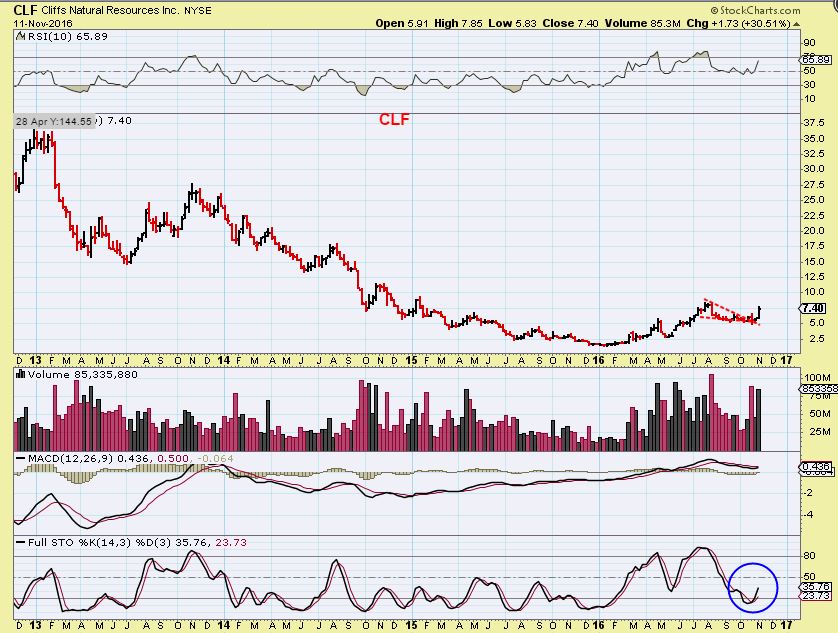
Calculating route: By the way, we made great money last spring on the run from $2 to $5, and CLF ran very strong this week. We may see a pullback on a daily basis, but CLF WKLY is still so bullish and oversold, even after that shake out. Do you see the potential?
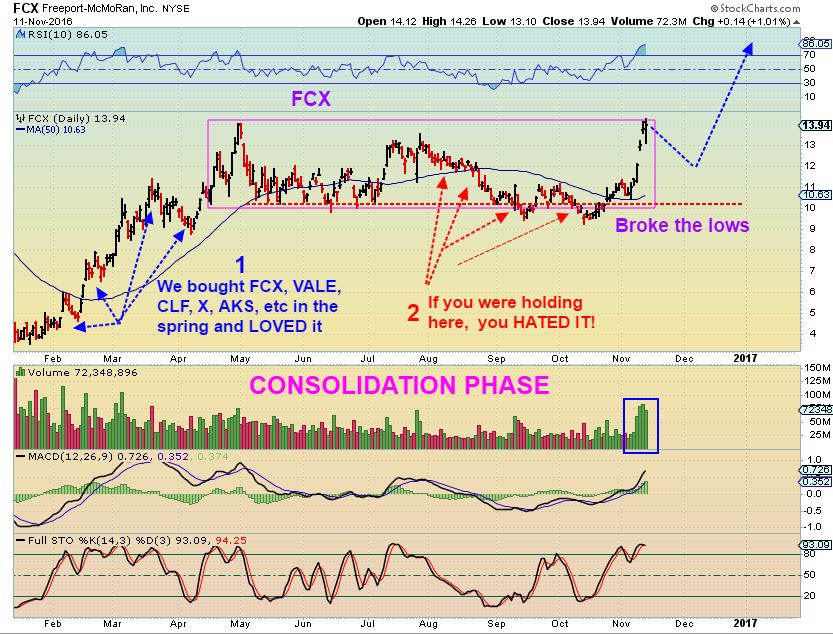
FCX – We made great $$ in the spring with FCX, but look at the sell off this August and October. 2 shake outs that broke the lows in Sept & Oct. “I hate this stuff, I’ll never buy it again!” Was that just a stop run / Shake out? And then came last week with Aluminum bullishness.
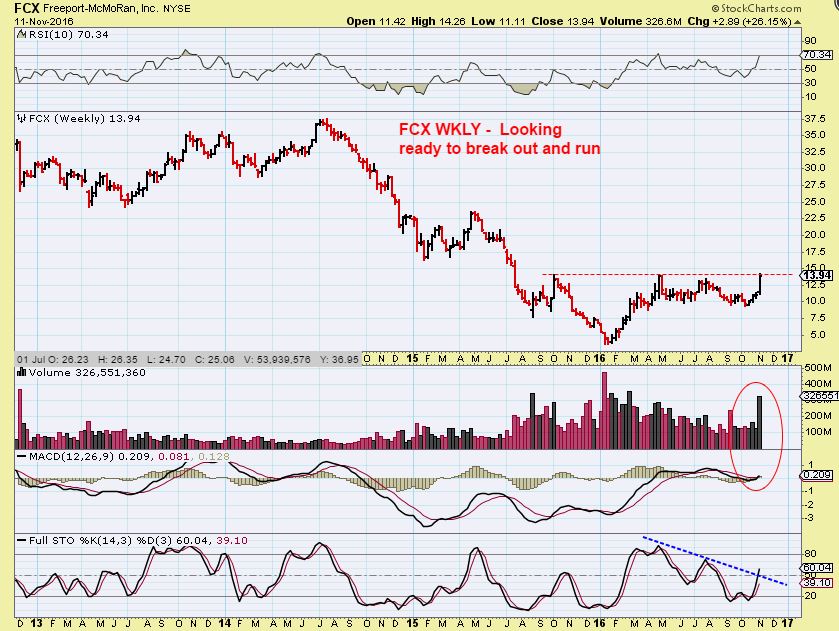
FCX WKLY – And yes, it is just about to break out with huge potential again.
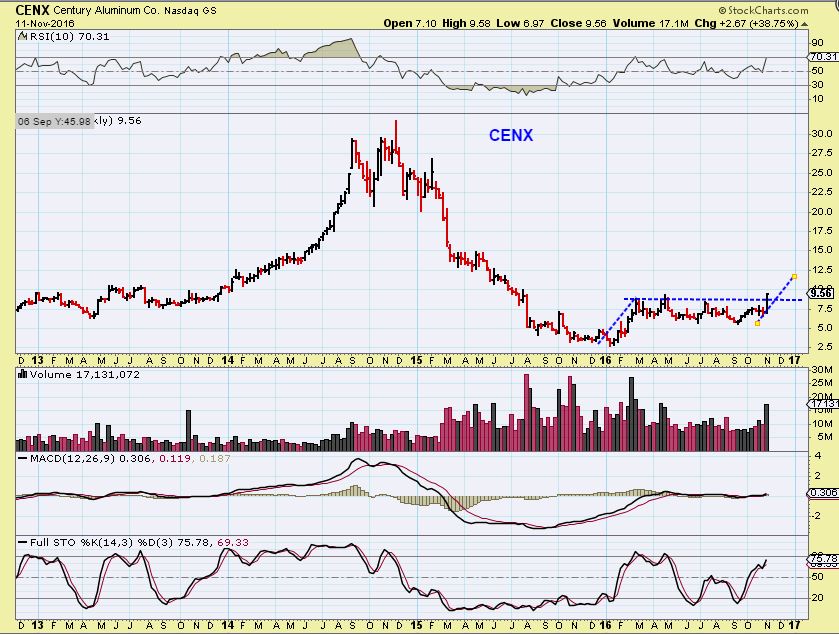
CENX – Ditto
.
So we have a bull run occurring in the Metals like STEEL , ALUMINUM, and COPPER now, or should I say Continuing after months of consolidation. Gold, silver and Miners have also been consolidating for months sideways and we need to discern whether or not anything has changed. Rising interest rates have been bullish for Gold in the past. Inflation is bullish for gold. Did electing Trump really change anything there? The Bond market is calling inflation and Gold usually does excellent under those conditions. Gold shot up $50 when it was announced that he was elected, and then sold off sharply into a what should become a DCL ( ICL). The drop was due in cycle timing, the degree of the drop is extreme. Did Big Money run the stops on those shorting gold by pushing it higher first, and then flip short to run the stops on the downside? My goodness, if they did, they are mopping up the profits left and right. We saw this action in the metals market and off they went higher last week. An ICL / DCL is due in precious metals and I want to be prepared to act correctly as things unfold, unemotionally. I agree that that is not always easy, but when you trip and fall down, you basically have 2 choices. 1. I can lay here and feel bad, or 2. I can get up and walk.
At this point, we have seen extreme moves Thursday and Friday and it does ‘appear’ that things have changed, but have they? I think that we may be witnessing a huge shift from weak hands to strong hands, a flush out before the Precious Metals sector begins the next launch higher after putting in a yearly cycle low. Look again at the chart of CLF and FCX. from ugly to beauty in no time. Lets see what the coming week brings ( I hate to say this, but we might see a bit more downside before a reversal). I’m holding on to a few non leveraged recent purchases and feel the pain of the selling too. I will have to decide whether to sell the bounce or add to positions as we move forward, but I lean strongly toward Gold, Silver, and Miners rallying out of these lows when they arrive.
For the past 2 years we have really nailed ICL’s and DCls alike. This one had so many hallmarks of an ICL , that I must admit that it fooled me a bit with the post election drop. It is not the end of making big profits by any means. ‘Recalculating route’ means that we will find the way. Scroll back up to the last 2 charts in this report. The weekly charts of FCX, X, AKS, CLF, etc are telling a strong bullish story that we can turn to to make money going forward too, but if nothing has really changed in Precious metals. I personally think that we are about to see a very strong rally in Gold, Silver, and Miners soon, just like we just had in CLF, X, AA, FCX, AKS, etc.
A ‘wave 3′ of 1-2-3-4-5 was shown here in September. Wave 2 would be ending soon. I remain bullish in this sector at this time for reasons shown in the many charts above. As usual, Time will reveal all’. Thanks for being here and enjoy the rest of your weekend.
.
~ALEX
.
A Wave 3 example again


Great letter, Alex. I especially liked your 22/66 wsmas on gold. I checked GLD. The weekly low on Friday was 116.23 and the 66wsma was 116.24 on my TC2000 chart. Maybe this is IT. This is for dreamers, but …
Gary
Remember when Gold shot up $50 overnight at Trumps win, and then sold off? I’d like to see it sell off overnight, and rally Monday. Then your GLD would hold too ; )
hi Alex,
not sure to get this part
A drop tot he red dotted line would ROT ( in my opinion)
Would be nice if you could tell me what you mean by that
I was wondering about that, too. Rule of thumb? Right on time? Hmm…
Sorry guys , that was me using slang. Like “Man, this really rots!” I didn’t want to say , This would really suck” , in case that was offensive to the readers.
A drop down there would look horrifying – I went back and changed what I wrote. Thanks for pointing it out. It wasn;’t clear.
Giggle
Alex TRQ is not primarily a gold miner. In Q3 they earned 77% from copper and the balance from a gold and silver. They also reported significant declining sales and a 77 Million dollar loss, so with copper ripping higher it might be another case of a turkey flying in a windstorm.
Recently yes – they were known as a copper/gold/silver producer and had good quantities of all in the past.
They were producing a lot more gold last year. About 100% more last quarter , I think.
Thanks for all your hard work & candid analysis…… dear freakOfTheCharts…:-D
Thanks and Ur welcome Maria 🙂
Kissy, kissy, kissy. 🙂
Smirk… UNoItSmartyPants
Alex, what is the figure for the 66MA? For some reason when I try finding the 66 it was already breached at something like 1290 so I must have something wrong…?
Yes, you may not have noticed that I am using the weekly charts in those charts 🙂
Ah ok, yeah I see now. So….fallen below that 66 weekly now….kind of back and forth around that number of 1217…….hm…..
It did in 2004 too, briefly
just a few longterm GOLD downtrend & uptrend support/resistance lines to contemplate.. https://uploads.disquscdn.com/images/9a273c6eb28dd3b67c23edf6ac6135b55ad919f0ee8b056cd55fa95798f5a590.jpg
I’ll be trying to sleep in in the morning if possible. It has been a LOOOOOOOOOOOOOOOOOONG weekend. I’m running on 4 hrs of sleep Friday and 4 more Saturday. Watching some football now, and off to bed.
Lets see what Monday can do for us. We may sell down in Gold and run the stops, but I want to see a strong reversal after that.
Yeah, took a lot of beer to try to forget about Friday. Gold and Silver set new current cycle lows right after the Asian session, pretty much on cue. Whether to keep holding or sell any bounce is key! Let us know when you do (’cause I’m sure stumped on that one right now – hopefully will come more obvious).
wow! 10y yield is on a tear for the last several days–feel bad for bond holders. Almost as bad as I do for us GC holders. Makes that Stan guy look really really smart for timing!
Great teaching us ALEX ???
Thanks a lot excellent done, it encouraged me.
B.T.W. did you got my email last Saturday Alex.
Oh…. I read meanwhile below, you have not much sleep this weekend. Sorry for that.
Hi Guert,
I got maybe 20 emails from readers, and still have about 6 or so to read. I just had to get away from my computer this weekend.
And by the way, so far , not one critical email, even though my call for Oct to be a low that shouldn’t be broken was wrong. Most readers just said complimentary things, no one can be right 100% of the time, called last week a crazy Trump over reaction and unpredictable, and I find that amazing – really good people are signed up here.
Tough business, but not a tough crowd.
For my part Alex, I am very grateful for your guidance [and actually for the input from others in this group of Chartfreaks]. I did a little math this week as my account is in the worst position since I started with you in Feb. It was a really bad week. Well, I added up what would be my position if I had sold everything, winners and losers, on Friday. Yes, a substantial loss …but…. then I factored in all the wins/losses already booked in actual sales…and I am still up decently. So thanks!
OK, Thanks Geurt
I did read your email just now and replied.
You wrote before my report was released, so you already know this now, but I do think we should get an exhaustion in selling this week and a reversal when the miners run out of sellers.
If the buyers scoop it all up, the rally out of the lows could be good ( Ass seen in the report using CLF as an example of a fast reversal ) .
Ass? now ur swearing at us?
*giggle
Just when I thought you only skimmed everything I write,
you became the TYPO QUEEN the past 3 days 🙂
https://uploads.disquscdn.com/images/e3d0425b405279c3c39daa1396230ff78a411daea63c1e46bda3fe2982f73756.gif
is anyone shopping here. or waitng for confirmation of a swing?
i feel like ive had a car crash.. and need to get back in the car or i’ll never drive again 🙂
I’m wanting to wait, but AU and PXG had good news and popped at the open, closing those gaps now.
Check out the news on AU. CASH FLOW SOARS to 161 million.
http://www.marketwatch.com/story/anglogold-ashanti-says-third-quarter-free-cash-flow-soars-to-161m-2016-11-14?siteid=bigcharts&dist=bigcharts
i cannot still believe AUMN..
ridiculously resilient considering its the widow-maker.
I know, I own AUMN & NAK and haven’t had a reason to sell either at all.
I own MUX and I can think of 3 reasons why I should have already been out…1 being that I removed my stop and added ‘Hope we get a bounce higher than where my stop was’. I NEVER do that anymore. – lol
I have MUX from a while back that I did the same thing…..kept hoping for bounce and held on…yeah, you don’t want to know how much down I am on that one….:( I’ve been tempted to sell everything I have this morning just so I can walk away from my computer today and forget about it for a day or 2…:)
certain ones are looking like theyre at lower channel support lines.. i’m loathe to sell at the lows
I know…I woke up this morning thinking “sell sell sell”…..then I thought….ok, I’ll be selling at the lows AGAIN….arghhhhhh……….trying to hold on but my fingers are starting to slip on the edge of the rock…
This is an odd thing to say, but maybe think in these terms too.
If you sell anything, you can only write that loss off on your taxes if you dont buy it back for 30 days.
So if I was going to sell my MUX at a loss, and then we get a reversal this week that looks real and final, I would try to buy something else for the first daily cycle ( Like VGZ instead of buying MUX back).
I’m not sure if that makes sense to you, and sometimes what you buy may not do as well as the one you sold, but you can only write off your losses on a stock that you dont re-buy for a month.
Is it correct to say that it doesn’t matter if it’s in a retirement account?
Yes, I think you dont pay taxes on gains right? If not, you cant write losses against gains anyway- that would be correct.
Wash sale wouldn’t apply on ira
Ouch on MUX….but hang on Tammie….it has to reverse sometime and it sure looks like blood is running in the metal street!
GDX still has capitulation type volume .
over 12 million in less than a 1/2 hr.
Well HUI got into the 170-175 area which I would think would be a strong buy zone. We’ll see.
I looked at my old charts this weekend and I had 2 for HUI with a target there.
One was simply based on prior % sell offs of a pull run, and it took me from the summer highs to $174
GDX gap filled @ 20.23
NICE CATCH and it looks like a support zone too – GDXJ filled last week.
That’s another concern to check off of the list, we just need a reversal and we lower parameters for a swing low to be in place tomorrow.
MUX has closed a gap at 2.52
How about a bullish engulfing on GDX- that would make our day : )
It surely would – especially with capitulation type volume, because it could indicate all sellers dumped, and shares were all scooped up.
Alex, how close do you think oil might be to putting in the lows? I see several oil stocks going green/trying to go green so just wondering where we might stand on that….
It could be close daily cycle timing wise, since we are nearing day 40 but there is no swing low in place. We had a new low today.
If you go to my report chart above, Oil broke the September dcl today. This failure is what I expected when it broke the intermediate trend line 2 weeks ago.. This is a failure in Oil that I have been calling for when people wanted to buy 2 or 3 weeks ago.
So at this point, I believe it will bounce after putting in a daily cycle low , but it may just back test that trend line and then could continue even lower at this point. Oil has a sign of a break down until you see signs of a recovery.
Some Oil stocks do look promising ( OAS, CWEI, AREX, etc holding up well), they may just be consolidating as Oil drops and finds a bottom.
ALEX,
it looks like GDX has been priced 10 cents away from the 61.8% retrace from its 2016 advance. It seems a good point to start nibbling.
It is not the safest way to re-enter, but AS A TRADER, if you had a stop right under todays candle , it would be a valid buy point based on the 61.8% target. There is a good area of support to the left from this spring.
I have to add the disclaimer:
I repeat for other readers,Not my recommendation for all, and NOT THE SAFEST WAY TO ENTER, but it is an attempt to grab a possible low.
Alex,
agreed not the safest place to enter and will reevaluate in the afternoon. Hopefully this is it, 3 full days of selling producing some great prices, I think, and considering I was about 10% invested, it seems good to deploy funds.
https://uploads.disquscdn.com/images/4099a6efe3e23636ffa42dfa17ef4c304d52c990c9ec8ba87dc5d974cb6705fb.jpg Wow, banks kicking butt. KRE, GHL, BAC. CWEI still continuing to look good.
I’m still in two PM positions (AG and AUMN; stopped out of GORO, GDX, and TRX). I remember watching G.I Joe cartoons when I was a kid and I’ll never forget the lessons learned!
Some banks are breaking out of a 3 year consolidation.
nice set ups – seems they were waiting for the interest rate hikes so they can start making even more $$
Look at 5 yr weekly charts of my old banking stock list
OKSB, RF, HBAN, JPM, BACC, KEY, CFNL
Alex, are you going to be playing banks? If so, I will add these to my watch list.
Only on pull backs, but I won;t play them if we get the kind of Move in Miners that I think we will. I would be trading Miners a lot more. Even CLF, AKS, X, etc may be the better %-Gainers, but the banks stocks have blasted off out of their bases, thats for sure.
Thanks, I will wait until you decide if any are worth playing.
Ok, I’d be waiting for a pullback, and some may back test the recent break out, some may not. You may want to remind me later if you’re looking at them and it seems I am not discussing them, then I will take a look again too.
OK, I will add the ones you mentioned and set alerts to let you know.
AG up 7 cents…!
GDXJ/JNUG possibly in a final wave 5.v descending wedge (30min chart)
AU, VGZ, AG, IAG green and several of my golds have minor turn ups on the 30 min.
HUI almost positive (gasp)
BCEI is giving me a nod & a wink.. for a watch just below d/t line
is this one thats dead to anyone?
It should have winked at you 4 days ago. 🙂
now that would have been mega-prescient! 🙂
AG set up looks really good. Bouncing off the bottom and Silver selling off bog, it is moving higher off of the lows.
This would be an easy one to buy & use a stop, BUT…will it finally take off and keep going? It does look good.
AU looks very good too
AUY, IAG, KLDX, VGZ, SBGL, AG, PZG now all green ( And a few more)
Most of my golds are on hourly buys. Bot AG for the second time today. JNUG almost gave a hourly buy, but just turned down. Maybe they are fooling me.
The AG was because I sold just a FEW minutes ago when it was up 8 cents…decided to get out….so I knew it would turn soon after that! 🙂
The market is a bit of the devil at times (as we all know recently).
Indeed! At least I didn’t sell anything else this morning….just jumped out of that one….now of course it looks very stupid.
JNUG green and on hourly buy..
Are my eyes deceiving me again?
Your posts remained confident last week 🙂
Logically I was confident but didn’t expect the reaction to the election so was still worried to some extent. I did buy JNUG, AGQ, BTG and more GSS this morning.
Me too, as far as the election thing – it didnt seem logical, but often that is how shake outs happen.
With our cycle timing, I think we are at lows or just going to bounce around down here and then go higher, but that wash out waterfall type move in Miners seems to be running its course.
With Silver don pretty big, many silver miners started turning green, so shorts may be covering or bargain hunters may be accumulating.
The gold/silver stocks were just pretty resilient when gold just took a little dive. Will be interested to see how the day closes. Might have our answer by then. I wouldn’t be surprised to see a nice short covering rally for a week or two, then another trip down to test the lows, scare more out of their positions. Then the big run. That’s what I’m feeling without looking at charts 🙂
I want to see a move like CLF did.
Break the lows ( did that) and turn higher ( this week?) , break out and never look back ( As long as we are in) . 🙂
MUX hourly buy and green.
OH WHAT A RELIEF IT IS
( Relief rally, sellers exhausted, capitulation lows possibly in).
oh i thot u meant .. plop … plop .. fizz fizz ……
LOOK AT BTG, GORO, IAG using a 200sma. pretty cool.
IAG, BTG didnt even break OCT lows.
Very cool. Nice catch.
NAK green.
DRYS up 47%. Wish I owned it. 🙁 Other shippers are mainly blah.
Alex ..is this a big buy, or safety first??
My reports will always recommend safety first, wait for a swing low first and so on, but TRADERS do have other methods
They buy reversal candles with stops below the days lows
Some buy reversals and stop out at 1/2 of the candle, etc
Good advice, thanks.
My current account is down 13% overall due to the recent crash, but just turned green for the day. Yahoo.
So you are recommending Yahoo here as a buy?
(Kidding)
Are they a miner? NO. 🙂
Dayumm… you lucky.. mines down 20%.
in repair mode now.. buying $1000 amounts until im outta the hole
I have stopped buying this AM and am now looking for places to put stops. The sharks are out to get us so I need to protect myself more than ever.
You see the chart of HMY?
The pain hurt for Thursday and Friday, but it looks like it can be undone in 2 days also.
This really looks like a shake out and a buying rally discussed in my weekend report, but need to wait for confirmations to confirm.
Hey, this one stopped on your 66 wsma. That’s cool.
AG up 5+% on an hourly and close to a daily buy for me.
GORO has an hourly buy and looks like it just finished a daily abc correction AT THE DAILY 200 ma. VERY COOL.
Alex, you got to love this one.
I added to JNUG position, stop below today’s lod; similar to what CF mentioned today re: stops. Feeling somewhat relieved here!
I love giraffes…especially their necks!
JNUG up 12%, can we make it to 20%? Hope so. DRYS up 60%!!!
Once I know this rally is for real…I’ll be buying more….
Alex, the pressure is on. Be sure to let us know when the all clear sign flashes.
Several metal stocks up 7+%, several MJ stocks up 13+%.
DJ-20 up 175! Wow. That’s 2%.
Looks like a 30 min pull back is upon us. Let’s hope this is not it. It seems to me that about this time daily there is a metal’s rest. Has anyone else noticed this?
Not out of the woods quite yet.
hmmm … just got stopped out of JNUG @7.38 (but was very tight)
I bought some at 6.20 this morning so my stop is there.
thats cool when you know how to do that 🙂
Nice price.
I am still green for the day, but not as much so. I put an alert in for a break below the low two hours ago. First time I am trying this. However, I don’t want to suffer anymore than necessary.
Does anyone know anything about when some of the leveraged funds were going to be doing some recalibarating or some such? If so when and does that include NUGT and JNUG?
Direxion splits were done on 25th Aug. Detail here – http://www.direxioninvestments.com/press-release/direxion-announces-reverse-and-forward-share-splits-of-nine-leveraged-etfs
AUMN
yep… i bought back in a couple of hours back… for about the umpteenth time this month, at around 0.69.
i must be keeping them in business 🙂
I’m keeping my brokerage in business I think…..:)
I bought, but not earlier like you, because I was waiting to see if Alex still loved it. 🙂
OUCH. It just dropped 4 cents. Now I don’t love it.
Here is what I do love.
During that whole steep sell off, they couldn’t even close that gap.
Today it drifts down and closes the gap, and then shot up 5 cents
The OCT lows were at 60 cents and it’s still well above that
It is holding the 200sma, and the 50 sma is right above ready to be taken out too.
It wasn’t affected by the sell off and they already released earnings, so there isn’t anything not to like yet.
Thanks.
I haven’t bought AUMN yet….did get some JNUG but not as early as I should have….
My 30 min indicators suggests that the short term pullback is over for now.
Alex- With gold not playing along here, are you worried this might be a dead cat bounce?
Ann, thanks for bringing this up. Silver is really in a funk. I need to watch my positions more closely. Still up for the day, but …
I’d like to hold, but I was away from my computer on Friday and took a beating that I don’t want to go back to. Added this am, so could take the one day move and at least salve my wounds : )
I bought some AGQ today with a $2 loss stop. We’ll see.
Anything can happen, but I look at it this way….
In the past, many times I have seen the Miners lead the way, they have resisted the selling on the final days as smart money starts buying or shorts cover, etc. , and it was a sign of strength.
Also we use the GDX: $GOLD or GDX:GLD as a buy signal at times, and that only crosses when Miners lead the way.
This late in the cycle helps too. If it was day 15, I would think that it could be a dead cat bounce with another week or two down. This late, we could bounce & drop and dance around, but I am thinking that most of the sellers have left their shares on the table.
Ok thanks
I just checked GDX:GLD. Bullish hourly, not daily yet. Same for most of my stocks vs. GLD.
Take a look at DRYS. And I didn’t want to buy it early this morning….geez
SHIP, TOPS, and GLBS are decent too. But DRYS is CRAZY.
I was hoping for a rally into the close. I don’t see it yet.
got a late MUX surge,, finished +7%
I picked some up early in the day. Loved the finish.
Looks like we’ll close today with silver, gold, GDXJ & XAU above the May low
and GDX & HUI below the May low
HL was the only miner on my list that held the 50 dma, except for a brief trip below it today. For some reason it is lagging the others today. It has increasing sales and EPS and is only 22% down from it’s all time high set last week. I might be a little early /optimistic because the metal is still so weak against the strong dollar, but bought a 1/4 position to start.
I bought some today too. I was watching it struggle around 5.91 (on a 5 min chart) near the end of the day waiting for it to break, then for me to sell. It held. That’s good I think. There is a doji daily candle today. That should be positive since it likes to a change trend. Fingers crossed.
A long-legged doji to boot and on pretty good volume and good fundamentals.
I like it. Glad I didn’t stop myself out at 5.91. Hope the technicals nailed this one.
HL does not have a big overhead supply that will torture it for too long – unlike some stocks like AG that had almost a 60% drop in the past 3 months, the trapped buyers are going to keep the pressure on to “just get out even”
Excellent point. I hadn’t thought about that with regard to AG even though I have some.
I keep messing around with the question about whether I should always have a hard stop in place or not. Last week taught me a final lesson in this question and I will never, ever buy another stock without having a stop in place, and keep moving it up until it’s sold.
I checked all of the gold and silver stocks on my watch list. First, GLD has a perfect doji. Also, many of the stocks have ‘fat’ dojis (I hope they count as dojis). That could be good news – indecision and a turn?. Notice the posts started by R Byram two down from here.
The overriding issue is the USD is strong and inverse to a weak gold price and there is no sign of a trend change at the moment, so no wonder we are seeing doji’s – no one can tell which way this is going to go. But one thing for sure is a lot of weak hands have been flushed out of the market.
RGLD closed with a morning star on almost 2X volume. This is a profitable streaming and royalty company with strong increasing sales and eps. It dropped below the 200 today which is not good, but roared back and could easily regain the 150 and 50, and like HL it is near an all-time high and does not have too huge of an overhead to bugger it up.
Excellent observation. I got a short term buy on it at earlier today, but I was too scared to buy it. Now I have an hourly buy and need to buy some on a short term pullback (assuming we rally tomorrow).
MUX had a nice strong close = that’s one I made a mistake on last week with no stop so maybe there is hope
Just 17 more days like this and I’ll be back to green!!
I need one more day . Oct lows.
Well you guys know me. I only like to buy at the highs!!
I did add Friday so hopefully that tranche is going to work out!!
I actuually lost track , are we talking about Miners to break even, or just MUX.
I thought you meant MUX, I’ll be even near OCT lows. My Account will need some Jnug : )
U r gonna burn out man….take a break..
“It’s better to XXXX XXX-
Than Fade awaaaaaaaaaaaaaaaaaaay!!!!!!!!!”
Lol… My my..hey heyy
https://uploads.disquscdn.com/images/6c1fa7b8680cf5fd0e69d1d326931339600fc30e892ce4425e86f01d42dc76b6.jpg Was headed bed and saw your exchange..,, saw Neil Young at Farm Aid in September. The man rocked like he was still 30!
“Keep me searching for a heart of gold …. “
Yeah, I need several days too……..:)
HELP! I just scanned an unexpected report of THM from today…https://biz.yahoo.com/e/161114/thm10-q.html Can someone help decipher this? It seemed the finances are in bad shape?
well, several things stick out to me: cash is down from 6.5M+ on 12-31-15 to 1.7M+ on 9-3016. working capital deficit has more than doubled (6M+ to 13M+)….perhaps the biggest one is this statement: “The Company has no revenue generating operations from which it can internally generate funds. To date, the Company’s ongoing operations have been
predominantly financed through sale of its equity securities by way of private
placements and the subsequent exercise of share purchase and broker warrants and
options issued in connection with such private placements.” and also a BIG bill coming due in jan of 2017: “the amount payable on January 12, 2017 of $14,800,000 represents the fair
value of the Company’s derivative liability as at September 30, 2016”
Thanks…I am not so used to explorers as opposed to miners….they have this promising project but what caught my eye was about the pre feasibility study where they tell us NOT to use the data from 2013 anymore because 2016 was different….and something about “throughput ” that looked to be half of the older study! And… I think…. they were saying it wasn’t viable at the 2016 rate. But I am not sure. When the 2016 report came out …it looked so good! Thanks for your answer. I don’t really understand about the “derivatives”.
I am taking a chance on SALT…. have a stop … but the volume and the 1 year chart are compelling!
I was studying this one last night…..wish I had jumped in today…up 11% and now up almost 5% after market close…going to be looking over more shippers this evening!
Just a little bit of SALT…:)
a ‘pinch’ of salt
I’ve been watching these ( And the Marijuana stocks) they are crazy moves for sure.
Shippers partly because of there reverse splits. Drys did a 1:15 & 1:4 Split this year, but wow, up over 200% today alone.
It is tricky jumping in, because I’ve seen these moves before in Solar stocks, marijuana stocks and shippers in the past. HUGE up and HUGE down at times.
Look at EGLE – I wanted that one last week. Another beauty.
NM SB GNK SINO etc – And some of these are still near their bases ( not over extended yet)
Then you look on the weekly charts and they look great. Tough call.
Yeah … add uranium to that list. I am overdue for eye twitching….. if it drops below $5 I am out. If it can stay above $5 I think it has a good chance of going higher.
on a 1 year weekly chart, SALT does look like it’s just getting going ( compared to DRYS and others).
Yes, Uraniums have that kind of history too
and Sino…up 22% today and now 13% after hours….geez…..maybe I’ve missed the train on these….already left the station…SINO had good report today, just noticed….so that’s part of why the big jump….
Watch the 10 hma as it trails the price up on the hourly chart. I trailing stop of a close below the ma could be a winner.
Alex, what do you think of the chart of GLDD? It is in the construction/engineering group….had a good report recently…I was checking it out a few days ago when all the talk of rebuilding infrastructure started up….
It looks good, but it is no longer a low risk buy.
It could pull back from here before heading higher, It could bull flag and continue higher, or it could go straight to former highs. There is no way of telling.
Ok, that’s kind of what I was thinking….like TMST also…..was watching it but didn’t get it…rocketed up today also….
NMM had a good report….and though it went up today I think the long term chart looks very promising…but the past few days it’s gone from $1.20 to $1.50….another that I watched but didn’t jump on….can you tell I’m having a hard time pulling the trigger? HA! Several of these would have been great if I’d pulled trigger this morning when I thought about doing so…..
You’re not a long – I’ve watched several Shippers and didnt pull the trigger an now they are up WAY higher than when I looked. EGLE was one that I could have grabbed the lows and passed . 🙁 I was going to use it to hedge miners last week
That would have been a great hedge!! 🙂
Suprised a bit by the Doji candle we left today. I saw everything down across the board early but still felt good about it. Came back later to see we had moved up nicely! I kinda expected shorts to cover to protect their pretty awesome profits the last few days, but guess that a bull/bear fight really isn’t that unexpected. Really looking forward to tomorrow’s report and action. But I need more confirmation before I add. Raised some cash end of last week, so formulating a plan now if we can fianlly break to the upside!
Preview – It looks pretty good here , but of course, there “Could” be a bit more drop. Cycle timing is on our side now.
One thing in the report ( I’m working on it now), SOME MINERS DID NOT BREAK OCT lows. Thats kind of important when I hear some other people on twitter, etc saying the bull is dead, and heading for a bear mkt.
Some charts are pretty noce looking ( AUMN, IAG, etc ).
New report is posted