
Oct 31 – A Closer Look
We had a huge weekend report, and so what possibly could be said only 1 day later? Well, I have 14 charts in this report to help us to take a closer look at things, because this is a Fed Week. To the charts…
.
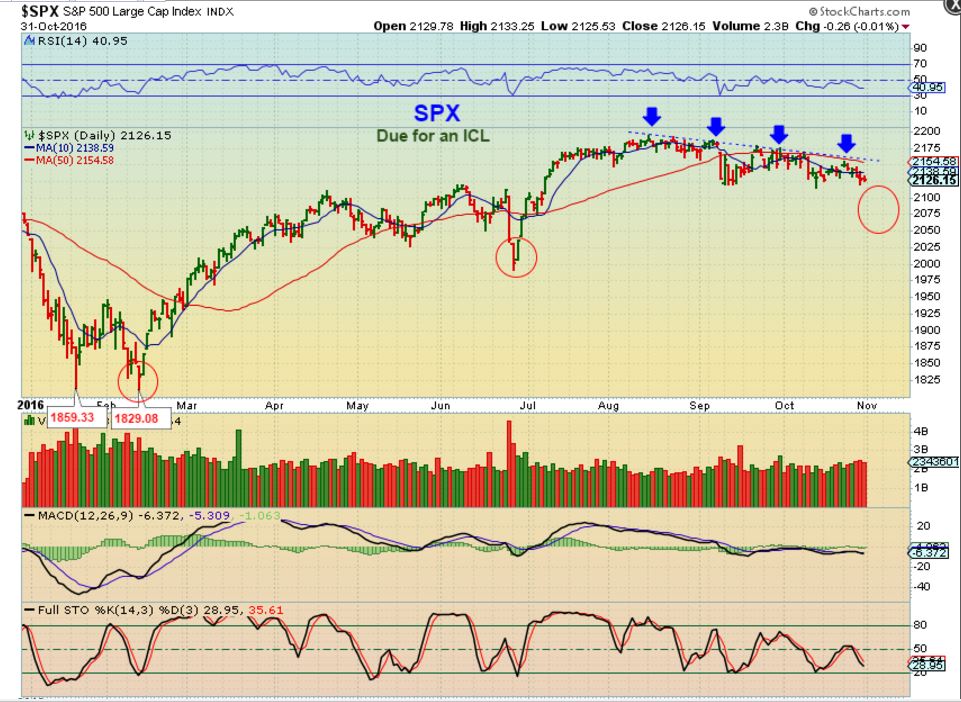
SPX – I want to say that there is no change from my expectations over the past several weeks. We didn’t go long or short, because these sideways markets can just waste time and chop up funds. We are due for a dcl ( possible ICL) , so I do expect a bit more of a drop to a new low, not a move higher yet. We have Fed Wednesday ahead.
.
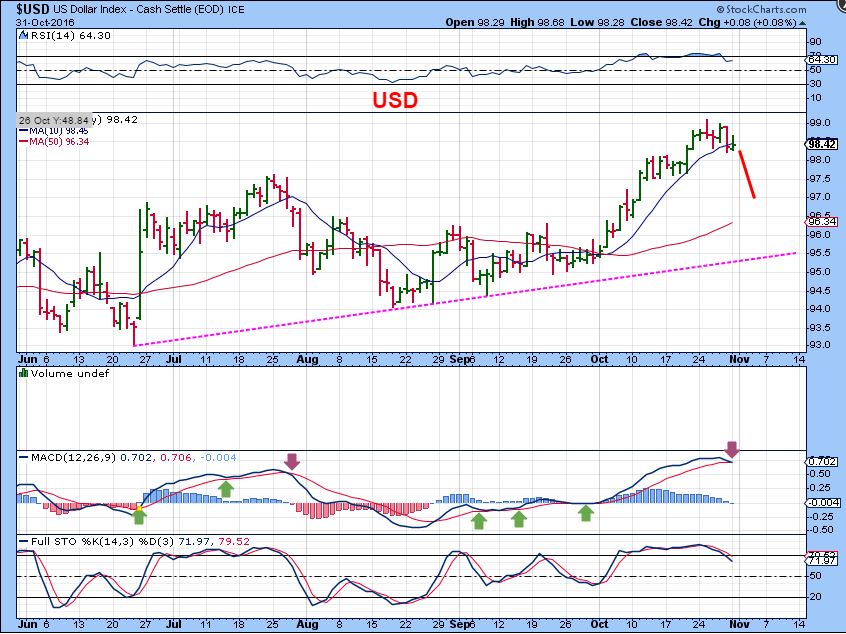
USD – I’ve been expecting a dcl in the USD. Since this daily cycle is so extended in length, I cannot say how much time is left for it to drop. It is right translated and due for a low.
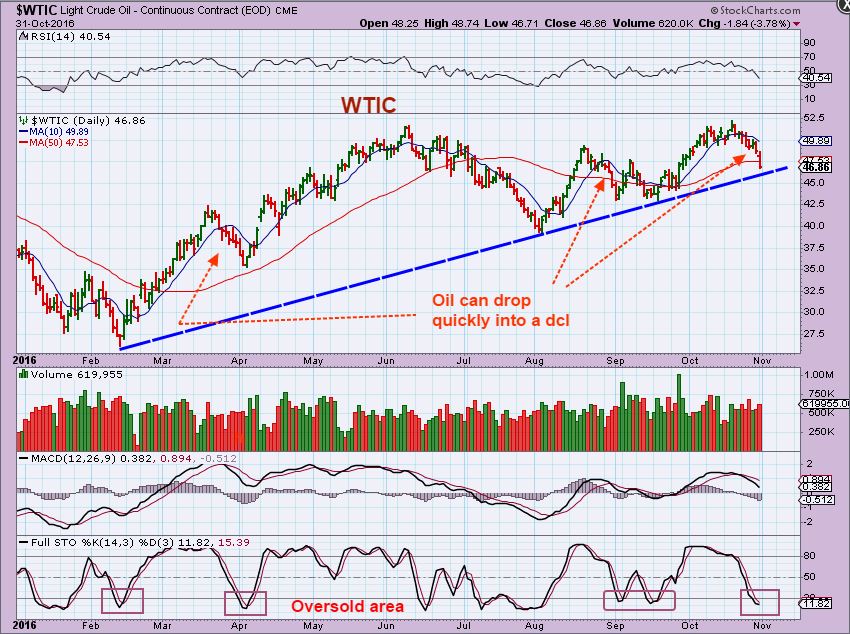
WTIC – Oil is dipping down and is in the timing for dcl. It often drops quickly into a dcl, but the timing is a tad early. In September we got a dip, a bounce , and a dip. We could repeat that here if that support line holds. I haven’t owned Energy stocks for weeks, I am focused on Miners and a possible ICL in that sector.
.
GOLD , SILVER, and MINERS
.
GOLD – $1285.40 was the high on Friday. I’d like to see that high taken out this week to ensure a R.T. daily cycle.
.
GLD – Riding the 10sma, I like the increase of volume as it moves above this flat base. With the Fed Wed ahead of us, we could tag the 50sma and drop into a dcl, or we could just surge and run through it, and drop into a dcl in a week or so.
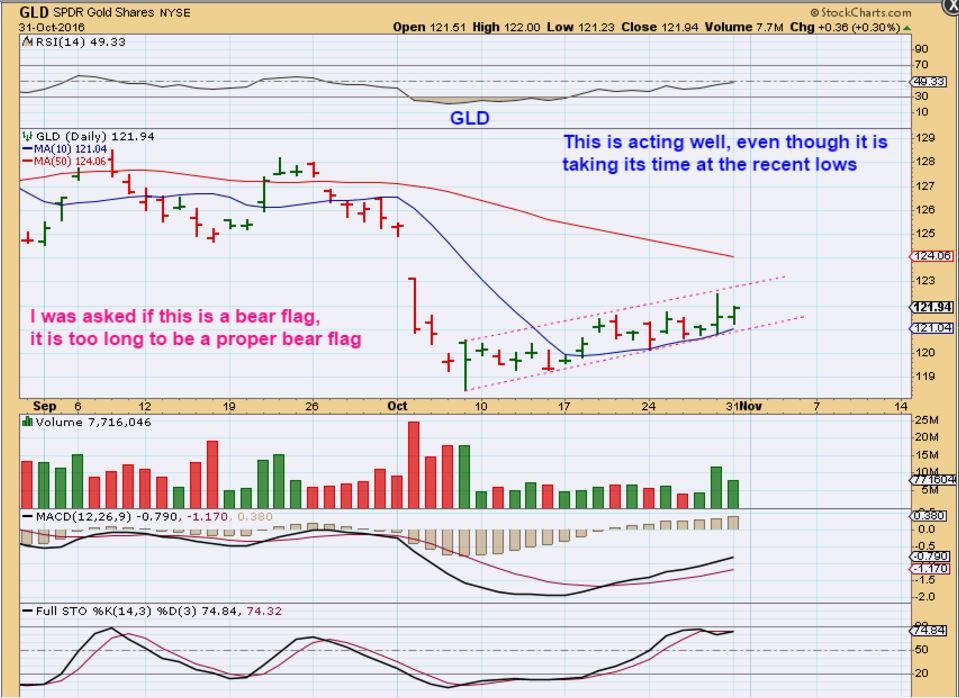
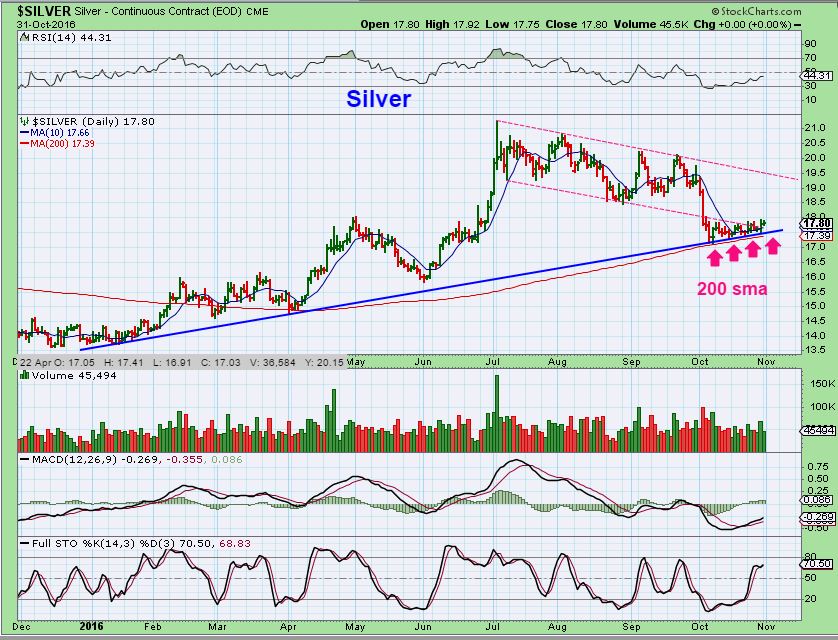
SILVER CHART #1– Riding along the 200sma and holding a long term trend line rather well. Is this a bear flag? A week ago it may have looked like one, but this is also becoming too long and the volume and MACD do not look weak.
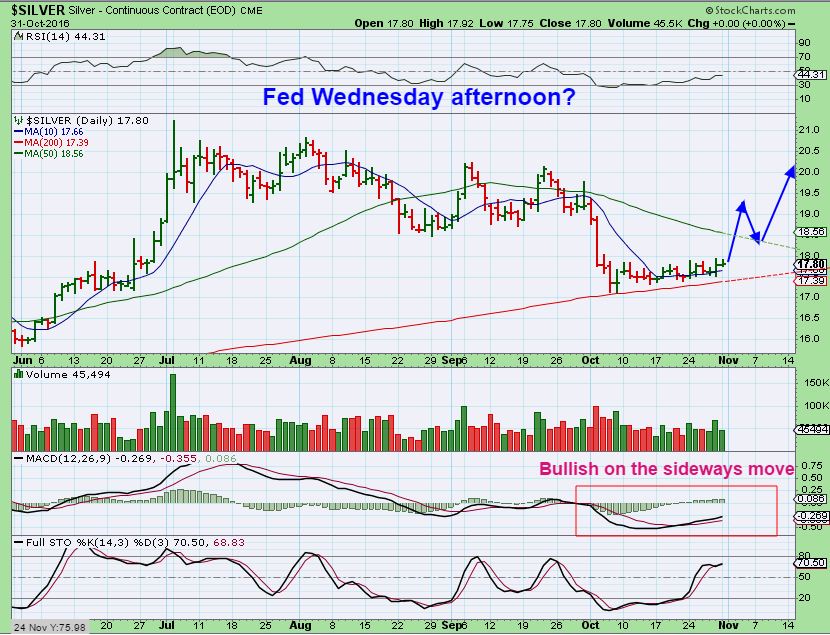
SILVER CHART #2– A bullish resolve after the Fed Meeting could look like this. When Silver explodes higher, we’ve all seen how it moves. This would be a bit more likely than the next view.
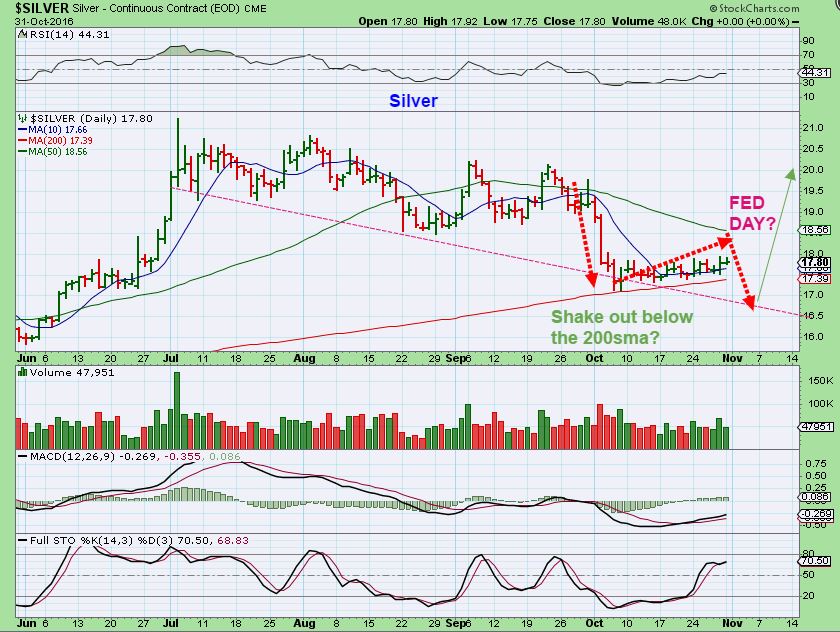
SILVER CHART #3 – A short term negative would be a shake out after the Fed, below the 200sma & that uptrend line in the above chart, but holding the down trend line. ( Less likely to me).
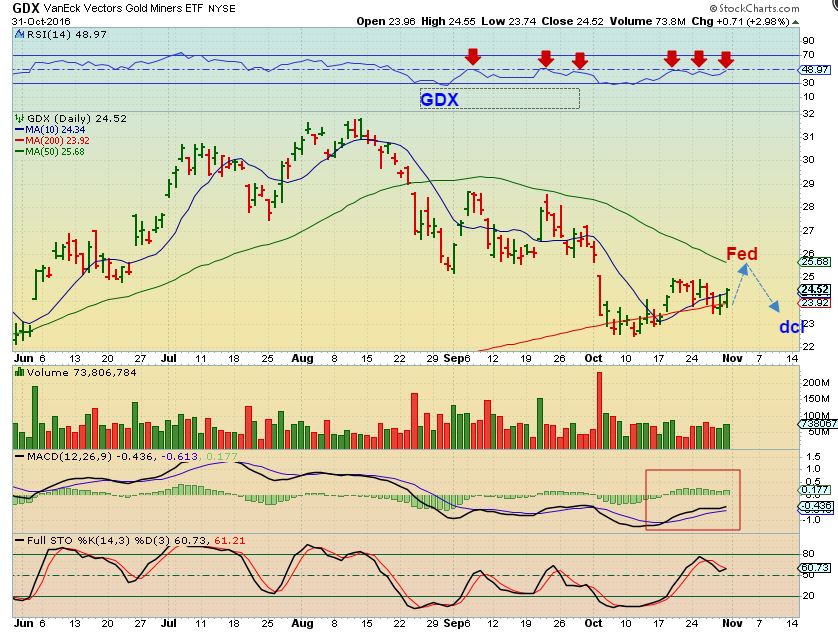
GDX CHART #1– GDX pushed above the 10sma today and is trying to break out of a 3 month downtrend. This set up looks bullish to me, and the MACD and RSI are lining up bullishly in my opinion. C’Mon Janet Yellen, You can do this 🙂
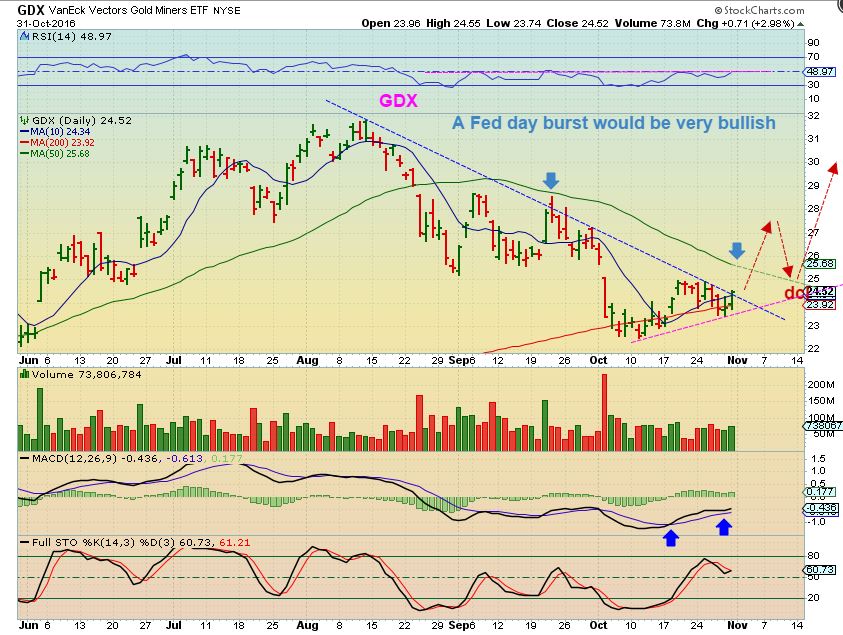
GDX CHART#2 – Back above the 200sma, now an important move that I would like to see is a higher high above the last 2 weeks prices. With the Fed Wednesday release , this can break out above the 50sma or temporarily stall there in to dcl. A closer look brings us to…
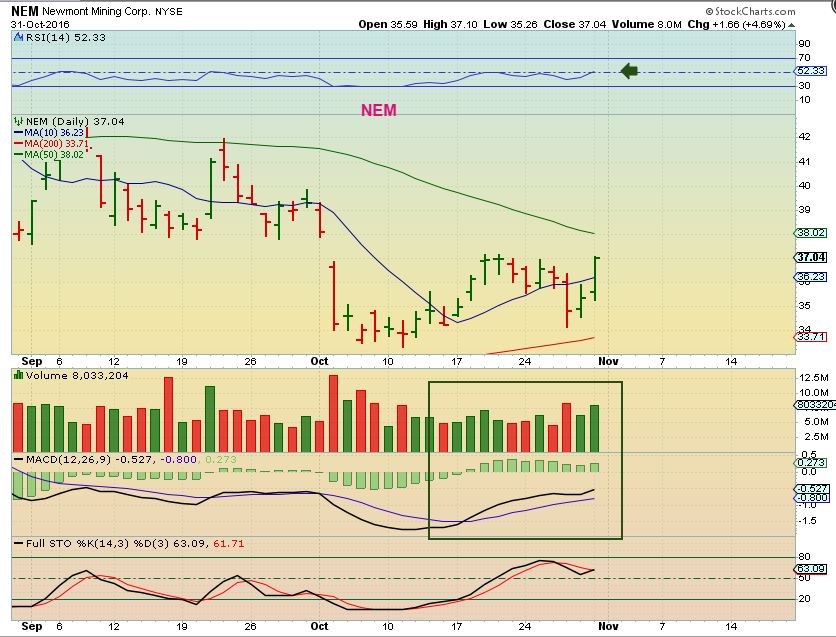
NEM – As a big component of GDX , it is good to see it in this bullish light.
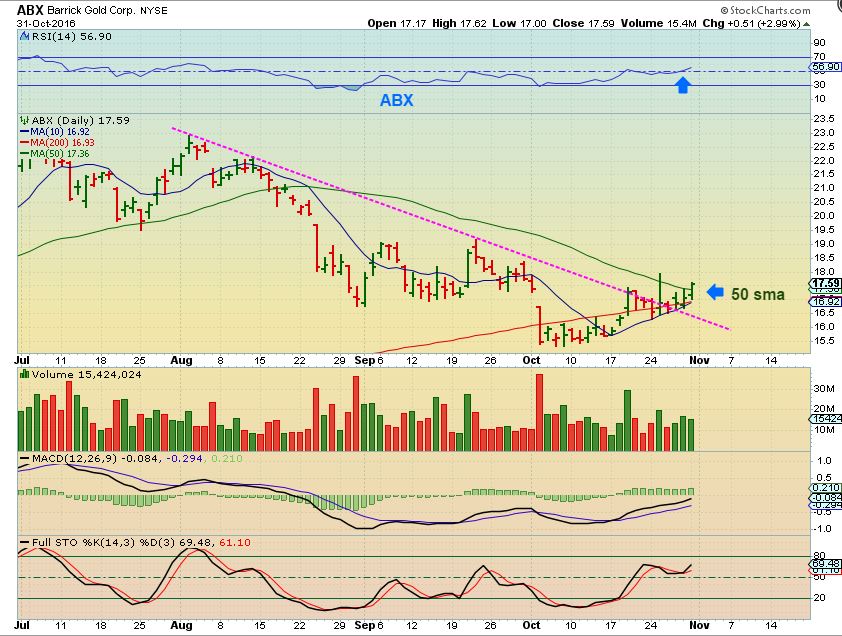
ABX – Also a major component of the GDX broke from its downtrend and also above the 50sma. We are seeing Bullish moves behind the scenes.
NOW I WANT YOU TO SEE JUST A BIT MORE OF THE BULLISH SIDE. CAN THE FED SAY OR DO ANYTHING TO CHANGE THIS? WE ARE NOT EXPECTING HER TO CHANGE ANYTHING.
.
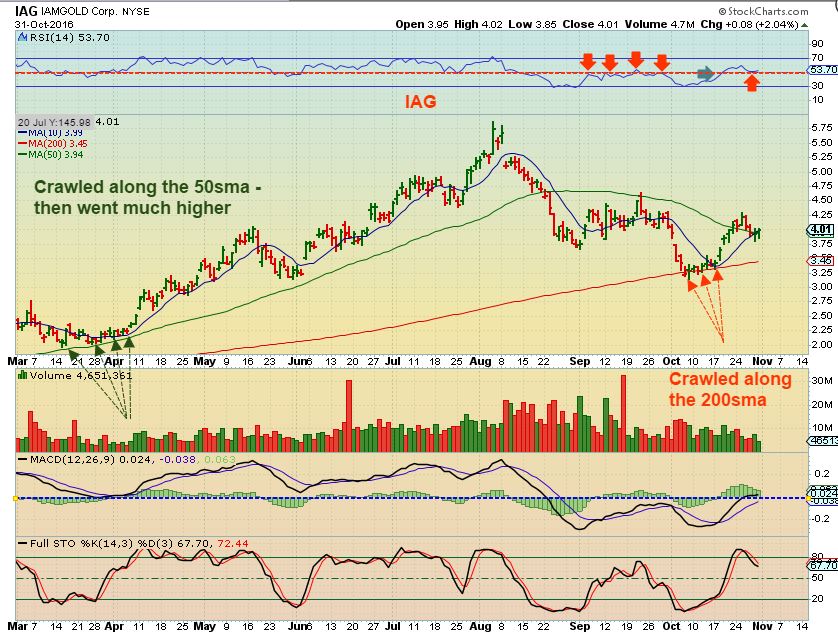
IAG – I had been posting IAG for weeks. Here it was at $3.37
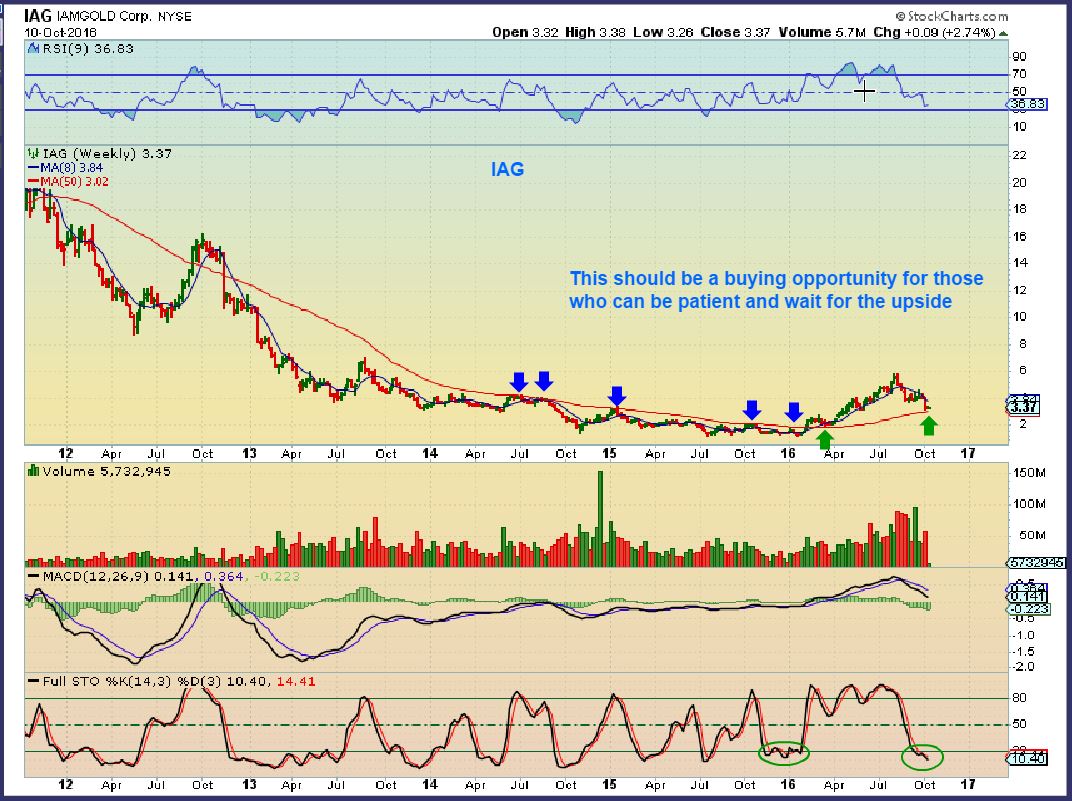
IAG – IAG moved above $4 again today. It remains bullish and broke out from its downtrend a week ago.
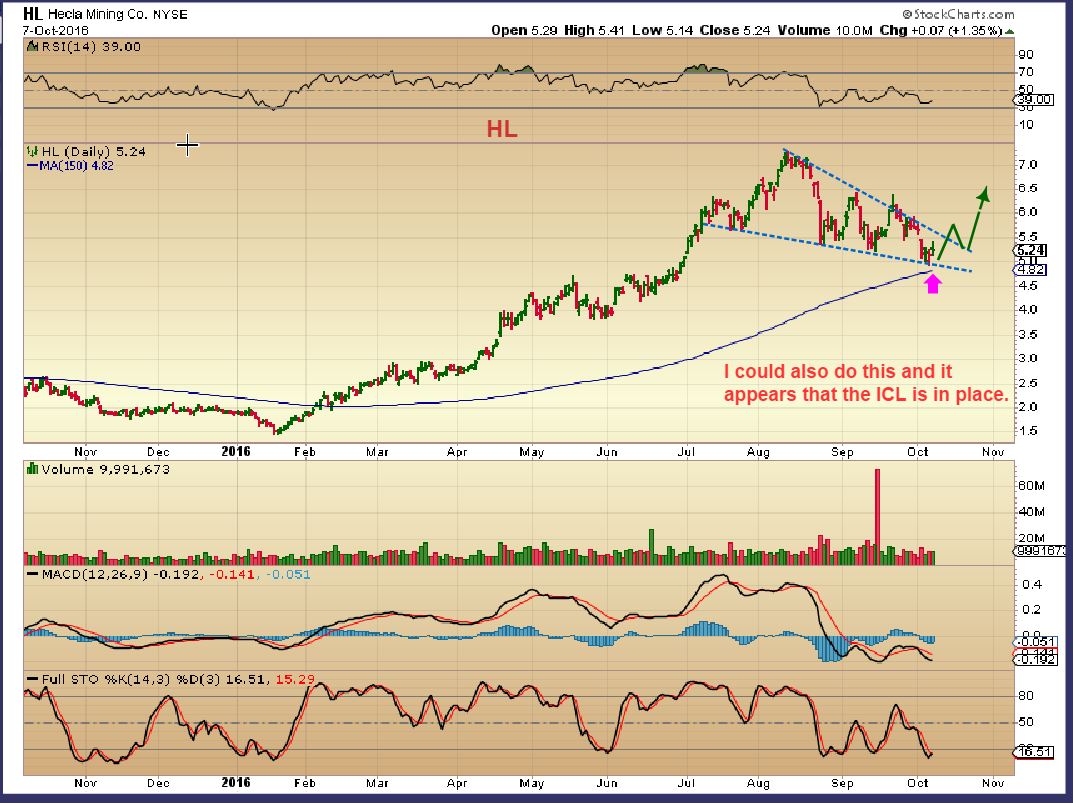
HL – When I was thinking that the ICL could be in place in early October, I looked at several Miners like HL. HL bounced off of $5 and if the ICL was in place, I drew that it could break out and back test this falling wedge.
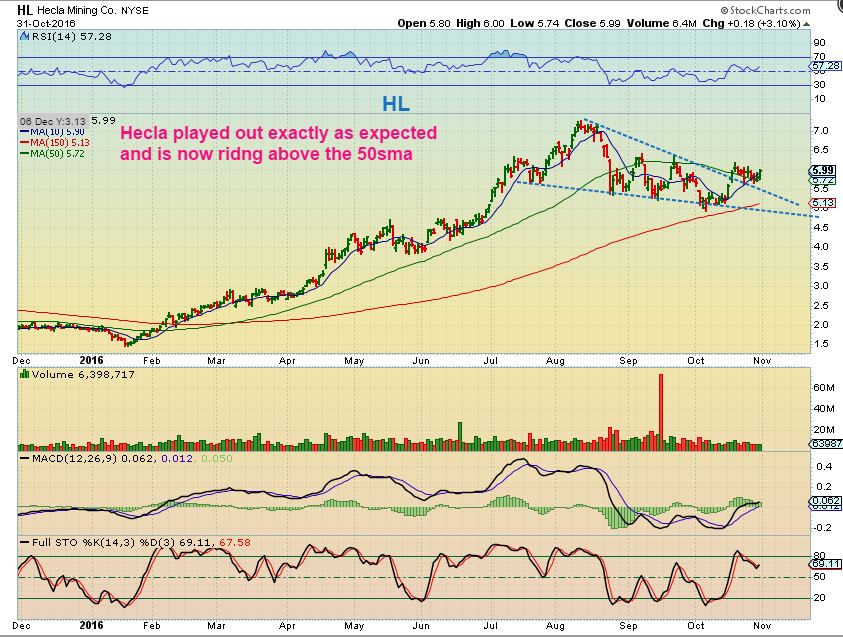
HL – Imagine that, it is acting correctly. Now it is riding above the 50sma.
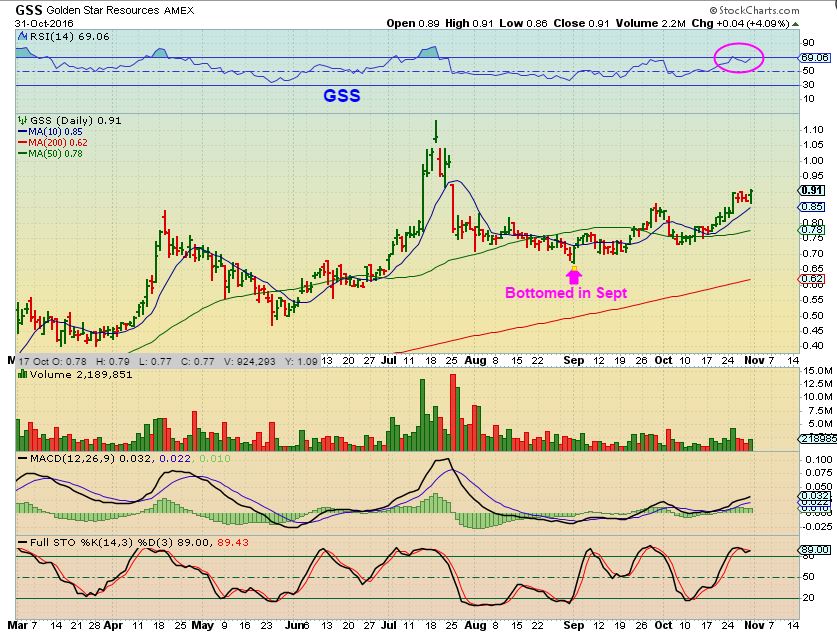
GSS – I pointed out this rounding bottom last week when GSS popped higher. At the end of last week when Miners dropped going into Friday, did GSS crash down?
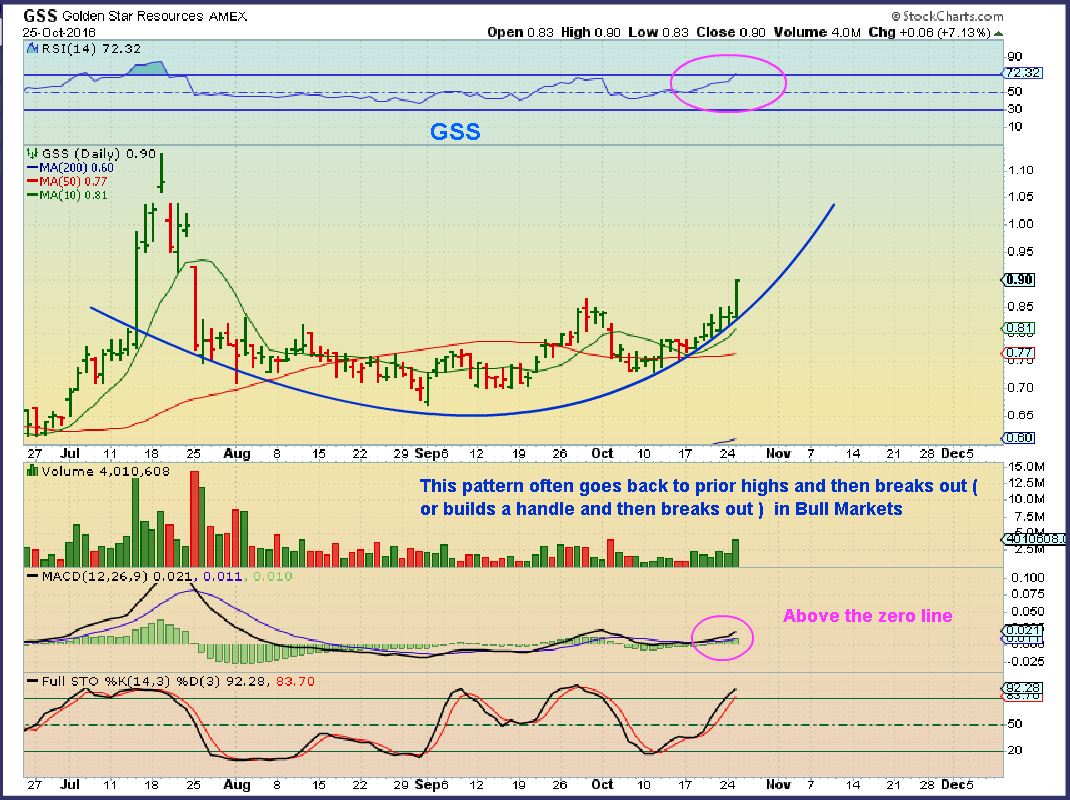
GSS – GSS is higher today than it has been since July. Mondays volume was a bit light, but this also could be at 2016 highs if we get an explosive move after the Fed.
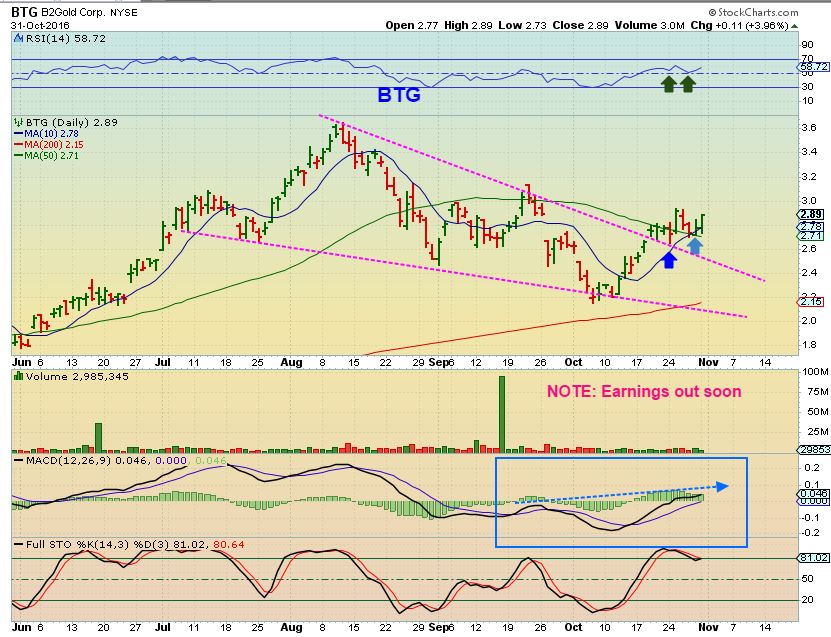
BTG – Above the downtrend, the 50% RSI, and above the 50sma.
Conclusion: So todays report gives some confidence to the idea that while many are in fear that the Precious Metals sector and Miners will break down soon, we can see some bullishness within. We bought the lows in Early October expecting at least a dcl, but thinking that the recent drop was steep enough and sentiment was bad enough for it to be an ICL. Timing was also within the parameters. As we watch it play out and see what we have, I am seeing that with this sideways move that Gold and Silver are doing, areas still look more bullish than bearish. The lows have by no means been taken out, the Oct lows have held up for GDX and many Miners.
Ahead we have the Fed Mtg Wednesday. We do not expect any surprises at this point, so the recent lows should still hold and the bullishness that we reviewed today is likely smart money positioning for upside. If the ICL is in, any positions in this sector should be much higher weeks and months from now.
Tuesday and Wednesday will likely be very similar as we are Waiting for the Fed. It may be bullish or it may be uneventful for Precious Metals, so my report for Wed morning should be quite a bit shorter. What I am writing in this report can be monitored Tuesday. If anything big happens, I’ll mention it Wed, but right now I just expect more of the same going into the fed Wed and thus a short report. Thanks again for being here at Chartfreak!
.
~ALEX
.


Thx Alex! I guess your $gold wish came thru? And who says Christmas can’t come early 🙂
If you mean the $1285.40? yes, it just popped above it. That really helps on day 17 to ensure that this will be right translated, and convinces me further that we saw an ICL for a low in early October.
So this will either continue higher into the Fed mtg and maybe dip into a dcl after, or just keep going higher into the day ’20 something’ and then dip down later.
who’s interested in strong Canadian stocks, look at FM ( first Quantum ) and EDV ( endeavour mining – not to confuse with endeavour silver EDR AND EXK !!!! ) they are both at their 2016 top and had hardly any pullback recently
they are a couple of more strong Canadian gold miners
Always buy strong stocks said Stan Weinstein ( I’m currently reading his old book – secrets for profiting in bull and bear markets ) A MUST READ by the way !!!!!!!!
Ray sent me the chart of FM (Canadian) , but couldn’t post it, so here it is. It looks great, breaking out to new 2016 highs. A leader.
.
. https://uploads.disquscdn.com/images/b06caf0611cff429c2a865d1b63da12143c13700c32e0fdde46b06da2661a5b8.jpg
This was the EDV (Canadian) chart. They did have a 1:10 reverse split last year, that’s why the chart looks the way it does price wise
.
https://uploads.disquscdn.com/images/599063819363797d05b8058a8c45b148ff543da74ae360a609e471e269a633e2.jpg
aha! thx.
anybody knows the OTC symbol for First quantum? to trade in the USA?
FQVLF – But the volume is way too low for me to trade comfortably
edv is a crazy looking chart!!! wish I had got in at beginning of year.
Great discussion about recent action and lots of data that wiol help point to confirmation of ICL. I panicked Fri and lost some of my positions in that. 🙁 So hard to keep emotions in check when we linger and dip so naturally it takes off upside afterwards (SOG, you’re welcome!!). That was only leveraged plays, I still own all of my individual miners and now feel confident to add when we see the next entry. Stay strong all!!
Here are some earnings dates, sometimes I found conflicting dates: BBG Nov 1 or 3, IAG 1 or 4, KGC and HBM Nov 2,. BTG and GPL Nov 3, HL is either 3 or 4, GSS Nov 4
Good info for everyone, thanks
Alex, did you worry about earnings days when we took off in Jan 2016?
No, not really. Look at charts of GG or ABX back in January – most of the earnings were being released in Feb back then and many Miners were already well off of the lows, so if it gapped down, I’d still be green & could decide at that point what to do. It was in the back of my mind, but OIL prices had dropped a lot ( helping their expenses) and Gold bottomed in the summer and Dec of 2015 and the markets (smartmoney) tends to be forward looking. I just wanted to know which ones I own and be in front of the screen in case the reaction downside was too much.
At this time, I would expect miners to be doing much better than compared to last 3rd quarter of 2015 with Gold prices higher, so I’m not too worried right now .
another cycle theory (13.5 year) finds a bottom… according to the chart it is approching now./ or already in. https://uploads.disquscdn.com/images/f076ed96218086f597afa42f67e51d770b56b2bf27d2b3a9197318c4cde1c6a4.gif
This should be 13.5 MONTHS. He also suggested a bottom on 11/1 for gold, 11/4 for metal stocks.
thanks for the updates & extremly sorry for the typo.
Looking at the GDX possible tracks – both dipping to
a dcl – you thinking then that when these miners pop its a short term trade to bag gains and then try and re-enter lower? Or is that too tricky if one isn’t in front of a screen all day?
In the past coming out of an ICL, sometimes they go sideways into a dcl, and you would not be able to re-buy it.
So I would say hold them if you can stand the possibility of a pullback or jumpy trading around the Fed, but I like the set ups in many of these.
Look back at the rocket launch out of Jan 2016. No buy the dips for a long time.
Gold/miners have been VERY difficult to buy the lows since DEC. They are keeping all/most people guessing. This low is another example.
4-SURE!
I checked many stocks with my system. I would say about 40%, like RGLD, HMY, SA, SBGL, etc., would not let me back in with a daily pullback buy. Thus, one needs to use a 30/60 minute pullback to get in. NOTE: My TC2000 will not let me check 30/60 back to Jan 2016. However, I am confident there will be 30 min pullbacks.
Hope everyone has green accts like I do [mostly]…I don’t trust it to stay that way…but it is nice to see for now!
As I have written before, this is the first hour. My experience is that they get run up, then pull back. But coming off the bottom, things may change. Mine are all green for today so far. TRX and VGZ are 6+%.
AUMN 8% too.
i notice that AUMN & TRX are usually slow to get going after market open… then rocket up.
anyone know the reason… are the buyers waiting to see what the miners are doing for the day before entering.. or what?
I call it “The Gift” moment – lol
does seem that way, esp. when they are lingering in the lows
Sometimes we get the big gap open, and the gap eventually closes and many get worried that we are failing, then they go back up 6-8%. Thats a much harder ‘gift’ to buy – especially this late in a daily cycle
This makes this a right translated daily cycle and likely the ICL is in place.
That means that , yes, we will see pullbacks, but they should be higher lows and higher highs for the next few weeks ( months).
has Cason verified your genius status now then? 🙂
HEY!! I forgot all about that 🙂
i see they are coming out the woodwork to claim the bottom is in…
Clive Maund was reckoning on lower lows.. and today apparently the lows are in!
Here is where I am confused. We are on day 14 of the miners cycle that tends to average 24-28 days. So, how do you see this lasting weeks to months? Did the cycle stretch due to the long dollar cycle? I guess if this is an ICL, then we might get 22 up days out of 24……a small dip and then DC 2?
Read it again
” The ICL is in place. That means….”
Yes , a 2nd daily cycle, and even the 3rd can be to new highs
I read it, I read it. Why, Why, Why? So, another 14 days up would put us way, way way at the Right side of the cycle. That’s how you see it?
Is this a ICL from the lows ALEX ???
Would you explain (so I understand it better) it a bit more for me?
Sorry to bother you ALEX, but you are always a big help for me.
THANKS A LOT !!!
Alex, while you are at it, what is a good reference for ICL and DCL. I don’t follow these but likely should.
Alex. .. your IPI oldie has woken up again
may be due to good earnings?
…although, doing a weekly wave count.. could just be a wave 4,.. with 5 down yet to come.
AG looks like it is finally getting off the ground. Could be a 30/60 min pullback buy after the first hour. Up 5+%.
JNUG is up about 8%. It would be nice to see it move to +10%. A really good day is 20%, but maybe that is too optimistic? 🙂
I am seeing some minor pullbacks. For example, TRX and VGZ. I am still all green for the day.
how’s BVN look to you Alex?.. getting a buy on my D chart & just below 50sma
refresh- chart from last weeks report – holding up exceptionally well and breaking out
.
https://uploads.disquscdn.com/images/079a24c2fb20c0f68596545e323f511a305599c61dbfe8375e5bc610c428edc4.jpg
Trump marginally leads in the poll. May be this is the reason Gold & miners are up.
Tammie… you were worried bout AXU not going places yesterday….
ok today, indicator breaking out of 4month d/t
https://uploads.disquscdn.com/images/00c989c1c869fbed0d23753f52b514b505eef7eb44fa0a4fd2ca2bd215754a9e.jpg
Yes, so glad!! I’m in the red on this one so hoping to make up for lost ground…..:) Geez, wish I had held some I sold last week when I had visions of bear market in my head…live and learn….
Thanks for sharing
Bill … LABU think it may finally be in now!
Alex right.. as usual… XBI down to 200sma.
all that blood in the street.. its mine .. lol
….not really,, only had a small buy originally 🙂
I’ll wait for the 88.6% retrace around 25.36
you could be right.. that would be the rising t/l touchdown too
I think we just reached the reverse spot in LABU.
https://www.tradingview.com/chart/LABU/kC8wkyFH-LABU/
thx Bill… im in for the ride
SoG, thanks for sharing your beautiful charts. Earlier this year, it ran from .33 to 2.22 close basis. I will move this up on my list to buy.
youre welcome..
jus lookin around for other 4H chart indicator breakouts..
i see GSV breaking a 3month d/t line.
obviously these could still track sideways, or even reverse.. so buyer beware!
https://uploads.disquscdn.com/images/3744b543aea8ede4436d1fdf3b80b03e8aaee0c019402e8167e8440f6353c55f.jpg
Thanks. I bit on this long pennant several days ago and am still under water. I have no plans to sell, buy your wonderful chart pleases me.
Gary
checked thru my whole PM list… to find out which ones are in similar shape to those above.. ie, breaking out of 3 or 4 month indicator d/t lines, into the green area.
i wont post charts of them, unless anyone is interested in particular ones..
ASM AXU BTG GDXJ GPL HUI KGC MSV.to SIL TGD XRA
nearly breaking into green… EXK GG PAAS
I will look these over to see what my indicators say. Many thanks.
actually those last 3 are all breakouts into green too now
I like all of yours. Currently, here is what I watch for as I posted before: Weekly price: RSI 1 = 100 and above the 5WEMA. I have a TC2000 column which shows how far the current price is above the 5WEMA – this can vary during the day. Here is my top ten PM list. Yours may be in my top 20 or 30, but they DO satisfy my strength condition above: AMRS, GSS, NAK, BTG, ABX, VALE (currently in a pb), HL, SWC, IAG, KLDX. Do you see anything you like in my list?
some of these are already well advanced.
i get some overlap with you for BTG today.. and i got GSS and HL as b/o yesterday.. i bought 🙂
ABX NAK were a few days ago.
the canadian version of Klondex, KDX.to, which Ray posted above is just under the d/t line.
what i’m after is a coil/downtrend b/o into the green, as ideally near the 0 line as poss.. thats what ive been visually scanning for on the 4H.
Thanks. Very helpful.
Thanks for this list! I have a few of those…some green, some red from the past…..going to go check out some of the others in the list 🙂
nice list I had some to add CS AMI CGG IVN MAG TGD and last but not least KDX this last one has no resistance from the past so that could fly as no one wants to sell
MAG is a nice one.. thats breaking a 6 and half month indicator d/t
Watch the low volume.
Thanks. Most of these are nice TOR stocks. I need to check with Scottrade to see if I can trade them. I use KLDX for KDX.TO.
How about RIC?
yep.. RIC just broke thru the centreline on the D (& 4H).. but i hadnt included it in my list because the d/t line only ran from september.. so it wasnt a decisive trend.
there’s another major line from april, running high above https://uploads.disquscdn.com/images/e6b3b4d524cbe5a9e01c543215b5064ec42b7cb98cbb4bd8262e870bb9a564b0.jpg
actually lookin closer at that.. there is a definitive d/t from august, if you ignore the sept peak anomoly.. and it too is near a b/o on the 0 line
https://uploads.disquscdn.com/images/f6ab176b9bc42a362531609dda452168975feb4ed47e5041197482e524503361.jpg
I bought some Yesterday. Thanks for the chart.
SOG, how does SP500 and OIL look on your histogram charting?
hi Bill.. can’t get WTIC on my platform for some reason, but gives Amex Oil Index, whatever that is (?)… anyhoo… its right on the lower TL.
S&P looks like some kind of textbook drop., with backtest of coil apex.
https://uploads.disquscdn.com/images/00092229acafae2df75be4317987979b317d769c4d879c7f37b90f08d54a42ef.jpg
https://uploads.disquscdn.com/images/00c989c1c869fbed0d23753f52b514b505eef7eb44fa0a4fd2ca2bd215754a9e.jpg
(oops.. posted wrong chart there.. so deleted to avoid confusion.)
hi Bill.. can’t get WTIC on my platform for some reason, but gives
Amex Oil Index, whatever that is (?)… anyhoo… its right on the lower TL.
S&P looks like some kind of textbook drop., with backtest of coil apex.
https://uploads.disquscdn.com/images/00092229acafae2df75be4317987979b317d769c4d879c7f37b90f08d54a42ef.jpg
https://uploads.disquscdn.com/images/7f69cf65aa252b85d397a64a23a2d35ca084bd2058d7bf4b04a30b6c12f8a424.jpg
these are Daily charts
just noticed .. the above GSV chart is a DAILY… not that it makes a difference, as the 4H is also a b/o
Alex- what do you make of the pop and fade of NAK each day?
normal- look at the first 2 weeks of august on the way higher
It sure would feel better if GDXJ would make a higher 2-week high like GDX did – Alex, could you put that on your Christmas wish list too? /;^)
thats on my Fed Day wishlist – break above the 50 sma is more than enough
soooo …. superman … u think HBM has another move like this in it??
https://www.tradingview.com/x/k5J1BTel/ https://uploads.disquscdn.com/images/fdd4fb6eae8cca12cd802264dd9003f8bd9a63579bc870f31c530c58b099a96d.png
mind u. i have not read the report yet.. 😡 so apologies if u mentioned it
It could have if it did it before, but HBM being copper, I havent looked at Copper lately.
Copper and gold
Just got back from lunch. JNUG made it up to 10% (good news), but coming back a little. I am still all green for the day, but simply churning around, not exploding. Please understand, I am a happy camper with what we have so far. We did not get a pullback after the first hour like often happens. I am watching for 30 min pullbacks to buy – nothing so far.
CNX (energy) just reported .15 loss instead of expect .11 loss. but revenue up to 746 mill from expected 573 mill – and the stock popped 10% so far
There goes VGZ!
Yeah…and I bailed on it last week….:( 🙁
I tend to hold these long pennants. I am finally green in VGZ, but still down in both TRX and GSV.
Yeah, I have a few I’m still down on….one of these days I’ll be ALL green! 🙂 🙂
I’m still red in VGZ but at least improved.
Earnings already out on VGZ too… sleep a little better at night : )
Cmon Janet https://uploads.disquscdn.com/images/506cd7e4c9b17725183664400f48439abdd9311c60af2e98a46558ddf47ee154.jpg
hahaha! So funny!
Almost in the green on my FSM that I bought at wrong time…..whew! Now just need my EXK and AXU to recover a little more. I’ll get the hang of when to buy and sell one day 🙂 🙂
So the JNUG I held to down 40% is now just down 1%….added to it early this morning (I’ve added to it before….) – to average down….woohoo! I have to keep myself from thinking about what it would be like if I had bought it at $10 instead of higher…..can’t think about that…just have to think I’m about to be in the green and be happy with that! https://uploads.disquscdn.com/images/9886108dadaca2487304b95dfbe615691294e07c186d76c80ed8b04be95639e2.png
I am seeing lots of 30 min pullbacks, but with no 30 min turn ups. Although I am still all green for the day, my acct has shrunk a few hundred. Is this the time of day when there is a pause, perhaps for lunch? JNUG is up only 10%, but was up around 15% earlier. It would be sad if we have run out of buyers.
I’m seeing volumes are quite low across the board too. Does that mean there are a lack of sellers too?
Three things: 1. JNUG has turned up from 30 min pb. 2. I have several 30 min buys. 3. My stocks are still all green and moving up. Maybe folks who savor the metals are back from lunch. 🙂 At least, let’s hope so.
RIC, having issues with traction?
PLG moving up….they had an offering on 10/24 which sent it down….but the offering was at $1.80….price now is $1.76…just started upticking in past few minutes……
I don’t have this…..just watching…
FWIW: I would put my money elsewhere.
just ran that by my Daily chart, going back a year, and it does look like it has some work to do (wave 1 and potential wave 2 pullback chopiness?).
its a long way from the green… but they do sometimes just go vertical off of the bottom.
i know Alex quite likes those 🙂
https://uploads.disquscdn.com/images/409619def2218c1ac836d6edbd1de782916cdc08160268536db0dc134726b14f.jpg
Thanks – I’m just keeping an eye on it…..love to see your charts, gives some clarity! 🙂
Nice comment and graph. It had a nice run up in Feb 16 as shown after a similar smash down. I put it in my watch list with an alert to catch a turn up when it comes. Thanks to both of you.
Thanks for the tip….:)
MNGA has until December 13 to trade over $1 for 10 consecutive days or will be delisted from Nadsdaq…..IF my information is correct….do companies usually have some tool in their belt that can help them achieve that rapidly before the delist date? Just wondering…..I sold mine last week but was considering jumping back in….but the date is now 6 weeks away..
I believe the reverse split is one remedy for that.
Just havin’ some fun with Janet today …. https://uploads.disquscdn.com/images/f2af5ed06ca07d6e0460dc4c960c9b9d1f92467349478b9aa6a3e6e11f70b7e6.jpg
Hahaha! Love it! 🙂
A “frisky” Janet for SOG!
yours is better looking than JY
I put her in an Alexander McQueen red bustier ;o https://uploads.disquscdn.com/images/10d24d86735e3dcf3e7b0ca876481ab3e68007b6b6abd4296842558288b4f094.jpg
..
https://www.youtube.com/watch?v=uK-4W7c0BgE
The maternity collection ….. https://uploads.disquscdn.com/images/0f606806bf1af1560e3714df3c333a089fedbbebcccc1c60ecd5eb97d6d9a6a0.jpg
mmm.. getting unsexier by the minute 🙂
As Circe? …. https://uploads.disquscdn.com/images/8248dcecf4a38fcd0c4434e4581fe09eff0be517951136648c815e5f2dcfd5e0.jpg
.. am preferring Franz von Stuck’s version.
sooreee Janet
https://uploads.disquscdn.com/images/2be392b30e0723a42cab883807ce6906066897915f49bb7e3abe4225efeccaee.jpg
Hilarious! Cracking me up!
Yeah! B&B are the best.
Ok, I laugh every time I look at this! So funny!
So….my JNUG….from down 40%, back up, back down, back up, back down….finally up today enough to get out of the red…..so I sold it at the high today for a $40 profit…hahaha! I didn’t want to keep holding after that roller coaster ride….But at least I didn’t sell when it was way down….and I learned a lot through the whole process….. https://uploads.disquscdn.com/images/58dc1c60595d4665a6aaa99cd04a8e1a2fca2b910e81ae2b97bb98e1d511e0dd.png
Does anyone think today’s action in miners could be a bull trap?
yes, sure feels like it.
.. :)https://www.youtube.com/watch?v=0AEj3LA2vSo
hahahaha!! 🙂
Had to listen to this again, cracked me up just as much as the first time!
Kelly’s Heroes is a great film
OK, I hear what you’re saying. *bort* Here’s mea culpa–you know what’s at the end of those things, eh?: https://youtu.be/OQSNhk5ICTI
No.
Anyone think that oil might be near its low? Pretty big retrace from $52 to $46.50 or so….
Such a happy place when miners/metals are up! I am in cheery mood 🙂
https://uploads.disquscdn.com/images/d478b84e17fd68b7f25e59b9858f7567875ca595abdc6e0d9a5c99606b4c0b29.png
I agree….let’s all join Tammie’s party dance!
🙂 I didn’t even do that great today in my accounts…..just regained back the red from JNUG….so that makes me happy….:) 🙂 I had sold too many last week so got caught not holding alot….
I stopped out of JNUG last Friday below $11. #Stupidstop #WishIDidn’tPanic
I know, I have to learn how not to panic also…..just too much red in my memory from several years ago and don’t know how to stop listening to it….bear market really had me conditioned…..but I’m making some progress….:) https://uploads.disquscdn.com/images/ab93c6eb3c495309cac3df6748fe7ecd6ab1f8e5ffb4cc678a472ce8c97dde30.png
Yeah, but clawing back in JNUG is sweet. If we get a pop for the daily cycle pop you can always take profits and choose a better entry!
Yeah, now that I have a good feel for how JNUG works…hahaha….after getting in and adding twice to average down….maybe I’ll be an expert now! 🙂 ha! I sold it when it went green in my acct today….can get it again if time is right….I just couldn’t bear to see it go back to red after all that…and it would have near the close today…
However, looking at gold up tonight, I might cry tomorrow if JNUG goes up $2 a share now that I sold….heck,, if it goes up .50 I’ll cry
Uh-oh, well don’t look now! I accidentally sold GLD calls, I got frustrated when it wasn’t moving so decided to lower risk/exposure so set a limit and forgot about it. Blew through it, sold, and kept on going. Dang. I forget my limits often, but it was a winner, I just sold myself short on that one.
Darn, two of my stocks finished in the red, but a good day overall. We clearly faded in the last hour. We have to get past the Fed. But what about the election? Does anyone suggest we hedge or clear out for the election? Seriously.
what finished red?…. in my miners list , it was only DUST & 3 others.
think i’ll be employing some kind of election hedging strategy.
is it going to be H R C for $, Trump for $GOLD?
CLF and MNGA. I’ve never hedged, maybe I should. It seems to me that I might just clear out unless we have a huge rally the next three days. Then I could ride out whatever hits us (I think). Advice welcome.
a clear out is one way to do it, if in doubt.
but a huge rally would certainly be some nice breathing space!
a Trump win could be bring as much volatility as Brexit
Either way America loses!!!!
SOG I searched the news for election info that might help you in your strategy. This is all I could find.
http://www.bing.com/videos/search?q=reporter+gets+angry&&view=detail&mid=A169C1C5418F532B4281A169C1C5418F532B4281&FORM=VRDGAR
heheh.. very funny (& probably true) 🙂
If we can get a solid pop tomorrow for the Fed, I’m going start selling out my options prior to election. I’ll hold single miners. If we can ID daily cycle top then I’ll hedge.
nice breakout on VAPE today https://uploads.disquscdn.com/images/4a23f217497733d55656c879793c1c4b2a8087b0f734bc12d5018fff86b996a4.png
94 million shares traded!
Well, ok, at a penny a stock one can buy alot….:)
Researching some of the marijuana stocks…wow…CNBX..up 33% during the day, almost 10% after hours…..the ones I’ve researched so far of course have a lot of debt….
check out this stuff on the gold cycle, i was a little lost but wanted to hear what you guys thought http://www.mcoscillator.com/learning_center/weekly_chart/golds_13-1_2_month_cycle_low/
Fed and oil inventory tomorrow. And don’t forget Jobs Report on Friday the US election next Tues. Hold on to your hats, people this could get crazy in here!