
Weekend Report – Visibility
Another week that started off a little unclear in some areas, but I think we’re starting to see some clarity now. Lets review the current condition of the markets and then focus on Precious Metals sector.
.
I have been pointing out the potential resistance in the General markets. With the exception of the Nasdaq , which has done a little better, Markets have been rather stagnant. Lets look at the progress over the Month of October.
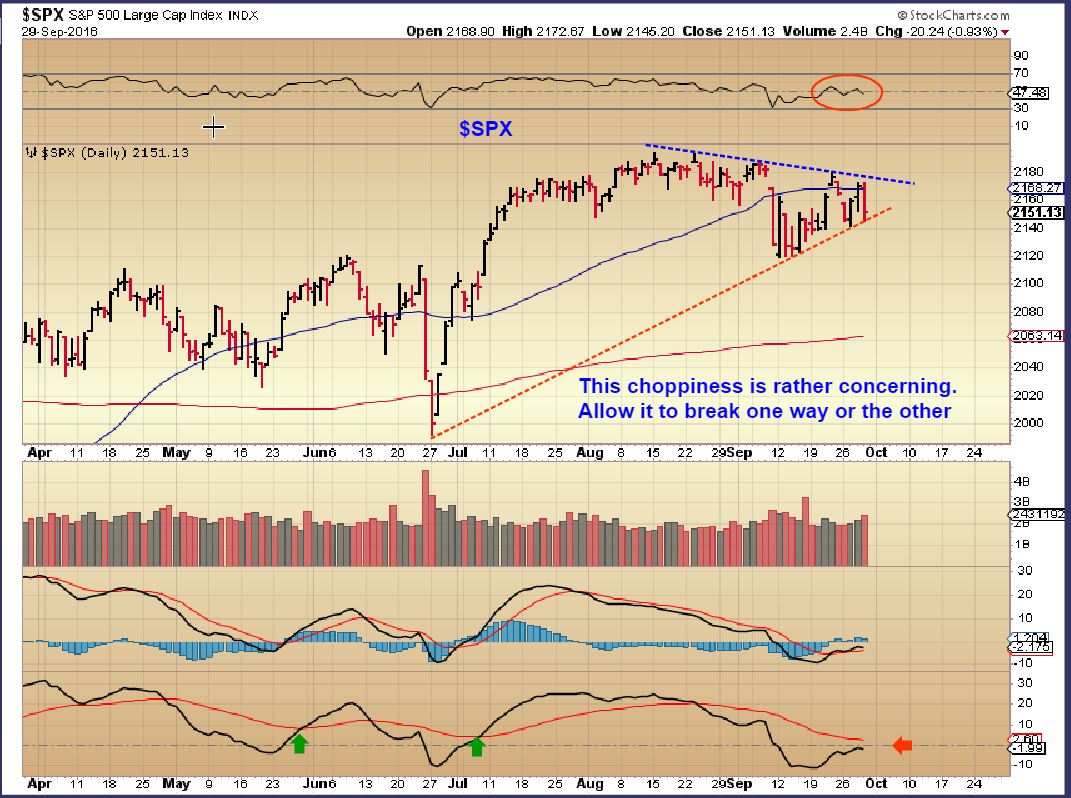
SPX –This was SEPTEMBER 30th, and the choppiness was making it unpredictable and untradeable.
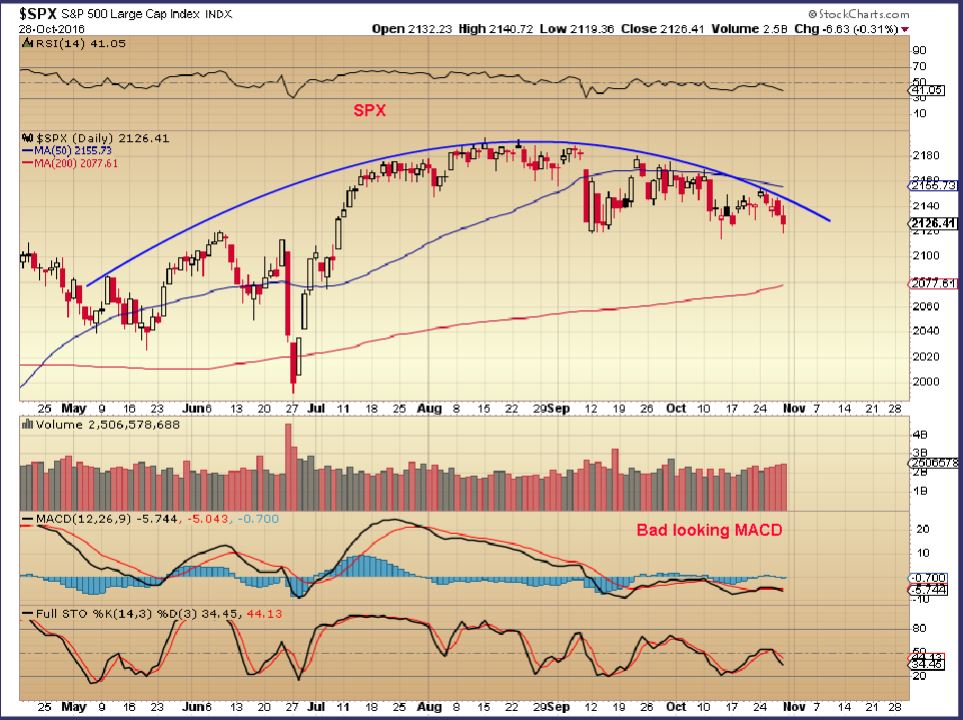
SPX NOW – 1 Month later and it is a tad lower with a big rounding top. On Oct 13th it broke to a new low and I warned that it now looked like it would NOT go upside until it first breaks to new lows again ( Failed daily cycle). 2077 is currently the 200sma and a possible support.
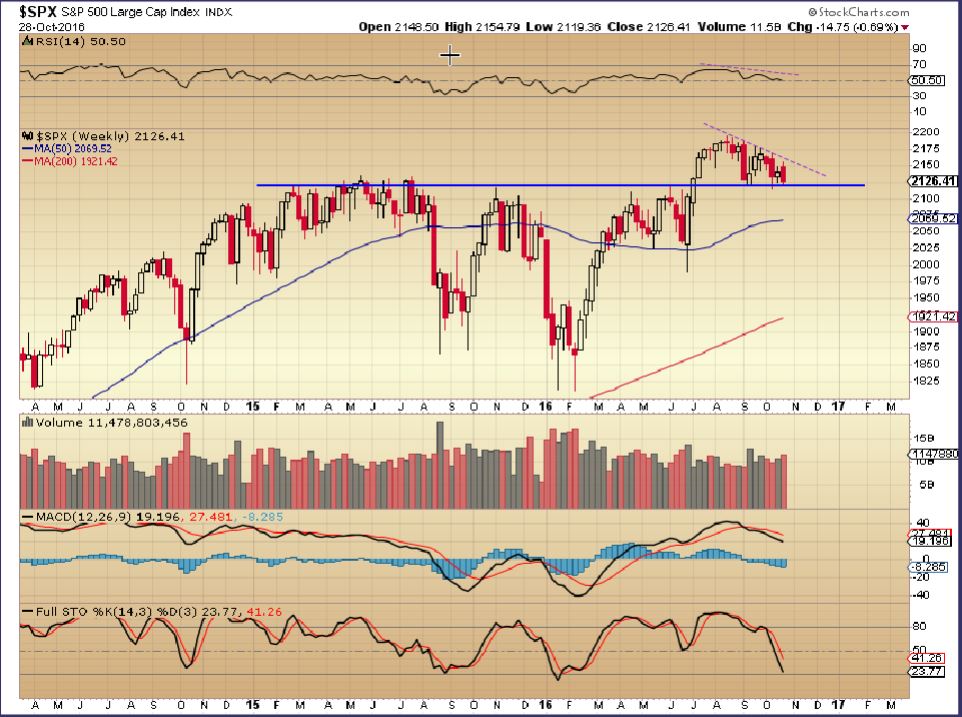
Lets look at the weekly chart
SPX WKLY – For the bigger picture, you could look at this as a weekly bullish break out forming a handle as a back test, but I think that the next real move will come after the elections in the U.S.
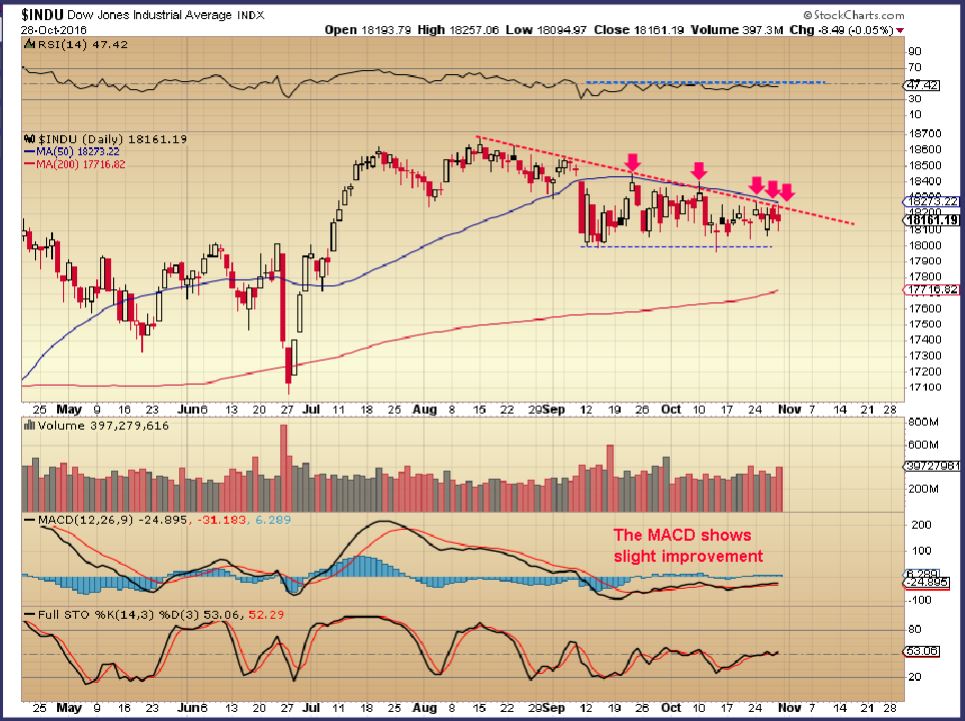
DJIA – The Dow has also been struggling against the 50sma and looks like it really wants to break down to the 200sma. Is this sideways chop waiting for the elections too?
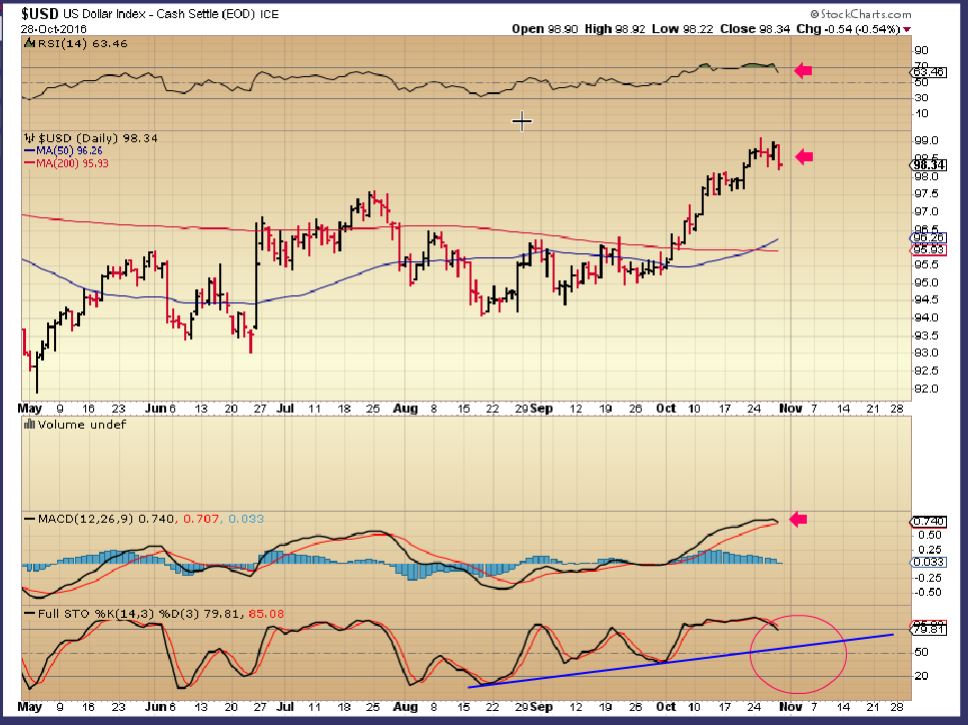
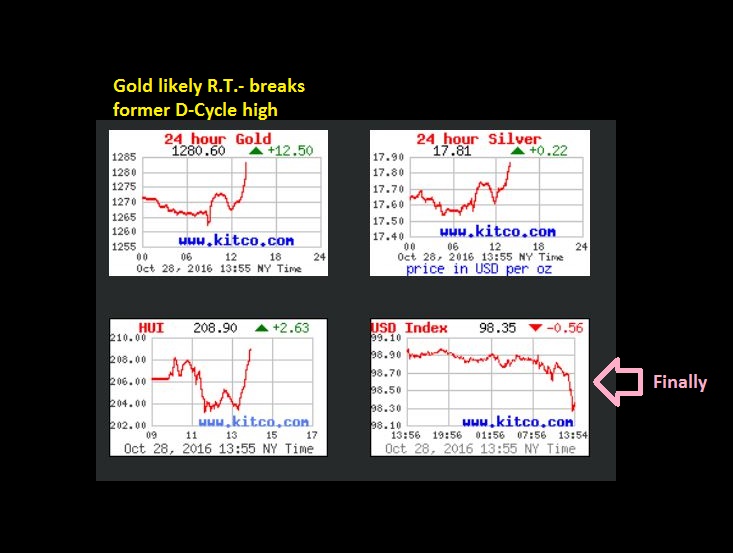
USD – The USD does have a swing high in place and is overdue for a dip into a dcl. This should drop and I would think that that will help Gold continue higher.
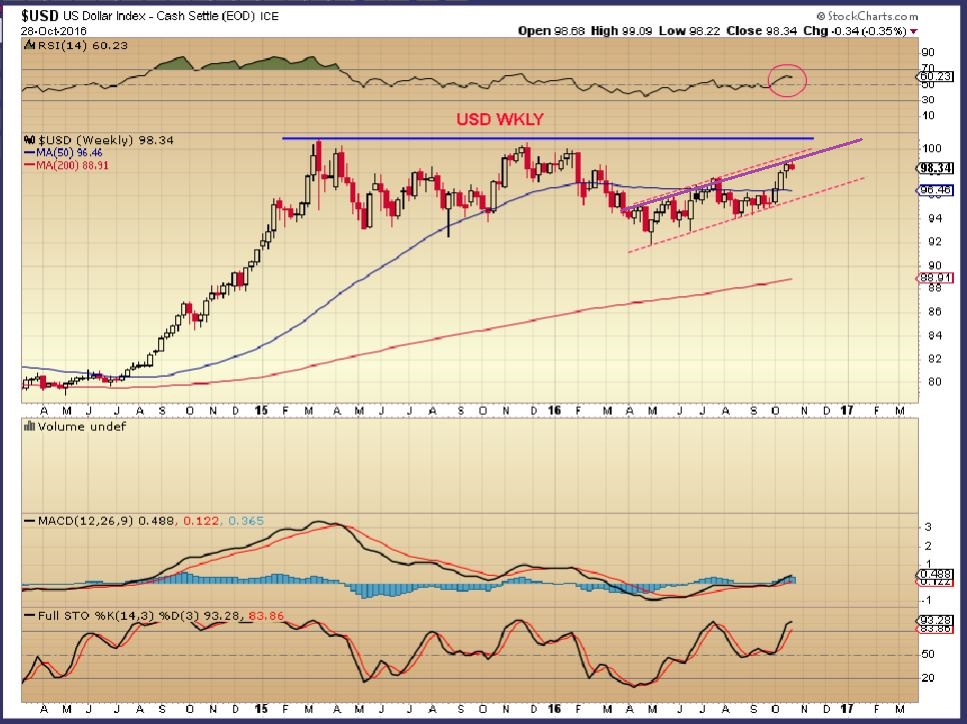
USD WKLY– This is often a topping candle, time will tell.
.
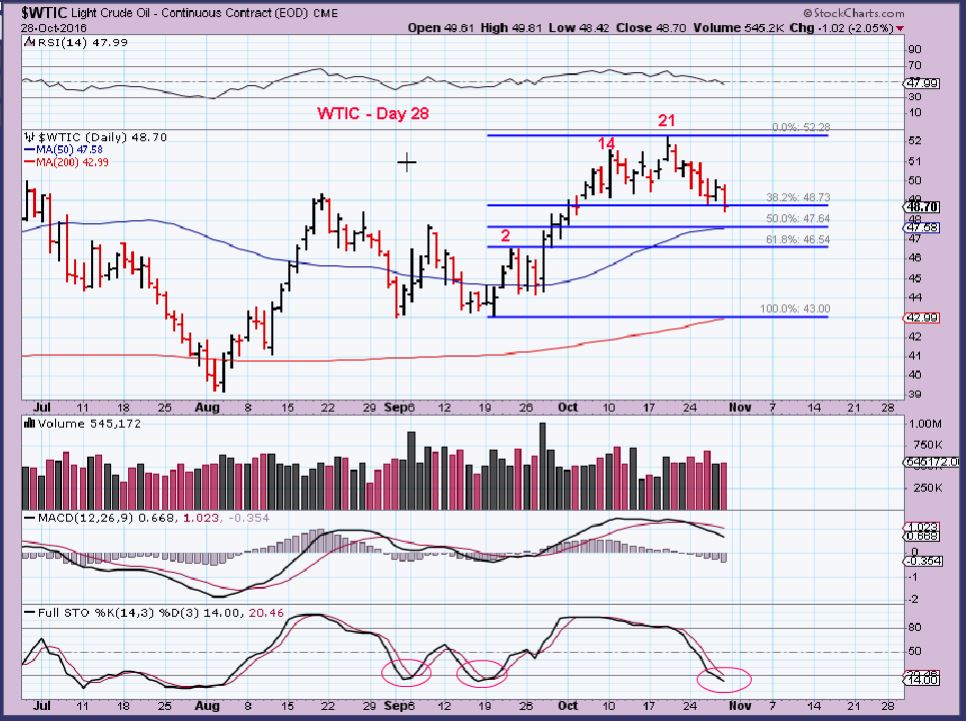
WTIC – Oil is in the timing for a dcl and is on day 28. It is at a 38% retrace, but can dip further and Oils timing for daily cycles can be 30-50 days. We’ll see how OIL acts around the 50sma / 50% line , since we always look for clues along the way.
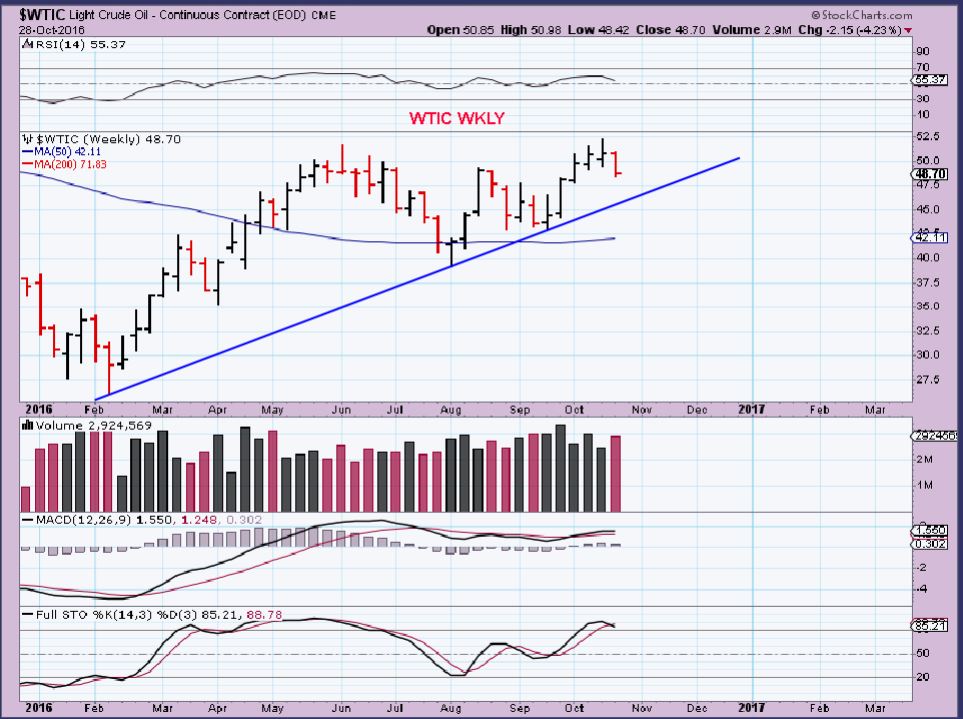
WTIC WKLY- Trend-line rising
.
FOCUSING ON GOLD, SILVER, & MINERS
.
Sit back and get a cup of Coffee or Tea, this is going to be a LONG discussion! I have over 35+ charts, but I will not include all of them to avoid confusion. I will just use what needs to be seen at this point in time.
.
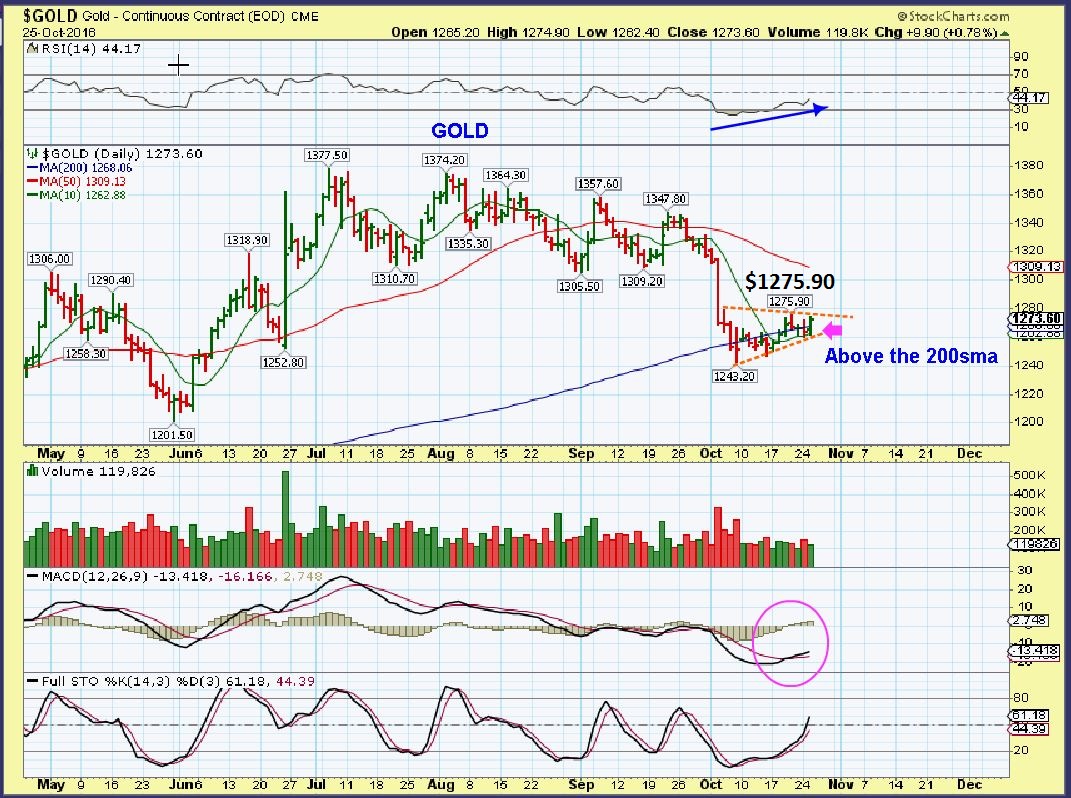
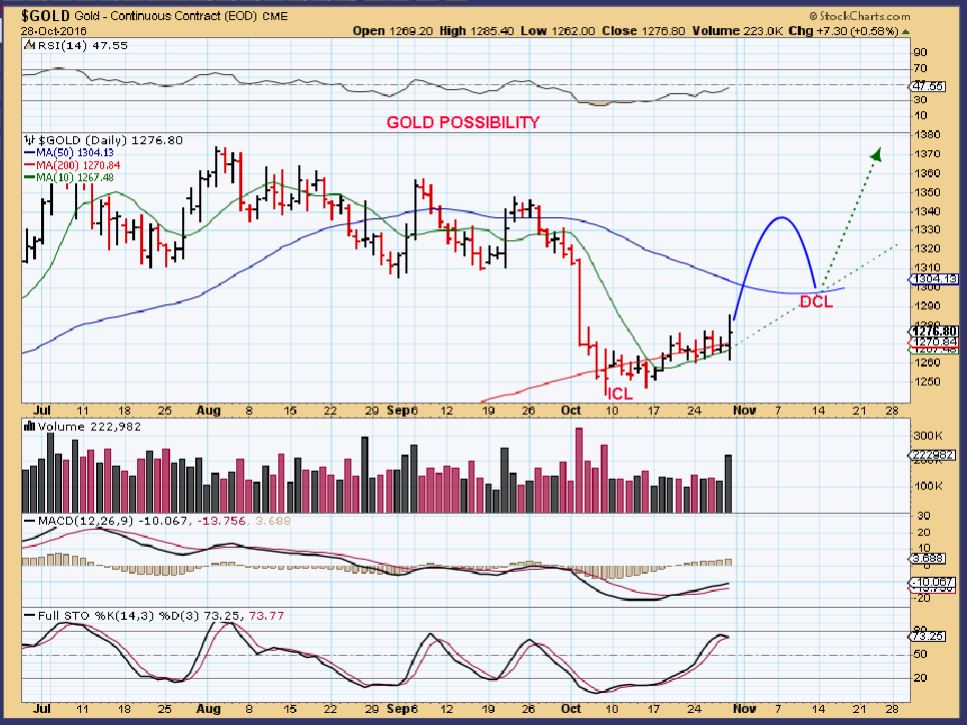
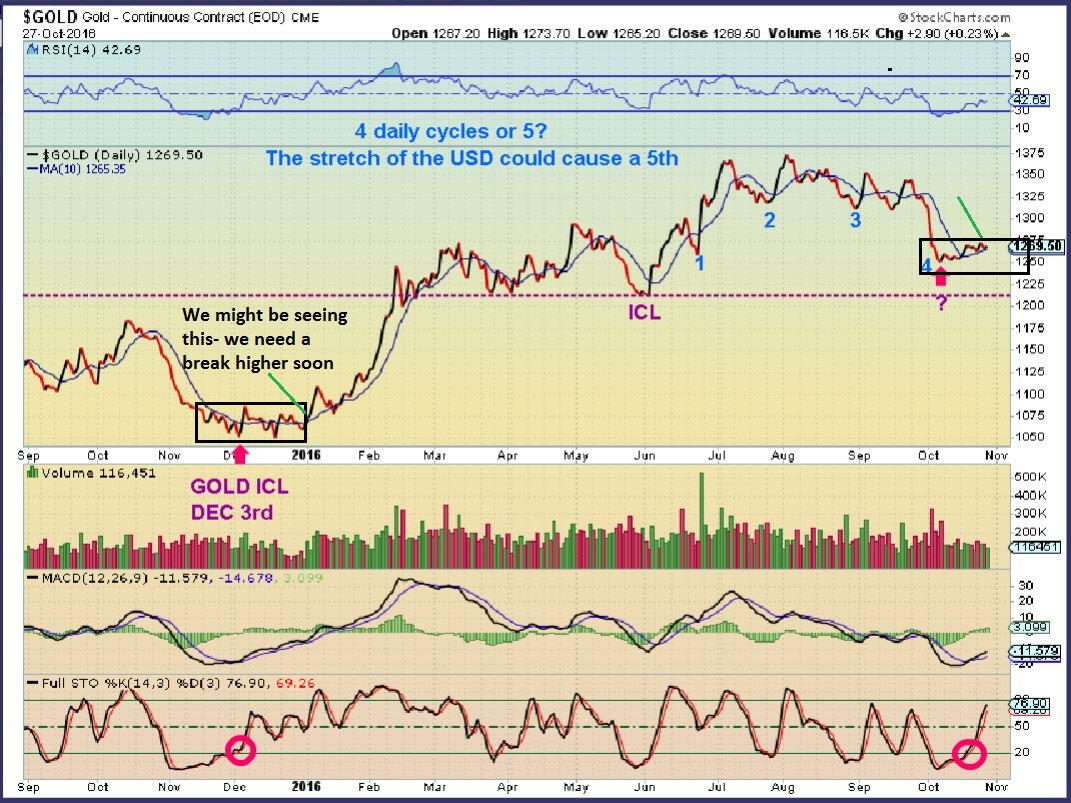
GOLD has been hiding its intentions for several days. Like the Lion in the opening theme picture, it is difficult to see clearly. Did it put in the ICL or just another DCL? Back on Wed Oct 26th, I pointed out that we want Gold to move above $1275.90 to become more bullish and possibly get this to be a right translated daily cycle.
.
We got our break of the $1275.90 Friday.
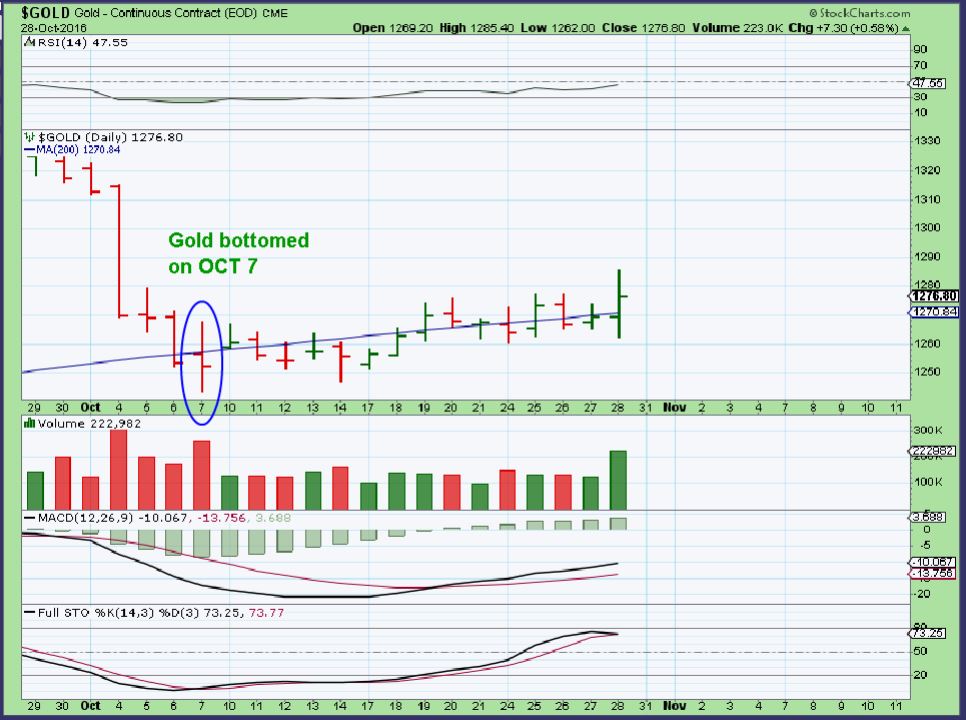
GOLD – On day 15, Gold broke that level and that increases the chances that we will have a right translated daily cycle, and therefore we caught the exact lows. More follow through upside would be even better.
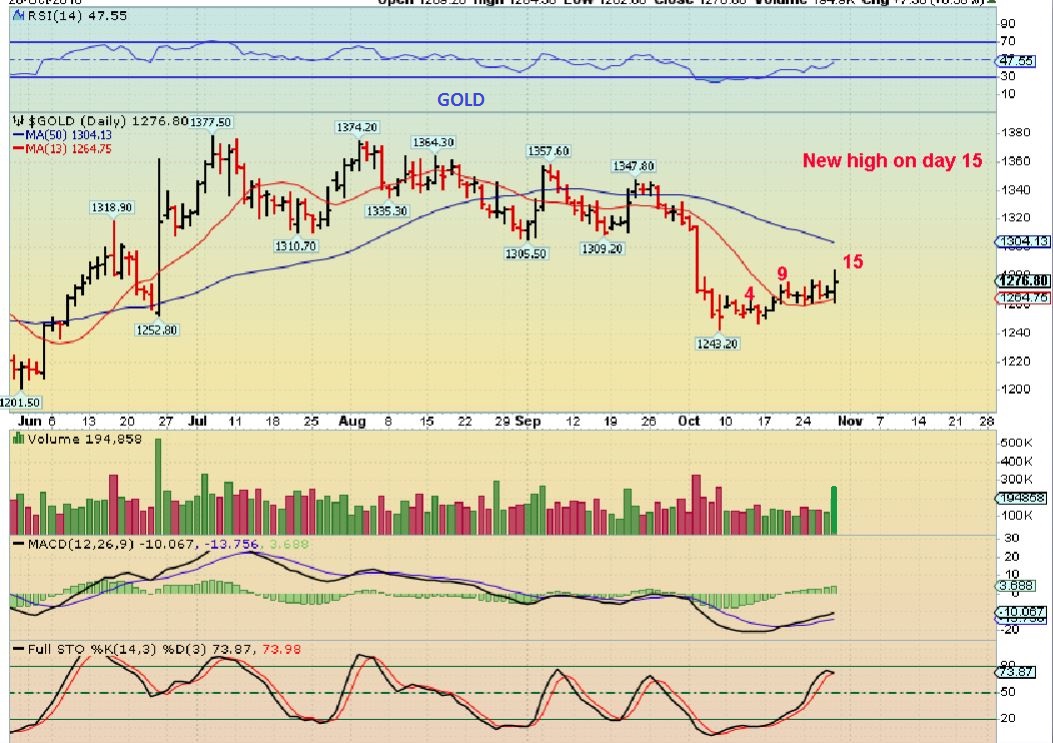
GOLD – Going forward next week, even just a little higher would be encouraging in this area. That would be a higher high on day 16 or 17, etc. If this is a 30day cycle, we want the ‘peak’ to be right side of the middle of the daily cycle. This looks very good so far.
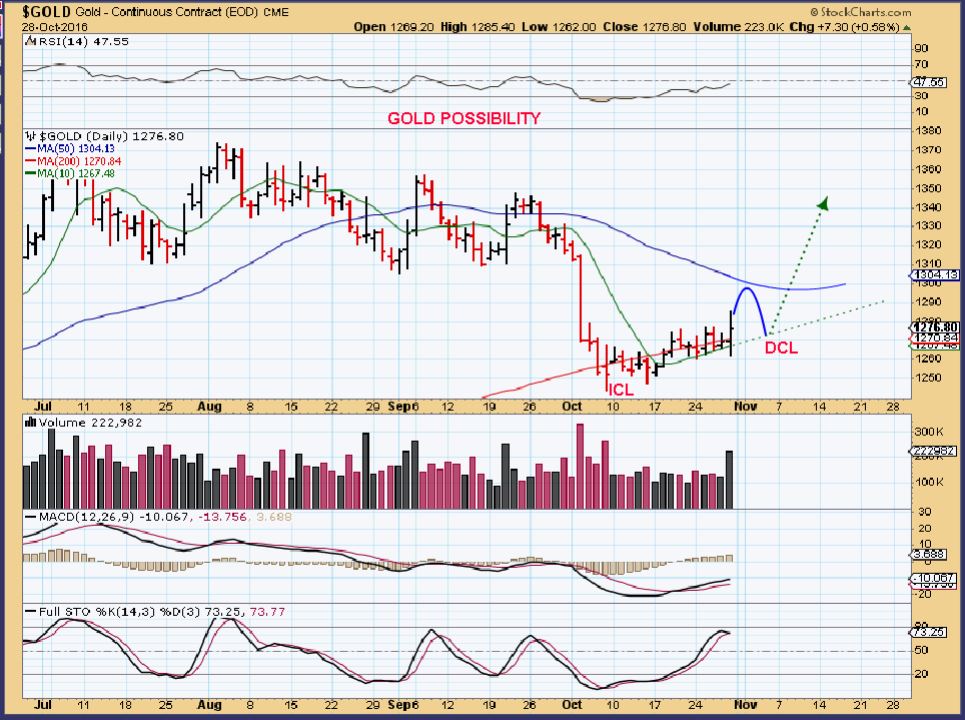
GOLD – If the dollar drops for a few more days into its dcl, Gold could actually break above the 50sma and back test at the dcl with a real sign of conviction.
(I’m just showing the possibilities )
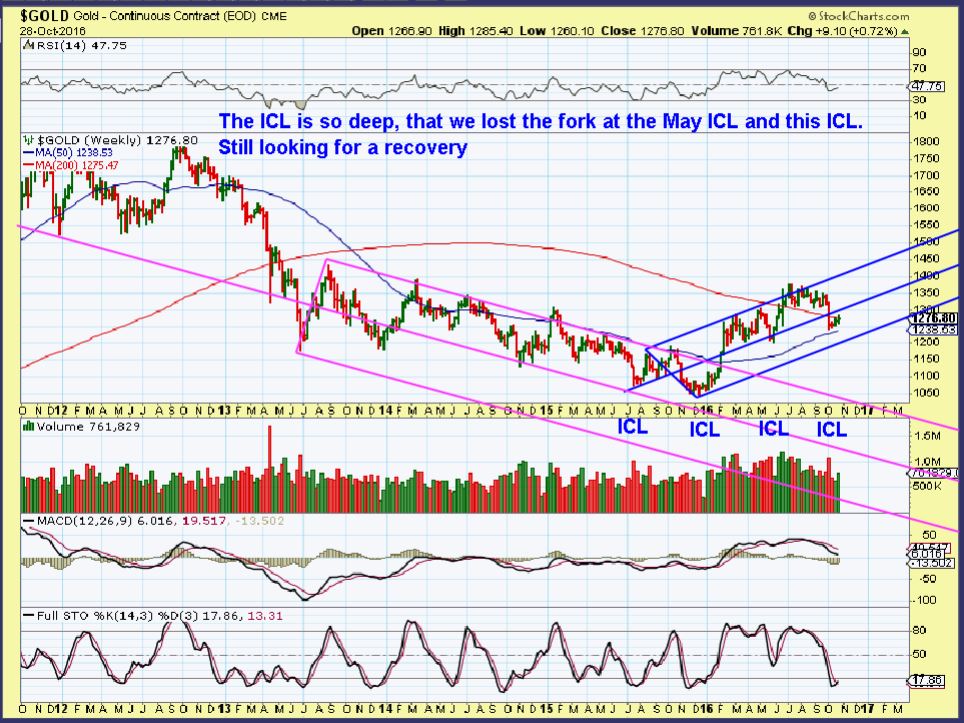
I’ve been looking for a break down in the form of an ICL and then a recovery. Still waiting for a recovery.
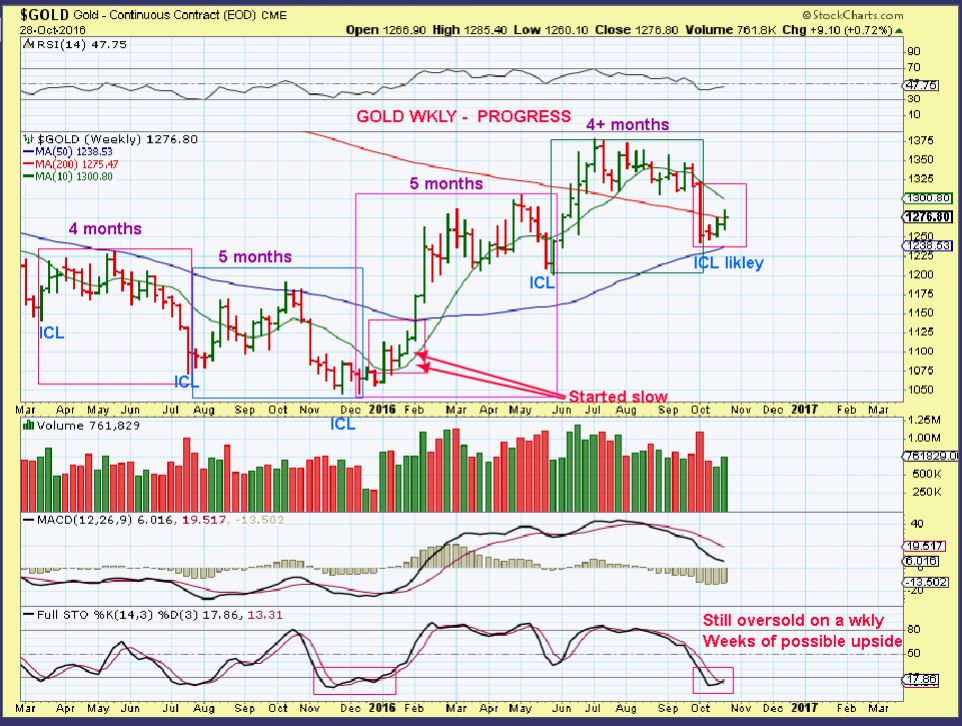
GOLD WEEKLY – Making progress. This shows the timing as 4- 5 months from one ICL to the next of the more recent ICLs ( deep lows).
GOLD – I pointed this out on OCT 7th, a tag of the 50 wk ma like we saw in 2008 could be in order.
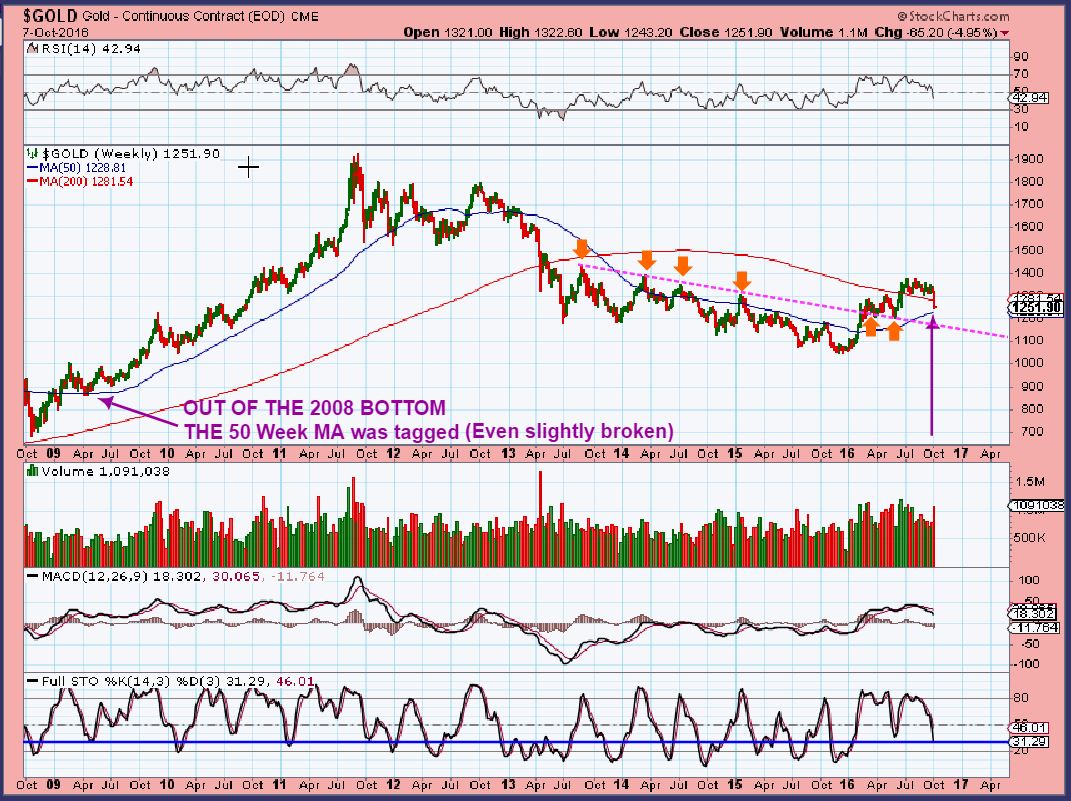
GOLD – Gold tagged the 50 wkly ma. I still hear people on Twitter, Stocktwits, other forums saying that Golds recent weakness is a sign that ‘the bear market is returning’. They need to look at the Bigger picture. It is absolutely normal so far. I see 3 phases of a bull market so far, and the 3rd gets crazy good over time.
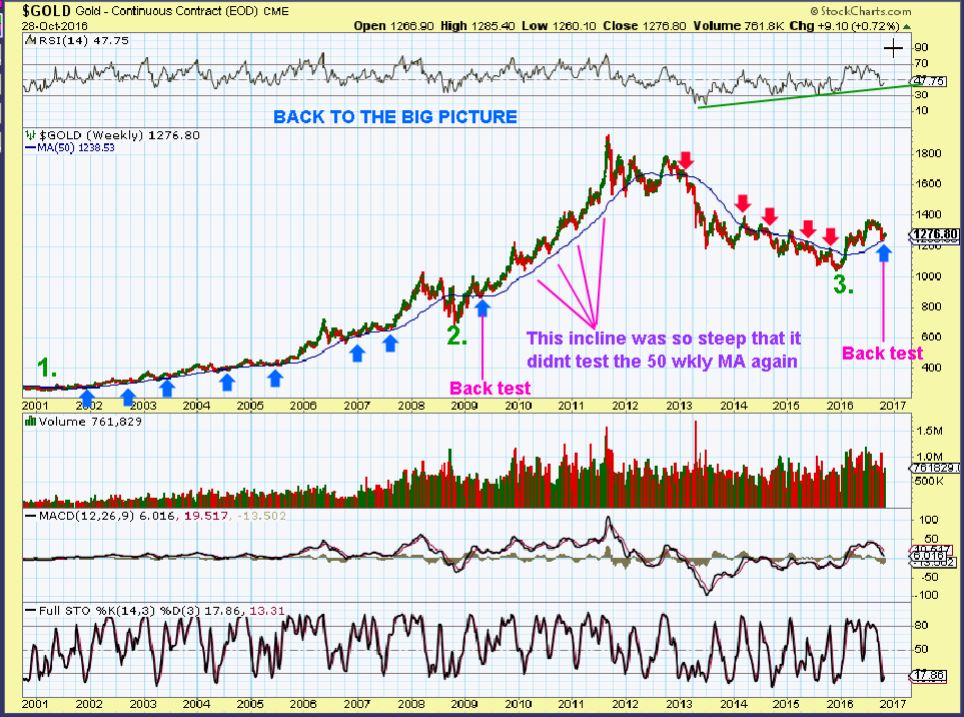
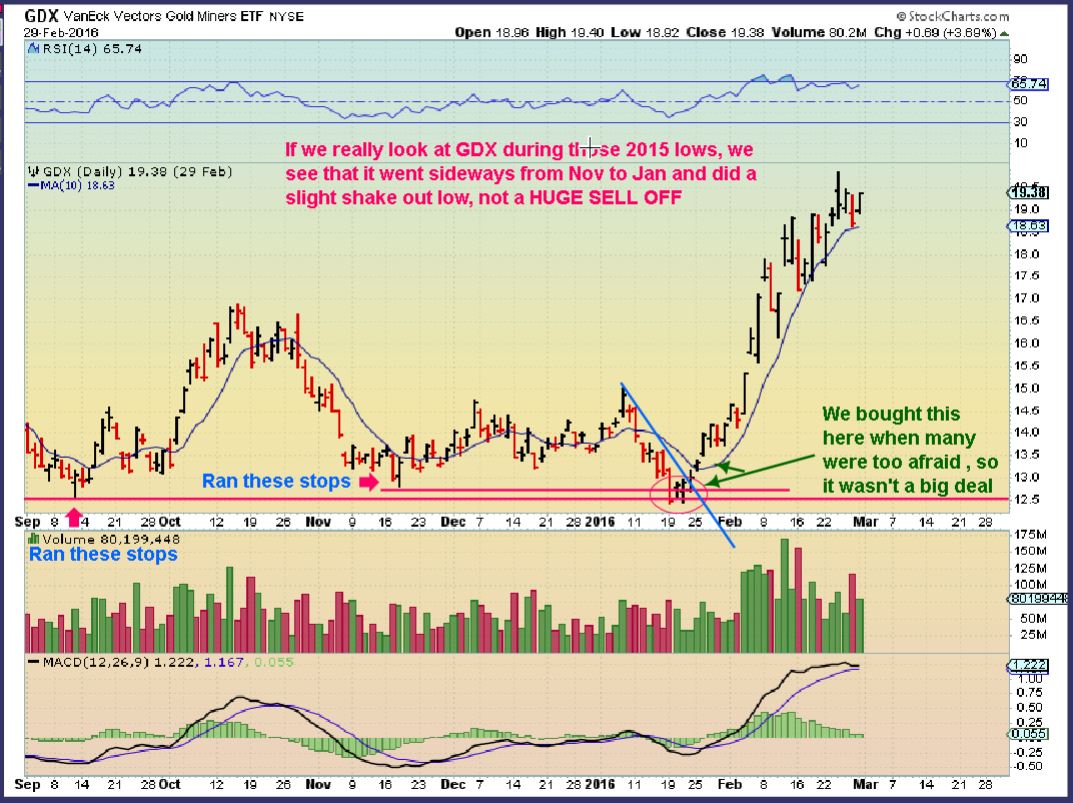
I drew this on Thursday night. Comparing these sideways lows to 2015 lows, we needed to see a pop soon if this was anything like that long drawn out bottom in Dec 2015. We might be seeing it starting as of Friday.
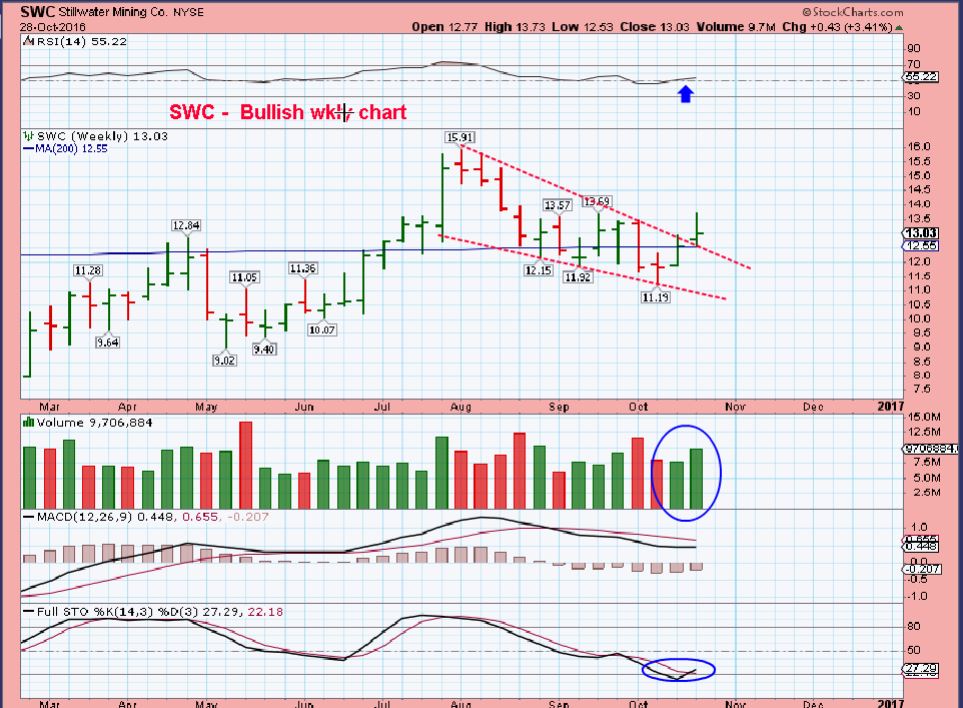
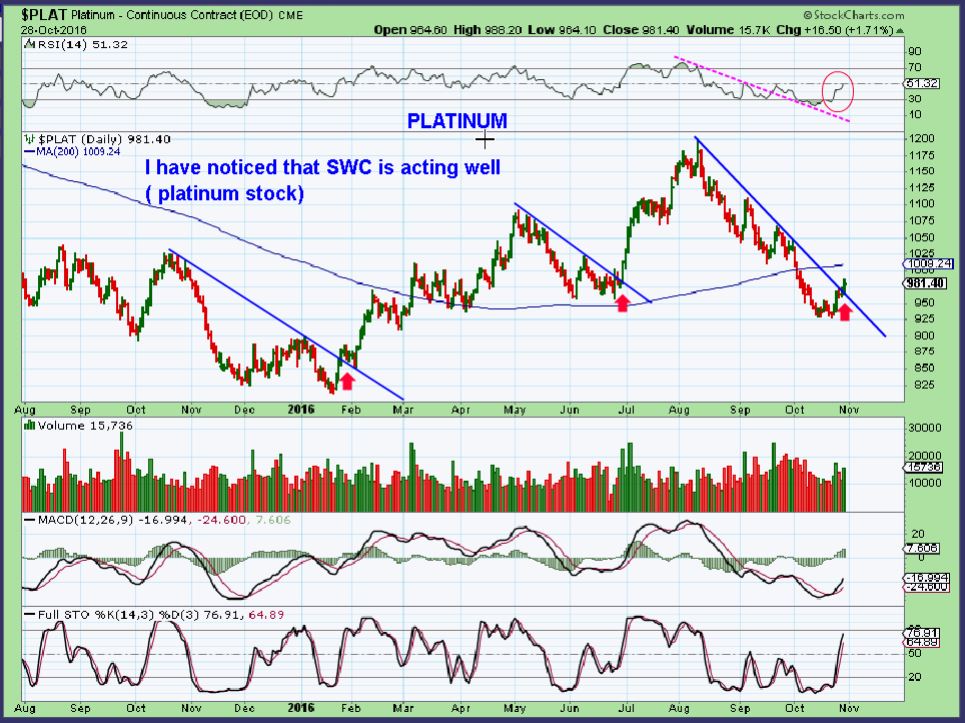
Another Bullish Sign – Encouraging to our thinking that Gold may have put in the ICL, is that Platinum has broken out. I was watching the stock SWC ( A Platinum stock). It has been looking Bullish, even on the weekly chart.
PLATINUM – Platinum is now breaking out, and that is bullish for Gold.
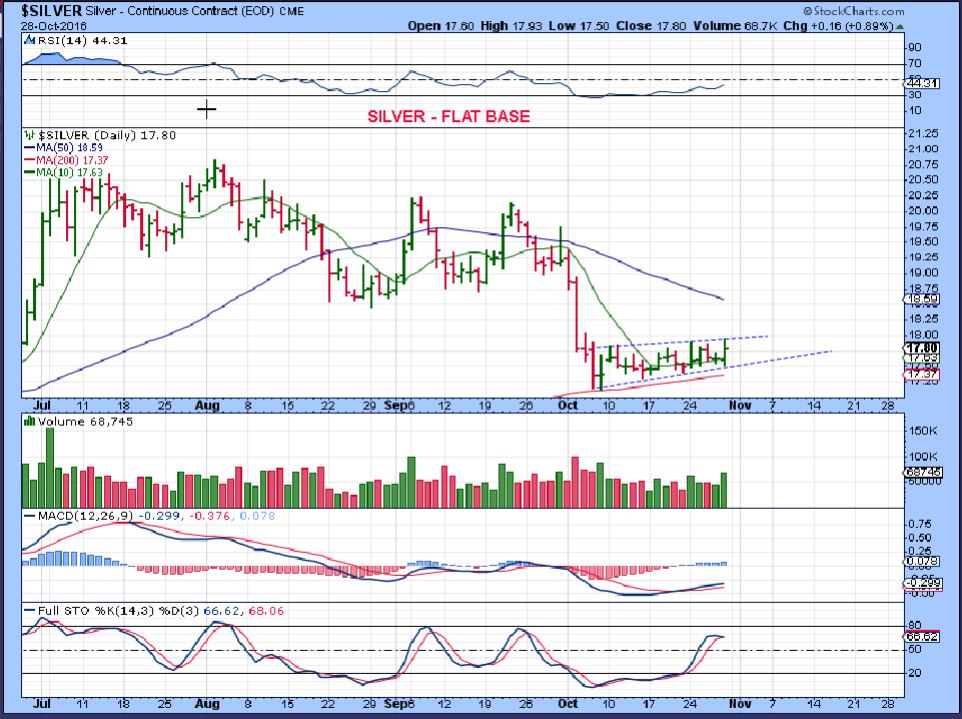
Silver is still trying to hide its intentions, but a higher high was also put in place on Friday (Bullish).
.
MINERS actually fell on Friday going into the close. I have SO MUCH to say about the Miners that I actually have 20+ more charts. I don’t think that I will use all of them, but trust me , I have been looking at just about everything to try to get some clarity. Remember that I DID get a buy signal on the Miners over a week ago using a system that rarely triggers early. So now lets take a look and see what could be happening here.
.
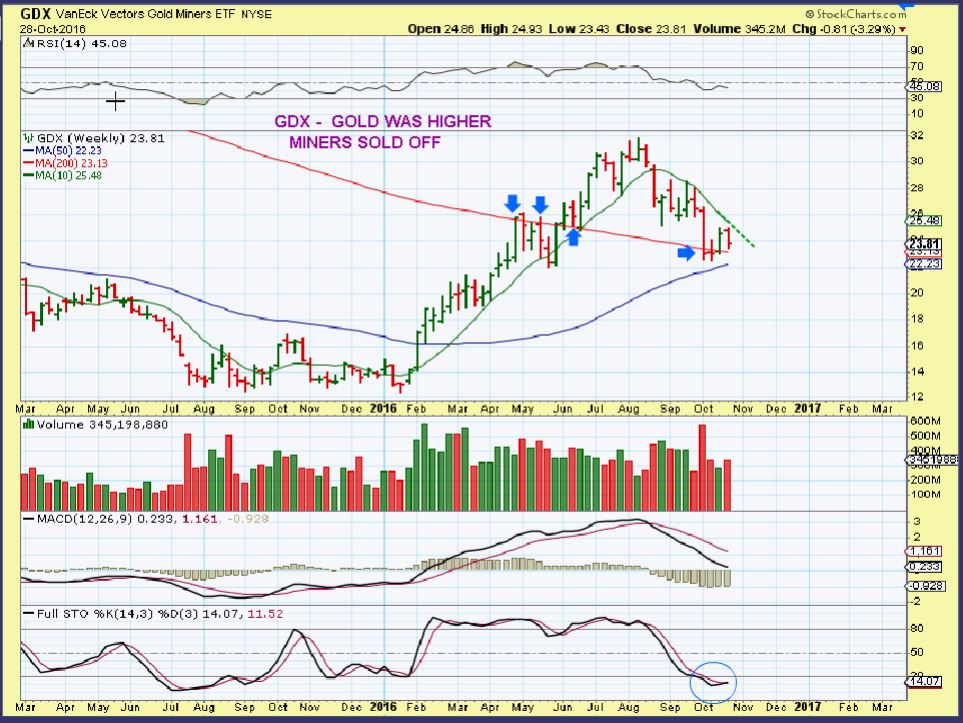
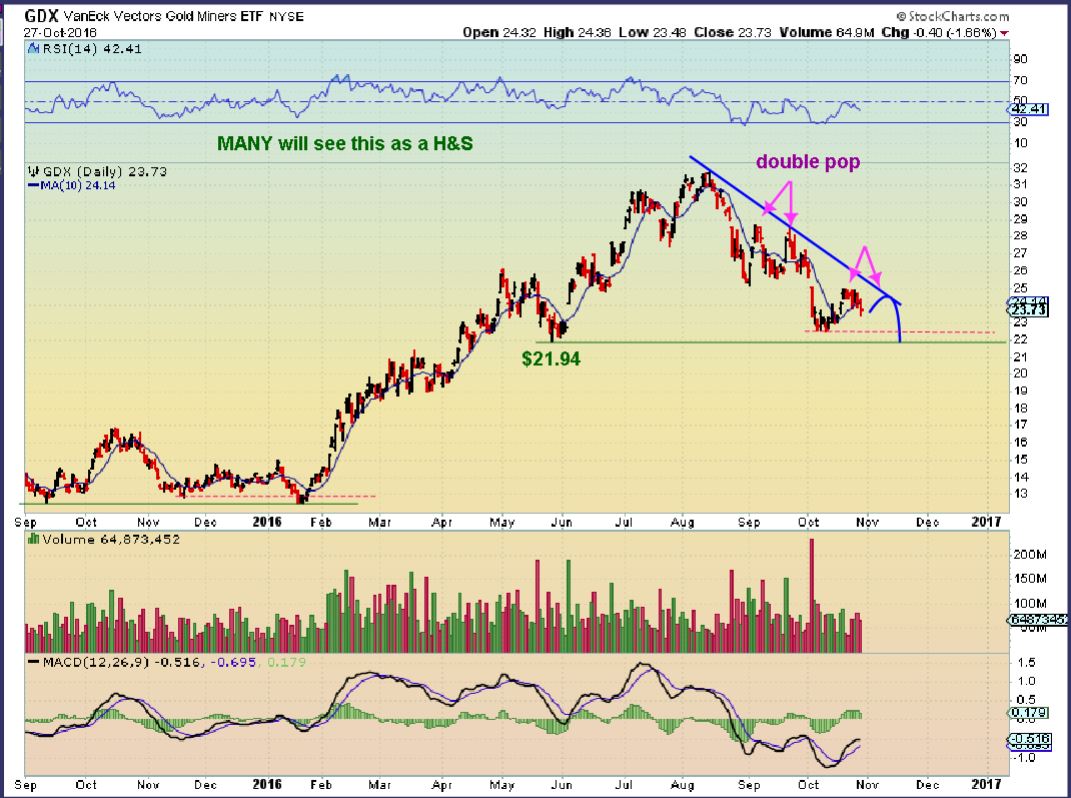
GDX WKLY – On a weekly chart, this did not break out like Platinum did. It turned down at the 10ma again and looks somewhat weak. Could this simply back test and hold above the 20o weekly ma? It did that in June after the ICL was in place. Next week will let us know.
.
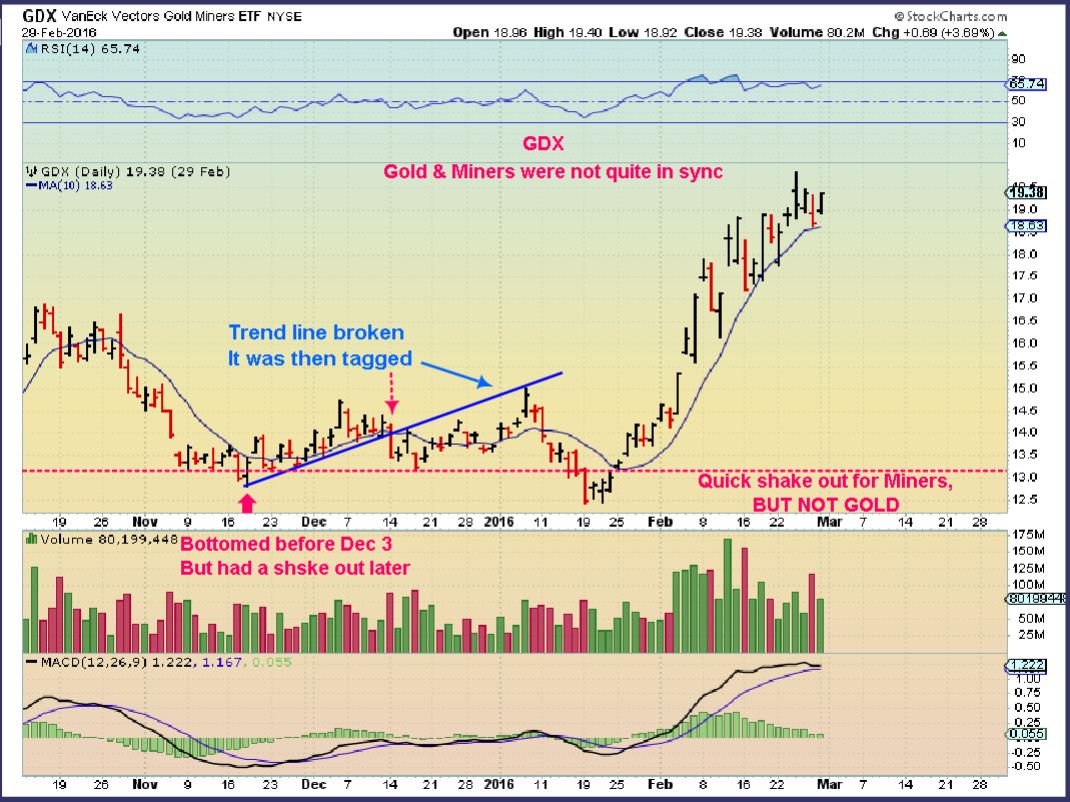
I need to start off by saying that at times GOLD & MINERS are not exactly in sync. Usually they will get their acts together and then Miners will out perform the Metals by a long shot. Right now, however, Gold made a new high on day 15 and Miners did not even come close to a new high Friday. Why? I do not know why Miners didn’t follow Gold higher, however, Gold is on day 15 and the GDX is only on day 13. I went back and looked at prior times when Gold and the Miners were out of harmony and will now share the possibilities going forward. Like I said though, Miners eventually outperform the Metals so try not to grieve their lingering at the lows, it may be a gift if Gold is set up to move higher.
.
OBSERVATIONS
.
To start: Let me remind readers that GOLD bottomed first in October. Gold made a new high on Day 15 Friday. On Friday, the Miners were only on day 13 from their lows. One could say that Miners are 2 days behind Gold. Is that significant? Maybe, maybe not, I’m just pointing it out for now.
GOLD – Day 15 from the OCT 7th lows.
GDX – Day 13 form the Oct 11th lows. We see that Miners dipped lower again even after Gold bottomed on the 7th. They then took off higher. The move from $22.50 to $24.99 was good. At this point, this chart is really not ugly .
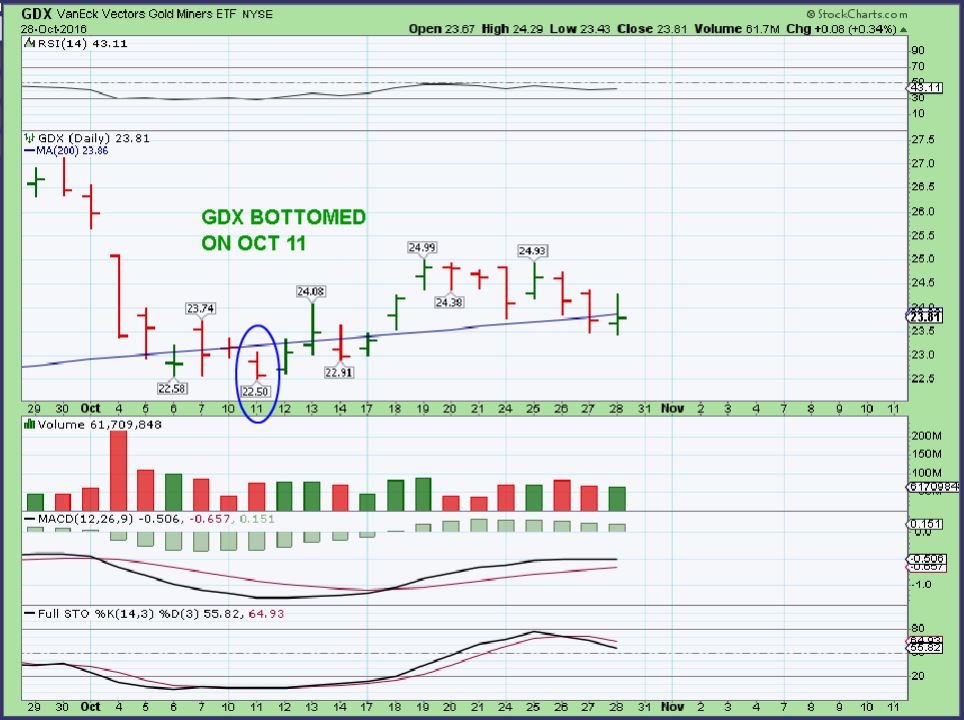
Notice how at the ICL lows in May, Miners bottomed 3 days before GOLD did. They danced a different dance around the lows then too. Gold bottomed on May 31.
ALSO PLEASE NOTICE that GOLD WENT HIGHER ON JUNE 8,9,10, & 13,14, & 15! What did Miner do on those days?
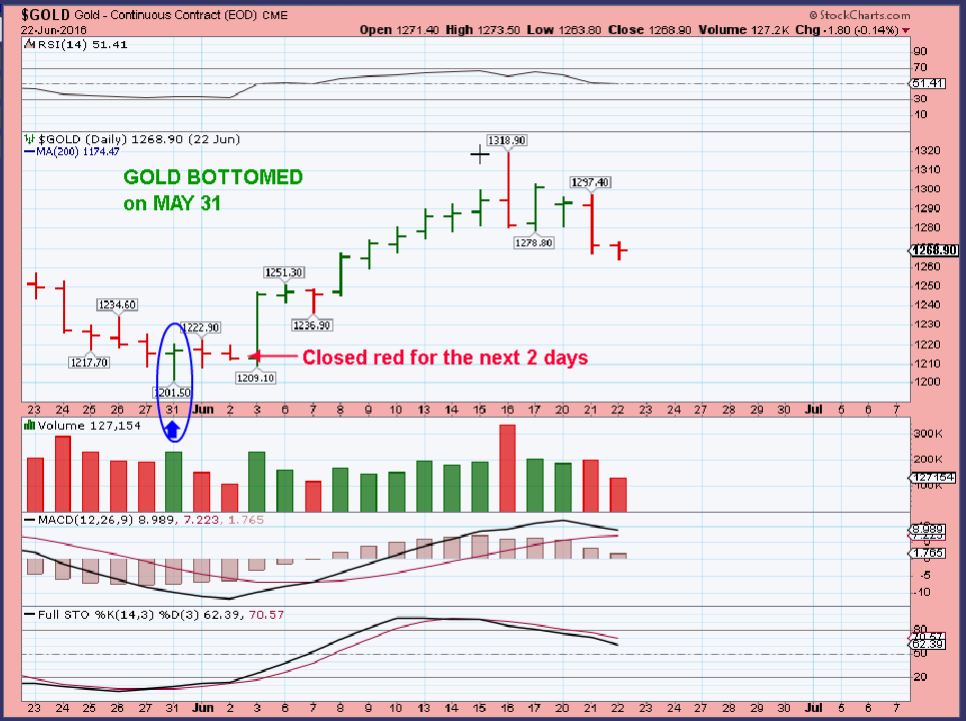
GDX bottomed on May 25. PLEASE NOTICE that GDX WENT LOWER ON JUNE 8 & 10, 13, 14! The same days Gold was Green. Both took off higher later.
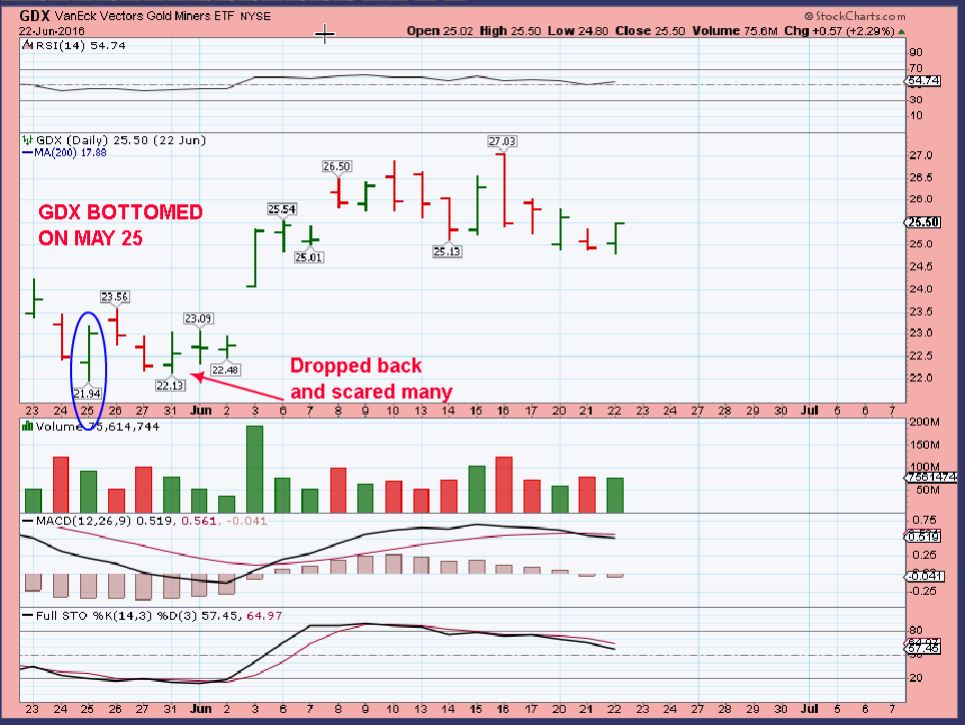
Is that Significant? MINERS WERE DROPPING FOR DAYS when GOLD WAS MOVING HIGHER. I know many got upset Friday when Gold closed green and GDX dropped into the close, but we’ve seen that before and it was nothing to worry about.
.
SO GOLD and THE MINERS are a bit out of sync, but in the past they eventually got together and ran higher, Miners played catch up and outperformed in the long run. Let’s look at more possibilities going forward.
.
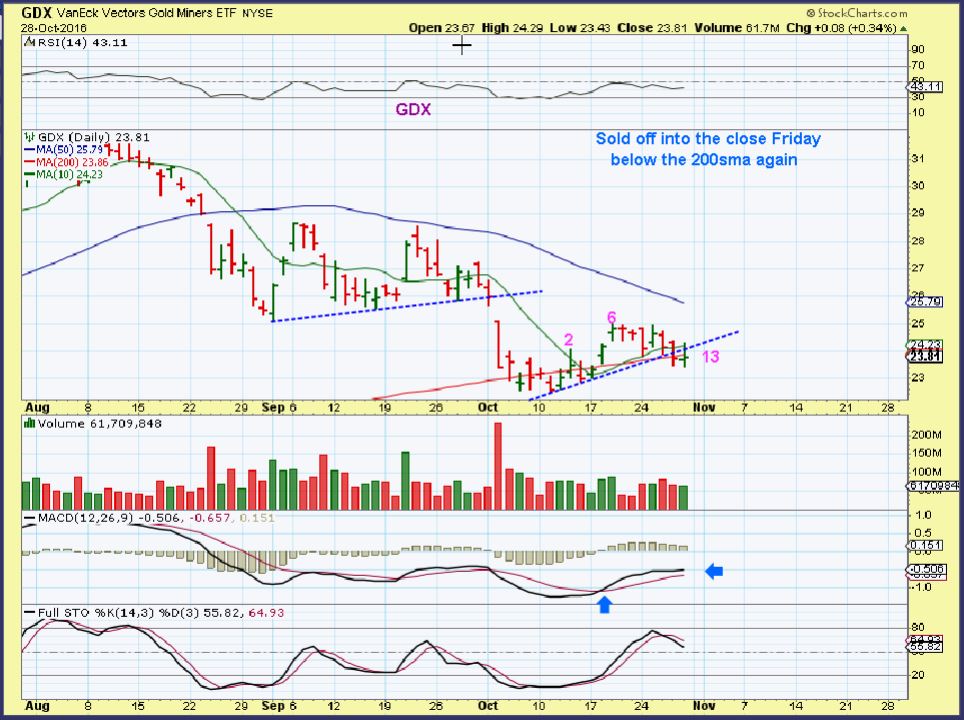
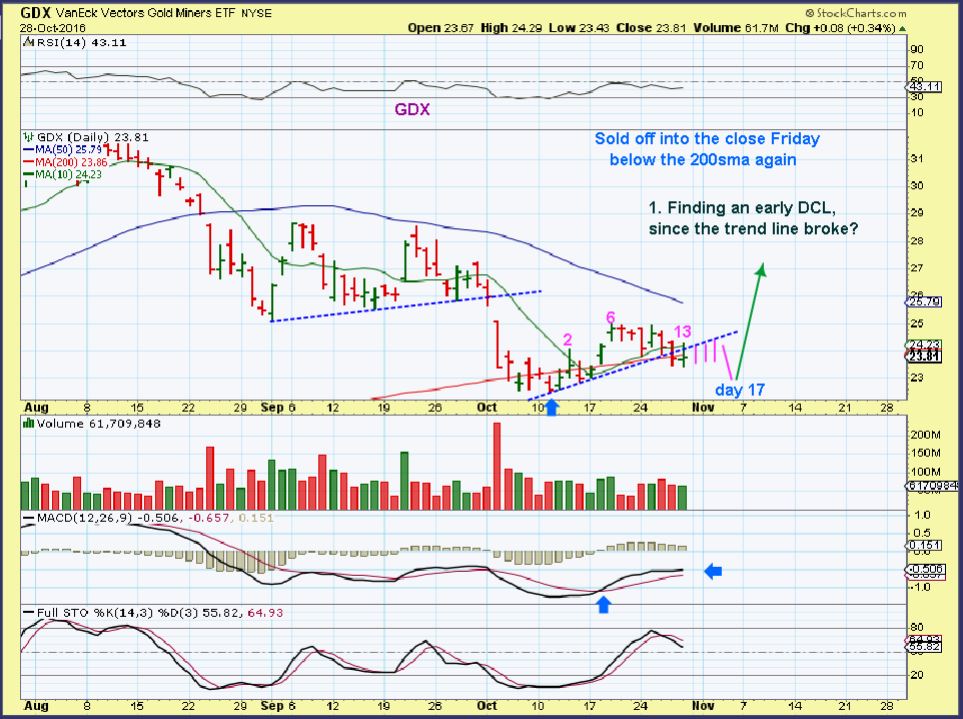
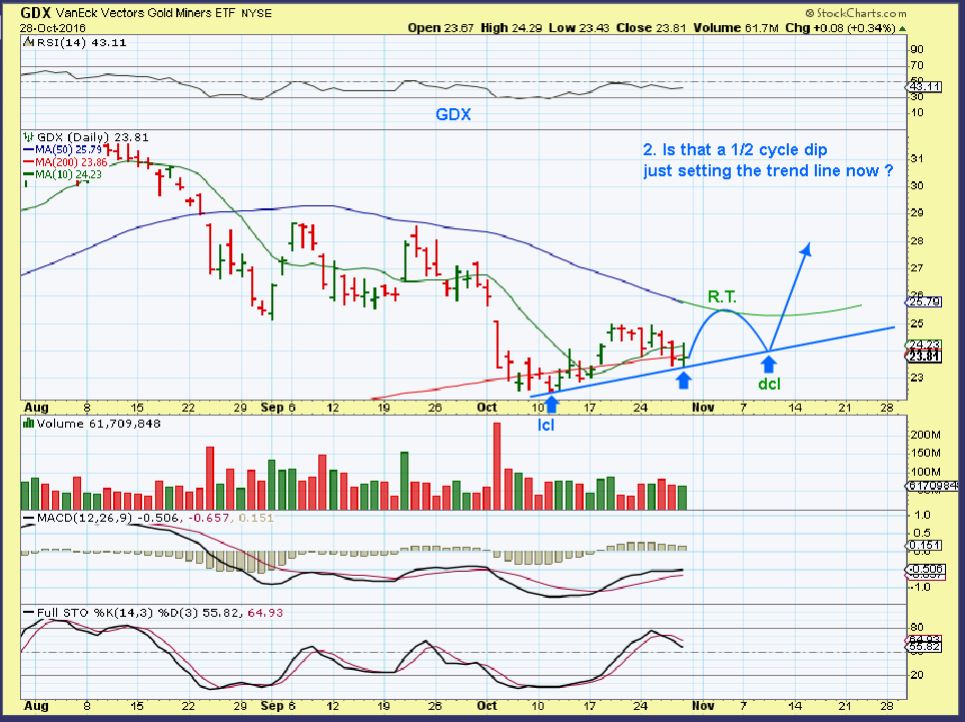
GDX CHART #1 – If this broke the trend line, it usually signals a drop into a daily cycle low, so I wrote that I might be expecting a drop to a dcl.
GDX – If that is the case here, maybe they put in a short first daily cycle and find a DCL like this as an example. I don’t care if this is L.T., as long as Gold is R.T.
GDX – Was that dip really a break of the trend line, or was it just a 1/2 cycle dip that ‘sets’ the trend line boundary like I mentioned in a recent report? Time will tell on that one.
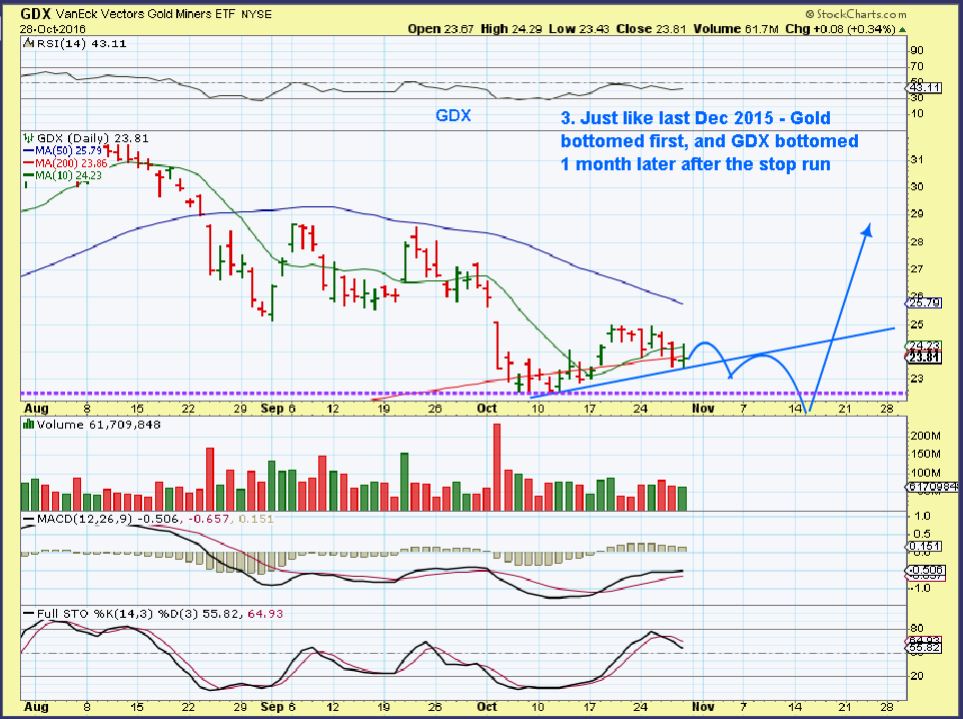
GDX – This would be the bad news, but only due to the amount of fear & foreboding that I know some would feel. This is NOT bearish, it is a shake out. I’ll tell you why this IS possible, but not to be feared. It has to do with Dec 2015 Golds ICL.
.
THIS IS JUST A LESSON IN RECENT HISTORY
.
I find this to be less likely, but if it happened before, it COULD happen again.
.
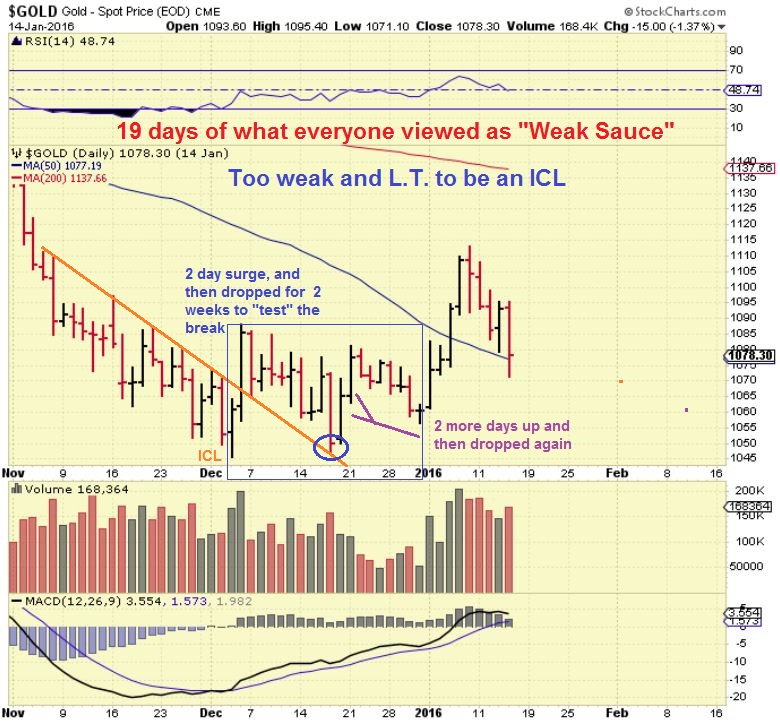
GOLD BOTTOMED and put in its final lows on DEC 3, 2015. This is my older chart from then trying to get people to buy the dip, so just ignore the writing. Please do notice that Golds lows were on DEC 3rd, never to be broken again.
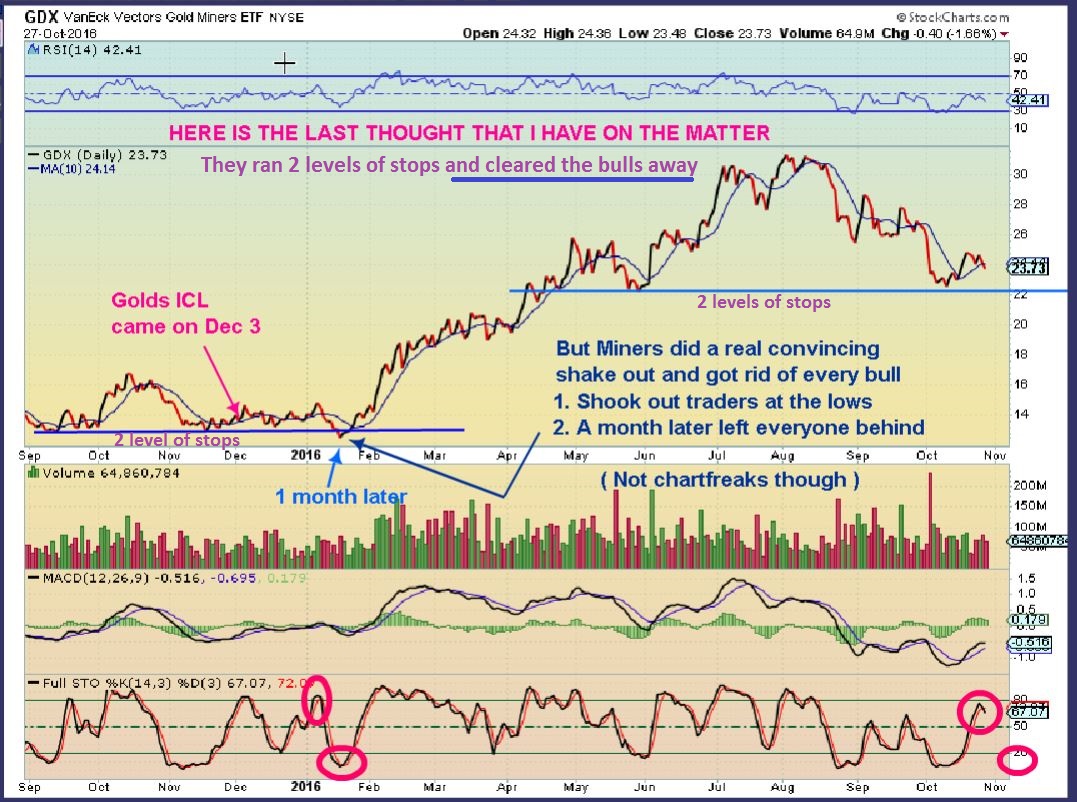
DURING THAT TIME, MINERS BROKE TO NEW LOWS 1 MONTH LATER! JAN 2016 was The ICL for Miners. It was the ultimate shake out, but we bought it here at chartfreak and many made a small fortune as Miners doubled, tripled, and some went up 700%. Lets take a look.
GDX DEVIOUS 2016 LOWS – Look at that quick dip & shake out in Jan 2016. Then it took off like a rocket! Could that happen again as drawn by me here? I never say never, but I do think that it is less likely. I just have to point out another time that Gold & Miners were out of sync.
ZOOM IN -This is how it went down almost a year ago, but lets not just focus on the quick shake out dip ( or my typo) 🙂 , lets focus on that moonshot after the shake out, ok?
.
I actually drew this on Thursday, and decided not to post it. This shows that all bulls were cleared away with a 2 level stop run. Could they do it again? I almost dont know why they wouldn’t, and they’d scoop up all of the stops.
.
I see a ton of emotions when these type of moves happen. I love these moves, I can make money of off any moves in a bull market, as long as I don’t get too emotional. GDX remains well off of the Jan Lows, but many are starting to talk about a bear market returning. They hate Miners. ‘Gold will drop below $1000’ talk is starting again.
.
If it IS going to happen, and Miners break lows 1 month after Gold bottoms like in Dec & Jan, you need to see it to be ready. If you did not see this, there would be a lot of ” I hate Miners! Miners rot! This is ugly, I give up!! I’ll NEVER buy Miners again!!” And that kind of talk comes up after we just saw some Miners double & triple in 2016. The memory is short.
Conclusion: There is more , but this is more than enough for now. When things are a bit unclear I tend to go back and research a lot of similar time periods and gather a collection of possibilities to prepare us for whats ahead. If I post too much of what I find all at once, people tend to get confused at my expectations. As time moves forward, things will continue to clear up, and I will be ready to continue to navigate the path that seems likely. Right now, I feel that GOLD is acting correctly, the USD may be dipping into a dcl, and we may see some nice upside in Gold, Silver, and Miners. That is my primary leaning at this point, the ICL seems to be in place. *This is a FED WEEK, so I just had to point out that stop run in January by the Miners after Golds lows were in place, because IF it were to happen again ( That stop run of 2 levels seems to make sense to me. It would clear the bulls out, but it is also not necessary in a bull market), we all need to accept it for what it is and focus on that stellar run higher that follows shortly after. Emotions are your worst enemy in this business! Negative emotions do affect your decision making going forward. I removed leverage this week, but honestly I think that in time, Miners will be a lot higher. In fact I know that they will if this bull market remains in tact.
.
Monday and next week should continue to clear things up. We have the Fed Mtg, and we expect no rate hike at this time. I’m hoping for follow through Monday to really ensure a R.T. Daily cycle in Gold. And for further clarity, I would love to see Miners follow to the upside. 🙂 We take things one step at a time, and we will be in greener pastures before you know it, with clear skies overhead. We just need to let the markets do their thing and tell us what our next move is. So far we spotted the lows in October, bought the lows, rode Miners higher, and now some have dipped back down. Many are still higher. All normal market action around lows. Try not to get emotional, the lows haven’t even been violated, everything is acting normally.
Enjoy the rest of your weekend and we’ll see what Monday has to offer. As always, Thanks for being a chartfreak!
~ALEX
.


Fantastic analysis Alex, and kudos for staying level headed and objective with your thought process in the midst of all the emotions coming from your subs at certain times! I know I would find it hard to cope with!
Thanks Zoli
And I don’t blame anyone, because I know that many things are happening here. Some may have waited for the break of the 10sma, and then Miners dropped, so they got stopped out or are in the red and could stop out if the fed Mtg drops precious metals.
Other say they’ve made nice gains since the first week in Oct , and they have slowly evaporated with the sideways dip action.
It’s not easy when we try to gauge a DCL based on our trading account action, but account action doesn’t tell the story. It’s really all about the charts and the possibilities going forward. After that shake out in Jan 2016, it was a moon shot, and we dont want to be left behind or locked out afraid to chase if it does take off.
So I understand the ‘feelings’ when we get red days, but when I look at the charts – I dont see dreadful things ( at this point). SO I am just trying to re balance sentiment here : )
Alex, that is such a good point. Our trading accounts do not tell the story but when we look at them all day we become hypnotized. Sometimes I can’t see the forest for the trees in my own account.. Thanks for the clarity.
Thanks for the Sunday report, and the pep talk.
good stuff CF….thanks ‘cupcake’ hehe. hope u had a restful weekend.
oh..and …
ps. i would love to see your extra charts & analysis … confusion is good exercise for those tiny little men in my brain who threaten to take the bridge when the going gets tuff…. they need discipline! 🙂
sincerely,
Ima Sponge
https://uploads.disquscdn.com/images/791b1dca2715fc929460af355b2cf79d16f154cbc3125baae3665c26fd56e2b5.png
Believe it or not, That looks like my wifes cat.
#IknowThings
One of the charts was just this reminder that I posted on Oct 18th. This was a textbook pull back.
.
https://uploads.disquscdn.com/images/0d33ac6a5f8e62bfc2d3cc1e08504040ed567ff0c9d2167868d9a2f314bd3bfb.jpg
Niccccce ….
Hi Alex – Thanks so much for the detailed analysis. A couple of questions – I know you had mentioned that there is still a chance that we may have a ICL still. If that happens, GDX could possibly go down to 19. Do you still see that as a possibility ? If not, as a long term buyer, can I buy GDX with a stop at 22.5 ? Thanks
Hi Goldsa,
The $19 target was an A-B-C-D target, that may not play out if we do have an ICL in Gold. Fridays higher high in gold was increasing the chances of this playing out more bullishly.
You can buy with that stop as a long term trader, but there is still the idea in the report that just like in the Dec 2015 Gold bottom, it never broke those lows again.
Miners for some reason slightly broke their lows a month later. If that repeats…?
It would be similar to the possibility that we have the ICL in Gold now ( lows do not break) , but miners just do slightly break that recent low (Which was 22.50). You will be shaken out and it may just recover quickly & run higher like we saw in Jan. ( Not drop to $19).
So as a long term buyer, it is reasonable, but I might wait and see what the Miners do from here just a tad longer. They dropped with Gold higher Friday, see if they keep dropping, to get in lower? Will they go higher if Gold does go higher going forward? Or You can buy the next DCL when we get a pullback at the end of this daily cycle. ALSO – This is a FED WEEK, and that can get jumpy.
I guess I’d give it a little more time, but I jumped back in a bit with a tight stop Friday on the intraday reversal, so who am I to talk? : )
Thank you very much, Alex. Your explanation helps a lot. I will just wait for a tad longer. Thanks
Good morning everyone!
Good Morning!
Good Morning! It’s beautiful outside today where I’m at 🙂
Beautiful here too in Florida and the horrid heat seems to have broken finally. Liked your artistic postings this weekend. Cute images.
https://uploads.disquscdn.com/images/06c4790d72079ce2da0424e67654c7204eb92f326239ebee9c4b6236c5df1a60.png
cute
MEMP down by 50% anyone still holding?
Ouch..
I’ve personally been out of energy stocks for over a month stalking the Miners I hope others are not in it : (
I didn’t notice it until you mentioned it, but It also dropped last week quite a bit .
I do see people still trading the smaller junior energy stocks, still an area that one needs a basket or small position sizes.
some are ripping up 100% others cut in half.
Youch. I removed that one from my watchlist back in June when it failed from the May lows in crude. Good thing. I got burned enough on juniors prior, I won’t touch the stuff now, the risk/reward isn’t there for me. Esp now in earnings season.
If anyone is into TRX you might want to read their story. I was going to read a good book of intrigue last night but, like they say truth can be stranger than fiction so I enjoyed an hour or two digging through this one. I even found a google earth shot of the “mine” that appears to be not operating. There is a huge short interest of 11.5 days so maybe it is a giraffe neck candidate from short covering if it gets caught up in a pop with the rest of the market, but it could be a bk candidate too.
Thanks for the info! I was just studying that chart in the past few minutes when it ran up to .74 and back down again….
Hi R.B.
I’ve read their story in the recent past ( Last spring & Summer) with the locals trying to take over thier mine in a case somewhat resembling pirates, but I do believe that that issue was resolved. Is that the Mine you are talking about? If so, what date was the story you were reading.
The last thing that I read was that they were prepared to defend their property with force and they had resumed mining.
I need to go back and do a bit more reading, but I dont have time this morning.
Maybe next weekend
They are not really mining per se, although they are set up to do so and they have extracted some ore, but they have not been in Commercial Production. They have a rinky dink little milling machine that appears to be portable and you can see from google earth that they have some ponds dug, presumably for leaching, but the person who commented on the picture said it appeared to not be operating. They had mined some ore and then the government forced them to smelt it and it came in with anemic grades. The drill results look great with some intersects well above 10 oz per ton, so they may be sitting on a monster, but the accumulated deficit will cause them problems. They are way behind in paying bills, but did just manage to get a 5mill loan, so maybe there is hope. Someone must believe in them. There are a few of what I would call accounting or business anomalies between the CEO and the company. It would take days to understand the true story, but to me it looks like an asset that will end up in some one else’s hands. With that level of short interest I am watching it close. There are numerous links to stories on Marketsmith if you use that chart service. I read the 10Q as well.
Yes, this is Jim Sinclair, and it is an exploration company at this point, I believe.
Some Exploration companies spend money to find Precious metals on acquired land and then might sell the land for large profits if they can prove its value through drilling samples, etc . They also may set up to become a producer. Depends on management and funding I imagine.
Yes it could end up being a winner that way, I just found lots of quirks with it along with the huge short interest. But is has had some great action.
Excellent Report Alex !!!
Thanks for the the “Sidenote”, couldnt agree more ! Needless to say. 🙂
Thanks Ken,
Charts look normal so far, today several even looked better.
Looks like there will be some good energy buys when oil finishes its cycle and starts back up! And by that time most
of the companies should have reported earnings so we’ll have good financial info on them
Agree Tammie !
Started “nibbling” Friday and today……. 🙂
I am looking for a bottom to the current wave 4. I will play that coming wave 5.
I just recently started trying to study EW again….does wave 5 usually have a certain % fib retrace up from one of the other waves? Does that question make sense? 🙂
This is what I am looking at Tammie.
62% Fib today. Buying USO Calls at these levels. 1/2 tranche, in case it opens down tomorrow I will add the other 1/2 at that time.
As soon as USO has a daily swing buy will buy 2nd tranche.
Stop below blue II.
Hope that helps in some way. 🙂
https://uploads.disquscdn.com/images/24ff6008222f7debf555d4ceabf9284bb21fb86d8d3bc069fb5208aa464e6ba6.png
I didn’t realize we were so close. I’ll need to pay more attention to oil. So you are looking for v of 3 then a wave 4 intermediate decline likely?
Yes although If USO breaks the blue ii my count is wrong.
As Alex stated above …. a possible DCL is due soon which is confirmation for the count. Risk reward is good enough for me, but I have been wrong before so…….
Thanks, Ken! Studying on this tonight! 🙂 https://uploads.disquscdn.com/images/8423e1ac05e44b3c7ce338d1c4ea971a5d74dcbc0daeee304f64e6eac6d80a64.png
Around 6% risk at current price. Or at the TL support break which would be around a 2% risk…….
Here are some earnings dates: Timmins Gold (TGD)
reporting on the 3rd at 11:00 a.m. EST, B2Gold (BTG) also on the 3rd
at 1:00 p.m. and Klondex (KLDX) on the 4th at 10:30 a.m.
So far today, my indicators look decent, but my stocks are only up about 1%. Thus, not much excitement here.
Ego reported last Thursday and did fine Friday, getting tossed today.,
Been watching GDX to see if it could re-gain that 10sma. It just regained it, but will it close above it ?
Today we were seeing Gold slightly down all morning, Miners moving higher ( For those on Friday that were disappointed when Gold was up Friday and GDX sold off into the close).
GDX had a really solid day but baby miners didn’t do crap. So, yeah I wasn’t up much today. Not really sure why. But being only 1 day, not reading too much into that.
Gotta leave so I bought NUGT 13.60 as I think it might close above the 10sma
Alex is there any chance this is an ICL that oil stocks are dropping into? (so happy to have cleared out of all of them near the top)
I finally sold the last of my energy last week. I missed the tippy-top of OAS by 40 cents but by today was really happy I had sold!
https://uploads.disquscdn.com/images/109be03aa5ab30e7a44bfd28d2a49e4220b8a27ea4dc20d97aca2a199f740a60.png
Yeah, OAS worked out for me. I was early. WAY early back in the summer but held on when we spotted crude oil lows. Added to Lower price point, sold options on retracement, long calls on confirmed DCLs. Ended up +17% plus options premium. Point is with CFs help and position mngmnt you can turn it around sometimes!
Anyone see anything about AXU that would be pushing it down when so many others are going up? I haven’t found anything….?
Interesting steady rise from $Gold into the close.
Alex, it looks like GDX is going to finish about the 10 dma. Does that mean we are good to go? Nice rally in my stocks in the last hour.
It isn’t a ‘good to go’ signal, but it is a bullish set up.
For example, If you look back at September , GDX closed above the 10sma twice and gave it up, but todays move leans bullishly going into the Fed Mtg Wednesday ( I don’t expect any real surprises Wednesday) and in other areas it looks pretty good..
I’ll cover more in the next report.
Nice report Alex