Friday October 28
Well, you know the story. I don’t usually plan on doing a Friday report. Thursdays report can usually cover what could happen on both Thursday and Friday. We are specifically focused on Gold & Miners , so we should discuss that area a bit before the weekend. Let’s start with the $USD.
.
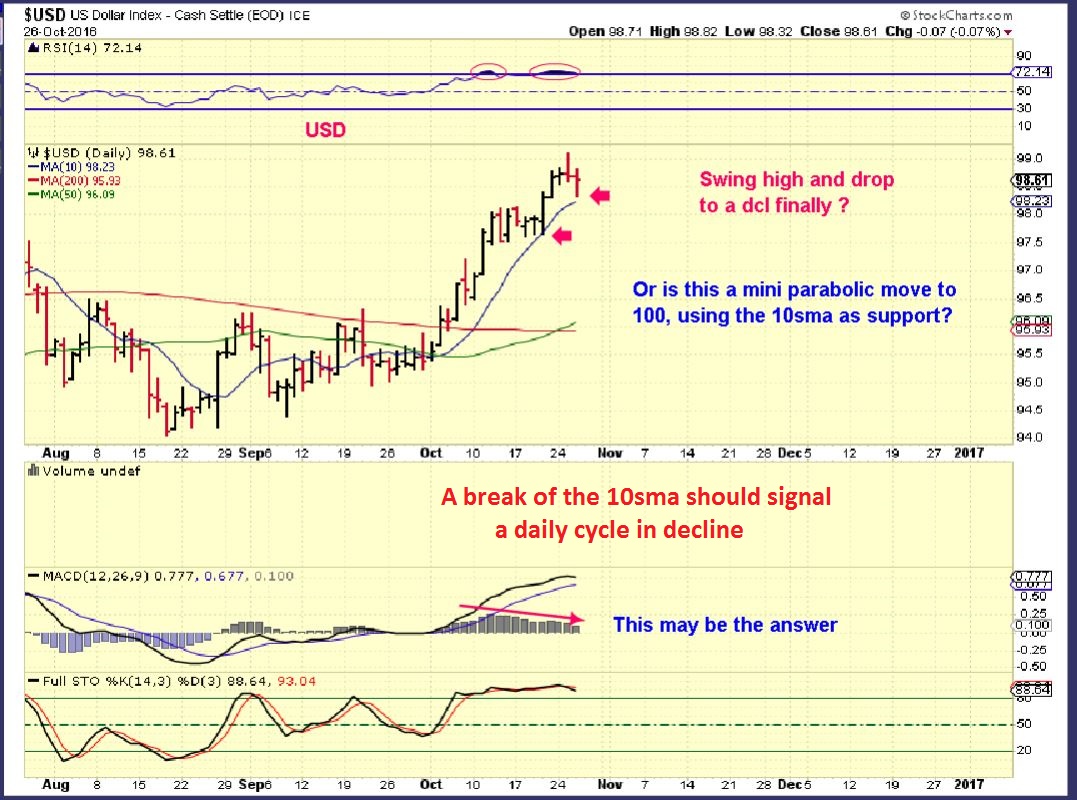
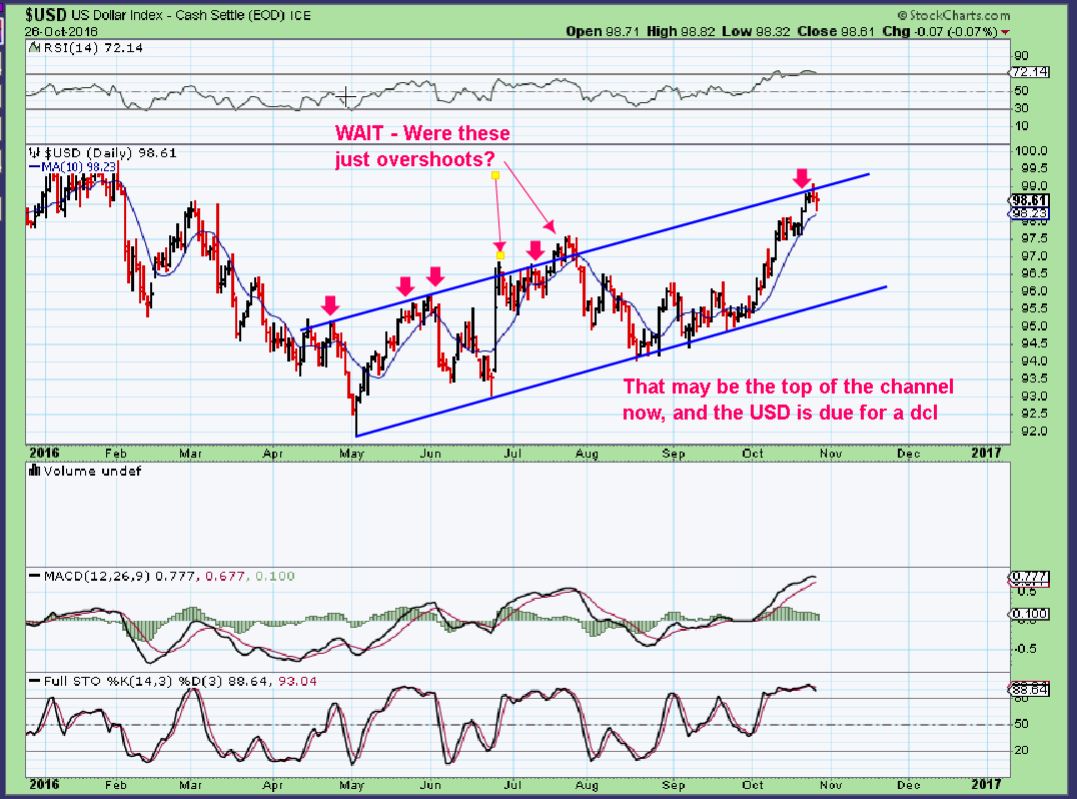
USD Oct 26 – Would the dollar drop into its Daily Cycle Low, or would the 10sma act as suppport? It is overdue to dip down.
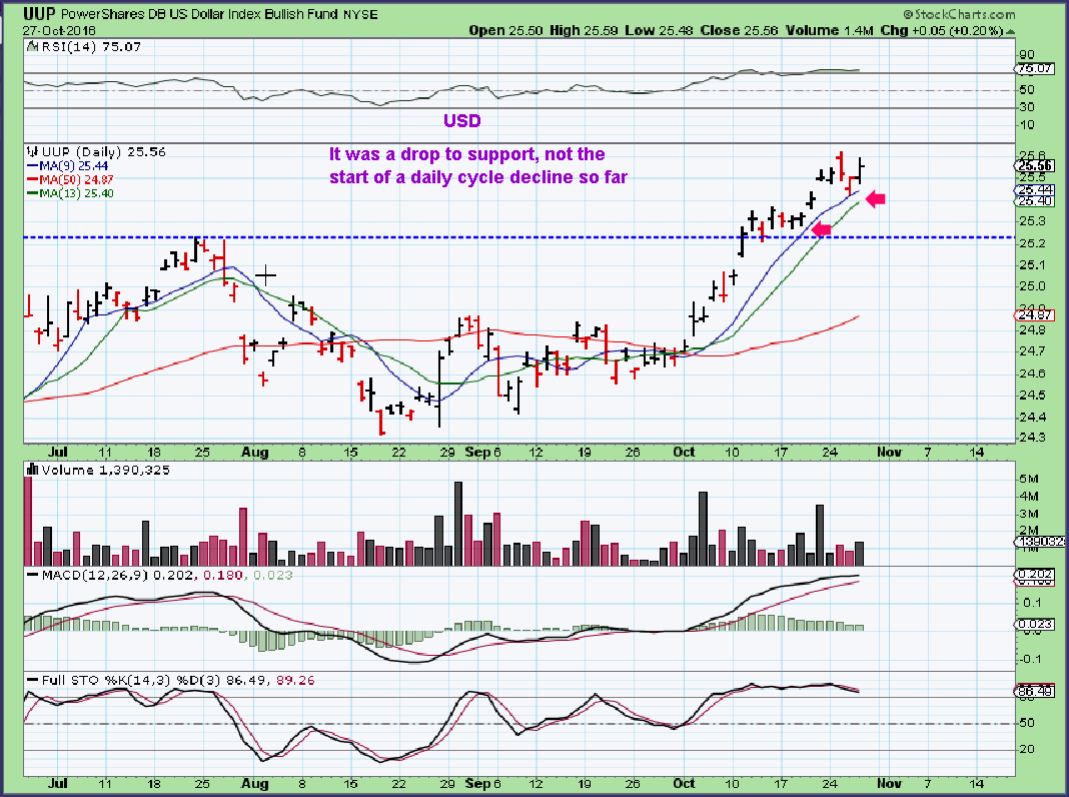
USD Oct 27 – It DID use the 10sma as support so far. This Daily cycle rise is longer than normal.
EDIT : It is now 8:23 a.m. and I want to release this and haven’t proof read anything. I will have mistakes and go fix them now, but please excuse the ones that you find 🙂
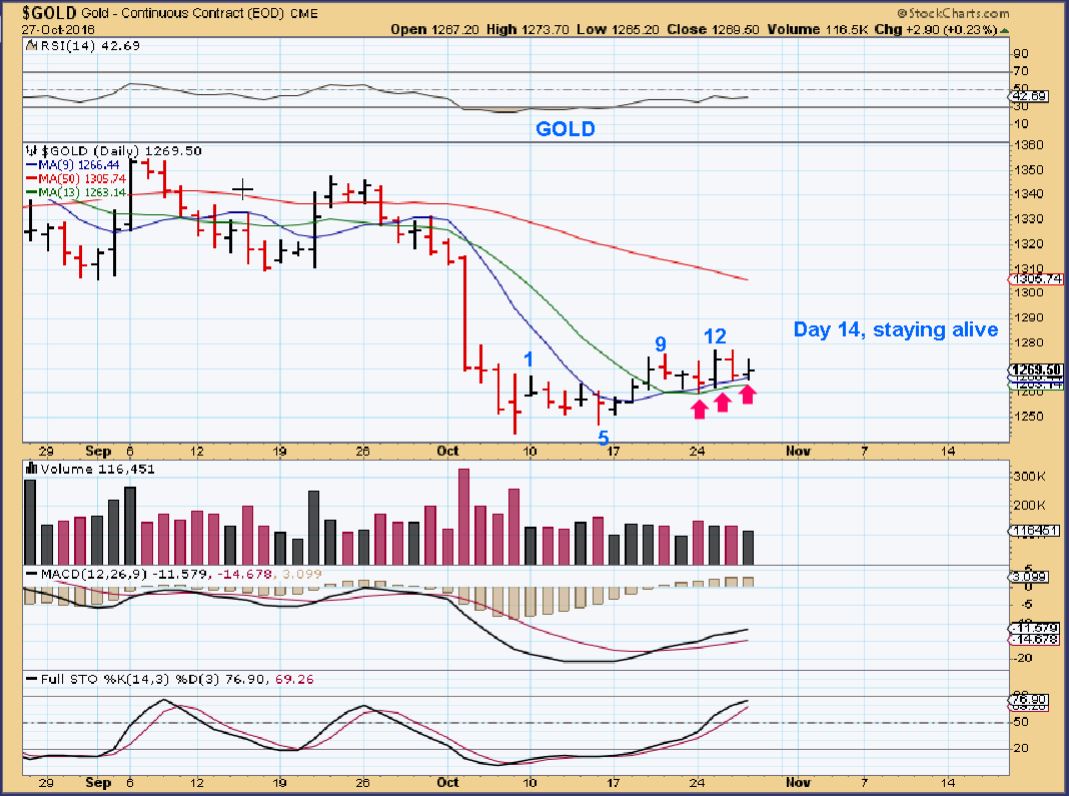
So I pointed out yesterday that this still could be a topping point, and we need to watch the USD. Gold has resisted breaking through the floor (lows) with the Dollar rising. If the Dollar dips down, I would expect Gold to at least pop and then drop into a dcl, hopefully a higher low.
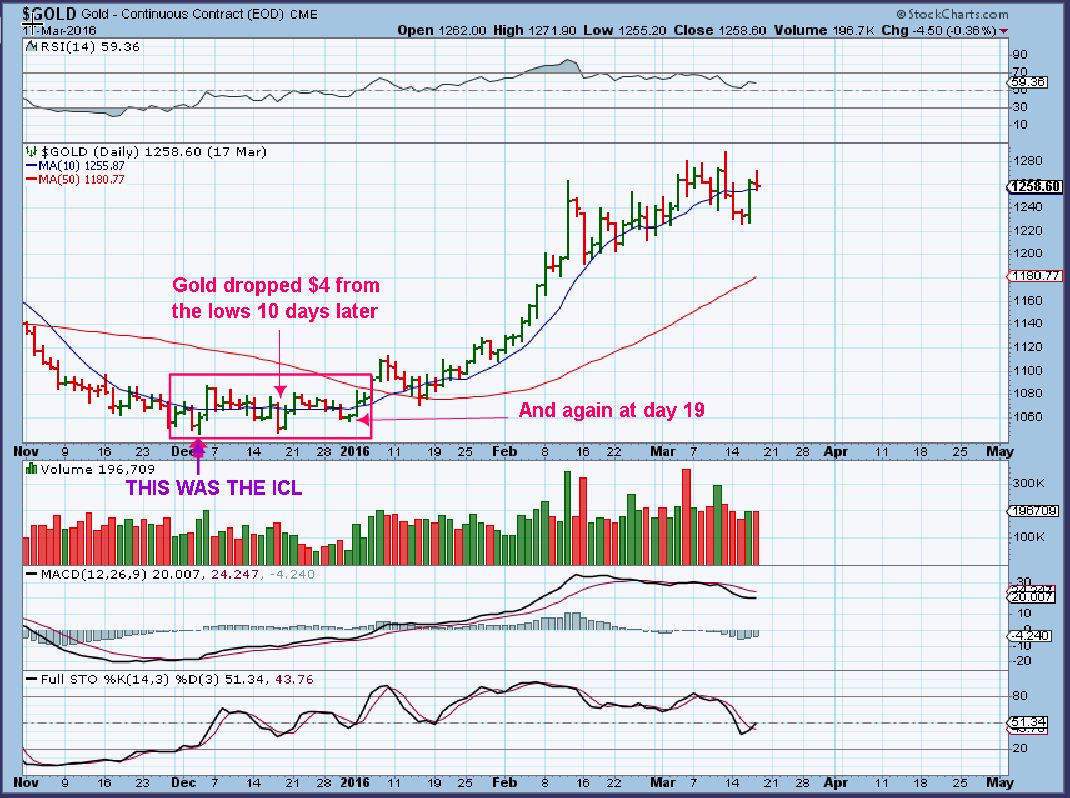
GOLD – Day 14 and Gold is staying alive above the 10sma. As seen in the Dec 2015 ICL, If the ICL is in place Gold doesn’t always rocket out of the lows. Gold can just go sideways for a month, testing the lows and testing our patience and determination. Yes it can. It also should be noted that it can drop into a lower low as a final dip into an ICL.
LETS EXAMINE THE GOLD DEC LOWS – This was not easy either, but notice that it finally took off AFTER DAY 19. It shot higher and then dipped again. THAT was a buy.
Could this crawl along the lows be happening now too, as the USD climbs higher? I think that it could be happening, and I will focus on that in the Weekend report. I sold 80% of my leveraged positions ( JNUG) , because timing is getting to the average mid point of a daily cycle. Sideways moves are also a bit decay prone. I can sell the rest on either a Pop or a Drop. Lets take a look at Miners.
MINERS
.
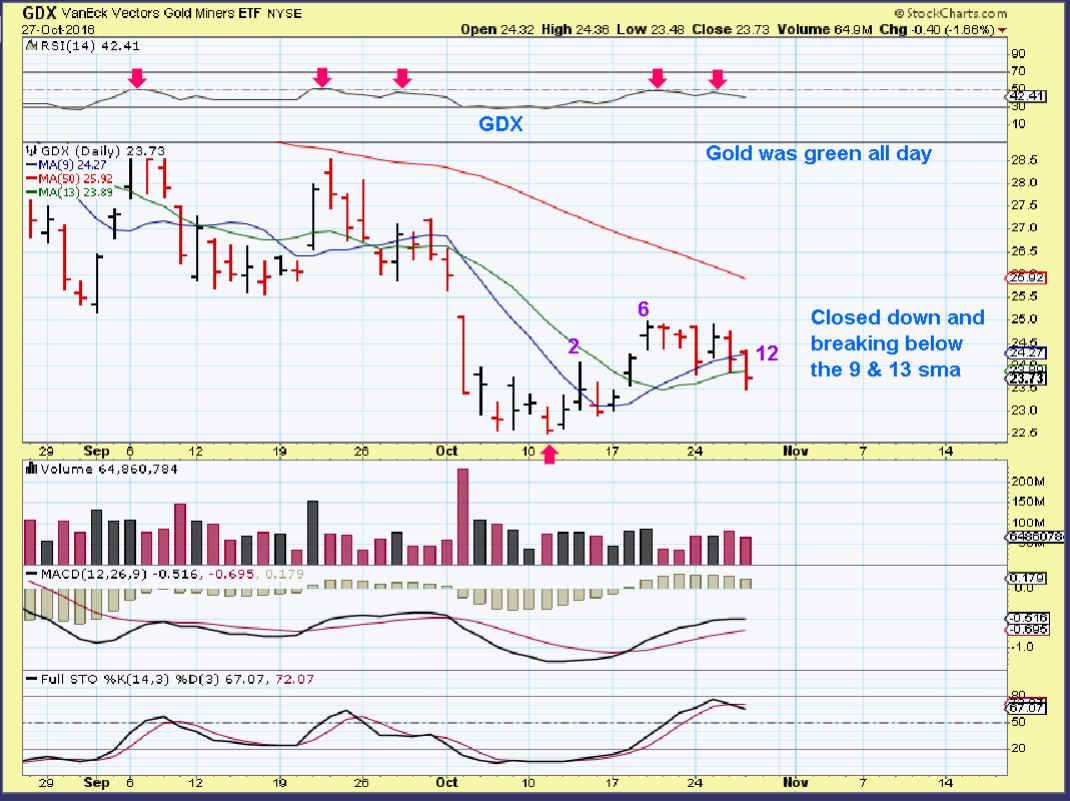
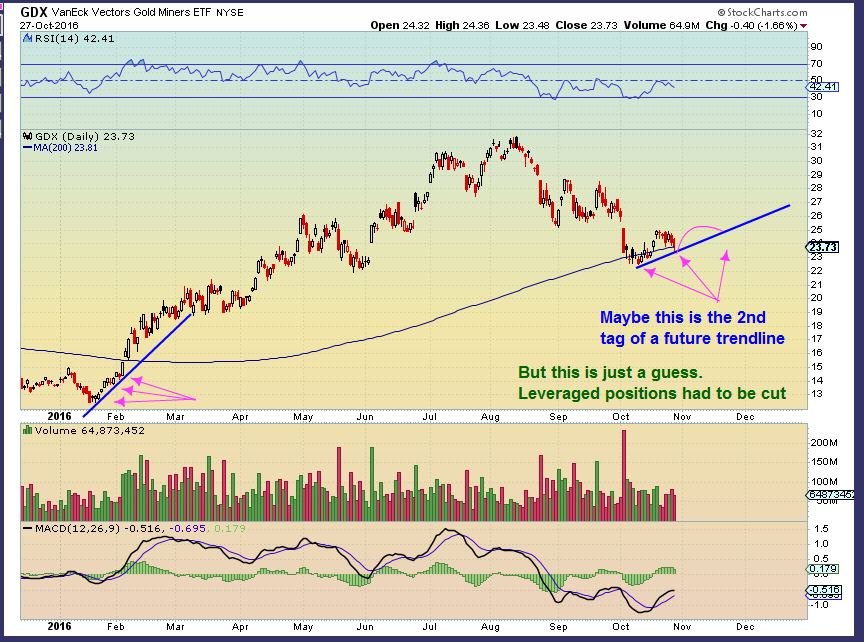
GDX CHART #1– Day 12 saw GDX drop even though Gold held above its 10sma.
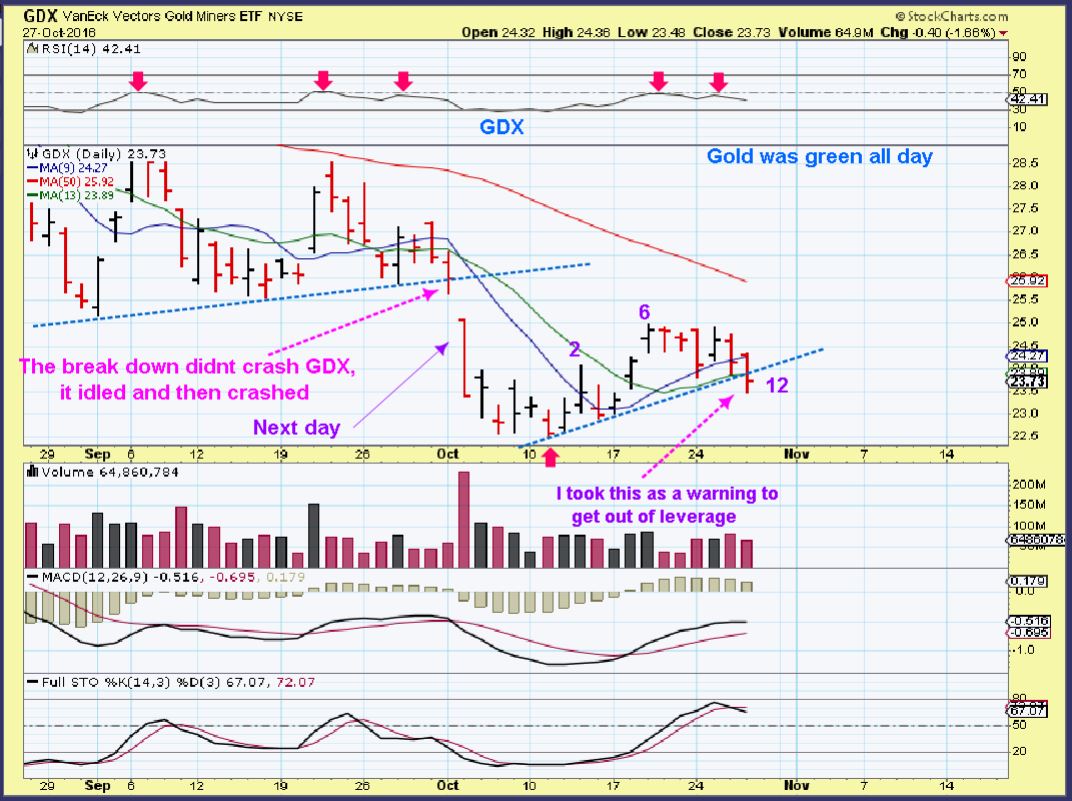
GDX CHART #2 – It broke a trend line that I was watching, and on day 12 I took this as a sign to remove leverage. I wanted to keep it a winning trade, since it was bought when I announced that I thought the lows were in in Early October.
GDX CHART #3– Please read the chart.
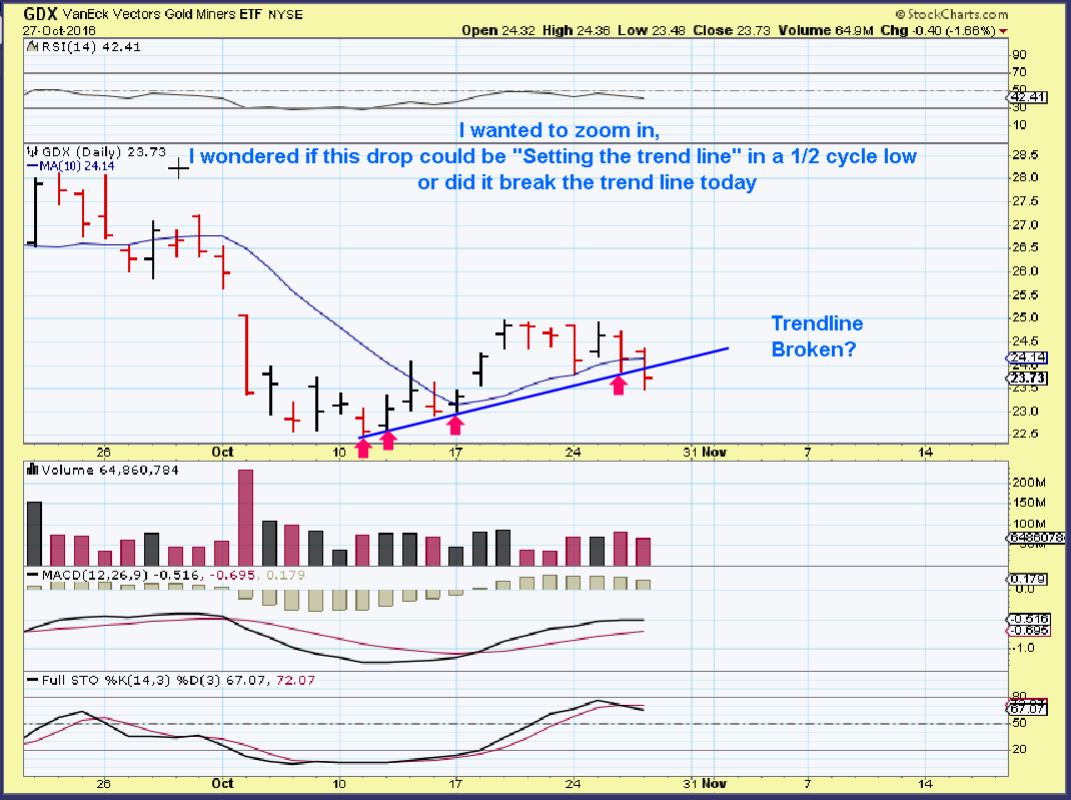
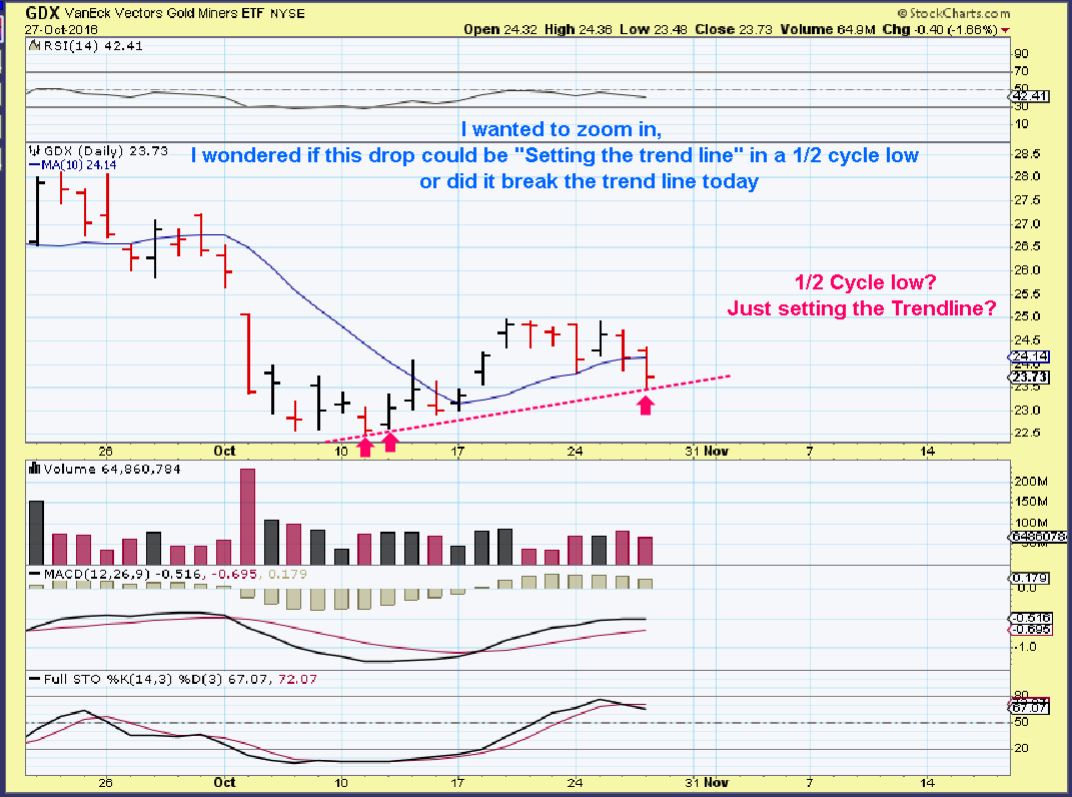
GDX CHART #4 – So I changed the trend line and tried to use the first 2 candles out of the lows. Is this dip really breaking a trend line, or setting the trend line at a 1/2 cycle low?
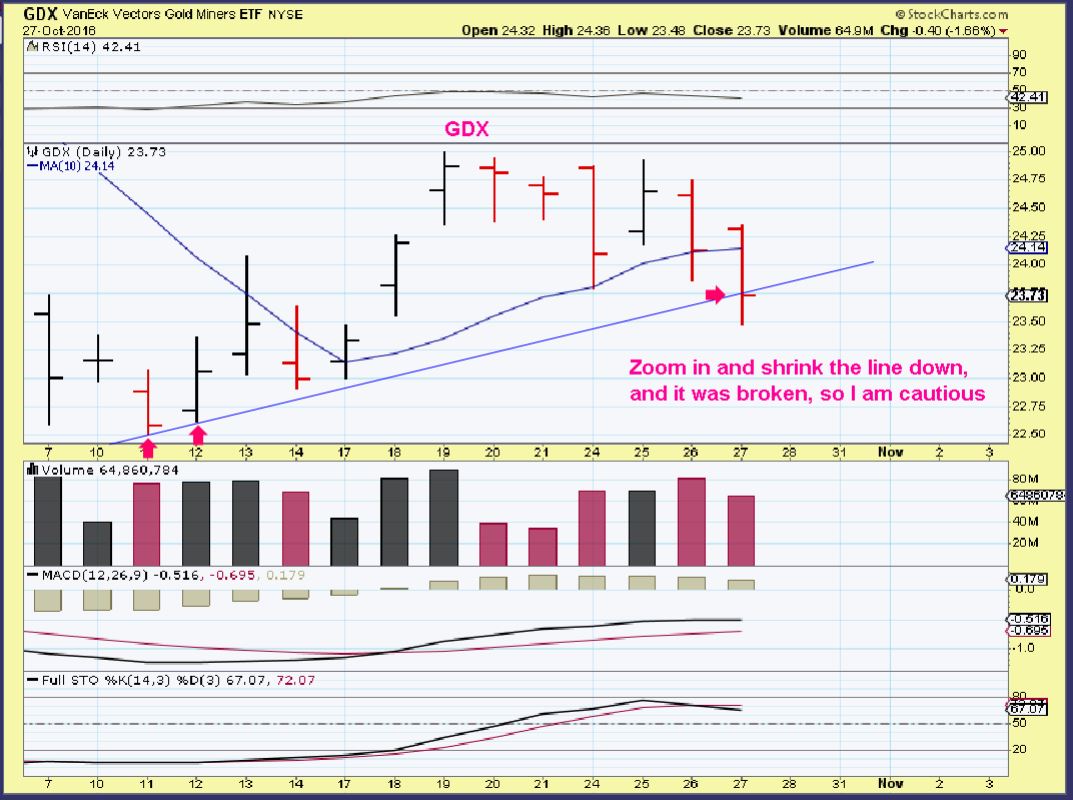
GDX CHART #5 – Zooming in for a close up, and using the first 2 candles, I see that it did break the current trend line.
GDX CHART #6 – Using a line chart and the first dip, it looks pretty clear that the trend line is violated, however…
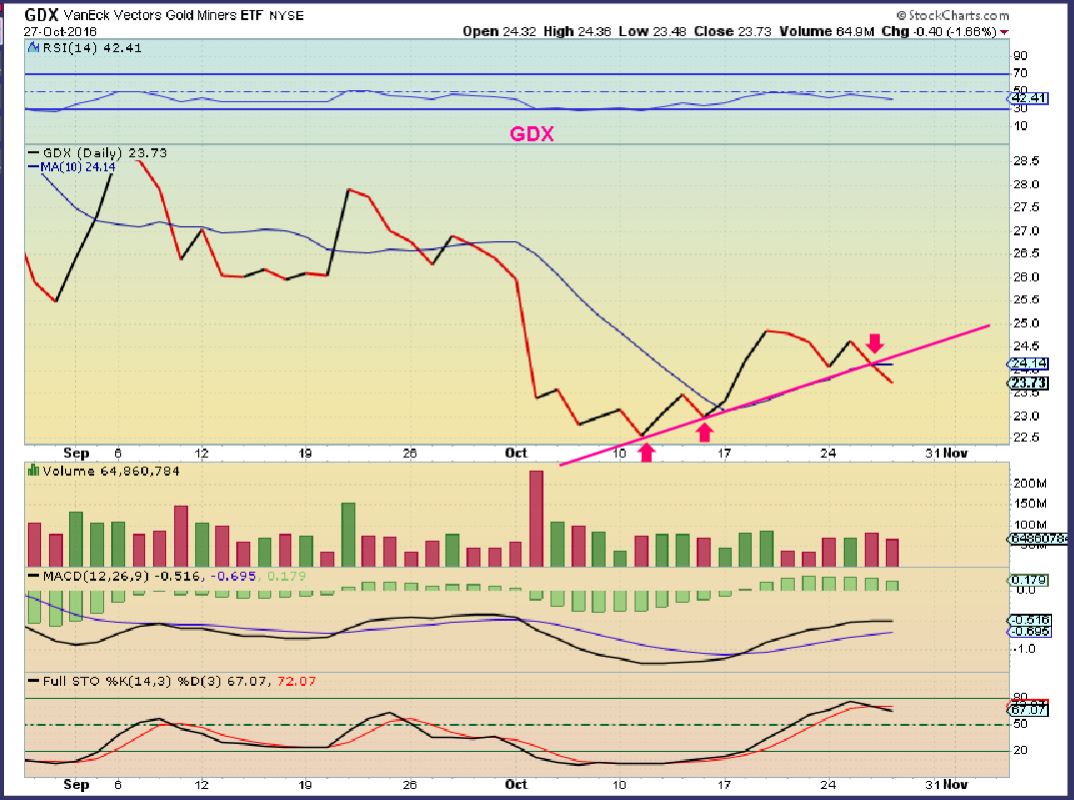
A trend line is established using 3 touch points, and I didn’t see 3 tags in a straight line on the chart above really. That is why I still wonder if this drop is setting a trend line from the lows to the day 12 and a 3rd point comes later, as drawn here?
GDX CHART #6 – Since this is just a ‘possibility’ , Leverage still had to be cut on that possible trend line break shown in the other charts.
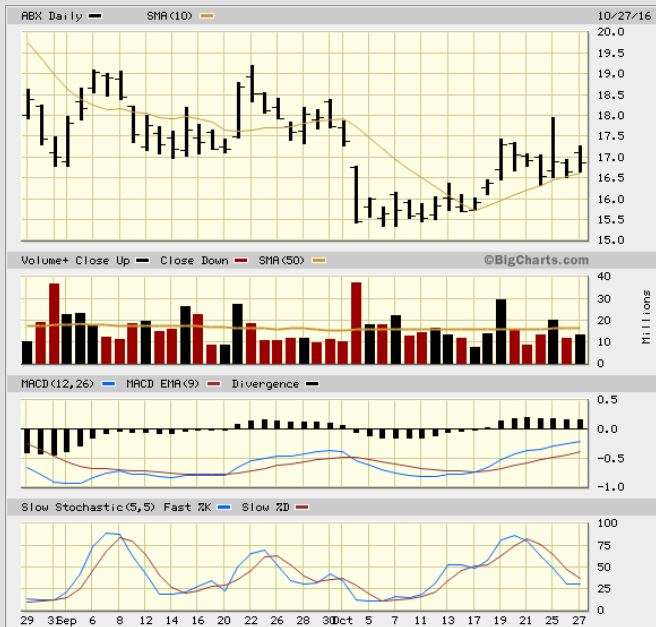
So we need more time to see exactly what is happening here. I want to make the point again that some Miners do not look ready to fail. I showed charts of HL, IAG, NG,ABX, etc. Others do look “iffy”, so I am a little more defensive. This is how a trade is managed in a short term set up.
FOR EXAMPLE:
ABX actually closed up Thursday, and held the 10sma.
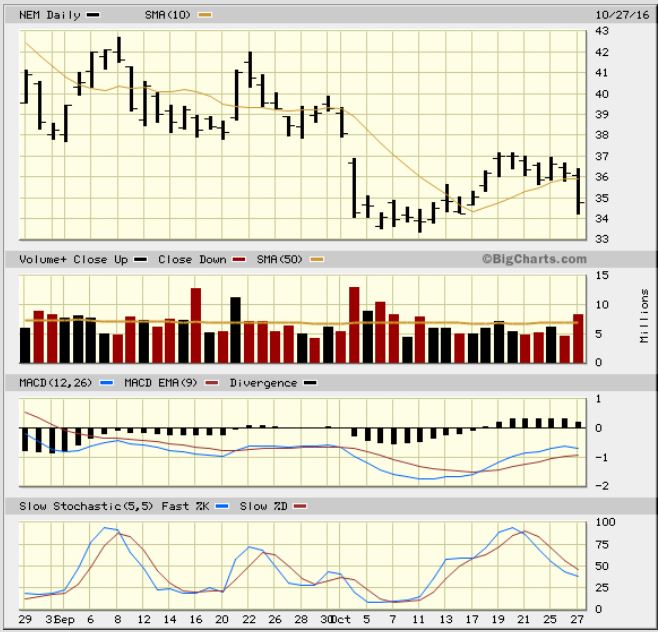
NEM – Looked fine Wednesday on the 10sma, but took an ugly turn yesterday with news of a debt tender offer.
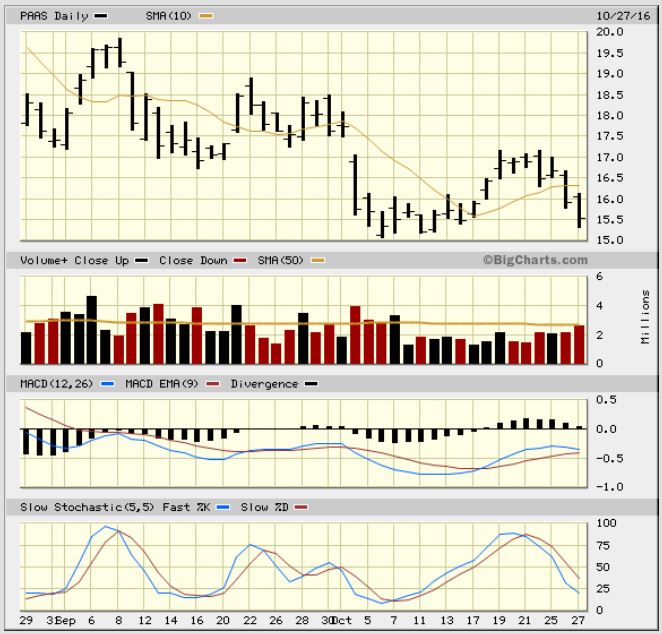
PAAS looks weak with increasing volume on the selling.
CONCLUSION: We caught the lows and they looked like an ICL using sentiment and Cycle timing ( 5 months since the May ICL, and we have seen them 4-6 months apart). Did we catch a DCL or an ICL? The DCL was confirmed with a close above the 10sma and a downtrend break, the ICL has not been confirmed. I looked back at the December 2015 ICL, and it was not confirmed for quite a while either, but the lows were never taken out in that long sideways move.
I will discuss this further in the weekend report, but it still leaves us with this conclusion – Gold still may or may not have put in an ICL, but it is not speaking to us clearly. The Miners broke below the 10sma, but I have seen that before and it then recovered it in a sideways consolidation too. As time goes forward in this daily cycle, you HAVE TO become more aware of the fact that Gold could start to look for a daily cycle low at any time. Yes it could go sideways like we saw in Dec 2015, yes it could drop to a new low and THEN the ICL would come in on the 6th month from Mays ICL. Gold could also POP & RUN for a few days and then drop into a higher low (Dcl) and we’ll then see that OCT was the ICL.
We have to listen to the markets when they speak, but this one, much like Dec 2015, is not speaking clearly yet. Gold is ignoring the USD rise, and is not acting normal. This will change over time and things will become clearer, but until then I have to remind people to honor your stops or maybe even lighten up if you are heavy or leveraged ( Some hedge their positions). I will discuss this further in the weekend report. Have a good Friday and a great weekend and thanks for being here!
.
~ALEX


very clear picture that you painted, easy to understand, even though we need to wait for developments the next few days. I am wondering if the FOMC meeting will make things more bullish. I am sure they will not change interest rates ahead of the election, so that could be a bust for pm related items. So my preferred scenario would be a slide into Wednesday and then a vigorous rebound to complete the ICL next week.
Yes Marinho,
I keep thinking forward too, as well as looking back at that Dec 2015 ICL. It intrigues me how devious that one was, and then that sudden burst higher in January.
I also do not expect Interest rates to be changed
it looks like when everybody wants something, it’s not going to happen
Gold poppage on the 5 min. We havent seen that in a while.
Yes, looks like a nice quick shake out on that Live feed chart at the top of this page
Alex, you are so good ! this report is great again even if the news might not be +
you shoudn’t thank us for being here, we should thank you for letting us here !!!!!!!
mucho gracias : )
Such a nice guy Ray – Thanks for being here – LOL
Seriously though, Gold & Miners are acting a bit different with this USD rally, so it does lead to more of a step by step approach until things clear up. We have a definite DCL, but unconfirmed on the possible ICL.
Nice pop in Gold right now
AMEN RAY, WELL SAID !!
Wonder if the market baked in those bogus GDP numbers before they were released for a head fake?
Was Yesterday a fake out? Huge volume in Gold right now, Popping.
You’re right Bill, that is pretty big volume and I didnt look at the volume until you said it. Thx
EDIT – BUT I THINK I SEE GDX STILL DOWN IN PRE-MARKET?
Additionally, in pre-market, GDX, JNUG & GDXJ was pushed down (GDXJ by a dollar!) to scoop up a bunch of stop-losses before returning to unchanged at the open. I have no idea if that indicates a low has been had or not, but found it note-worthy.
Great report as always, Alex – as you say in today’s, we have to keep watching and watching!
Reminder : That $1275.90 is a good number to break, it makes this a RIGHT TRANSLATED DAILY
SO I Jumped back into JNUG for a quick trade Pre-market ( it was actually down as Gold was taking off).
NAK looks REALLY good here too
What, I did the same after the opening.
So IF gold goes above that then you’d say it’s fairly safe to jump back in? Or does it need to close over that…? If it does that, about how many days would we have left in this first cycle?
A break over that on day 15 would be quite bullish in my opinion ( doesnt have to close there). It pretty much makes this a R.T. Daily cycle ( And I would tend to also believe an ICL is in place). it has NOT happened today yet.
One could confidently buy the first daily cycle low dip if it did, the only problem is…if the dollar dips into a dcl, how high will Gold go before it dips? A new high in this daily cycle at day 18? Day 22?. Or just up 2 days and then dip into a higher low? It is such an odd bottoming period right now, with many Pops and many Drops.
There is no real way to tell at this point, but Gold has been resisting the USD rise, so it showed strength and may run now .
Wow, see that pop in all the miners just now?
NAK up. But it IS the first hour.
Glad I at least held a couple….but sold many already…
BULLISH NEWS ON NAK YESTERDAY
VERY BIG VOLUME TODAY
I sold it Yessterday! up 16% this morning……….bummed insert sad face here
Oh Bummer Bill.
NAK is going to absolutley explode with this EPA news.
They are a huge buy out target now, their reserves underground are staggeringly huge
The excitement is waning on NAK
It will likely bull flag now that everyone that was waiting got in.
Then everyone waiting to buy or add on the dip, will build the bull flag.
Just a guess, but I think this goes back to the AUG highs to form a cup, or a giant A-B-C-D move takes it through those highs on a daily.
I just added a little and will probably hold this till I see news in the fall on what happens in DC at the talks.
Sorry you let it go.
This is one of the few I actually held yesterday – woohoo! Thanks for telling us about it. Since you think it’s going to go way up, is it too late to add more or wait for a pullback…or…?
Oh my word, I just looked and it is up 34%. That is a personal decision.
This is a tricky one, because I have been reading about this one for a long time, and they are sitting on a mountain of precious metals, they just werent allowed to dig it up yet. EPA was blocking them. Now that EPA announced they want to strike a deal to allow them to, they either make a ton of money later on, or they get bought out for a big Value.
Your answer… I dont know. Its up 34% right now. It may dip mid day , it may not. It depends on the individual person and the type of possible moves that you can handle if it does dip back down tomorrow. . It could just run straight to the Aug highs of August too, I dont see why not. . Thankfully we were buying this at 30 – 40 cents .
Awesum.. market’s open 2moro!!
#GetSum https://uploads.disquscdn.com/images/69f977c0f9bc3eedc44590302086162cc65683c44e2a9480f7dffbccb7d796cc.png
hahaha! 🙂
The power of editing says…
“What are you talking about ?”
Just came in and …WOW…glad I held my NAK! Sorry I sold my NGD and BTE yesterday…but it is always a good feeling to bank some profits. Now I have some $ to play with. Alex, thanks for all your guidance here.
Must be time to party – BREW is green. 🙂
If NAK matches its last big run in AUG, its target is $1.44 now. I found that an hourly 9ema is a great place to take some profit and a daily 5ema was a good time to clear out. Of course, this time could be different. 🙂 And this is the first hour.
Sadly, MNGA is not joining the party, down 4%.
NAK GOING FORWARD – WHAT COULD THIS RUN LOOK LIKE?
THE INITIAL BUYING THIS MORNING IS BULLISH, BUT IT DOESN’T HAVE TO GO STRAIGHT UP DAILY.
THEN AGAIN, IT COULD. SO…
1. IT COULD BE A STRAIGHT SHOT HIGHER DAY AFTER DAY
or
2, IT COULD LOOK LIKE THIS CHART. IF YOU CAN TAKE THE DIPS, YOU COULD ADD ANYTIME
.
REFRESH
.
https://uploads.disquscdn.com/images/e5cc0ee370661a2509c0025caa97589b8c897952f714b58fc8a8893572d163ea.jpg
Looking at NAK on a 5 minute, 15 minute chart….I bet it bull flags today
Thanks for the chart. My post below re the hourly 9 ema refers to the final two day blow off. The 5 dema should follow the ride up.
About NAK news:
In September 2014, the Pebble Partnership initiated an action in federal district court in Alaska, alleging that EPA violated FACA by its close interactions with, and the undue influence of, Environmental Non-Government Organizations (“ENGOs”) and anti-mine activists in developing the Bristol Bay Watershed Assessment, and its unprecedented, pre-emptive regulatory action under Section 404(c) of the Clean Water Act. In November 2014, a federal court judge granted PLP’s request for a preliminary injunction in the FACA case, prohibiting EPA from taking any further steps toward finalizing its 404(c) regulatory action, and signaling that PLP’s case had a likelihood of succeeding on its merits.
Selection of a mediator will be undertaken jointly by EPA and the Pebble Partnership, with mediation talks expected to begin in Washington DC this fall.
Past hour 1. TRX up 7+% on good volume.
What ever happened to KATHLEENCHOW?
She used to talk to me about buying Nak and holding it as a core too.
I don’t think that I’ve heard from her since the summer.
Alex it looks like on Oct. 23 weekend report Kathleen sent you a short message in this forum regarding Hl and NUGT.
CF, I’m here! Just a bit silent in these tricky markets and too busy these days:) Yes, holding NAK (on Canadian side and happy). Actually thinking of adding some here (intra-day dip hopefully).
Several miners dropping to Red, with Gold and Silver hanging in there
AUY, AKG, ASM for example. ( Dont want to own a miner that starts with “A”?)
you still in your JNUG?
It was a small position and supposed to be a quick trade, but I got distracted with NAK and a few other things and yes, I’m in the red deciding on intraday charts .
GDX broke yesterdays lows and recovered. Shake out type stull, but if it goes below it again, I’m out
Yes, I saw it go below yesterday’s low too. Makes me suspicious.
God bless your Line In The Sand, Alex! …and thank you to JDST
I’ve not used JDST, but since I really didn’t want to pare back on the positions that I’ve unfortunately fallen in love with, I decided to hedge with it this morning when the market rose up to a “line in the sand” (a very bold price resistance on my GDXJ chart).
This is a lesson that I should have already learned between August and now – but I’m a bit slow ya’ know. I’ve heard you speak of it before, Alex, and am only bringing this up here in case it helps someone else who falls in love with their miners too. If you have ideas on how to manage it, I’m all ears – but it seems I should just leave a stop for breakeven, since it’s right on my line in the sand.
Thanks again for always giving great analysis, Alex!
That is a good idea Cal – Using it as a hedge and especially at the tag of that line in the sand. Perfect entry and if it breaks above that line in the sand, that’s could be your JDST line in the sand too. .
It is also a good way to manage a core position when you know a little pullback is coming. Those are stocks that you really dont want to sell for over a year for tax reasons, but you reduce the feeling of drawdown if you can time a hedge correctly
Just wanted to add. Alex – your work is amazing. It is the most comprehensive and objective that I follow. Thank you for taking such great care of those who follow your analysis and value your perspective.
Thank You Mark, I appreciate that, and I’m glad that it helps – these are really tricky markets at times.
………………. annnd my tx? 😀
Thx for zipping ur mouth? : )
https://uploads.disquscdn.com/images/7f073681e1169bdc59d93c40e903f89a531220a47936f93aeddfd21c23464011.png
Yes… what he said …i guesssssss … (fingers crossed behind my back)
https://uploads.disquscdn.com/images/f5f2f0eb2a8ad4d47e234fafe88ab7a766f5c72fa64a2d135bb290592cad8f8e.png
One of my favorite long term indicators for miners’ direction, is to seek out divergences between any of the popular miner indices and the price of Agnico Eagle Mines (AEM). I don’t know why it works (nor do I care) but i have followed this stock since the mid 1980’s and when a “reasonable” divergence materializes, it pays to listen. I am a position trader so my focus are the weekly charts thus these divergences may take several weeks to play out (it works just as well on the dailies but they don’t fit my investment profile) and extreme patience is required. If one takes the time, it is not hard to develop trading rules around these divergences but again i want to emphasize how patience is a “must”. Currently, the daily chart of AEM is actually holding quite well suggesting that a low may not be too far. Off of the 2015 lows, there were massive divergences on the weeklies and as far as I can tell, AEM has not yet rendered an “end” to the bull market. Of course, this tool is not used by itself as there is no holy grail yet I have found it to be an invaluable tool in my arsenal.
Thanks for the idea.
Gary
Gary?
That’s my name, the G in the Glmus. 🙂
My apologies Gary, I thought of something else!
I like it : )
Thank you Pankef.
We are all trying to become better traders. When someone takes the time to share an idea that they could just as well not share, it says something really good about that person. It is great to find that here at CF!
Looks like we are getting a short term rally at least.
I’m here! Still got NAK (on Canadian side) but very, very busy these day hah!
There you are ! Yay and Congrats! You said it was going to be part of your core, so I was hoping : )
Thanks to you for the super analysis, CF!
looks like we got your $1275.90 number from below!!
and then some… it really seems to be taking off now…
Looks like it may have just touched 1280 (or really close).
GDX intraday, that move looks real, strong volume and a mini shake out from yesterdays lows.
.
DOLLAR finally getting smoked
FBI Reopens Hillary Investigation. Dollar falls, Gold rages higher.
The markets took a hit too
awesome 🙂
This looks to be a reaction to the news that the FBI is reopening the Hillary email investigation. The move started just after the news was released.
You could say NGD is still at the lows, but coming off of the lows in a very convincing manner
So it might be a great buy ( expecting follow through and a low close by for a stop).
NGD announced significantly higher 3rd quarter cash flow
NGD. loading up.
I think of you whenever I say NGD – that’s funny
me2 :o)
hi frenchie ;o)
Damn! I sold that yesterday! Poo.
A lot of miners just went from red to green.
REFRESH –
.
https://uploads.disquscdn.com/images/d53ac8fe2d2654ee325bdcbeafd7b67fa83b60f1a76809668e4546f57b091baa.jpg
finally!
So in situations like this, do you jump right back into JNUG or you sit and watch a bit first? I’m sitting hah
That really depend s on the trader. Day-traders might , others may wait for the next DCL, but that could come higher if we have our ICL in place..
Its tricky, so I’ll review,BUT SOME MAY WANT TO RE-READ YESTERDAYS GOLD REPORT AND TODAYS .
What may be happening today is we have a higher price in Gold on day 15 ( Scroll up in this report and look at the Gold colored Gold chart in this report). That indicates that odds are becoming more favorable to the idea that we may have caught the ICL again, just that it went sideways much like Dec 15.
So from here even if gold s daily cycle is 30 days long, it would be right translated and that is Bullish, and should put in a higher low that the ICl, but where??
Like I wrote in the report yesterday – will this run higher to day 17? day 22? day 26? Or top today??? And then it might do like last Dec again, just keep going sideways for a week or 2 into a higher low?
Sorry if that wasnt an answer, but it gives the trader many things to think about, and if you’re not in front of your computer all day, it could get jumpy
TRX,AUMN,XRA,BTG all back up 3.5% and rising.
i just bought back TRX & AUMN at the price i sold em.
might just set a tightish stop this time around
SOG- I cut loose of everything except TRX and TGD both of which I like at this time. TGD just holds up well…knock on wood. I just can’t keep an eye on 5 positions and work my day job without risking a mistake. Once we all see how this is playing out and if its right, I will add. I am only about 30% invested at this time (down from 70%) a few days ago. 🙂
i know… its like a plate spinning act, when i got 10 different miners and theyre all tumbling at different rates
… tryin to prioritize which to jettison is a pain
Its like taking the top off the blender. lol AUMN is still inching up.
Hi Alex – I sold all my NUGT, JNUG and GDX positions yesterday since it broke the trendline. Is it safe it buy it back or do we need more confirmation before I go on a buying spree ?
Please read my reply to KATHLEENCHOW below.
I re bought this morning, and added on the break back higher by Gold ( miners delayed on that follow thru, but Gold was moving quickly towards that $1279).
Adding this late in a daily cycle is tricky, but if it is an ICL, it plays out fine in the coming weeks. 3xETF is a personal call, much more whippy.
Thanks Alex. I ill wait till Monday and see how things play out
So GDX tagged the 10sma and dropped so far…. UGH
P.S. AMRS bull flag. They came out with news that I thought was VERY BULLISH, and it dropped like a rock out of the bull flag down 9 cents. It just went back to even. Crazy.
Oh my goodness, I went away for an hour and a half…seems like I have a lot of catching up to do!
Yikes…me too!
Alex I know you use other indicators but how would you read those last two candles on the 5hr gold futures chart? Worth noting or not? https://uploads.disquscdn.com/images/99c13870060c3a175601f4f1bba1f18bac3530cd7e727f86c1bb325635802dc5.jpg
Well, when a candle shoots up & gives it up, it is a sign of a lack of strength, but I also dont know if that last 5 hr candle is complete? You know what I mean? Like is the 5 hrs full yet, or are we looking at it on hour 3 and it could improve or even drop further ?
Making a nw high, even though it didnt hold is valid in cycles though. A new high is a new high period when it comes to cycle count & R.T. or L.T.
Alex..could that now be the high for the cycle now.. meaning more miners downside, as gold drops to a DCL?
Yes, The highs of this daily cycle could be any given day.
Today, Monday, Tuesday, etc.
this $GOLD daily is a prime example of what i meant by ‘iffy-going-into-eod’ yesterday…
right on the line.. could go either way..
https://uploads.disquscdn.com/images/d5077dcef2e385930b004c88653b3069922407a25c2a0e64f846dc0d95b86b36.jpg
Please redraw that! I want a Fantsy chart for the weekend 🙂
.. especially for you then…, $GOLD to $1380 🙂
https://uploads.disquscdn.com/images/39c9d8c63465babf564817bb254e6532daf0559815df214e9da7b938667b97c6.jpg
Thank you. That’s a happy chart! https://uploads.disquscdn.com/images/0c42c2e94d478bd1dbf5050919ede88ef47b6b0b13cf3c934f6f4677de73badd.jpg
lol.. thats kinda subversive..
cute pony woman farts rainbows
hahaha!
Blame Kathleen and her magic brownies!
this is more like magic mushrooms 🙂
and sorry, my mistake .., i called your cute unicorn woman, a pony
– – and don’t let that happen again ! 🙂
you sound just like a teacher
And with that ….. here are some more (I have said things much like this!). have a great weekend!!!!
http://www.reallygoodstuff.com/community/50-strange-things-teachers-say/
thx.. you too 🙂
I just read some of that….OMG! I could NEVER be a teacher!!!!
And just this week had to say “Do NOT suck on rocks!”
That’s funny!
yeah.. he’d be like…
‘SOG.. stop licking the 1minute charts!’
‘Cason & SOG & Tammie.. stop pooing your pants when the market goes down!’
‘Maria.. put down the crayon & stop drawing random numbers on elliott waves!’
‘Billy & Kenny, stop fighting & trying to kill each other at the back.. or one of you will havta come sit up front!’
😉
Cute!
…adjusted now, for a more teacherly flow 🙂
hahaha! Wish I could load a picture here…..:)
Funny stuff!
btw.. i hope no-one glances at that and thinks something amazing just happened to gold
Ha ha ha ha ha!
Something amazing occurred to me. Every time Hillary’s rear gets warm, $gold goes up. We should install a thermometer back there. That might be a good indicator. (thermal divergence).
whats going on with that woman?
something not quite right.. inane grinning & facial expressions – a bit like our weirdo prime minister Gordon Brown, back in the day.
I don’t know, SOG.I know she rehearses her smile during speech practice.Trump probably rehearses his frown. This U.S election is one for the record books as far as I can tell. I will be glad when its done and we can move on to happier days. Be glad you live across the pond!
Good one! She’s on the hot seat again for sure!
Oh noooooo…. he’ll pullout friskey jdst…lol
you raaaang Mamamaria?
https://uploads.disquscdn.com/images/a01930d96ec927d398cc4a31726191c24679dc5ef634893332a09f5f5d84b814.jpg
Why is it purple? There is an obvious play on words with “Halloween” which is tomorrow night over here…
oh i dunno….what color would you like it to be? 😉
Gold 😉
actually its an oldie.. so i can’t create any golden fantasy magic on it anymore (cuz its long since disappeared from my chart timeline)
you’ll jus havta dream about frisky gold instead!
Wait I though this was an ICL that could last a while.. is it too soon for a dcl?
Go back to Dec 2015 – sideways for like a month. Anything can happen.
Argh… I’m buying me a crystal ball for Halloween 😉
.. i would so like that to be your real name… Ms Crystal Ball
LOL! though I also was considering “blue persuasion” 🙂
must say,, didnt know that one.
just played it on youtube
Love that one…:) hippie at heart here…
i did know the Tiffany one though!
No Hike comes on Wednesday. A pop then fade into the DCL? I’mean getting to the point that a pop is a sell vs buy the dip?!?
Sidenote: Looking at the ( lets call them “legalize “) Marijuana stocks.
Interesting drop & reversal on TRTC
Check out the 13sma on CBDS, HEMP, Bull Flag on MJNA, EDXC, CBIS, CVSI, CANN, and many more.
These things are crazy though ( CVSI , CBIS, CANN, – huge moves)
Funny you should mention those as you used “high” 3x in the last two sentences of your last reply 🙂
Must be this brownie? Ahem.
Stop talking about that gift package I sent you last week! I told you “shhhhhhhhhh!” :))))
hahaha! 🙂
NAK. Looks like this baby is going much higher. There are lots of dollars on stake and sure they will get to resolution. Fingers crossed.
Go NAK!
Where are you Cason? Its Friday!!!!!
Right here. 🙁 But I’m too disappointed to https://uploads.disquscdn.com/images/451b4da46fba7c269ebe8bec7c32e57ba56f72c73cde78b314f354fe0adf59ef.png CF tonight.
awwww 🙁
You know its not the problems…..its how you handle them. You my friend are a role model to many at CF. You have a support system. Get some rest. Get a plan. Come back and win! Go Cason, Go Cason!
Thanks, Johnny. Not a role model but do appreciate your kind words.
Yes I believe you really are. You have taken the time to study ta, ew, options, futures, (and a lot more) to a point where you have a good handle on a lot of topics. Not everyone has that. Your bright and it shows. You may not be Alex but hey…..we only need 1 of him! lol!
dont be too hard on yourself Cason my friend.
its not like we bought a top and got destroyed.
just a bit early thats all.. either into the low, or the post-low pullback.
i did that in november with GDXJ.. had to ride it down near 20%, but it soon surpassed my early entry point (lets not mention that i exited in march.. hohum)
so back to year zero.. & get on board at a better time to make sure we ride the next trend back to the top.
Good words of encouragement for Cason. I agree.
Yes, agreed!
This was my original plan for the weekend… https://uploads.disquscdn.com/images/dfbebd26523a0c051d62ab5da7ad2feddb587bd68940aa40b9efa8d1a417c1a5.gif
One day we’ll be doing that! 🙂 🙂
instead,, we got this…. 🙁
https://uploads.disquscdn.com/images/c41f66f1c4c199e66997d76626319c998589113958c47f99fdae16ec49257237.gif
You guys are too funny…..making me laugh!
https://uploads.disquscdn.com/images/58479f8f150ebfdd03189c4584636478407d4130c8fbc53cc1a8455dc9380598.png
Hey, I think I got uploading to work for me….this is a test
yay.. it works! 🙂
I’m going to have way too much fun making my moji’s…..
Maria’s now gonna havta up her game
So now there’s Maria,Crystal, Cason,Tammie,& maybe Alex (I can’t remember if Maria does his or not) all with imaging programs. That’s going to be fun to watch!
https://uploads.disquscdn.com/images/3be831f61fcf56845218fa4abf2db334d8a64cb72d145faaa137a7c6bd1b8bbe.png
Hahahaha!
we are about to enter a new dark ages, which history will remember as the Emoji Wars
https://uploads.disquscdn.com/images/ccb0cc51bf5c0b673de7411be31fa3eb6b8de51eafc2fde74aecbda816beaa75.png
i’ll grab my popcorn & watch the ensuing mayhem
https://uploads.disquscdn.com/images/eaafe4e98bd8119f06f33000311921853960e090b1647869fcdbc187010e5ad8.png
Gosh this is too much fun, I won’t get any work done. 🙂
On that note I better get off the computer or I’ll be here the rest of the day! :
Actually, im in Pittsburgh 4 the long wknd & just looked out my hotel window overlooking heinz field, and u never would believe what i saw flying by
“… and i heard him exclaim as he flew out of sight… ”
https://uploads.disquscdn.com/images/eec1fb034692d1e8e3b2237c5633c3eba0f2e2271e8164cee567591371fa654e.png …..
hahaha!!
Please CF, can we have some more…reports…
Hey Cason,
I released the wkend report at 11 a.m. Sunday morning 🙂
D’oh!!! Missed it. Going to pull up now.
“This too shall pass” Have some fun this weekend. Refresh yourself.
To make you feel better:…you should see the glowing red in my account! I hold 23 miners, mostly red in varying degrees [sold many of the green ones to keep the profit, 4 on Thursday just in time to watch them go back up!…talk about bad timing!], in just one of my 2 accounts! My other account holds some miners that I held since gold was at its highs years ago!
Still, with CF, I am way in the plus since I have been with him [Feb.].
Did a fun exercise…Added up where I would stand if I sold everything bought since CF as if I took profits and absorbed the losses….as bleak as it looks now…I am STILL up.
Hope it keeps getting better for you! I haven’t built my account back up quite like I wanted but am getting a little better. a little. I got stopped out of JNUG right at Fri lows. I had been up 20% and ended up making $17, just enough to cover the commission. MUX is really the only one I’m uncomfortably under on right now.
Does anyone else have a problem loading pictures or charts here? I used to be able to but haven’t been able to for weeks…..do you have to be signed up with disqus now to do so? I always just post as a guest….? It says “you must be logged in to upload an image”…..I’ve written to support but just wondered if anyone here has a quick magic answer – thanks!
oops meant to put this as a new comment up top rather than specifically to Johnny….don’t know how to change it now….:): )
That’s OK. It makes me feel important. Ha!
im always in with disqus and have no probs uploading images or vids.
so…. jus git yoself a disqus account!
I actually tried that yesterday…..and it still gave me the same wording….that I have to have an account…so I cancelled my disqus account right afterwards figuring I didn’t need it if it wasn’t going to work….maybe I’ll try one more time…..
well… i need to be logged in to both
a)CF premium members to read the reports,
…. and then also…
b) disqus, to be able to comment & add pics
Ah, ok, good to know….maybe I’ll have to do both as well…..guess I’m probably logged in to both right now since it let me upload something 🙂 🙂
all’s well that ends well!
Hey, guess who can finally upload? https://uploads.disquscdn.com/images/54118fc9c21e3f43f21b63f56a2b43cff9e72b58663b54cb4caaadab88395ca6.png
Weekly dollar closed below GANN resistance.
https://uploads.disquscdn.com/images/1c8b951e138408b6fff8b0fcb4376e56d081c3c9c4a69f516756b40f76bb5406.png
https://uploads.disquscdn.com/images/a7cbd41b6a0e10b8cb10a7a66b47f55afa381b400b7732a8ae1556db872a3c8d.png
Entered 75 % position in the 2x inverse of this today BZQ.
GDX:GOLD chart, don’t like the indicators pointing down again and the under performance relative to gold last 2 days of the week. Alex likely addressing this in the weekend report but wondering if a pop here is a chance to sell b/c we are now so late in the cycle – with another buying opportunity in the near future?? Maybe?? But look back at Alex’s Dec-Jan gold charts, selling the pop after day 19 would have you missing the whole move, which would be a huge fail. So, to sum it all up? Yep, I’m confused. Got in close enough to lows that I’m not really down much, but not excited to take a GDX trip down to 19!!!
https://uploads.disquscdn.com/images/d67e11eb37c6f8837f6683be7b391f05e8f800a8f25231eecb50e0765c3f0ed8.png
natural gas playing out nicely as went long when it sold off to 2.60’s….
Ron,
I released a new report Sunday morning, why are U & Cason still posting over here? Didn’t get the email alert?