
Does Anybody Wants More Chops?
I’ve seen choppy markets before, but it seems like Oil and Gold are up one day, down the next , up one day, down the next. It can be very difficult to navigate the choppiness, but Cash is also a position until we get a nice trending market. Other trade set ups are an option too. Lets take a look at the charts.
.
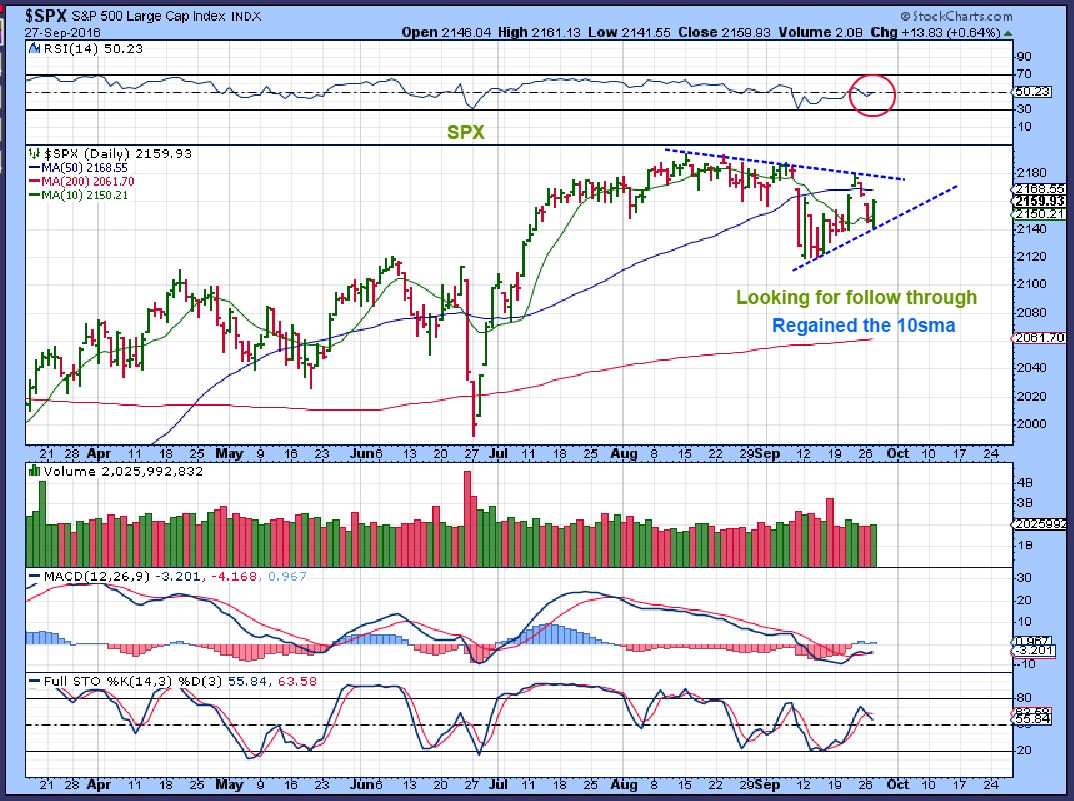
SPX – Short term I see a choppy triangle forming, and the larger picture might be forming a rising wedge. We can look for follow through with a break down or a break out.
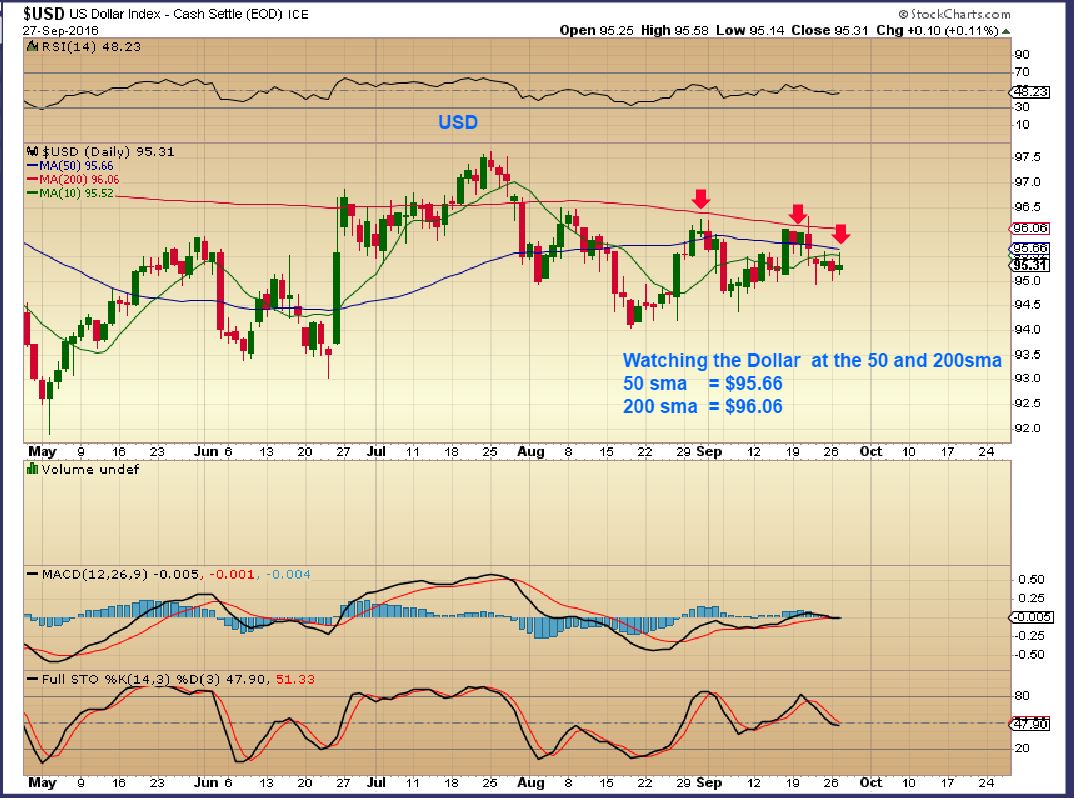
USD – Even the USD is choppy, unable to break out above the 50 & 200sma. Those specific price markers are on this chart for you to watch as the day goes forward.
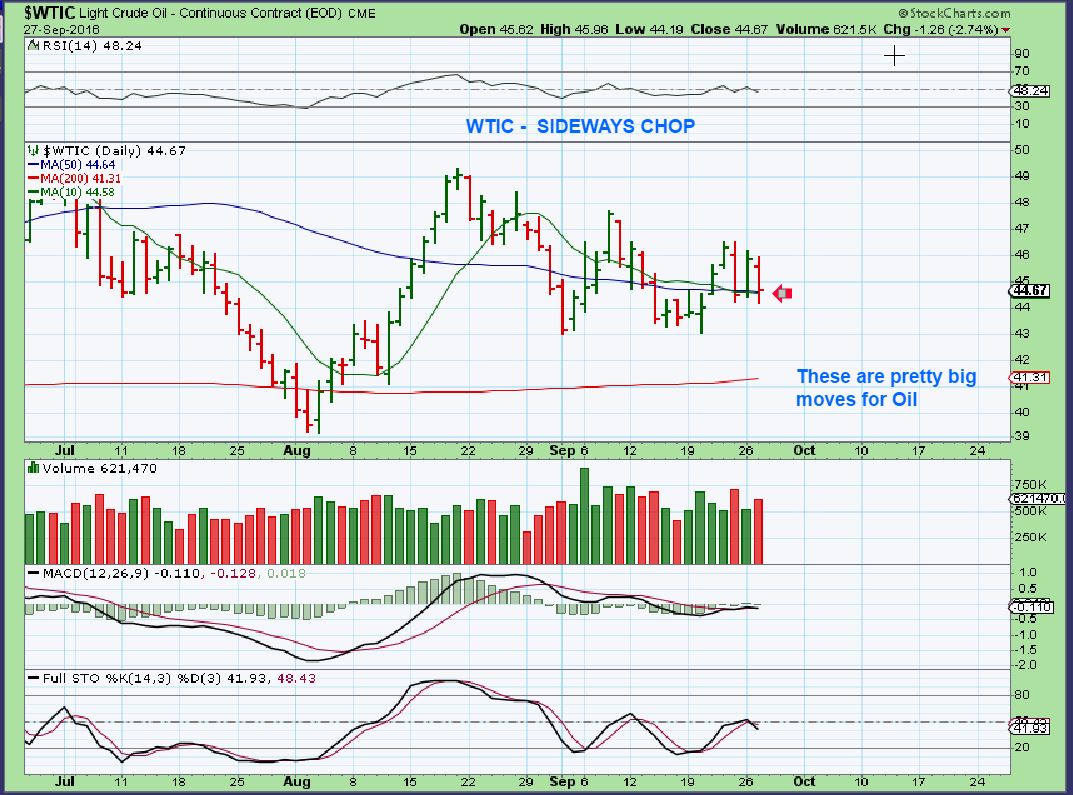
WTIC – More sideways chop. These are pretty big moves for Oil, up & down roughly 3%. I do not think that Sept 1 or Sept 20 are dcls, so here is something to watch for… we could break those lows, but not the ICL August lows. This would cause people to start shorting oil on a break down, and then a dcl could form and Oil would move higher. Maybe a tag of the 200sma?
.
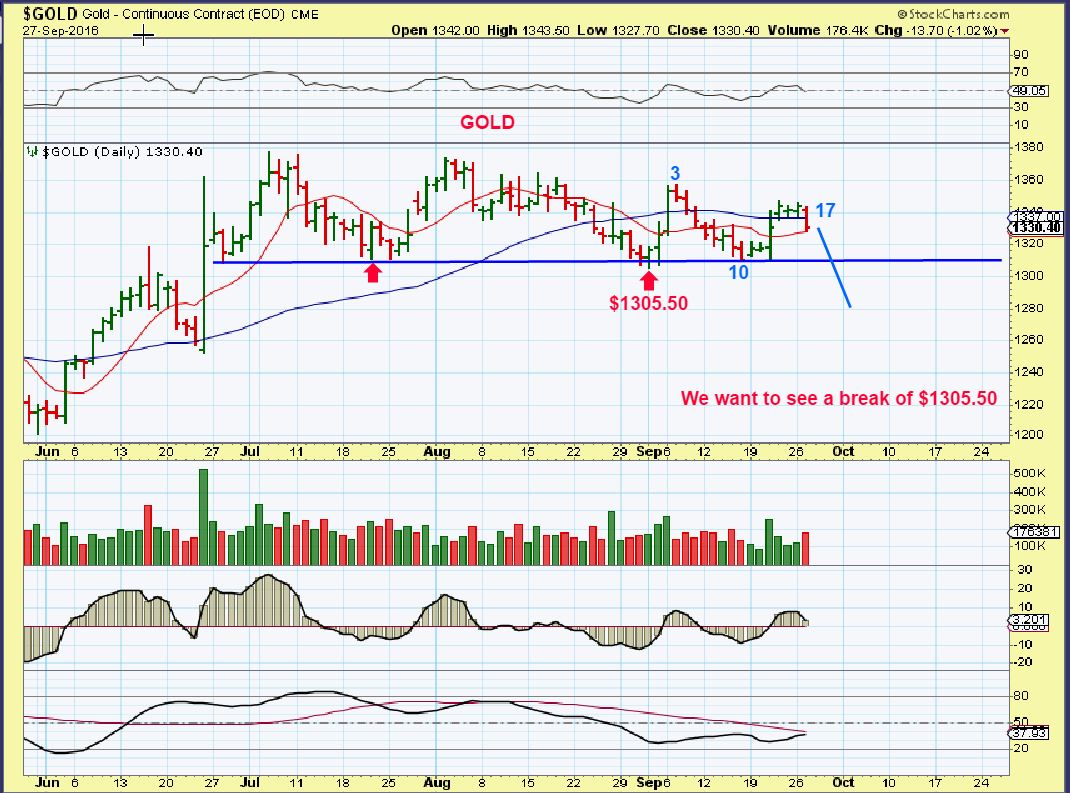
This is Gold & Silver as I write this morning. That shows the choppiness continuing with a sell off that recovers. Anyone want to guess what happens by midday? By the end of the day? Lets zoom out.
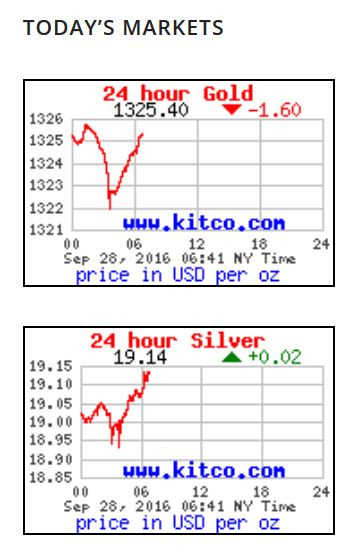
GOLD – I would expect a sell off below the $1305.50 to give us an ICL. This would be a great buying opportunity, but we sold off on Tuesday and so far this morning, we are getting another bounce. I may never enjoy chops again! Look at the size of this sideways chop. Is that trade-able? It looked it at times, when the lows formed, but the joy was short lived.
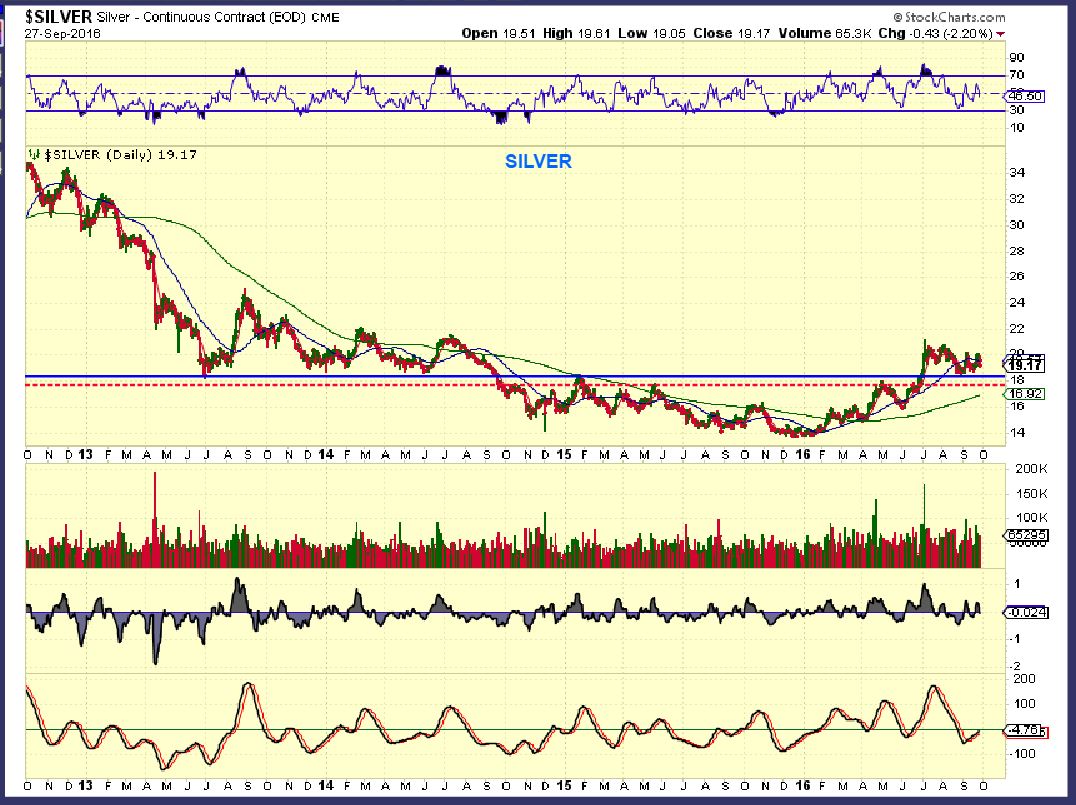
SILVER – I wanted to look at the big picture too. There will be some great upside in Silver, look at that base. The problem is that many are getting frustrated and tired of waiting. Trust me, there will be some good trading and good money will be made for those that do not lose sight of the bigger picture. For now we are looking at more choppiness and patience is necessary. .
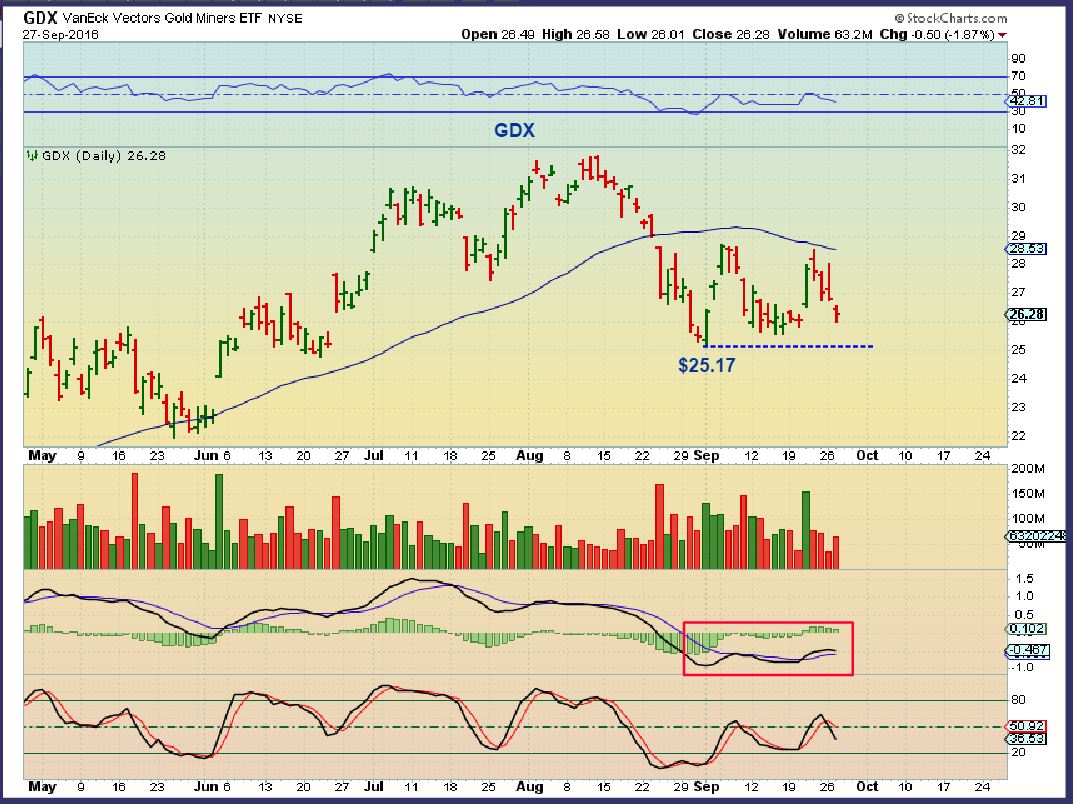
Miners get a lot of attention. I do have people ask if I think that the Miners put in an ICL in August, since the selling was steep and steady. I did consider that as a possibility, but it is important to note that that would have been only 3 months after the May ICL ( LATE MAY). So let me show you what I have in the back of my mind with Miners.
GDX – Watch the $25.17 area, this is the lowest point from the August sell off. Please note that after the steep sell off, we have simply chopped around, sideways price action frustrates both Longs and shorts right now. Think about people that bought NUGT or DUST.
GDX – Now look at the ICL formation of May 2014. A steep sell off and then a choppy sideways frustrating move for W-E-E-K-S. At the end of that period of time there was simply a 2 or 3 day quick flash drop. Think of how many longs got stopped out, and how many others went short and THEN price took off higher when no one dared to buy.We may be in that sideways chop now. 🙁
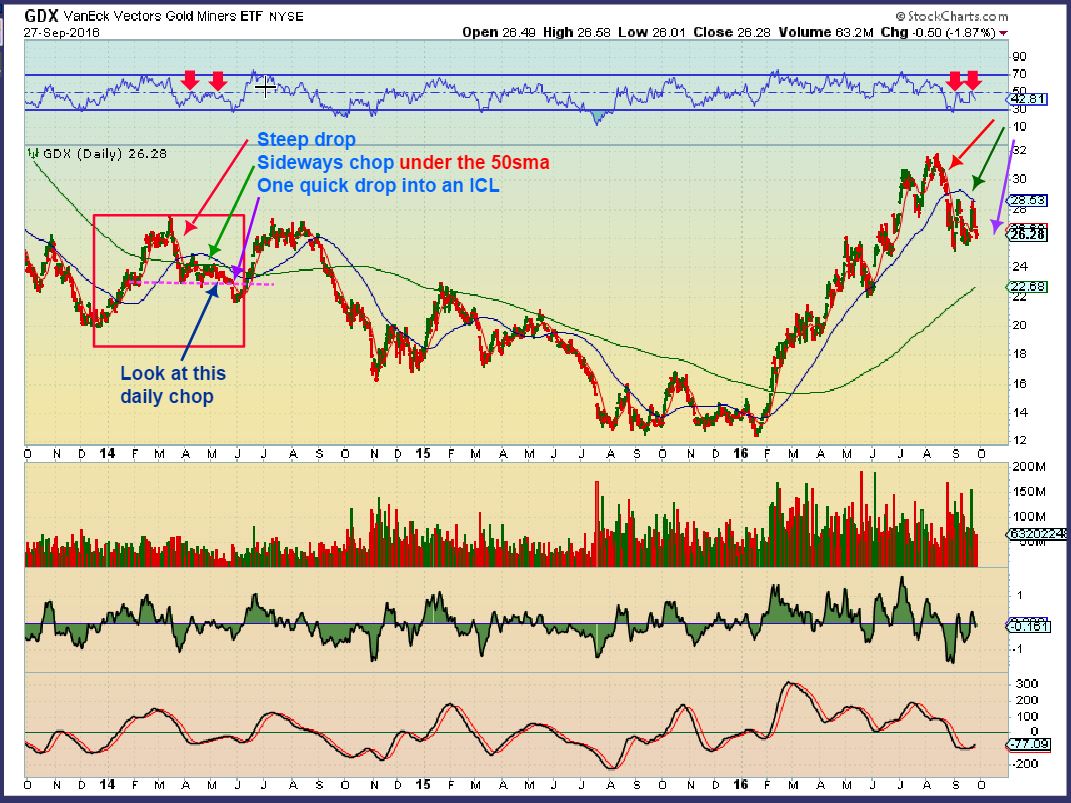
WE WILL BE READY TO BUY IF THAT HAPPENS HERE, but are you patient enough to wait out the choppiness? It is not easy day by day, but it will be rewarding.
.
Right now, the Energy and Precious Metals markets are very choppy and hard to make any lasting gains unless you buy a reversal and sell it within a day. Chartfreak is not a day-trading website, though we do discuss shorter term trades in the comments section. For now, I think we are watching the FAT PITCH setting up. We will make very good gains in the future once the sideways chop ends. Are we seeing exactly what happened in early 2014 play out again? I cannot say that for sure, but so far we had the steep sell off and a whole lot of sideways choppiness chewing up time and frustrating everyone. Patience will pay off.
.
~ALEX
.
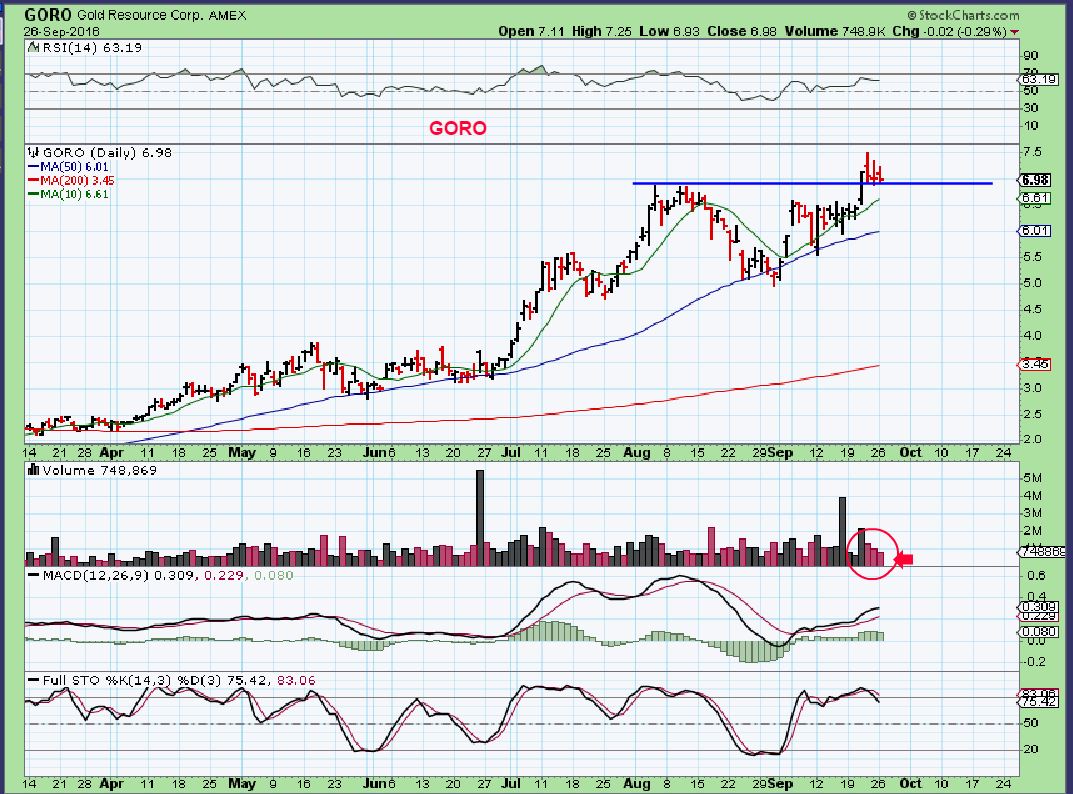
I will add this- I posted charts at the last low and discussed buying some trade set ups. Maybe you sold some for a little profit, maybe you held on in case they stay strong? I bought a few and have sold ASM. Others that I own, I may just hold on to. Why? Some may just do very well on the next run and may not make new lows. For example: Goro has remained very bullish.This will probably hold up rather well if we get a sell off. Yes it could drop to the 50sma, or it might just go sideways.
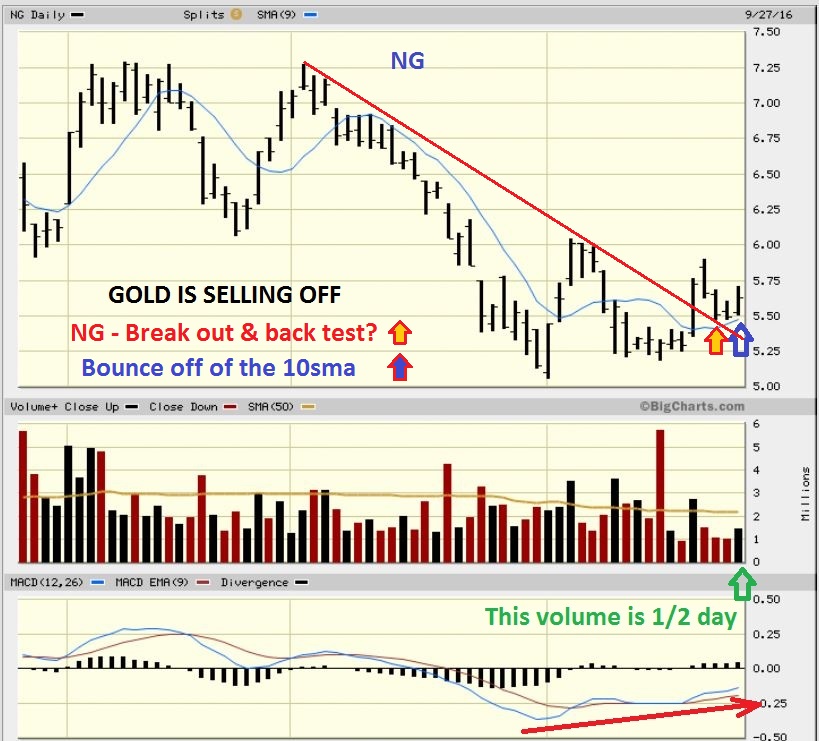
NG – This was Nova Gold with Gold selling off $11 yesterday . AU, RIC, and a few others also did the same, so some Miners may try to hold up despite selling. Reminder: I pointed out in some earlier reports that some Miners bottomed well before the final lows of January 2016 and NG and RIC were 2 of those companies.
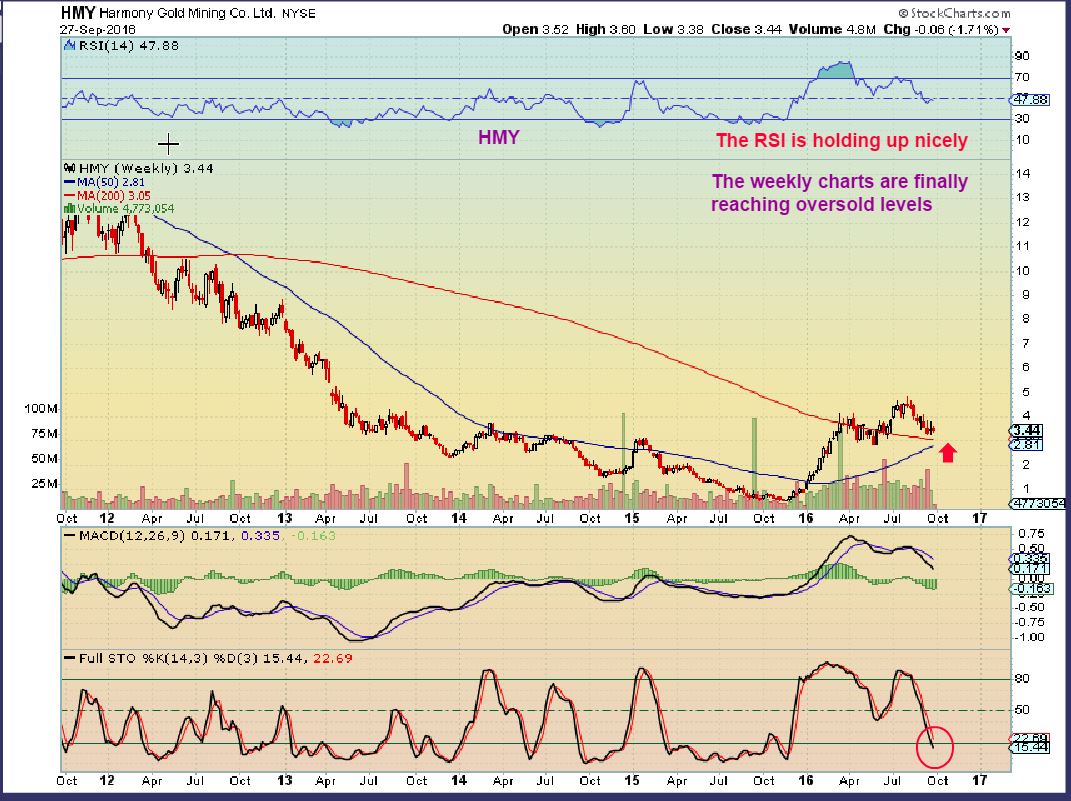
I mentioned HMY a week ago and showed how HMY might only bounce and then sell off again to $3.00 area. It has been dipping down the past few days and I really like the potential longer term.
I think that it could drop to $3, but I will not sell what I own, I will add if it does. $3 to $6 is very attainable, but even $3- $9 is not out of the question here. The longer term weekly charts are finally reaching oversold, yet the RSI is staying bullish. $3 to $12 in this longer term chart is also attainable with a core position.
ALSO –
Instead of simply repeating myself day after day, reporting chop after chop, I may start to place a few trade set ups from other sectors in the reports for those that want to trade shorter term. The biotech area has some great set ups, but the risks are HUGE with biotech stocks due to individual trial results, FDA rejection, etc. etc. You can trade XBI or IBB ( LABU if you are experienced with 3x ETFs). The gains are pretty small in my opinion for XBI or IBB, unless you use options or another method.
For the higher risk takers, many set ups are looking good in individual stocks. May I recommend keeping positions small or manageable, in case company specific problems result.
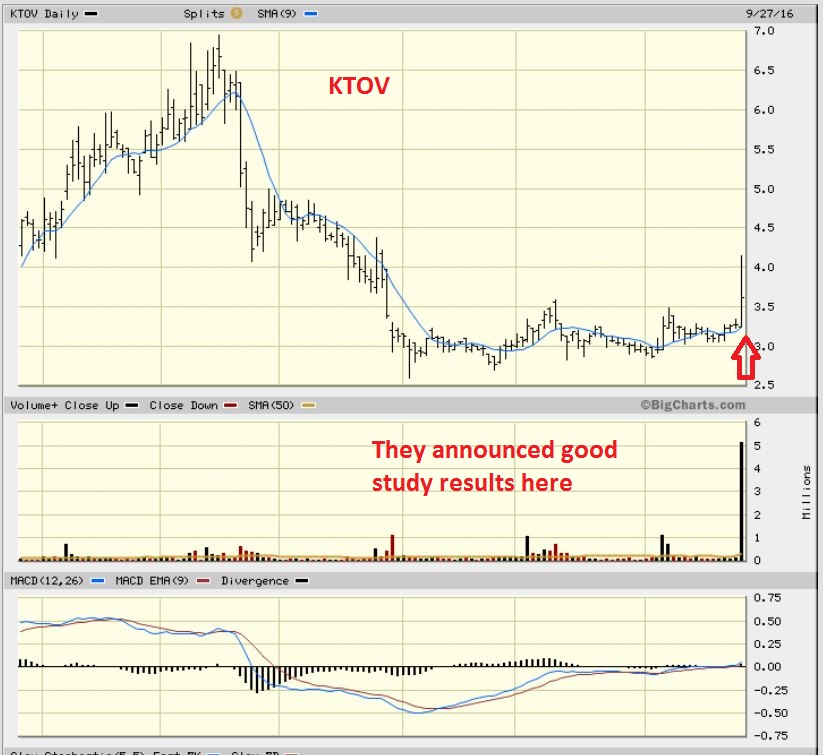
KTOV – Can this return to $6? Yes, these patterns often do. It sold off at resistance yesterday.
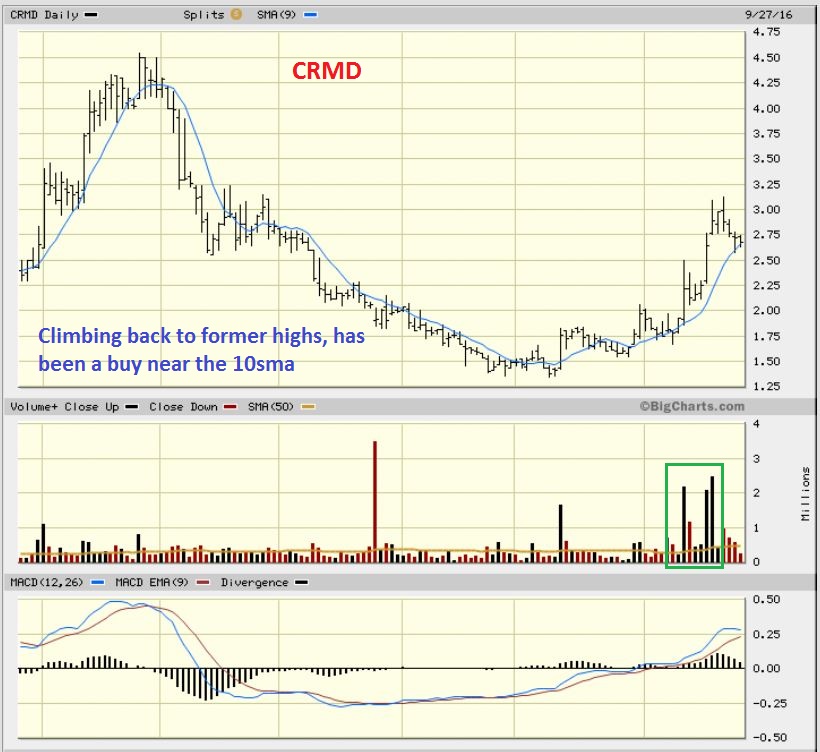
CRMD – This is an example of how they can climb. Not always straight up, but they often form cups using the 10sma as a step.


Alex, Thanks for charting KTOV!.
You mentioned it first in the comments. I have about 40 on my list, but that one wasn’t on there, so thx to you too : )
JUNO, VBLT, MACK, CARA still interesting too. I just added those names to the end of the report, we discussed them in the comments section yesterday.
Alex, 4-5 days ago we were talking about the DCL being in for OIL. Now you are thinking we go lower? How does the US Dollar effect the price of OIL?
With OIL – Some people were saying that the dcl was in at the first of September, but I was saying that it was too early since i was only day 20 or 21, usually 30- 50 day cycles happen in Oil.
With the lows on Sept 20 ( day 33), we were within the acceptable timing, though still on the early side. I believe that the Sept 20 lows did not actually break below the Sept 20 lows, and I usually only see this happen in a triangle formation, so I would expect that a lower low now would lead to a dcl and be better timing wise too.
Also Refresh and draw your own conclusions
https://uploads.disquscdn.com/images/515558e9d21e261e3b85964223ca88f9fcde2b0e3d13d6498c20ceb0440e61a7.jpg
I’d like to know what you think of the AB=CD patterns playing out on the USD. Am I just trying to see what I want to see? Looks like it is flagging and setting up for a drop. F5 https://uploads.disquscdn.com/images/2ad202880581e2018b39275c0f530da0e85bddf259ac6dd839457ab0355764ea.jpg
It is possible. Even though the dollar keeps bouncing too, I dont see real strength in it. I am expecting it to drop in the future, but ‘when’ is a bit hard to figure out.
Your a-b-c-d patterns could play out
Alex, thanks for sharing, the chart says it all.
It almost seems the USD is being “managed” going into the election so as not to create the waves we so love. I know that is a statement on politics and forecasting both of which are a mugs game, but the opening prices for the USD index for the past 2 weeks are within pennies. When does that ever happen??
“mugs game”
Not sure exactly what is meant by that, but I like it : )
noun: A foolish or futile activity. ETYMOLOGY: From mug
(slang for a fool), from Scandinavian word mugg/mugge (drinking cup).
In earlier times drinking cups were adorned with grotesque faces, which
resulted in the various senses of the word, nouns (face, dupe, thug) and
verbs (to assault, to make faces, to photograph)
interesting….
very interesting……
oh hi kennebunkport 😉
Hey Tonto….. 🙂
Sure do miss your EW expertise and charts…..:(
aww… wellll .. not much to add.. just waitn on the infamous corrections to break …
been taking quick scalps on nugt and uwti .. and actually 100% cash in my trading acct yest&today.. kinda sucks but it will be worth the wait… 😉
yes .. indeed.
ps. CF – i like ur new format idea – providing setups and cutting the blah blah blah…
*giggle
https://uploads.disquscdn.com/images/ca92e4a7155550373e2610b2baa5ea3e2c323658492b77c71e7ced0b8242e9e4.png
Speaking of cutting the blah blah
–LOL
https://uploads.disquscdn.com/images/35cfa18c88a1fbdc13aae9b0f3b6693177c84b38f5914a44c1aea62f9c83802e.png
Now I’ve seen it all . (maybe?)
ohhh … hardly chartboy… 😉
Alex, so basically today we’re day 40 and have a left translated cycle – so that doesn’t look good for the next cycles ?
or am i wrong ?
I know what you are thinking, because a Left Translated daily cycle usually doesn’t bode well for the next one, unless it falls into an ICL. The daily cycle before an ICL is usually L.T.
If you get a 2nd daily cycle that is L.T., the 3rd is usually weak.
thought we had an ICL low early August, which means we have 2 more d cycles to go no ?
if so, they should be not really great ( to say the least)
Sorry, my bad, I was thinking Precious Metals.
In Oil, I see a triangle type formation. I have always said that when I see a triangle I usually throw out cycle rules, because it has changed the character in the past. SO I am not worried about the L.T. formation in Oil.
Whew……
I was scratching my head on that one too…..
i was wondering bout that,… cuz sometimes you get that sudden impulse wave1 out of the low,… then a longer correcting choppy/triangle wave 2, which results in LT cycle into the low of this wave 2,,,, n’est pas?
*n’est-ce pas
correct my crappy french before LeChiffre sees it 😉
Clearly I was struggling on this one as well! I saw the triangle last night when reviewing USO (my post was pretty late)
this is my EW simplification of USO…
current wave 3.ii looks like a choppy corrective affair, so we could drop lower (for Alex’s cycles timing), although it has put in a zigzag already
https://uploads.disquscdn.com/images/3142f7b9eecdd31abeafbdde61e4b68fe2b3cc7717714369ba90836f6d6fc984.jpg
… and we could still be correcting down in wave 2c, going still lower than sept20th,… unless it truncates or does something daft 🙂
That’s pretty much exactly what I posted last night as my count (but my chart ain’t quite so fancy). I was hoping Wave 3 would be “better” than the crap sandwich we’ve had so far.
Here are my clues: we break below 20 Sep, we’re still in Wave 2. If we break above highs ($51.xx) then we’re in Wave 3.
and let us never forget.. wave 2 can retrace 99% of wave 1
… and i mean, even if we’re already in wave 3i/3ii
Alex, with the big move in OIL today, we could be on day 5, with the last cycle lasting 33 days. Thoughts?
This would bust us up through the top of the triangle. Back test would be a buy?
Huh…..?
Lol..
The 1dt dc is wave 1 correct?
Hello Alex. Forgive me for being late tonight. What do you think about the ATLS chart today? It finally got a pullback I believe you mentioned something simular in disqus…weekend report. Thanks!
Yeah, I fell for the DCL last week. It hasn’t been pretty.
Ya, not much pretty in my account at all…..I decided to Christmas shop on amazon while I wait for things to turn…hahaha
So hopefully we can get that next trade-able low before the bill gets here! 😛
Yes, yes please! 🙂
SmartGal ;o)
Well shoot, had a cute shopping picture to send you but it won’t upload…#sillycomputer
Another warning to those trading individual Biotechs, – happens again and again. You need a basket or the risks are extreme.
Check out GALT – Excellent run, and then today, down 50% at the open due to disappointing test results
Thanks, again, Alex. I don’t need any nasty surprises. 🙂
isnt that one ur nemesis?
That is! That is the one that burned me way back, and so did CGIX.
Look at GALT is 2014 – I git caught in that waterfall : (
GOLD selling off, lots of green Miners (So far)
just looked at CLD, CLF, X, AKS , CENX, all still look good here, they are tagging the 10 sma & acting the way they should
How about VALE?
Vale too, but I look back and it always does seem to try to fill those gaps ( look at June and July)
X is up nearly $4/share since early last week (or close week prior, from memory).
CLD – 1 year chart looks just like that cloud “peak” long term a Dianna Ross hit title (starts with Ain’t) 🙂
AMRS broke out, dropped back to the 10sma, and seems to be moving forward again.
. https://uploads.disquscdn.com/images/df9a908e004d78ca13bf5db6a32a657740b584f8c20e7c070ae53d99b276e852.jpg
refersh
.
P.S. I never sold any, I got this one closer to the lows. I still like it.
Oh, Janet Yellen is speaking live on Capitol Hill—
THIS ought to clear things up!
lol
Just for grins, here’s a daily chart of gold –
the top blue line connects the 2011 all-time high with the 2012 high
the bottom blue line needs no explanation
the “E” notes the employment report on Oct. 6
the “O” notes options expiration on Oct. 21 – which also happens to be where the 2 lines intersect
I guess the takeaway is we can go to the beach while we wait for the triangle to resolve!!
(now let’s see if this old guy can post a chart!)
https://uploads.disquscdn.com/images/b1be63f0b16972c529ecda9557e408c1f1f9111d62c1bb2241bd2fe55c6a0288.png
Excellent chart Cal.
I am watching that triangle myself…….
And that solid blue trend-line that makes up part of it.
Do you mean one of the blue lines near the base? Revisiting those would ruin my day…
No the channel, I’d like to see Gold hold that, but it seems that an ICL drop could break & hopefully recover it
That is my thought process too…..not my preference though. 🙂
nice calgonTakeMeAway 😉
not a whole lot of breathing room left there in that corner….
DDD and XONE were real moves coming out of their bases, see a yr chart.
Then look at a 6 month chart of SSYS & VJET Could be trying to break out here (Same sector) .
GDX just rolled over a bit
Thank you Janet Yellen for changing Green to Red.
And she’s done talking and everything is green again. #muzzle
And to think that Nancy is just floating around on a cruise ship missing all of this market action….zzzzzzz !
I’m off to lunch….Chop Chop!
better hurry up and get off the can … there’s $$ to be made…
https://uploads.disquscdn.com/images/8389b64b0c4d1b25c571794b3d8d774333bd0692b458a08516b3e19f8260aa4f.png
I caught the move a bit late on my phone- took me an hr to get back online where I could really get an overview
can i please please please be a fly on ur shoulder tonite … daddy?
teeehheee
That was a crazy intra-day trip in oil. I used the 1030 inventory release to release the crude position I took last week when I incorrectly thought we’do hit DCL. Seeing a lot of variance in energy performance today. Many are flat or even down a few cents but OAS is up big (7% currently) which is also really interesting since the stocks definitely aren’t showing the level of volatility that crude is!
yeah.. i got DNR up near 6%, but PGH feet glued to the floor
PGH has a bottom around the $1.40 ($1.36 as the low) range since May…..seems to want to hold there…hoping it will go on and crawl back up…
Gap fill in UGAZ. I like it here 🙂 with a stop…..
OPEC to limit OIL production.
http://www.cnbc.com/2016/09/27/oil-prices-climb-after-industry-data-shows-us-stocks-draw.html
hooo hooo hooo.. weeeeee
WTF?!? Al-Khalid promised no deal. Bastards, I sold at the lows again. Somebody please ID the next top for me so that I can buy that!!!
No deal firm. Article says they COULD reach a deal later tonight.
I’d like to jump in on some stocks but not sure til we know about a deal….haven’t been able to be in front of computer as much today so wasn’t sitting on ready when the word came down….but now oil is up $2….
It does look like a break out in USO, but it could be a knee jerk reaction to the news. I am holding some cash and will not be buying anything more here.
Yeah I sold AREX in one account yesterday because it just wasn’t acting right…sold at loss….now today…geez. I guess patience would have been a better thing for me than fear….argh. I do still have it in another account but it’s still in the red, just not AS red as yesterday…
they really could have told me this earlier. I wouldn’t have stopped out GUSH yesterday. sheesh
This move in Oil stocks looks real, and GDX looks like a Bullish engulfing too.
AREX, OAS, PQ, BBG, SDRL, DNR, BTE, EMES, SM, etc etc – MANY more up double digit
Even GSS is actually a very good looking chart
https://uploads.disquscdn.com/images/07f1119da7d7c3226efe4cf752b5927258b8511da6009b28a6772637be327767.gif
Added to my positions in OAS, AREX, WPX. Re-purchased CHK. Hope there is substantial follow through in the coming weeks.
At least your entry is rather low risk when you consider Risk to reward
upside potential vs downside
That’s all we can hope for, sometimes.
OAS OMG!
AREX and DNR beat it %-Wise….some big break outs today
I know. I sold DNR as we started wave II decent, essentially near breakeven but needed to reduce risk. still on watchlist. there was maybe a 20% chance OPEC went through with this. I wasn’t picking any more pennies up in front of the steamroller. I’ve gotten hit enough. I don’t follow AREX. The small cap stuff is way to risky.
It’s actually the bulk of my IRA. I was actually red on that position before today. I’ve had it over the last month and it rose, then fell, and now hopefully a bigger run is coming.
I hope she runs for you. I don’t think I want to retire based on recent energy performance! I’d have a heartache with these moves before I ever get to enjoy it!
gdx wedge breaking out on 10 min chart
anybody knows how it come that I m unable to add pictures / a jpg file of 150 kb ?
This is Rays wedge chart
refresh
https://uploads.disquscdn.com/images/9aacaaffd37bf4fc79a3c7d3c3616ee5db8c116bfca719b9931d2850c3758e86.jpg
I’ve had the same problem….thought it was just me….
Try refreshing the page…. sometimes that helps…
That is a high volume reversal in ERF today. Looks promising near recent lows
This is one I’ve wanted to get but held off….. does it still looks like a good buy even with the 10% up today…? I’m thinking yes…? Big volume right at the close…
Yes, many do. I hope some dip down at the open tomorrow, but they may just keep running.
im totally fine with that … 😉
ERF is my biggest goat that I still own. I’d ejected the rest of my chaff but held this one. started the day down 20%, guess this cut that in half. Hope she keeps running. 2.5X Avg vol today
Does anyone remember when NADL ran from 2.50 to $8 on the last run ( It did a big reverse split and that may be why).
USO just can’t seem to break that upper TL.
My count remains intact……. https://uploads.disquscdn.com/images/bc17b7f375aa32e8f9ca9c43fdfe55bbbd8e16731e57215a0b203209d6f380d7.jpg
meow
I think it will break it very soon.
The volume is very big ( could be mixed with short covering) and the MACD divergence is steep : )
If we could only get Maria to start buying “THAT” would break it ! 🙂
RSI too looks good. Not too mention stochs not close to being overbght.
wellll … i should have clarified.. i was in cash in my [day] TRADING act.
.. not swing acts… 😉
prepare for the motherLode 😉
LOL
#IWISH
2 Accounts ! I might be “out of my league”. 😉
3 actually … S,M,LT … but im pretty sure all 3 of mine combined dont make up a 1/4 of a 1/4 of ur 1st ‘tranche’ ….
LOL….your too funny…..and Smart I might add with having 3 accts. LT i hope are in some sort of 401K?
My LT is in a Roth IRA …….
yes..401k, Roth, Tradingact
Sweet Retirement !!!!!
ohh oops .. and NYS pension …
#SorryNotSorry
Teachers Union ! Nice….
Wish I had your healthcare !!
well…… God willing benes will still be available by the time I retirre….
Dont worry Hillary will take care of you…… 🙂
yikes
🙂
*and beautiful … (or so they say)
LOL
Who is “they” ? Sorry JK 🙂 couldnt resist.
https://uploads.disquscdn.com/images/c47d728553e2c4692c6967081e43f0ce95c834caaaaad59eca389000ee9f930a.gif
3 of iii coming up?
Was CWEI really a $6 stock this year?? If We only knew then what We know now!!!
BAS is finally saying “hello i am still here”. +19%
And the bases are sweet on a 3 month charts too.
Did you see REXX, BCEI, SGY? They could go under or to the moon : )
lol… yeah…grrrr rexx 😉
REXX and SDRL have Massive reversals. ( Could be partly short covering).
I got stopped out on that ….
Did I mention that I sold my CHK and AREX for solid gains and was happy about it?
Hmmm, I may not be very happy about it if this keeps up : )
🙂
Check out the base on GST ( And reversal). I just cant tell if it is ready to go, but it looks pretty promising , maybe if it gets above the 10sma
THM….my winner of the day. (in this sector) +11%
Yes, very nice. I love it when my juniors beats JNUG : )
nice reversal in MUX today too – tie with JNUG, but I own neither at the moment.
Yea I should have kept a few shares of MUX I sold when I reduced exposure.
Too. Much. Risk.
i sold mine this morning as well as 2/3 of my REN position – they call that money management – this jump feel sour
Also for late arrivals…It was around $62 on Sept 1 and today it was over $84. Not bad either.
Unreal! I sold at $30 when oil went down into what we now call an ICL and what did CWEI do? WOW!!!
If DNR will have another good day I might actually get out of the red on that one….wow, up 21% today….should have added more!
IF I had my wits about me today I would have bought MORE PGH before it went up .13…..to double down on the red I have in it and would have been more ahead (or less red or maybe even in the black…)…….one day I will be quicker to respond….one day….
Amen! I have been too busy at work recently to be quick enough on some of these plays. Need to stay more agile!
OIL! F5!!!
Triangle, Stock, Volume. Check it out, all circled to draw attention to…
https://uploads.disquscdn.com/images/bcbfdc2e39e87f562161d8923de104c3b4bfd58f45ba7f33edadaac52203ae71.png
Insider buying for gold and cooper stock EGI