
September 25 Weekend Report
I mentioned in a few of my August reports that things could remain a bit choppy going forward, especially if we are entering the timing for an ICL in Gold & Miners. We saw this in both OIL and Precious Metals markets in the past, and I will again point that out in this report. That type of price action can be frustrating, because the trade set ups quickly break down and the price action becomes more or less sideways. Lets take a look at what we currently see and discuss what we could expect.
.
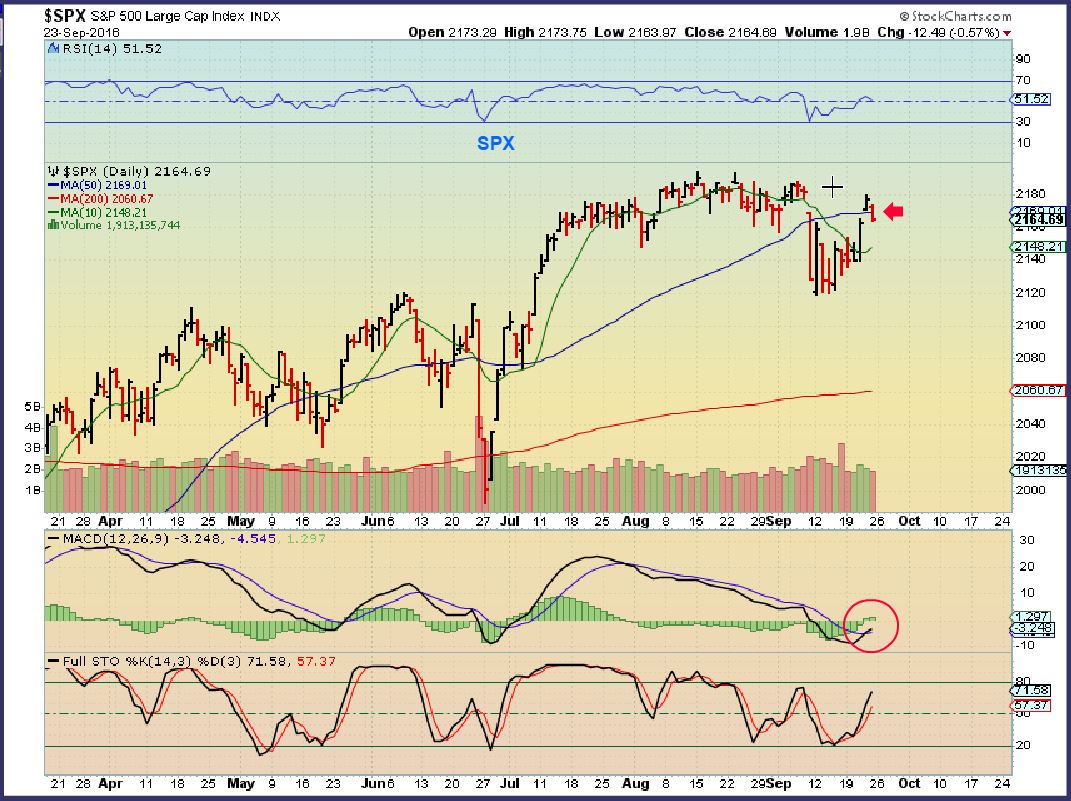
SPX – Our daily chart had a possible Island Bottom Reversal, but the gap closed and it lost the 50sma. This is not overly concerning at this point, but I liked the idea of an island bottom.
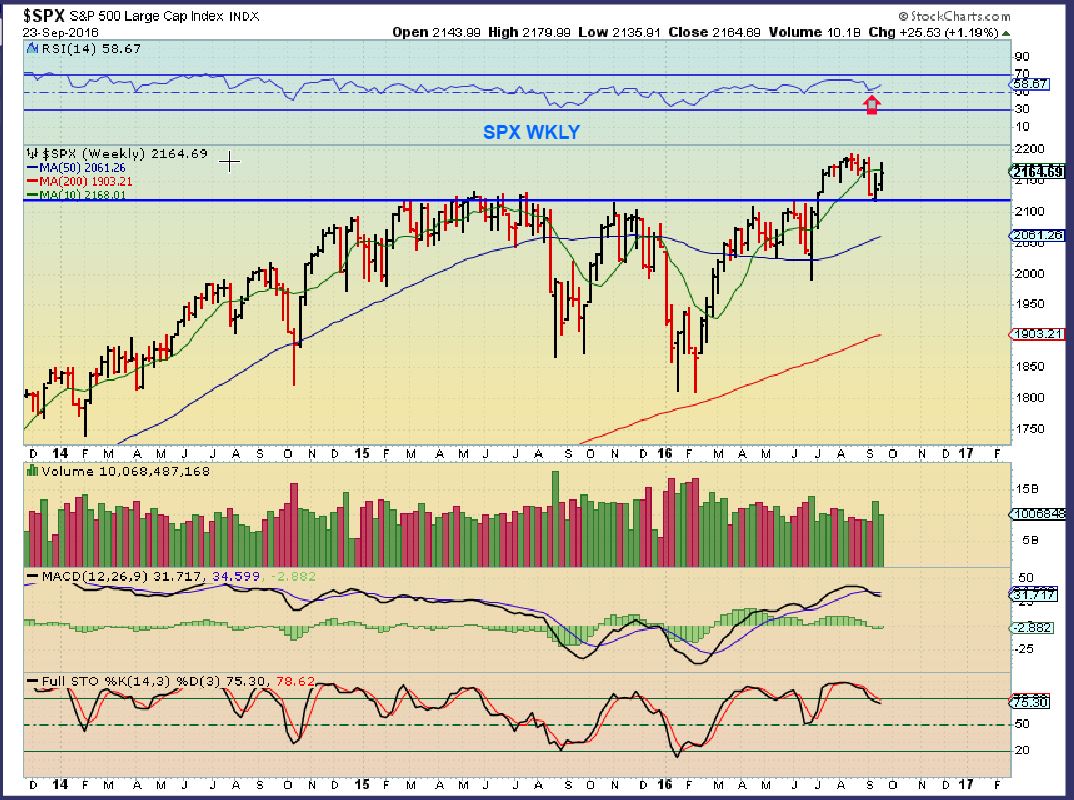
SPX WKLY – This still looks like a great weekly set up.
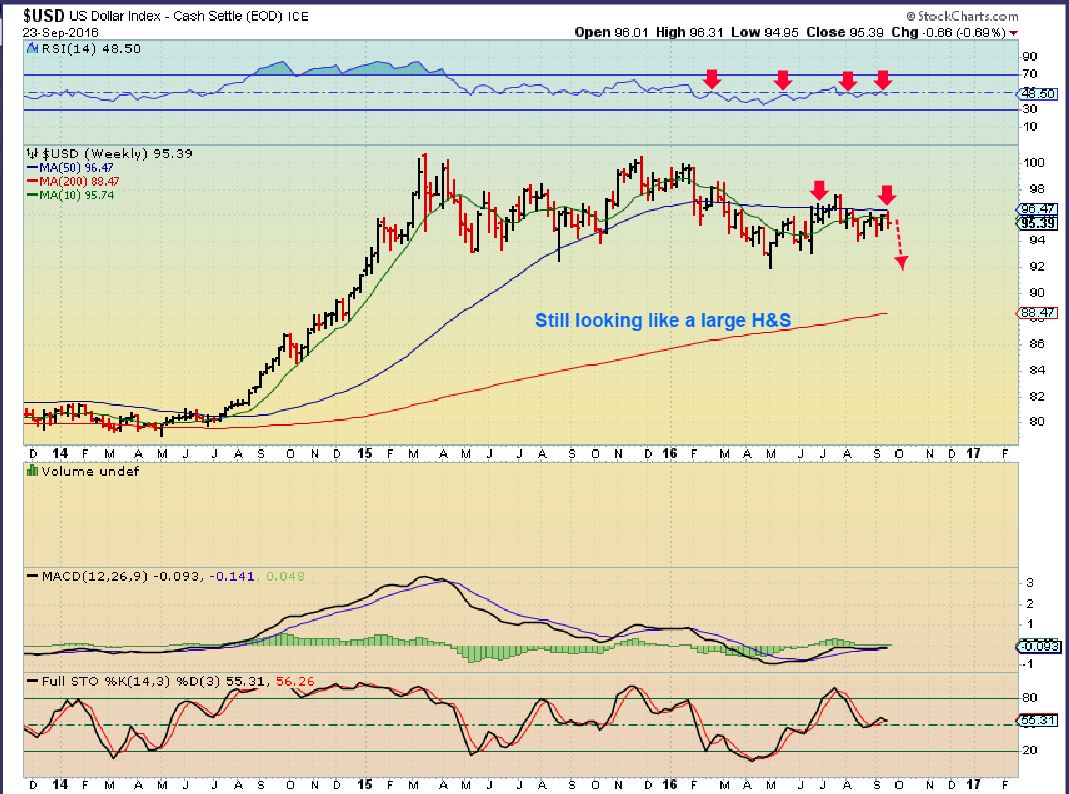
THE USD – The big picture still looks like a topping process.
.
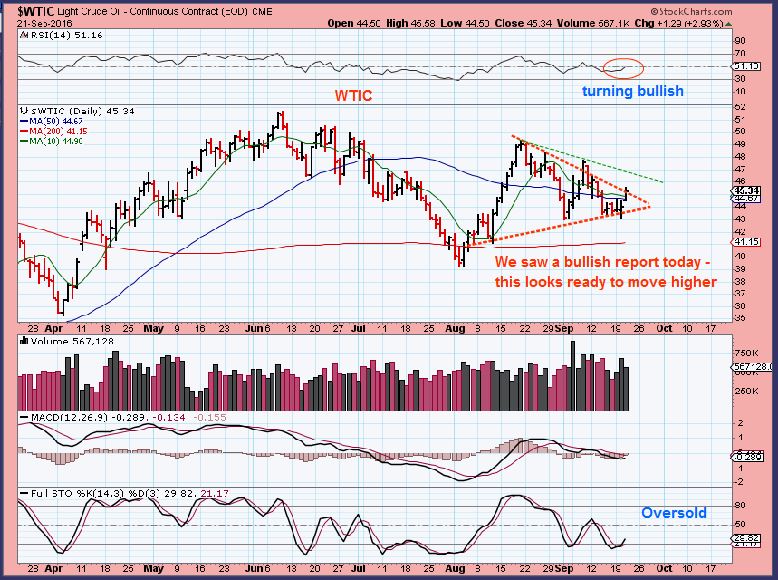
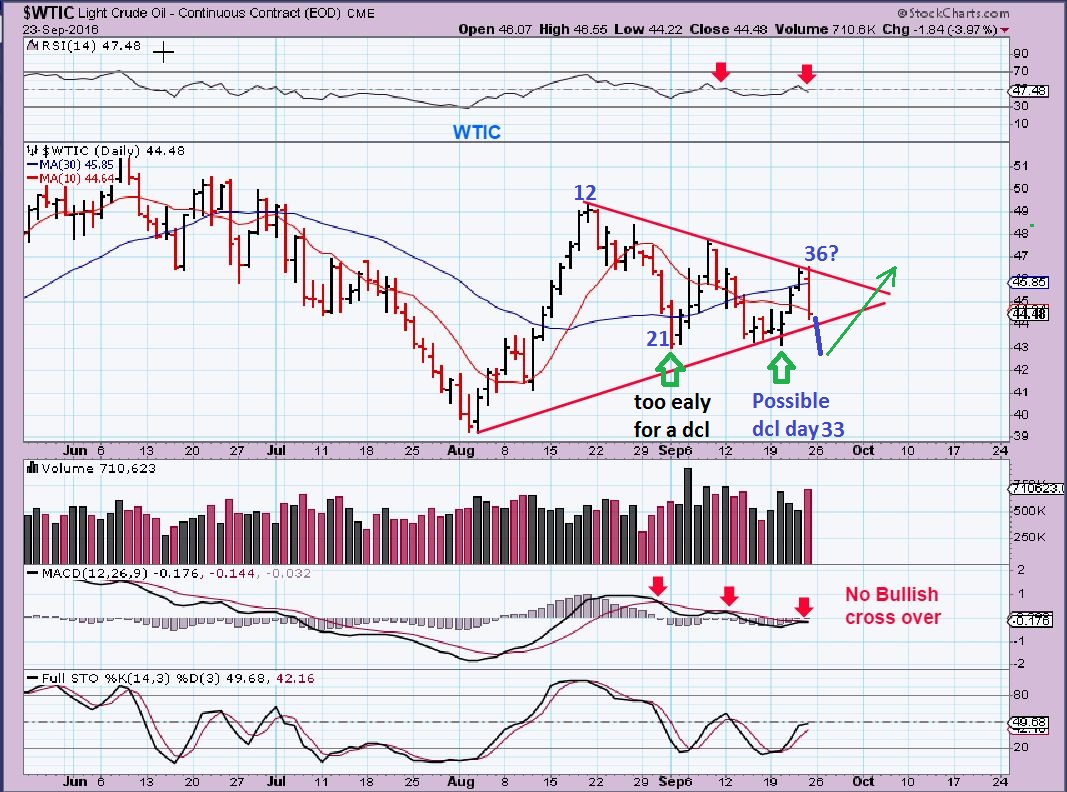
WTIC WEDNESDAY SEPT 21– This looked like follow through to a day 33 dcl, but I did mention that it was on the early / yet acceptable timing for one. The oil Daily cycles can last 30-50 days.
.
Thursday had follow through, and Friday it rolled over. 🙁 I am thinking that we might still have the dcl ahead, because we’re on day 37 as of Monday. This is that choppy trading that is very hard to make money in in the short term. A break below the ‘possible day 33’ lows could be the dcl, not a break down. I will watch for the Energy stocks to show strength even if Oil is dropping.
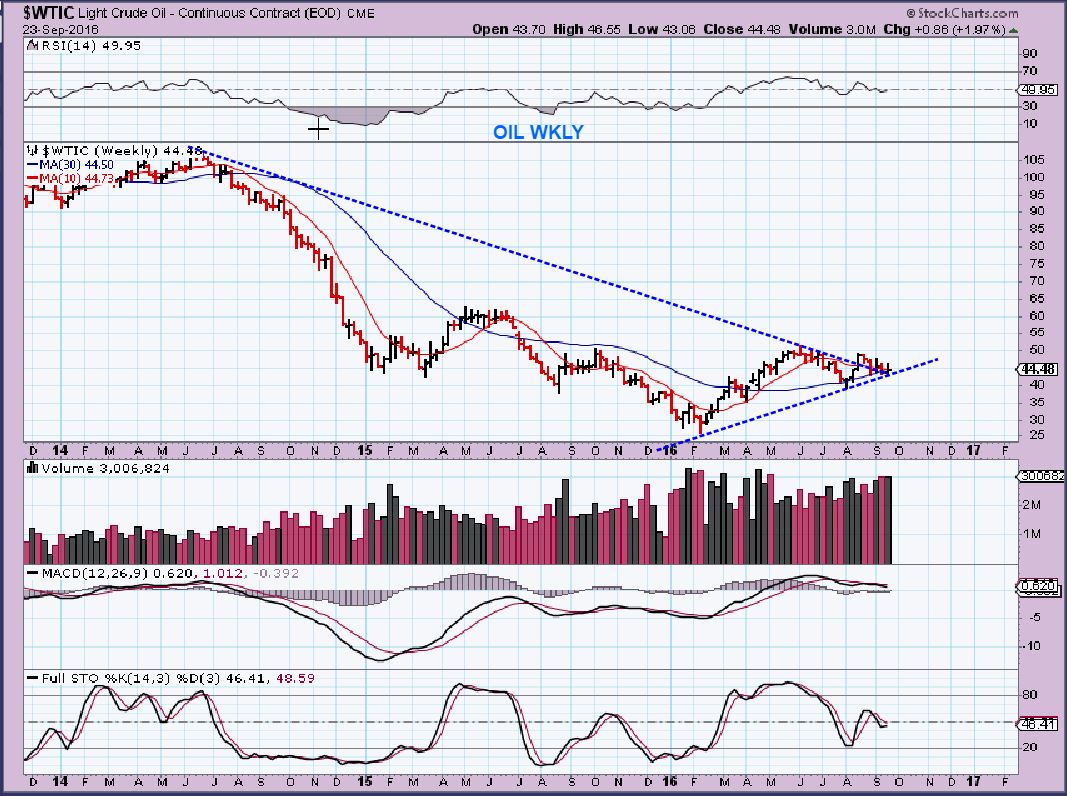
WTIC WKLY – Still OK.
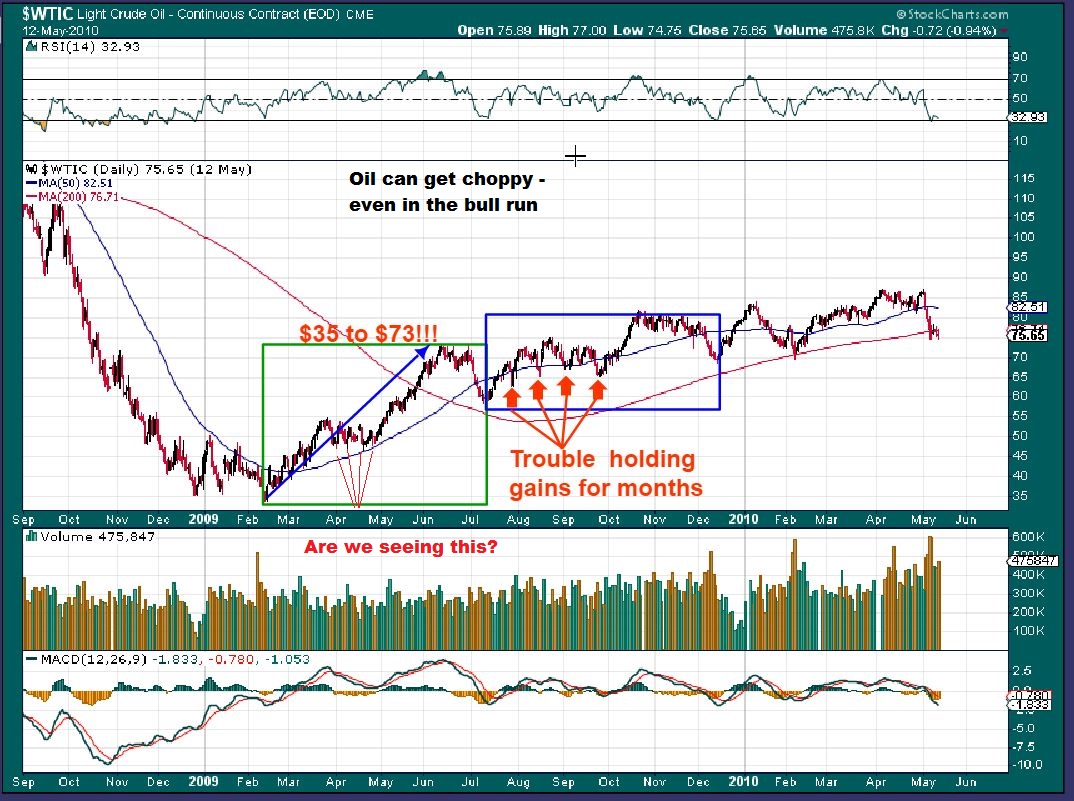
AS A REMINDER:
This is the chart where I pointed out 2 areas that the day to day choppiness lasted for months and be makes it difficult to profit from. It does NOT call into question the Bull Market longer term. This is what you may be experiencing in Oil & Energy right now.
.
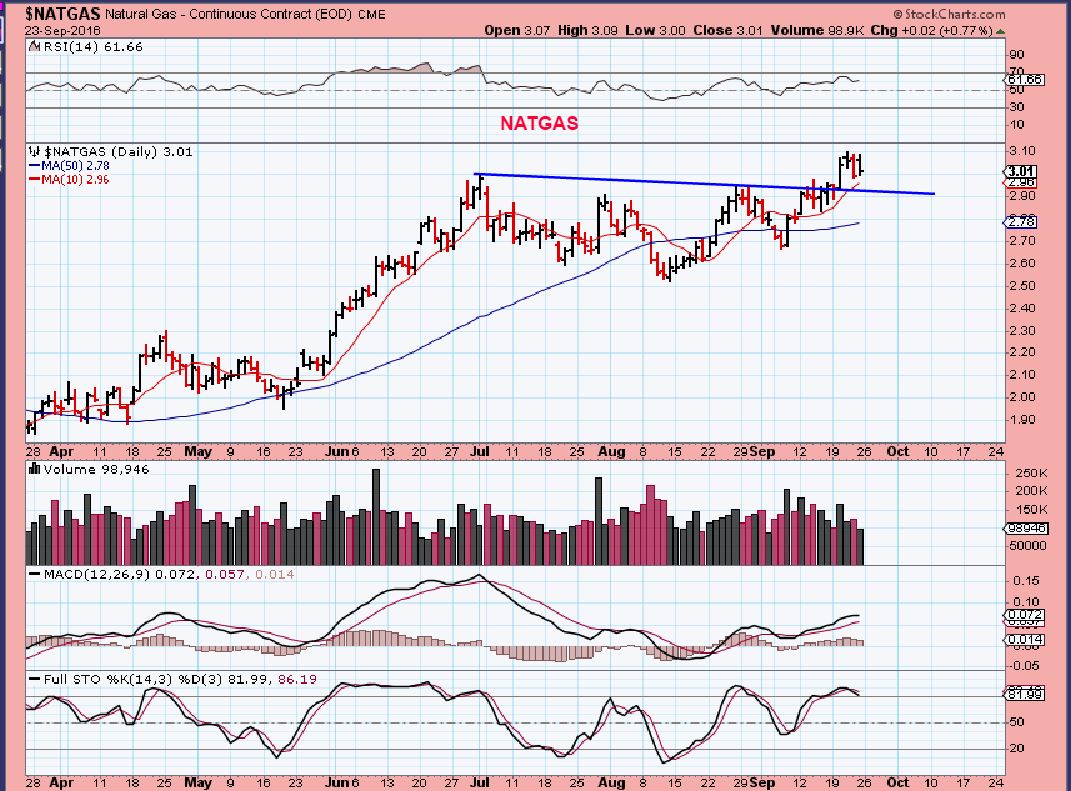
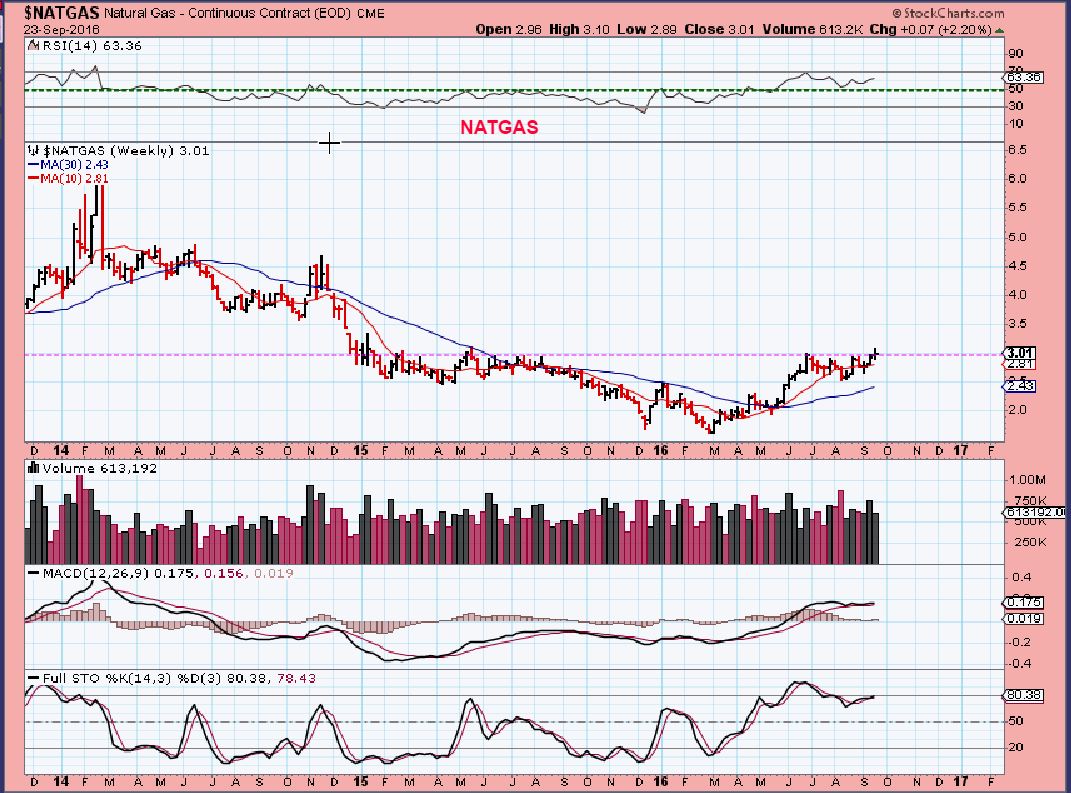
NATGAS DAILY – Back test of the break out in progress? Still very bullish.
.
NATGAS WEEKLY –
GOLD, SILVER, MINERS
.
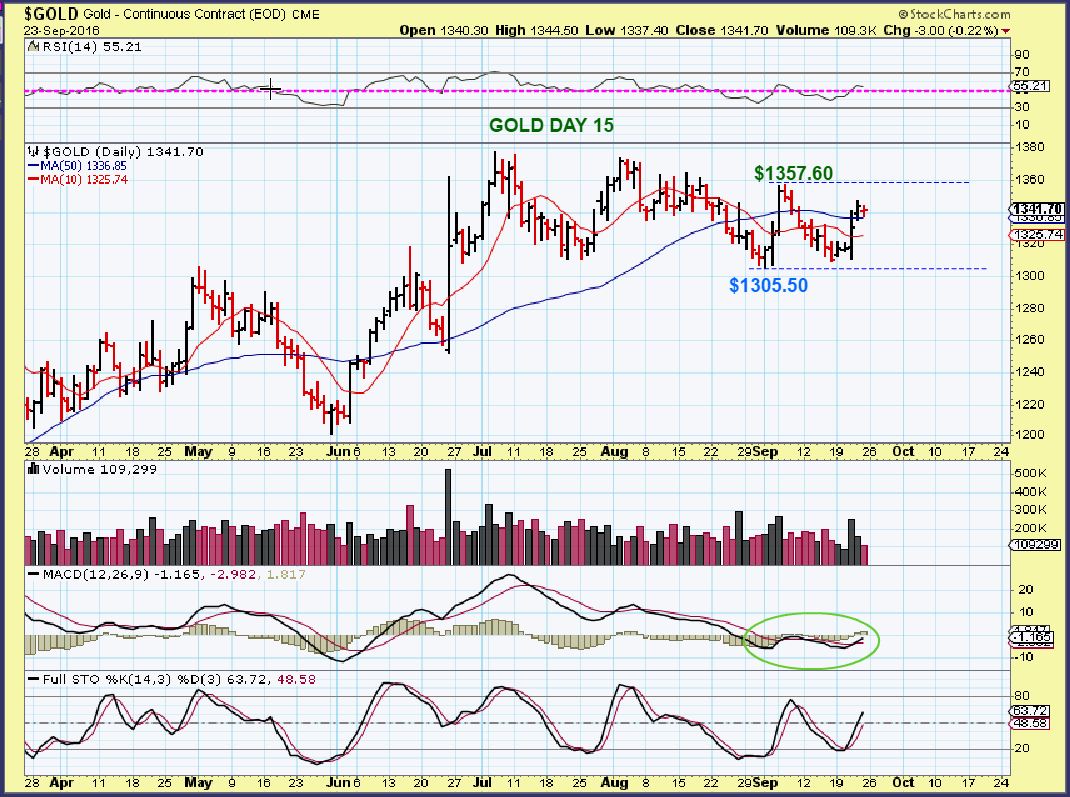
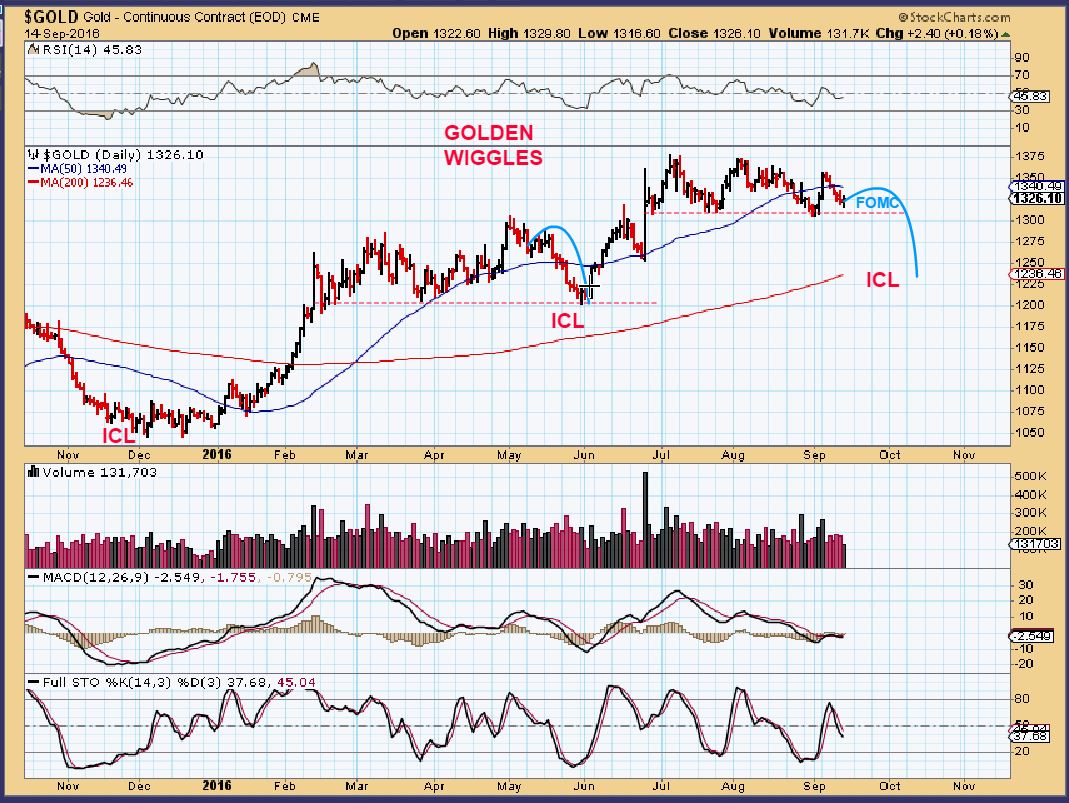
GOLD DAILY – GOLD is dropping Sunday night as I write, I am watching the 50sma at $1336 for possible support, but it has been taken out so far. Friday was day 15 and also Gold is basically choppy. If the $1357 upside is taken out, we would be seeing a right translation possibly happening. A drop form here could lead to an ICL. This chart actually looks more bullish than bearish. Lets see what happens Monday.
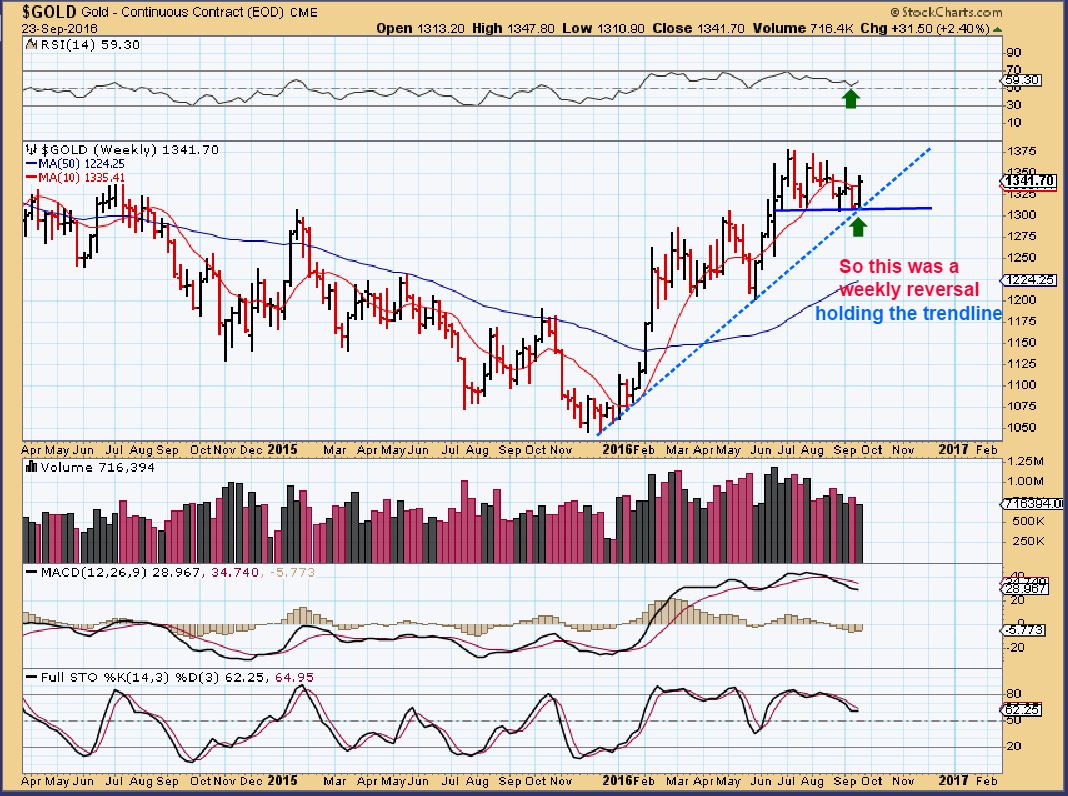
GOLD WKLY – We saw a wkly reversal last week. The RSI didn’t break down, and the trend line held. This also is more bullish ( at this point) than bearish so far. Let me remind you…
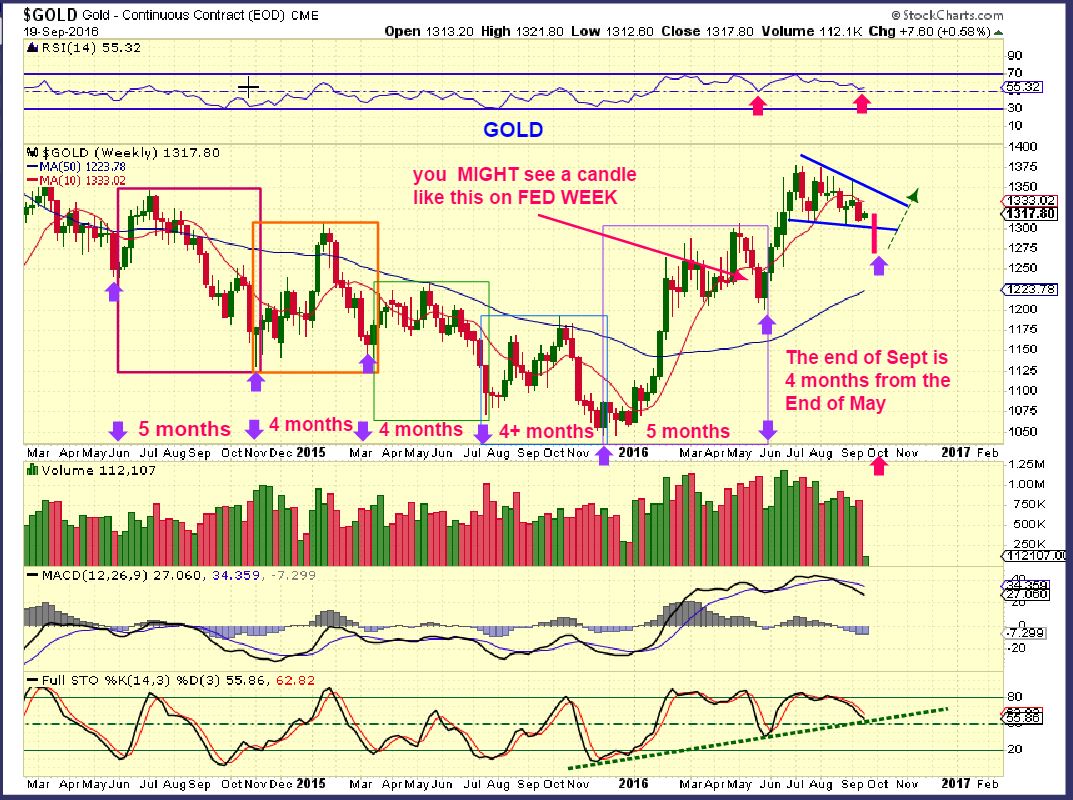
REMINDER – I used this chart on Sept 19 to show what a flash drop into an ICL could look like. Last week Gold spiked higher and not lower, but since Miners didn’t follow, I want to keep this fresh in our minds.
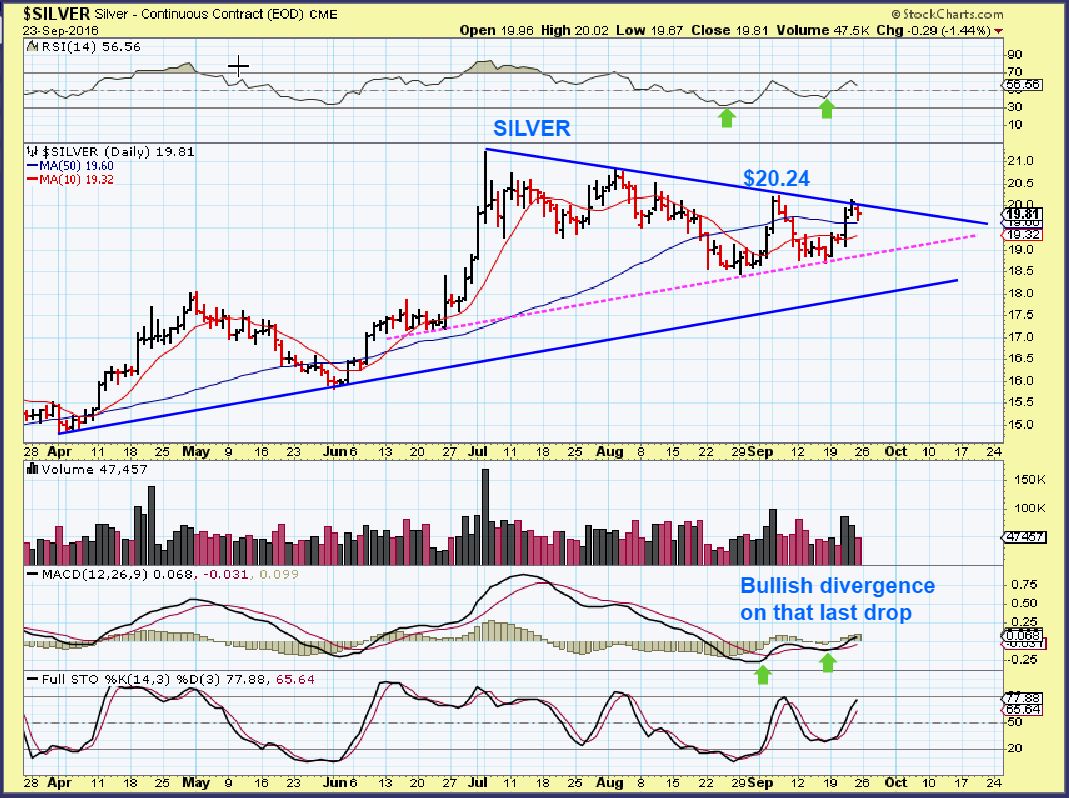
SILVER –
.
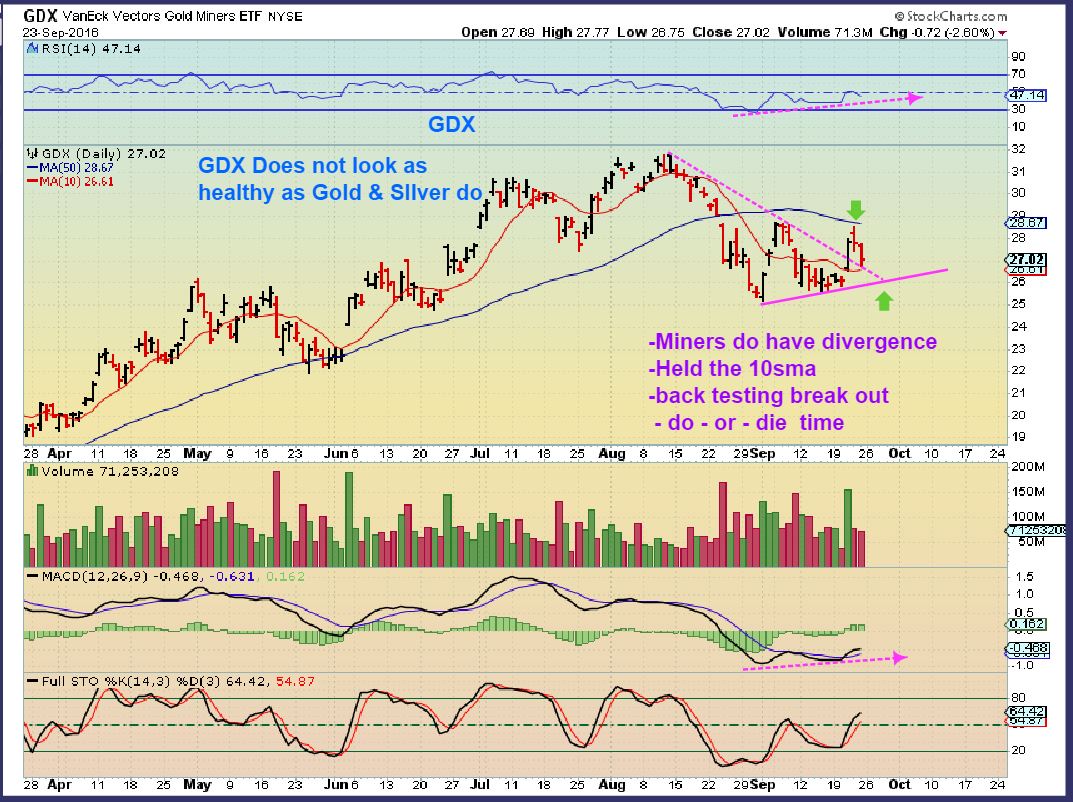
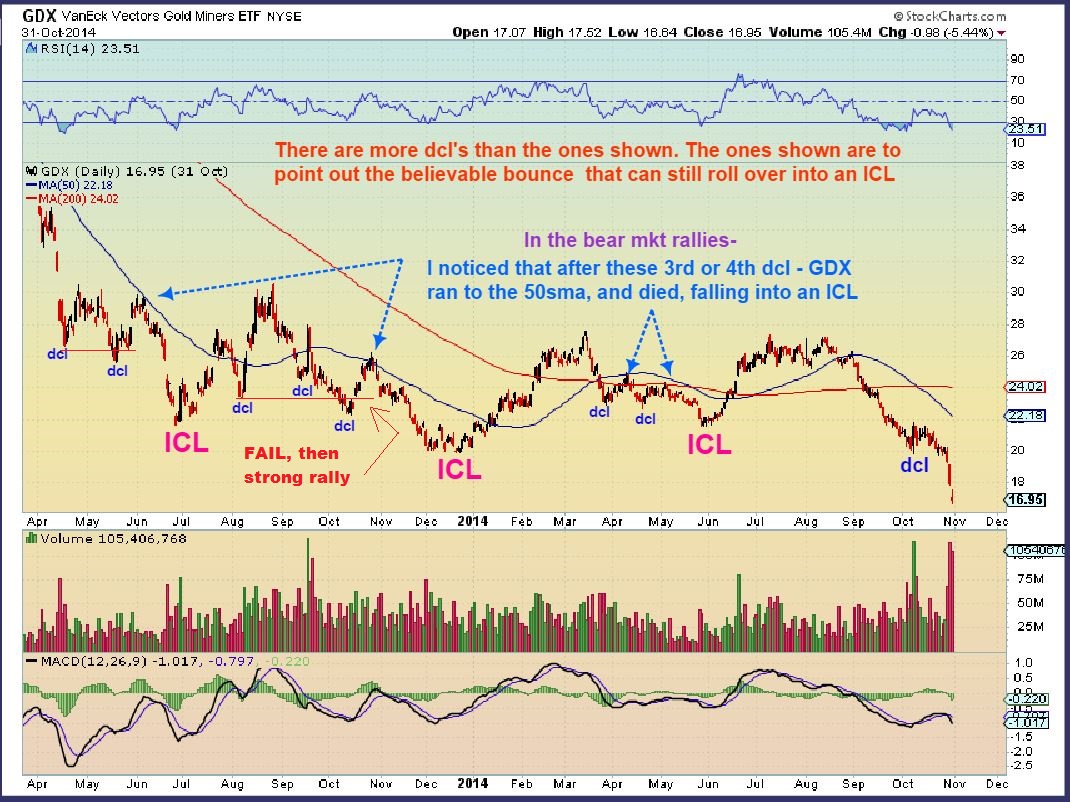
GDX – Please note that GDX ran up to the 50sma and was rejected last week and the week before. A break above the 50 sma would be quite bullish. A break down would lead to an ICL in my opinion. I would want cash on hand to buy those lows. Look at the month of MAY on this chart. That was the last break down into an ICL.
.
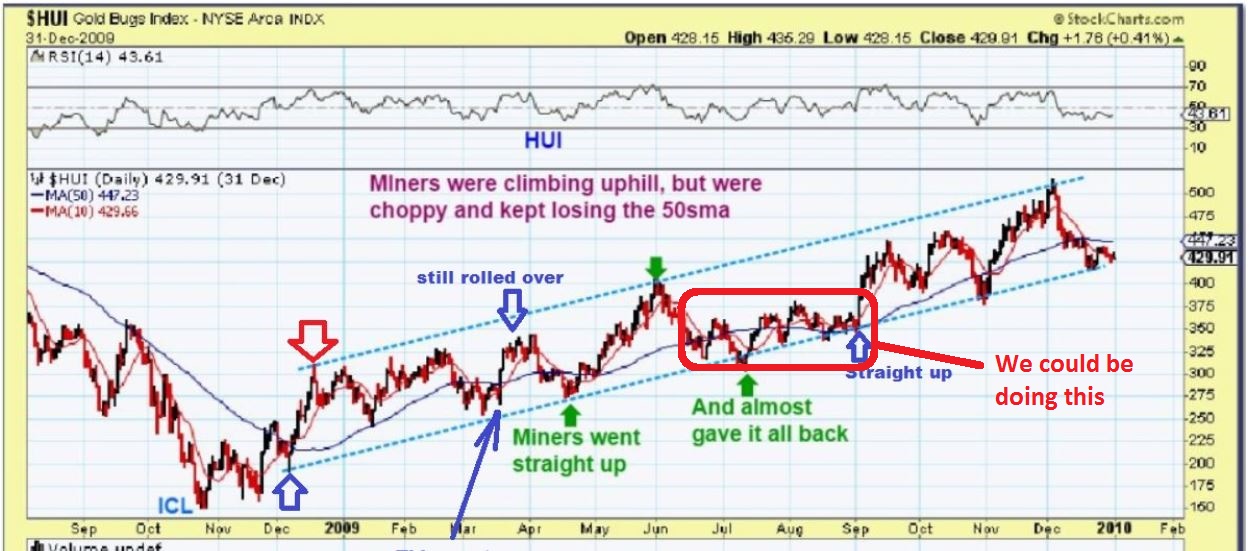
This is a chart that I used recently to point out volatility or choppiness that we have seen in the last Bull market for the HUI. JUST READ THE RED WRITING AND RED OBLONG SHAPE. If we are doing that now, trading will remain difficult and hard to explain.
 .
.
At this point, we should address the fact that we did have some pretty strong looking individual Miners. Lets see how they did during the Friday drop.
.
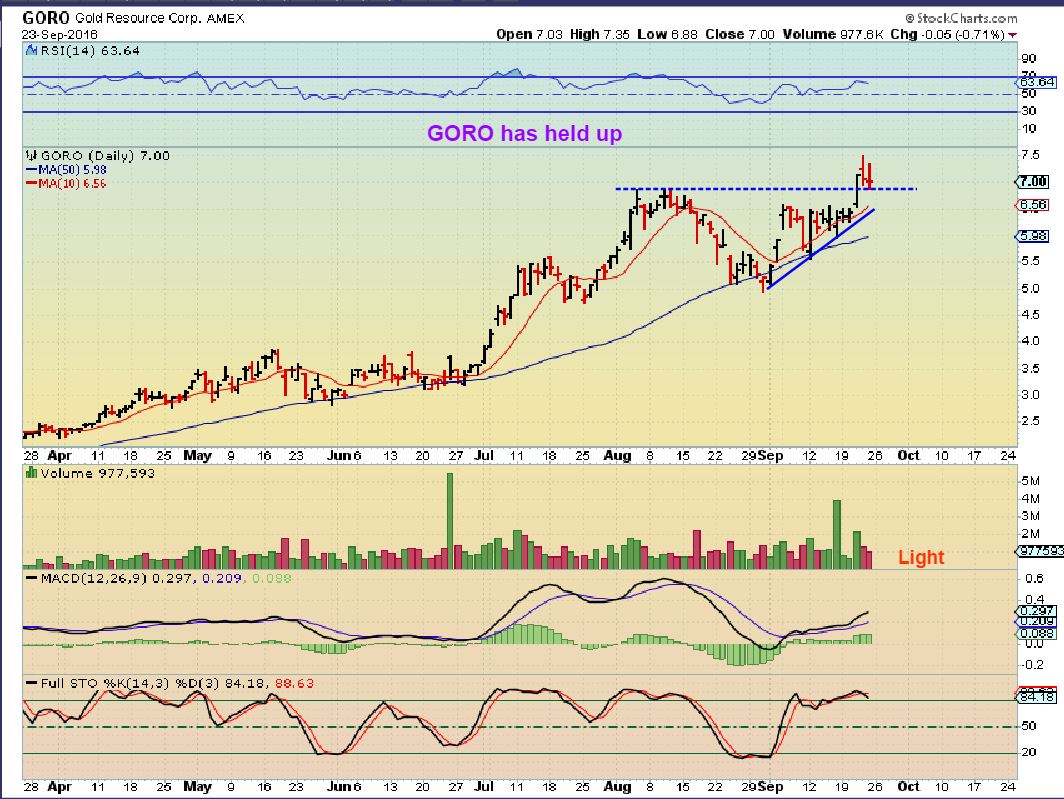
GORO – Break out and back test? Even a drop to $6.50 is fine ( 10 sma), but if it gives up the entire break out, then we are likely not in bullish mode.
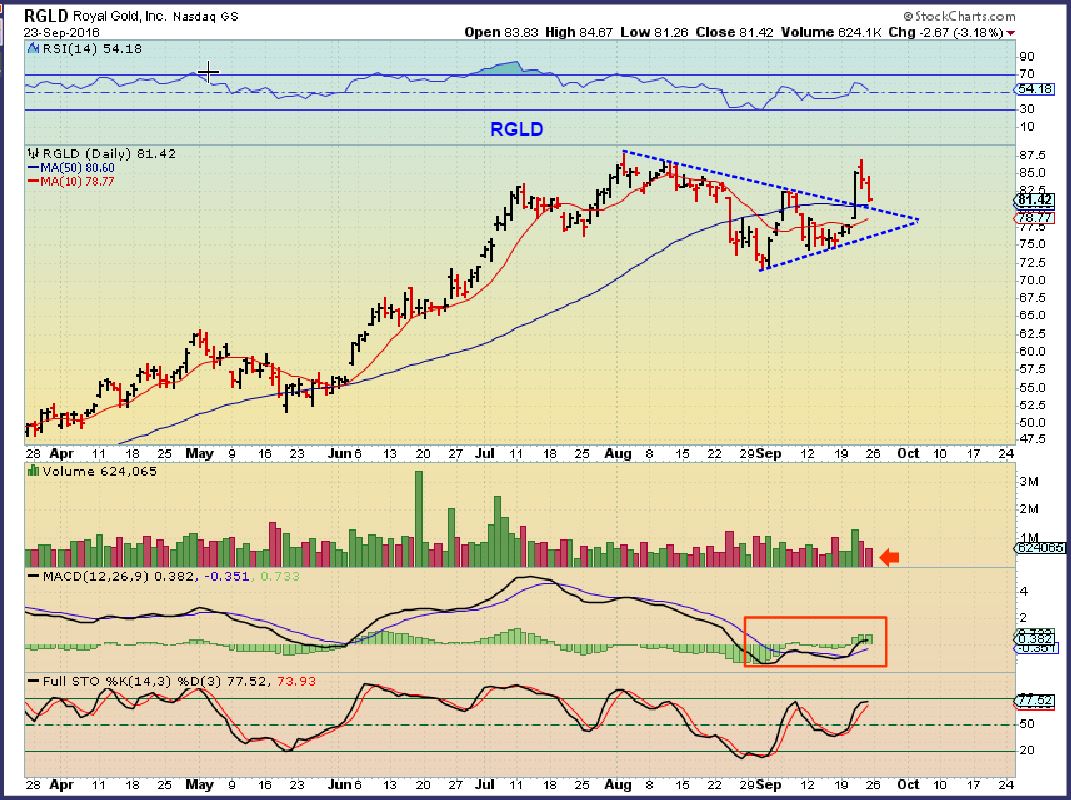
RGLD – This also went back to prior highs when we were looking for a possible drop. Fridays drop across that sector brought this down too. I’d like to see the 50sma and the blue trend line hold Monday. The chart has bullish divergence.
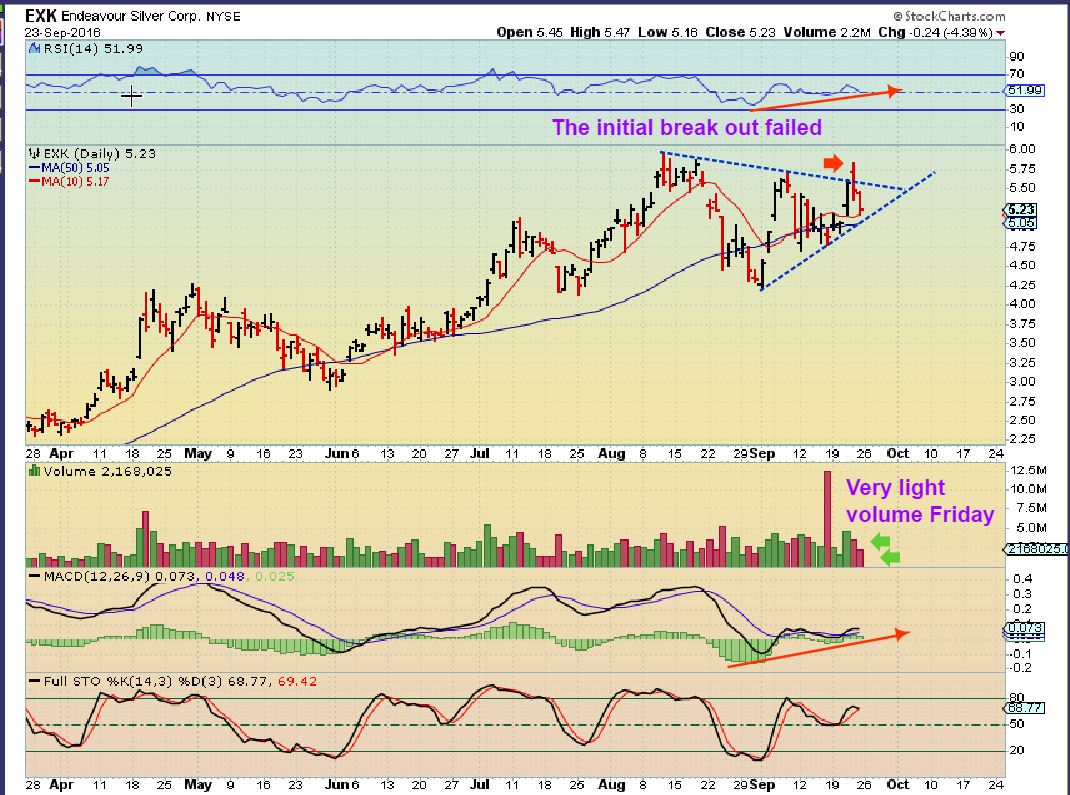
EXK – The 50sma needs to hold on EXK, because the break out failed so far.
SO that is where we are. We are seeing continued indecision, volatility, choppy markets. Even if the Precious Metals Markets sold off, I believe that it would lead to a great buying opportunity because the sentiment is bearish and we are due timing-wise for an ICL. Oil is within the timing for a DCL, and if we do not have one in place, I think we are close. When OIL acts better than the Energy stocks, It just doesn’t seem to have the follow through needed to continue higher. When Energy stocks lead the way, Oil seems to have follow through. From here, a further drop in Oil may be a good buy for the stronger stocks of CWEI, RICE, REI, OAS, WPX, AREX, AXAS, etc.
.
The general markets are a bullish set up, we’ll see what happens going forward. Elections could affect the US markets, but I’ve been watching certain stocks ( and mentioning them here) like CY, FNSR, FIT, TWTR, GPRO, MU, AMZN, and others, and they are doing very well.
~ALEX
EXTRA STUFF
.
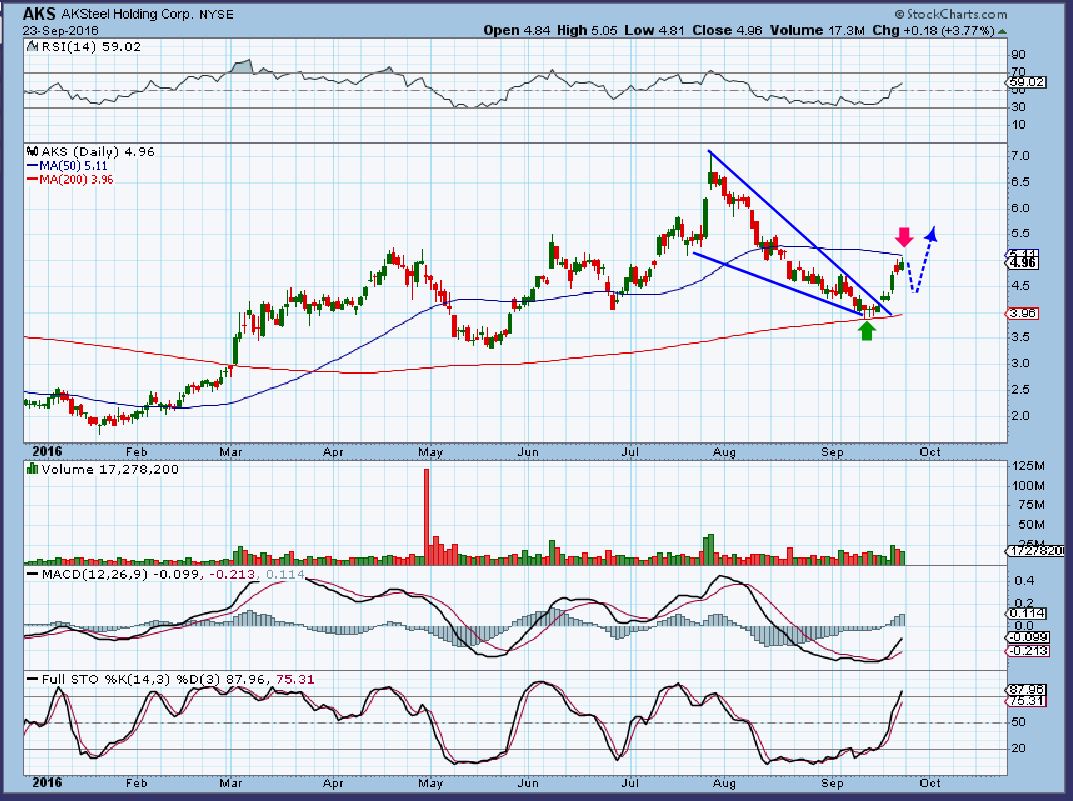
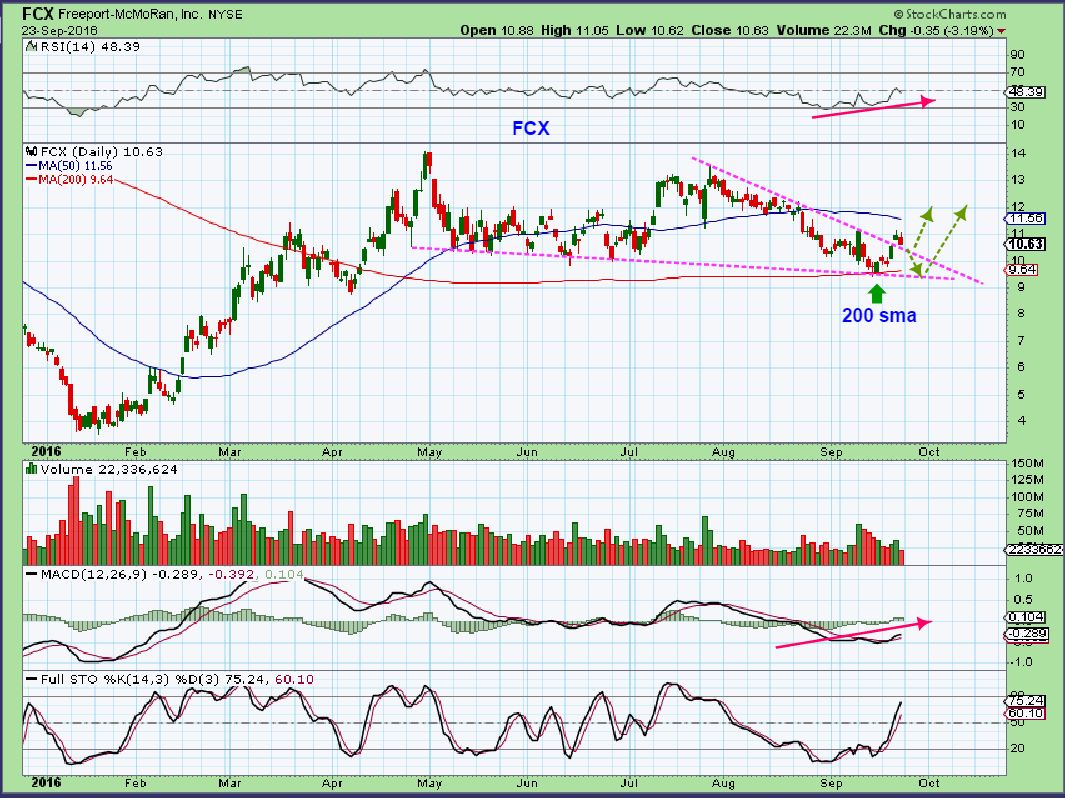
I have also already mentioned that X, AKS, ZEUS, CLF, FCX, SID, AA, etc and other commodity stocks were breaking out from down trends. They are now pulling back lightly and could become buying opportunities also. These are just a couple of charts, they almost all look to be pulling back in an orderly manner. I will keep an eye on them.
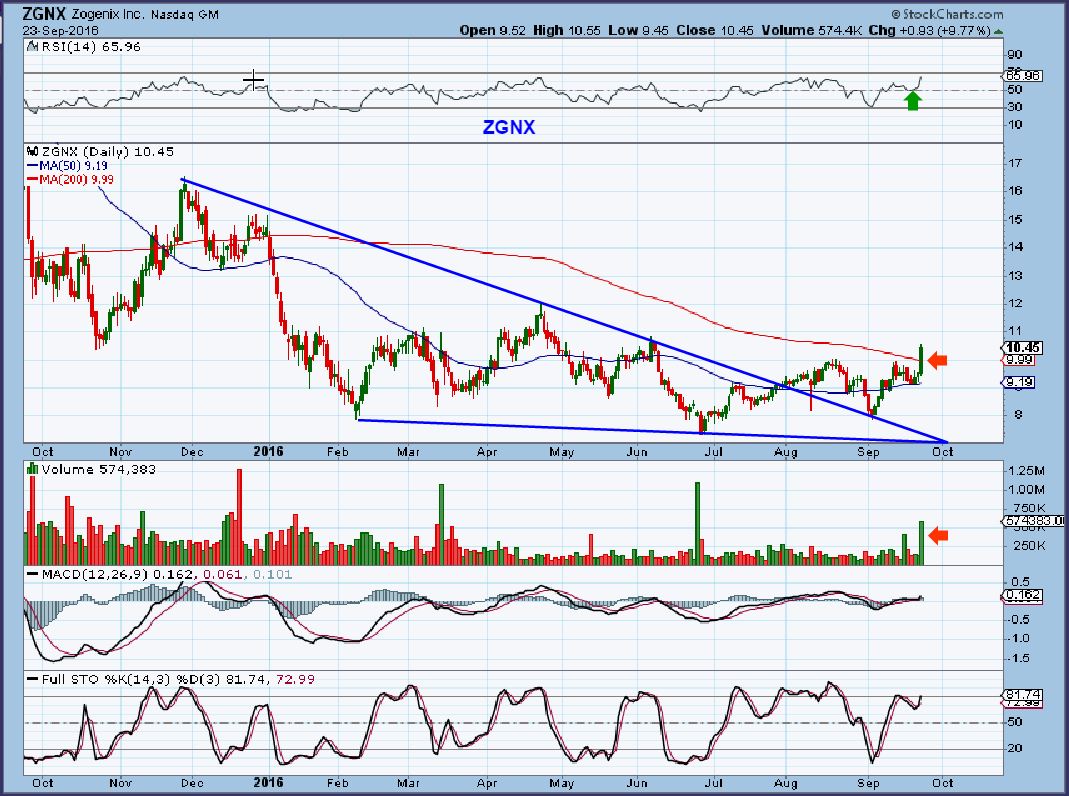
ZGNX – Break out, back test, and follow through above the 200sma. I do not know the company, but the weekly chart looked great too. This could be bought with a stop above the 50sma.
.
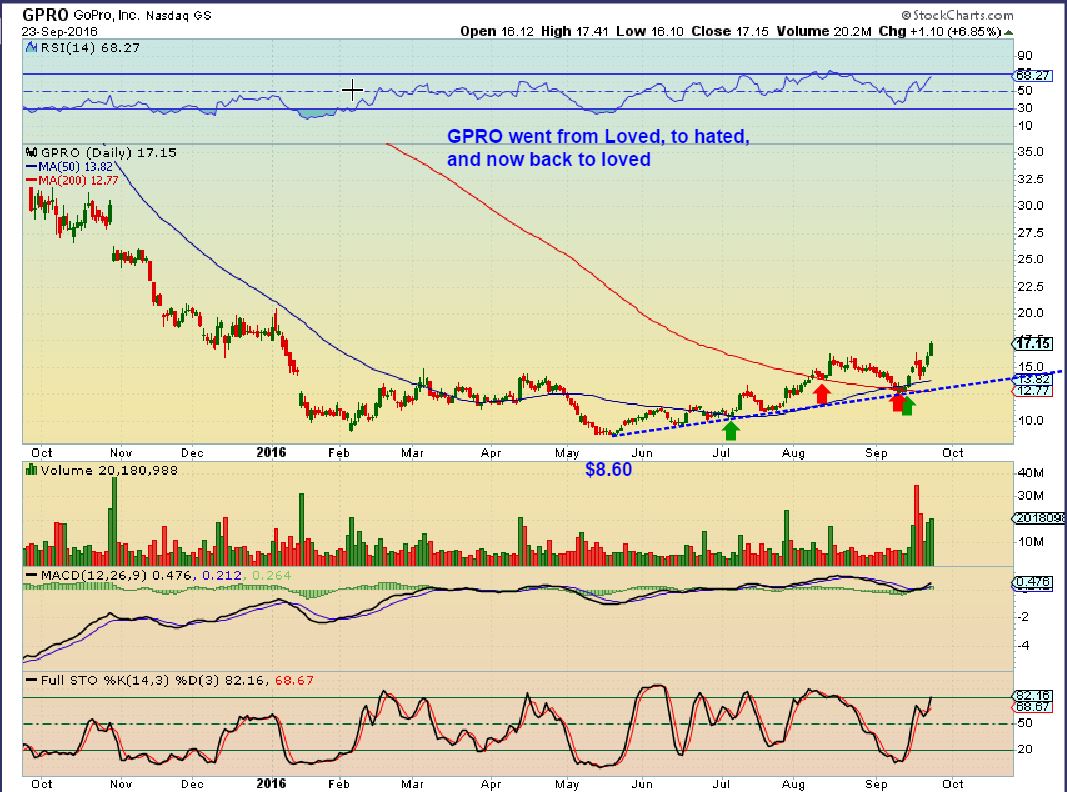
GPRO – The daily chart shows a solid routine of progress for months now. It re-gained the 50sma and the 200sma after a steep ugly sell off from almost $100 down to $8+. It could just continue higher, but I think that pullbacks could be considered a buy if the general markets remain bullish. Check out the weekly chart.
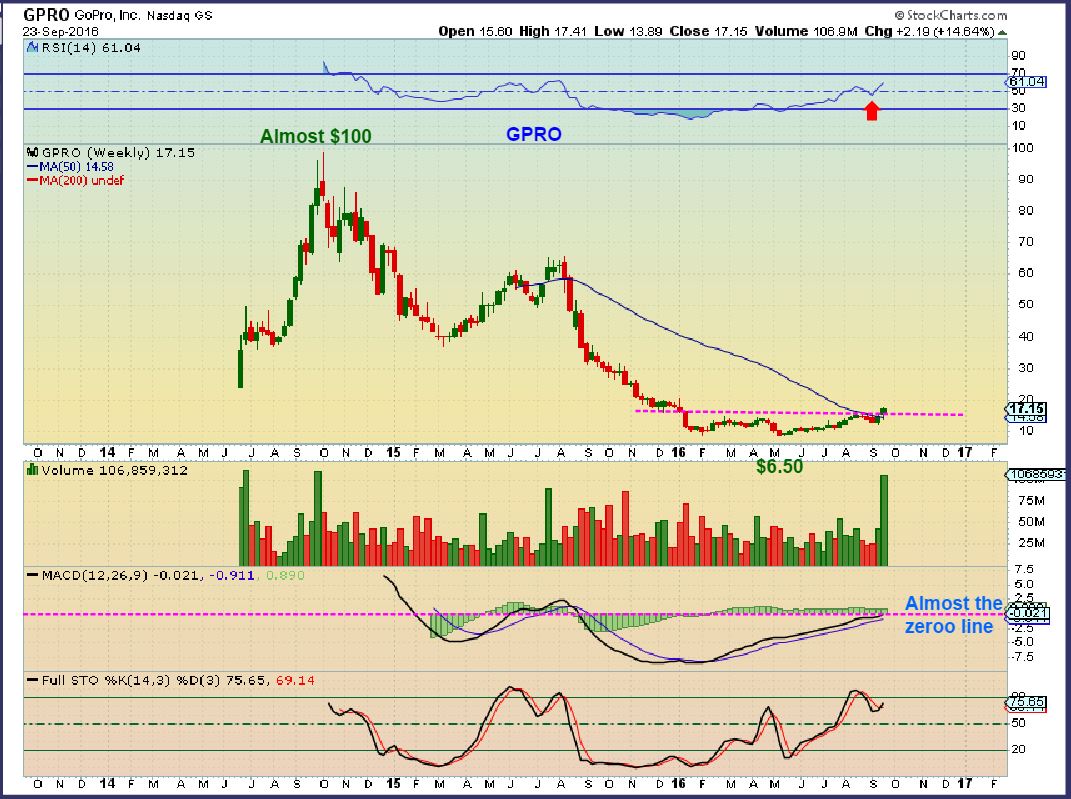
GPRO WKLY – The bigger picture does show a recovery in progress and not a lot of resistance to the left side .
.
Another sector that remains bullish, Bulk Shippers: SALT, NM, SB, SBLK, NAT, DSX, SHIP, TOPS, etc – Still looking bullish, I am watching this sector too.
.
I also decided to re-post some charts from past reports, because they still apply. The immediate short term direction for GOLD & MINERS is still a bit hazy. These charts can remind us what a choppy market sector can do to the downside and yet still remain bullish longer term.
.
GOLD – On Sept 14 we could get a bounce and a sharp drop into an ICL. Still a valid path.
I used this chart to show that GDX IN THE PAST ( 2013 & 2014)has run up to the 50sma, then it has been rejected and then dropped to a dcl or ICL. GDX has just done that very thing so far.
.


Must be a busy Monday morning for everyone! 🙂 AREX is still acting a little funny with oil up and other oil companies being up – I’m hoping it’s just consolidating and getting ready to move up…..action seems a little muted everywhere – think maybe things are just waiting til after debate…..? Well, the market is down so that could be holding down oil stocks as well..
I agree, not seeing many Energy stocks reacting to Oils bounce ( so maybe it is just a bounce in that triangle like formation).
Also not many Miners look very strong with Gold a bit higher. I hate this boring sideways chop, I’m just staying rather light to have some skin in the game , but not be burdened if we get the next leg down in either sector.
CLD, AKS, X and so on green with the markets selling down. That is interesting ( I didn’t take a position there).
GPL actually looks ok, with nice volume too.
Yes, I’ve done the same…have a few stocks but mostly on the sidelines to see how it’s going to go….I haven’t jumped into the steel arena either…looks like I’ll get to sand on some wood projects I’ve been working on while I wait….makes it easier to leave the screen for a few minutes when everything is just kind of in limbo 🙂
Me too, In this sideways chop, I find it much easier to just have on a few trades and cash, and then walk away for an hour or even a few and get some things done that I’ve been needing to take care of. ( Change of seasons in New England always brings work as well as pleasure). You sand wood projects and I cut, split, and stack it : )
Stuck in Russia with potato internet right now myself. Took a good ten minutes to load all the charts!
Still stopping by every day mind you just time is limited. Good job really, this sideways action would be killing me normally!
Nice job as per Alex. Thanks! Good luck all.
Wow, and the time difference must throw things off a bit too. ( Not to mention, I hear they have good Vodka! ) : )
The open is ok,Tea time (that’s dinner in proper English ;). If I need to stay up for the close though….that’s when thing’s can get emotional. LOL. Luckily I’m offshore most of the time far away from Vodka.(shudders). I both love it and hate it at the same time, kinda reminds me of NUGT actually. Buy too much at the wrong time and you’ll wake up in the morning dazed, confused and broke!
potato internet…… giggle
I’m hoping energy stocks are reacting to general market while oil continues to rebound and not citing that this is a ‘fake’ move in oil. Gaps are all filled, ready to see the Q’s rebound now!
Alex,
I think we need to wait for the gold ICL in another cycle. I am unsure what price gold could be, but I favor your 1250 target and 22 GDX?
That is what I am looking at as very likely possibility – GDX 22- 24 & Gold maybe only $1280?). I think the longer that things go sideways and burn up time, then better the action would be. If we held price here sideways for another week and then sold off quickly, many would bail out and then a reversal could include some short covering. Just another quick shake out would be fine with me. : )
Thats the “rub” isn’t it…….if there is No shake out where do you ReEnter?
yes,
I’ve looked at the past Bull movements and tried to picture what it would look like day by day in real time, and that is tricky in some phases of the bull market run. Some of the past ICL’s dipped down in an obvious manner, others were more like the ICL in May. It wasn’t as obvious at times.
Even in 2016, when I look at the drop in May – it became obvious because it shot up to new break out highs and then sold off in all of May to new lows. I wonder If it would have been easy to see if it just went sideways the whole time in May & did that undercut? It seems that it would have been harder to detect. And are we doing that now? It just takes time to see it unfolding at times, other times you cant miss it, especially if you are holding positions.
Another ‘curve ball” that I will be watching is that on Oct. 1 the Chinese Yuan inclusion in SDR currency basket And they may announce their Gold Reserves including any increases. This announcement will most definetly will effect the USD.
I’ve been trying to figure out how the Yuan inclusion will affect the dollar…have been reading…but still haven’t quite figured anything out…
Let us know what if anything you can find out, would be appreciated Tammie. 🙂
I’ll sure let you know if I figure something out! 🙂 I’d sure like to figure it out soon….before Oct. 1….! Geez my silver stocks I bought last week are….pitiful…..:( I need the dollar to come join me….down South!
🙂
So far what I’ve read seems to indicate that once the yuan is in the SDR basket then those that previously held reserves, investments, etc. in dollars – would now be able to hold in the yuan since it would be more widely accepted, etc. Most of the articles stop there and just talk about the effect on the Chinese economy, etc. – but seems to me that if people will now have less reason to hold dollars since the yuan will fit the bill…..then that would drop the dollar (BUT the dollar index is made up of currencies that don’t include the yuan…..so it would have to be a round about way that would affect the dollar index…as in.. the other currencies in the dollar index basket might go up or down due to things going on with the yuan or with the SDR??). China is a major trading partner with India so now the trade can be denominated in yuan instead of dollars, making trading between the 2 much easier….hence….dollars not needed quite so badly……so….clear as mud huh? 🙂 🙂 🙂 I’m still researching 🙂 So…I do wonder….if any big accounts that hold reserves in dollars are sitting waiting to dump them so they can now hold in yuan…..
with GDX now at 27 , that would be a 20% haircut (22-23). I think it is very feasible for the pm shares and maybe 5-7% decrease in the price of gold, since the shares have way outperformed the metal. Is it possible we are already in a 4th daily cycle right now?
So JNUG is down .36….gold is up $2.70….dollar is down .28….hm…
Alex,
Any thoughts on AG? I see some divergences…. but underperforming the entire sector.
thx
This is my chart from Early Sept. when it looked like it wanted to bounce at the 50% retrace . Can still drop to the $9 area.
https://uploads.disquscdn.com/images/f6066f66b675a51a76be4a036989fd458ac044265c9f69e108a30a36b757ca8f.jpg
Thanks Alex,
A drop to $9 would definately be a bit scary.. Good for an ICL I guess.
Yes- Scary if you’re in it, or very exciting if you are wanting to get back in it ( like me) : )
Just think, if one bought AG near the Jan low (I didn’t) and held until the price closed below the 5WEMA in Aug, one could have gotten a 6 bagger! No wonder is loved and one to watch. The Fib .618 retracement for would be around $9 as Alex’s chart shows, near the 200 DMA. Wouldn’t it be nice to catch a bottom there and get the next (hopefully) 6 bagger? 🙂
I can’t help but notice, that the lower trend line for JNUG is a perfect tag right now. 1hr chart
go do pushups…
meow
Oil and NATGAS moved up nicely today – and many Oils stocks are red. Not too impressive.
WPX, CRK, OAS look ok.
Alternative energy looks good ( CLNE, PEIX, AMRS, BLDP, PLUG, etc) looking pretty good,
………….and did I mention ATLS a week ago? I’ve been watching this day after day. 2 red days out of the last 17, and the 2 red days were not down much, closer to break even. Sweet move ( I missed it waiting to buy pullback).
I noticed energy was all over the place – individual reaction today per each stock, hoping it was just due to the market and jitters and not indicative of actual upcoming oil market! A bit nervous here though honestly.
CRK?
CJESQ ?
So far, this is extremely light volume drop in GDX ( but they do tend to add 15 million or so on at the close).