
August 28 – Weekend Report
It was a week of activity capped off with some Jackson Hole volatility. Lets take a look…
.
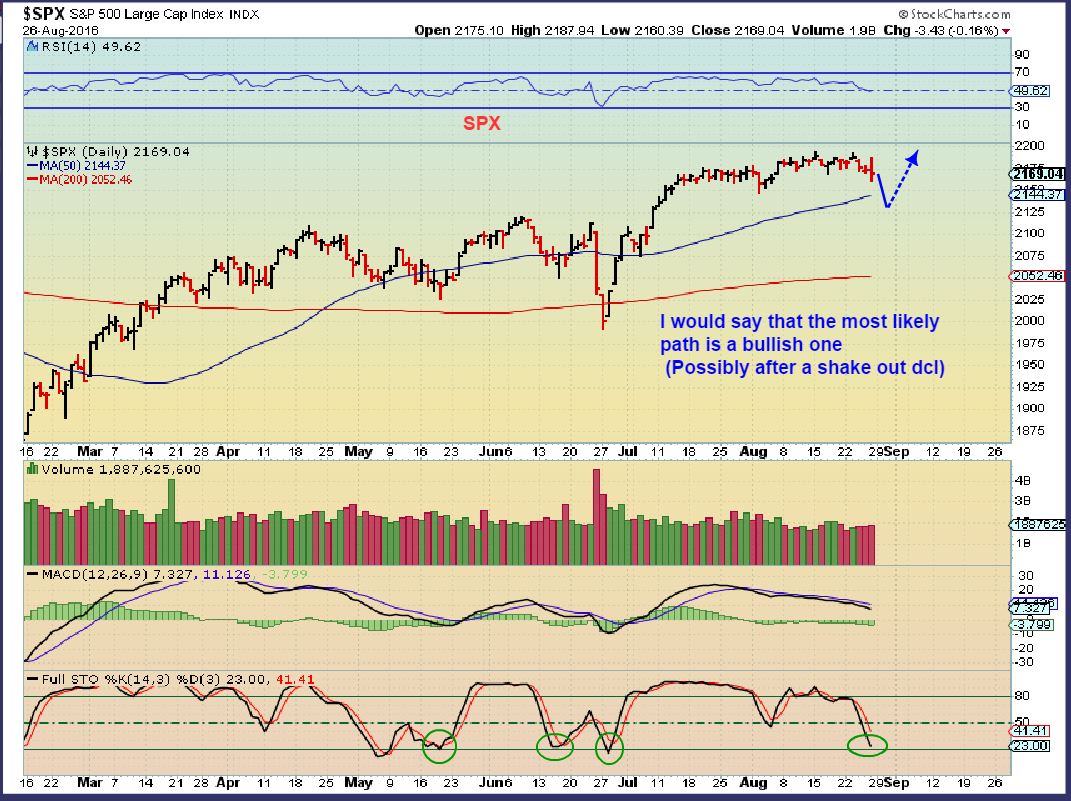
SPX – 2 months of sideways should produce a strong trending move. A dcl could shake traders out first.
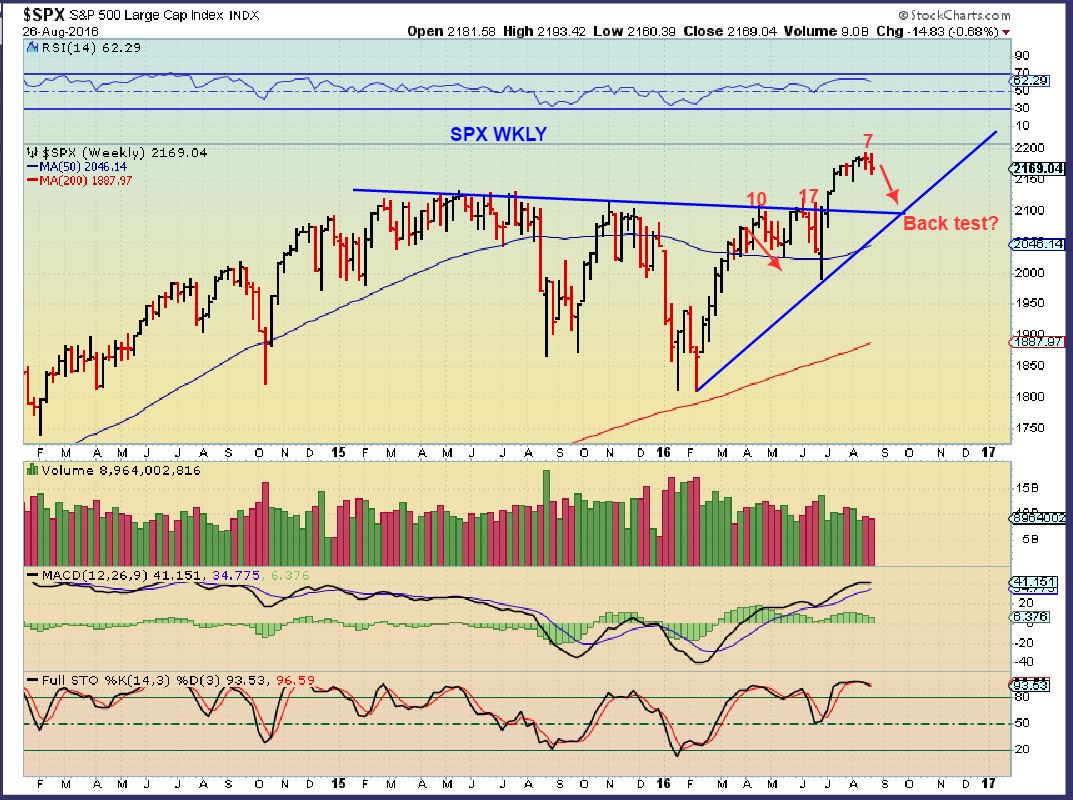
SPX WKLY – The weekly shows that we are on week 8 out of the recent lows. The prior move did top on week 10 and dip for weeks before surging and making new highs on week 17, so these markets can be tricky, even when bullishly set up.
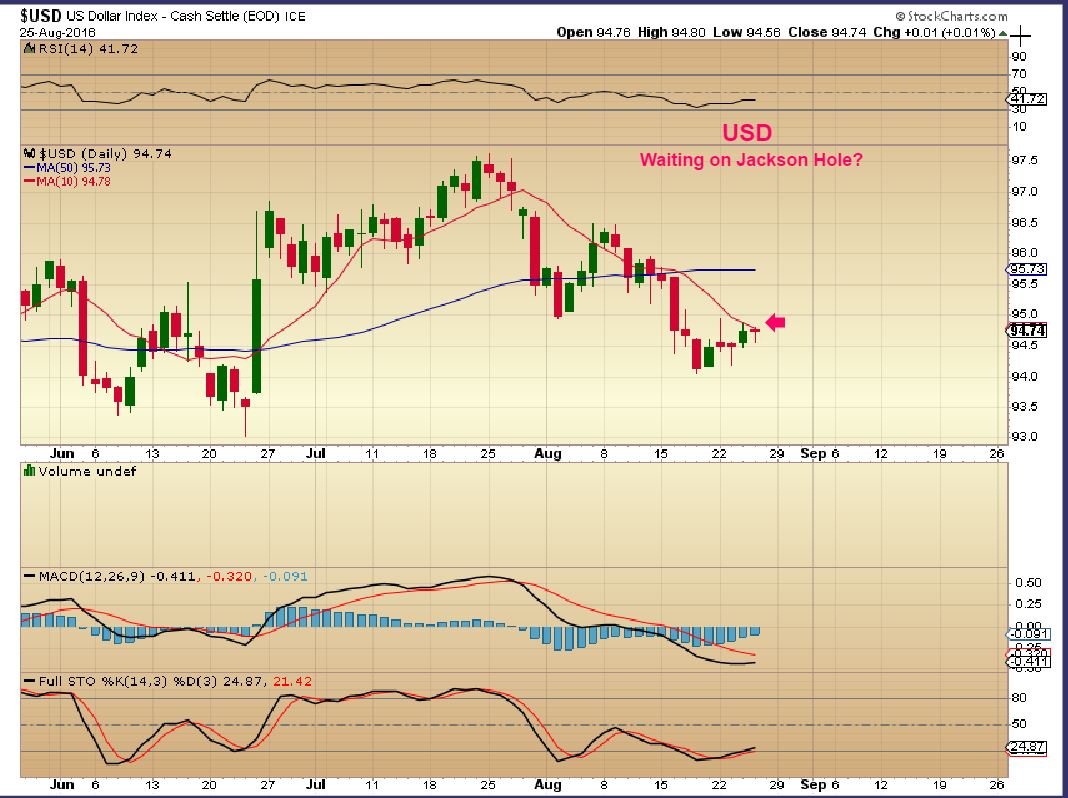
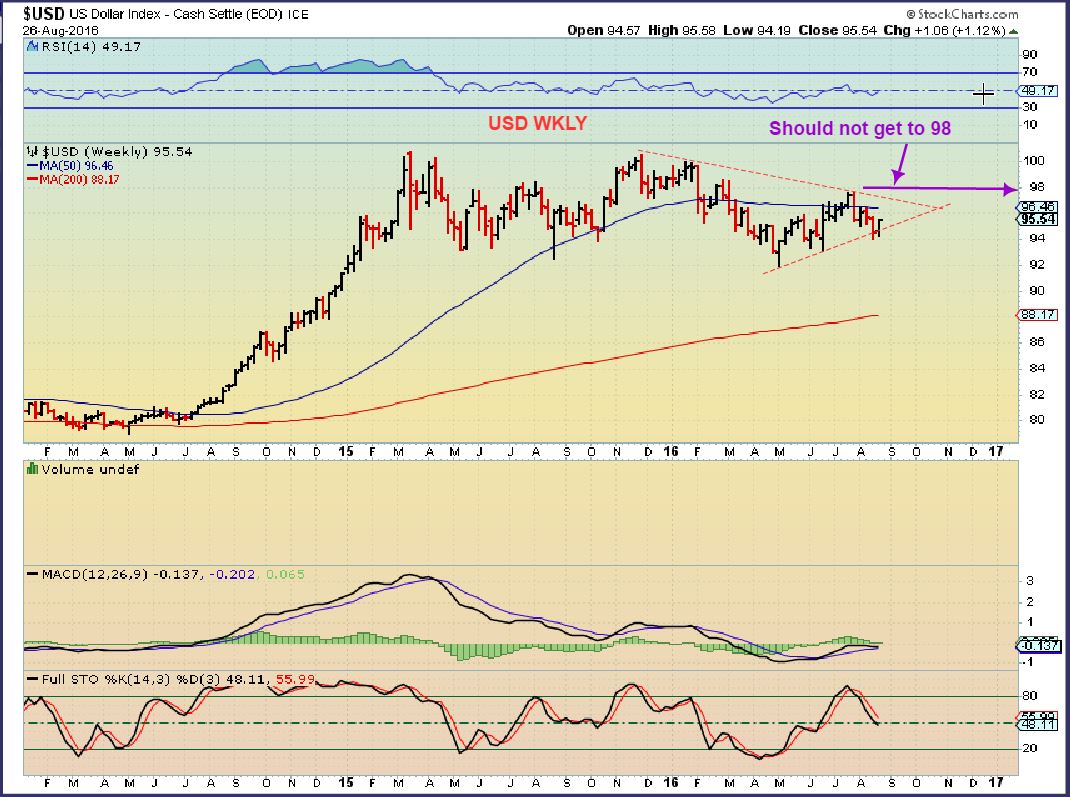
USD Aug 26, this looked like it was waiting to break out or fail on Jackson Hole Friday.
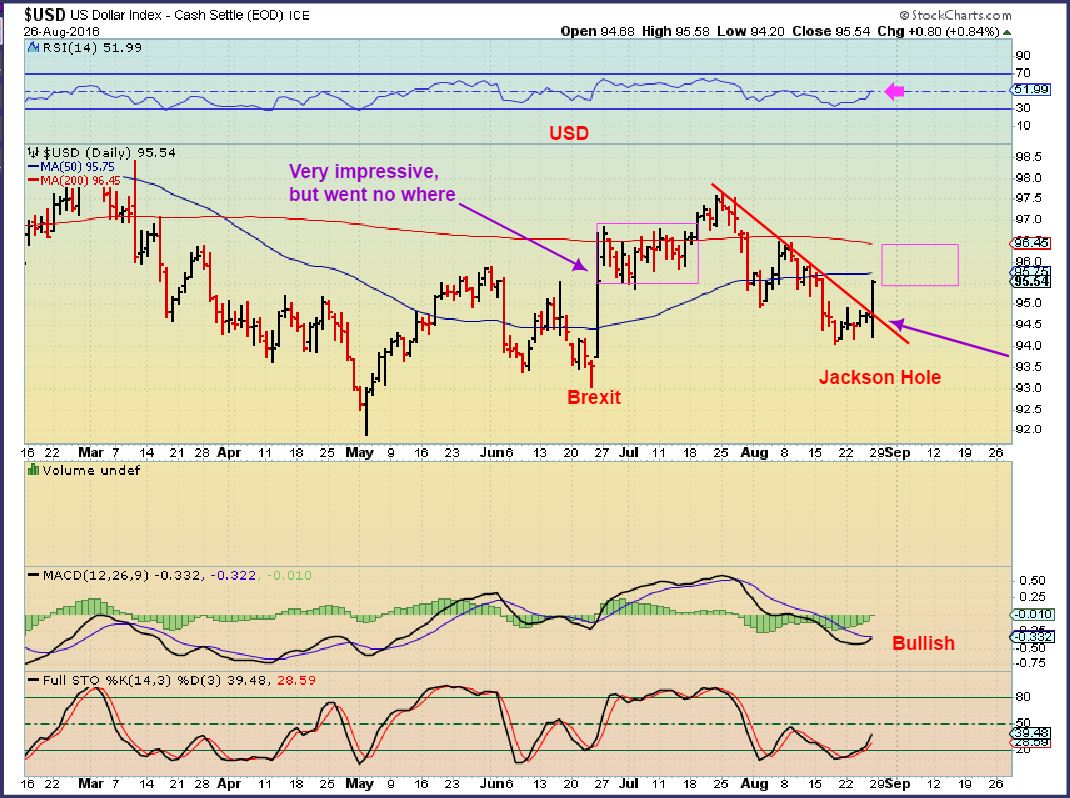
USD – And it did break out strongly. I want to point out that that USD burst suddenly seemed to make everyone bullish on the $USD, but we’ve seen this before. The move occurred when Janet mentioned that a rate hike is back on the table. What do you think will happen when there is no rate hike? The Brexit pop simple went sideways , so this could do the same. ( NOTE: Gold popped on Brexit, and Gold Popped Friday too, but gave it up for now)
USD WKLY –
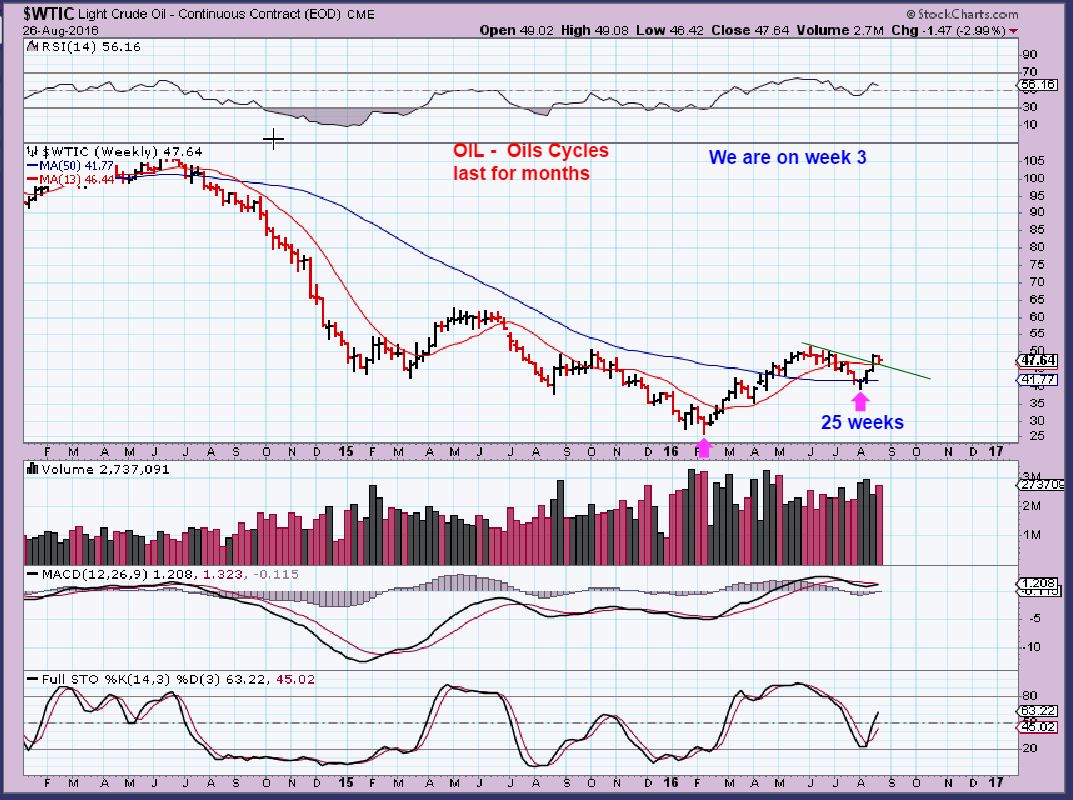
WTIC – Still a Bullish set up
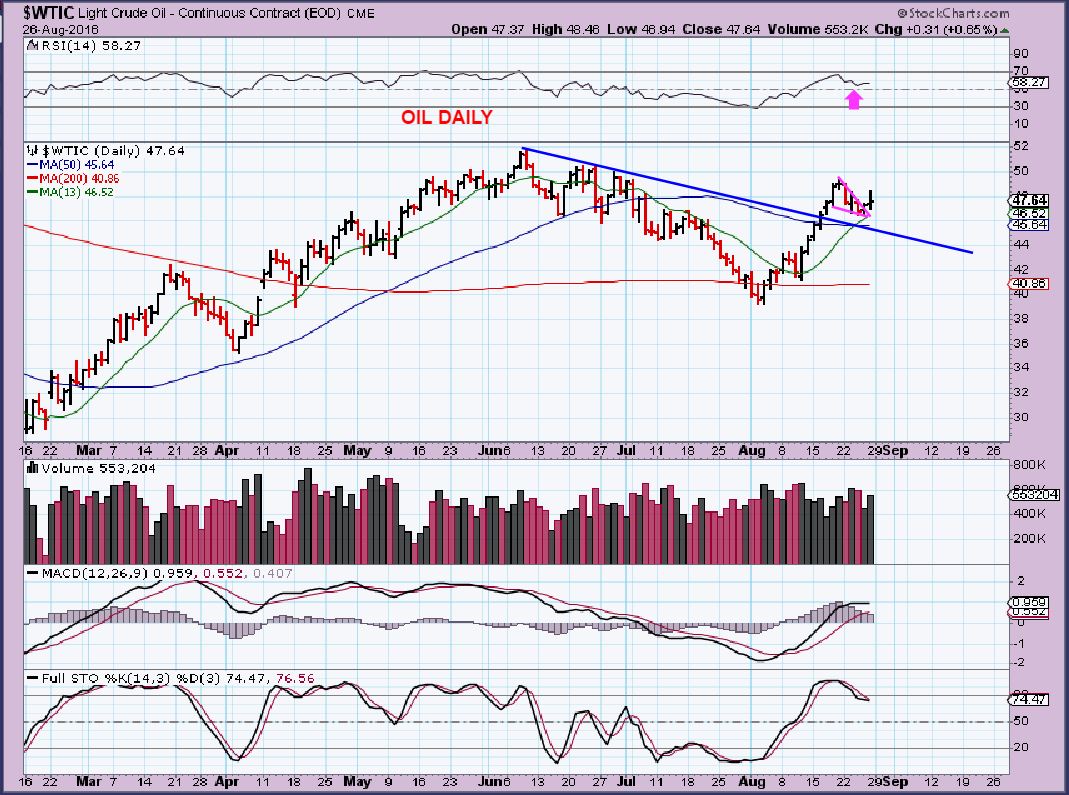
WTIC -WKLY – Week 3 I am not worried about ‘Inventory reports” ‘Rig counts” etc. This pullback was an opportunity in my opinion. A drop below $45 might begin to concern me.
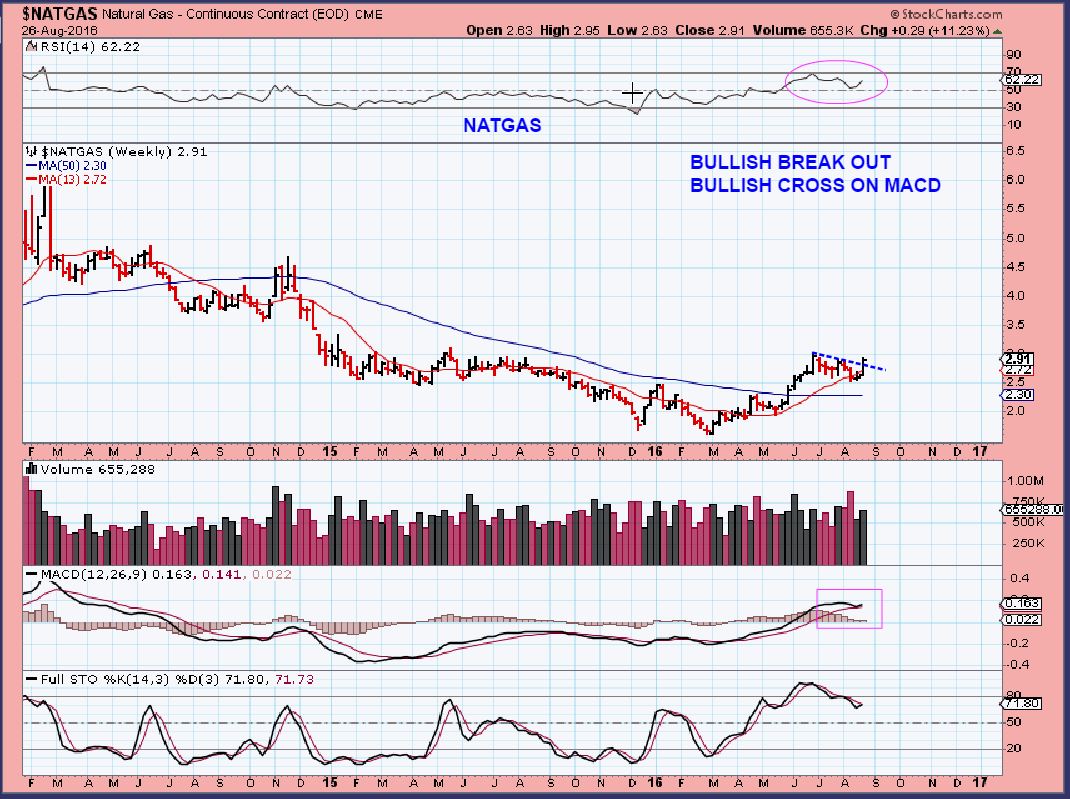
NATGAS – NATGAS August 24th, set up for a break out.
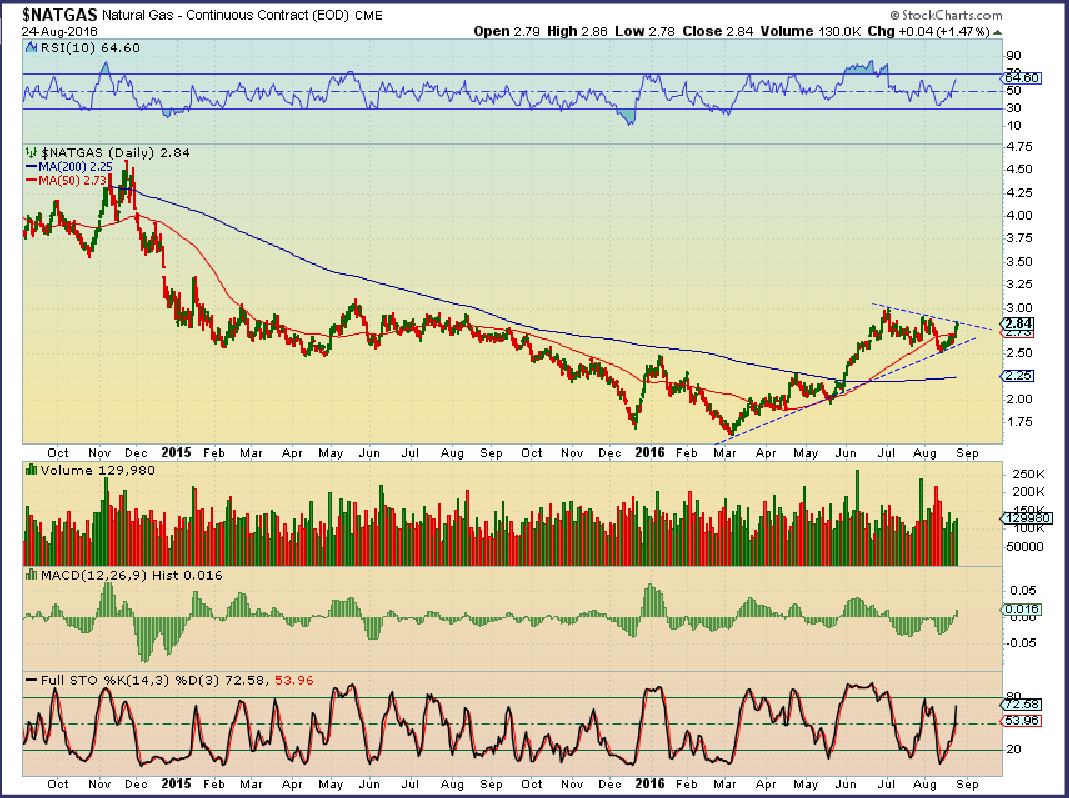
Break out with MACD cross. Resistance above $3.50
.
GOLD & MINERS
.
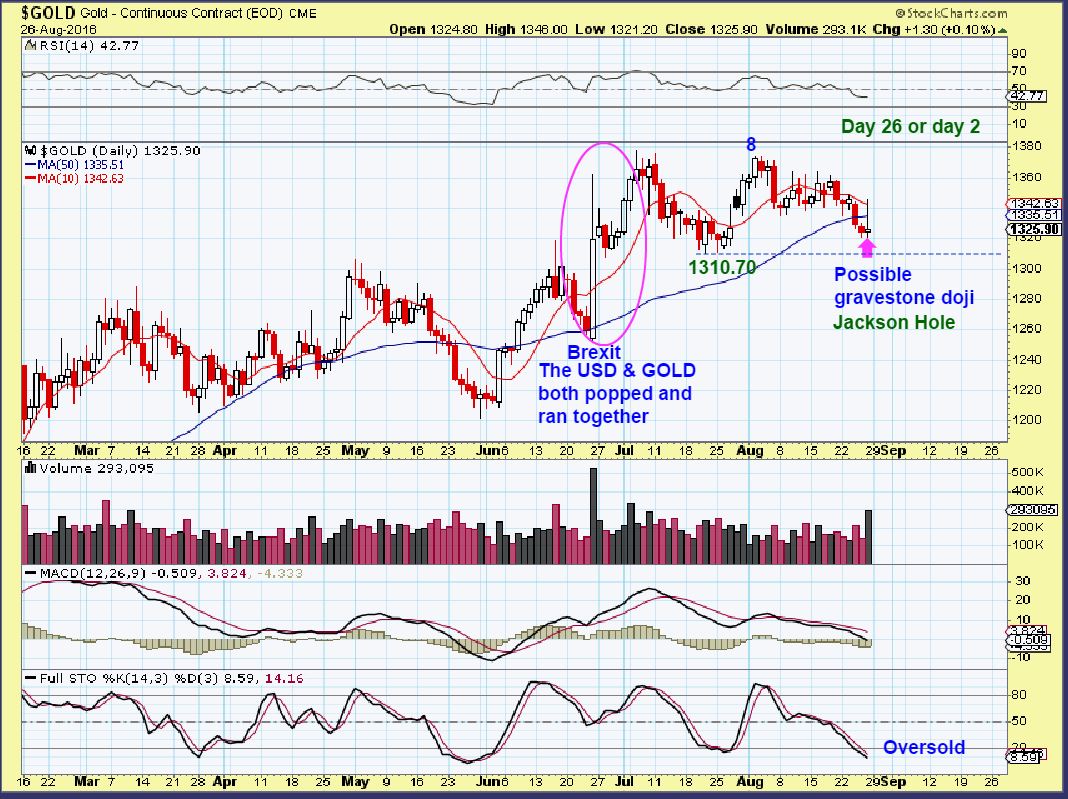
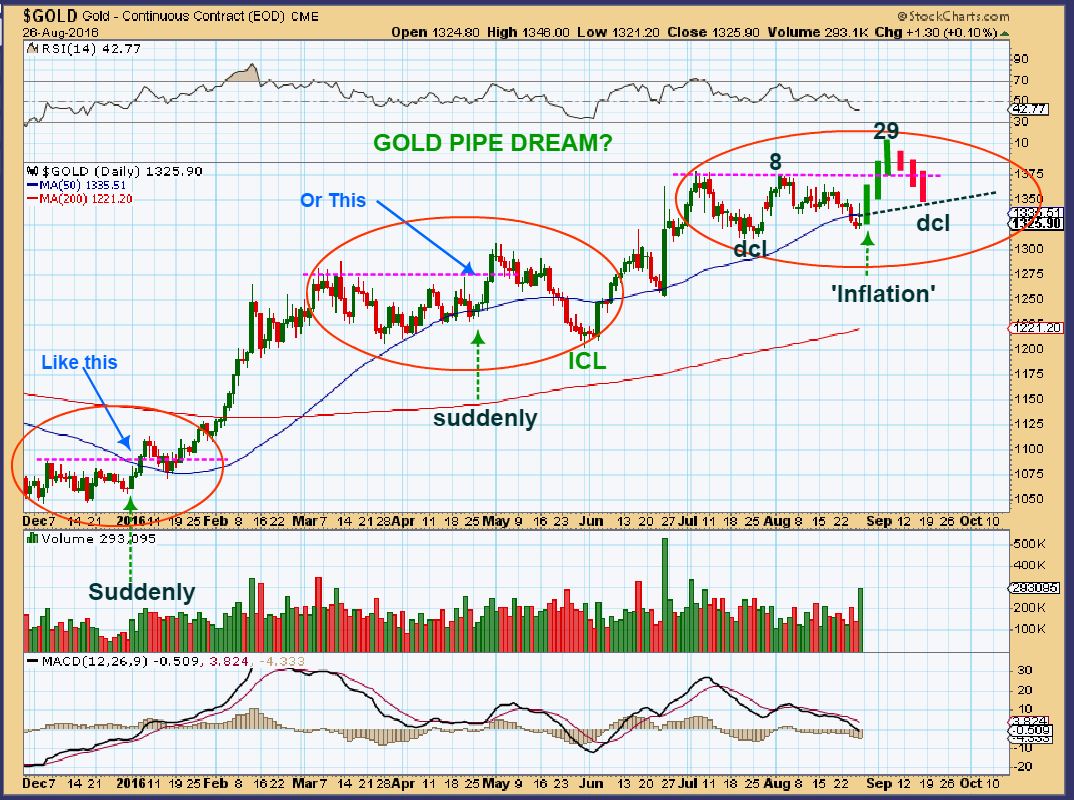
GOLD – This type of doji can be a reversal after a sell off, but we’ll see. The good news was that Gold didn’t take out the $1310.70. Without making a right translated daily cycle, it looks weak though. This really looks like a weak 3rd daily cycle to me. There is one more crazy idea that I have, I will put it at the end of the report, some may call it ‘The Pipe Dream’. 🙂
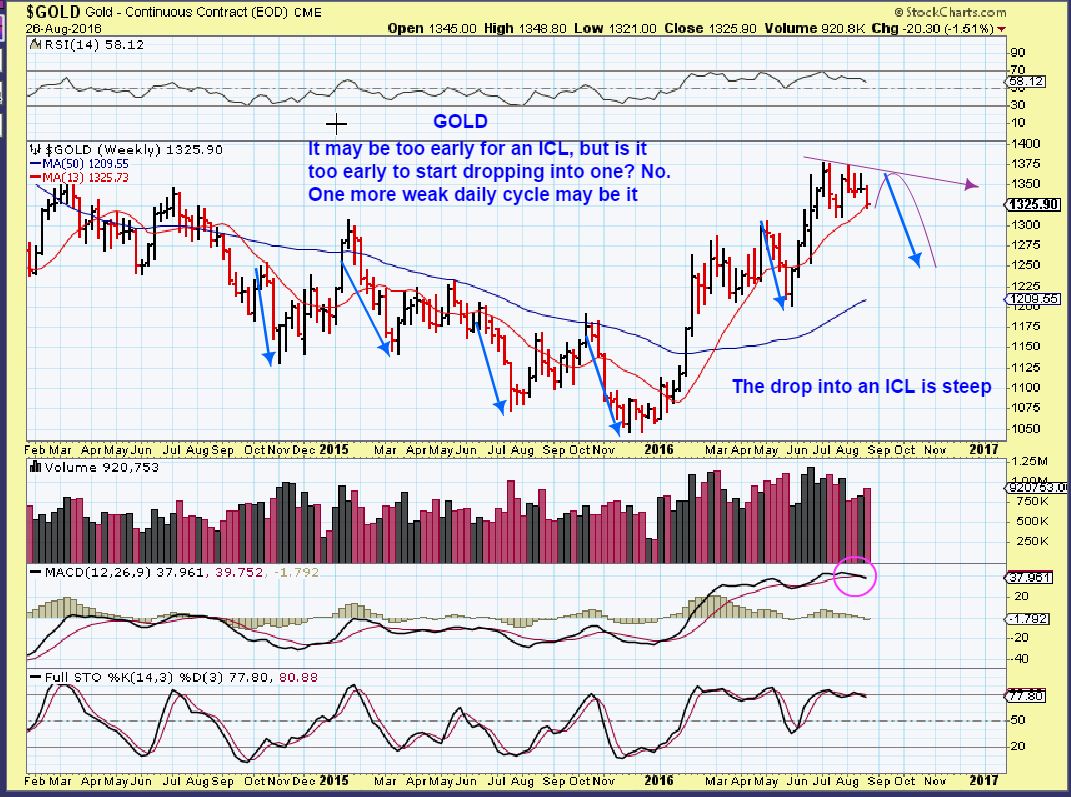
GOLD WEEKLY – I might trade a bounce or lighten up after a bounce.
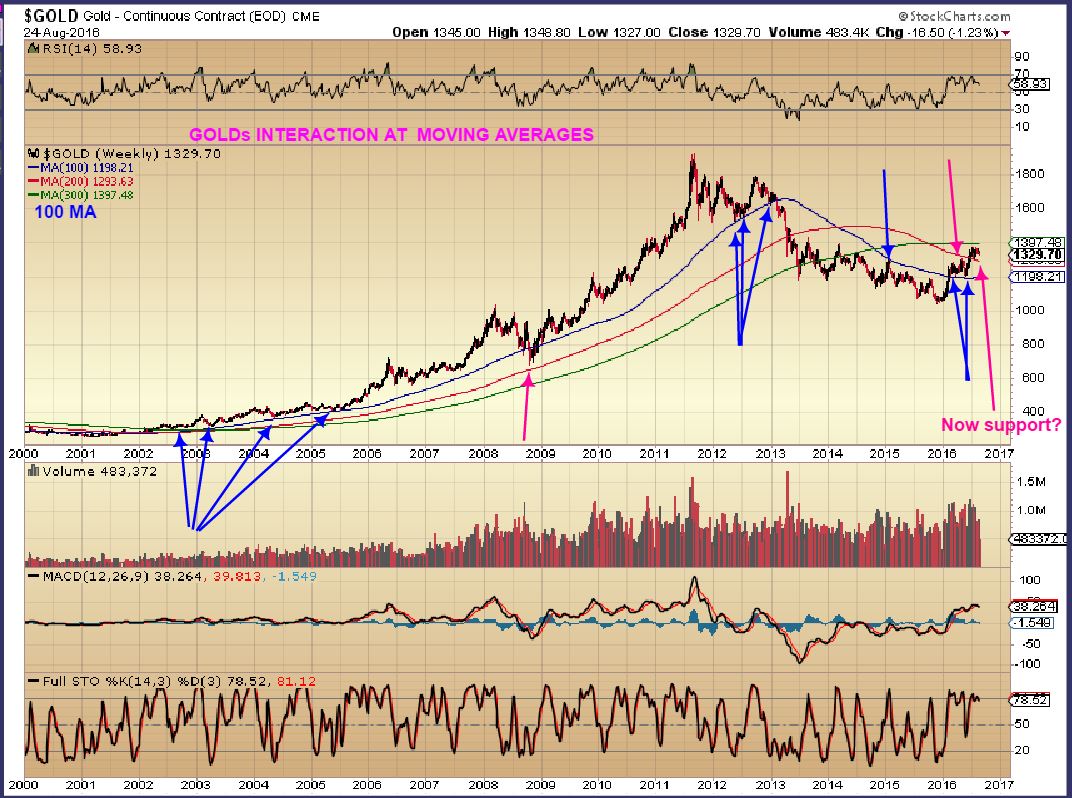
GOLD TECHNICAL ANALYSIS – BIG PICTURE BULLISH
.
I just wanted to show that in the start of the Bull by 2002-2003, Gold didn’t drop below the blue line once it gained it ( except 2008 &2012). It also didn’t drop below the red line after it gained it ( until 2013). We are above both now, this builds confidence in the longer term expectations for Gold. The Red Line is now at $1294, I’d like to see that hold at the next ICL.
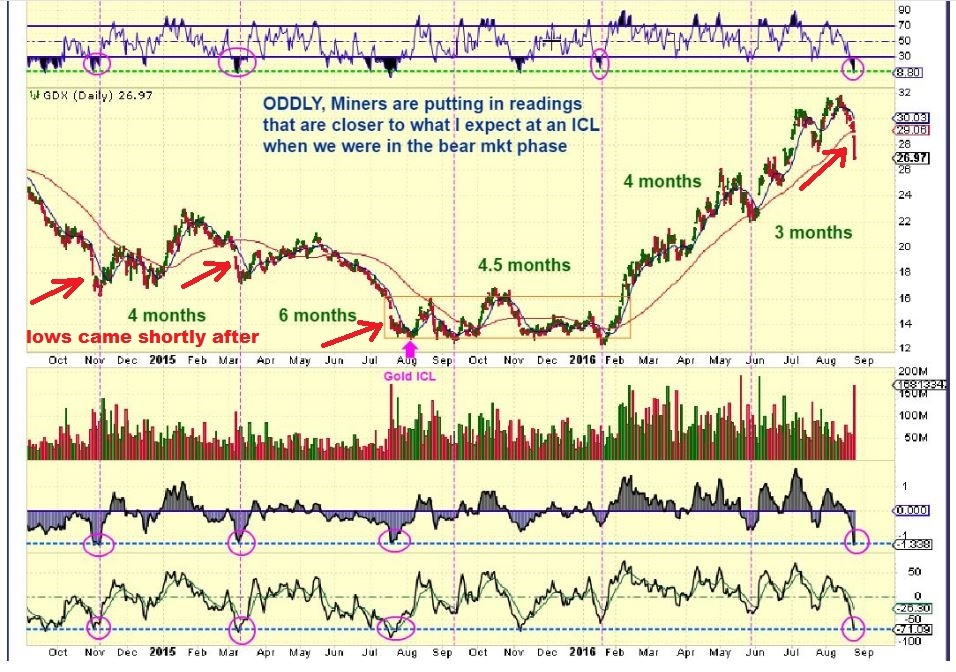
GDX Aug 25th, I pointed out that we have a failed daily cycle. By breaking to new lows in this uptrend, that indicates that the next daily cycle is just a bounce. GDX is very oversold, but it should just be weak bounce and not make new highs.
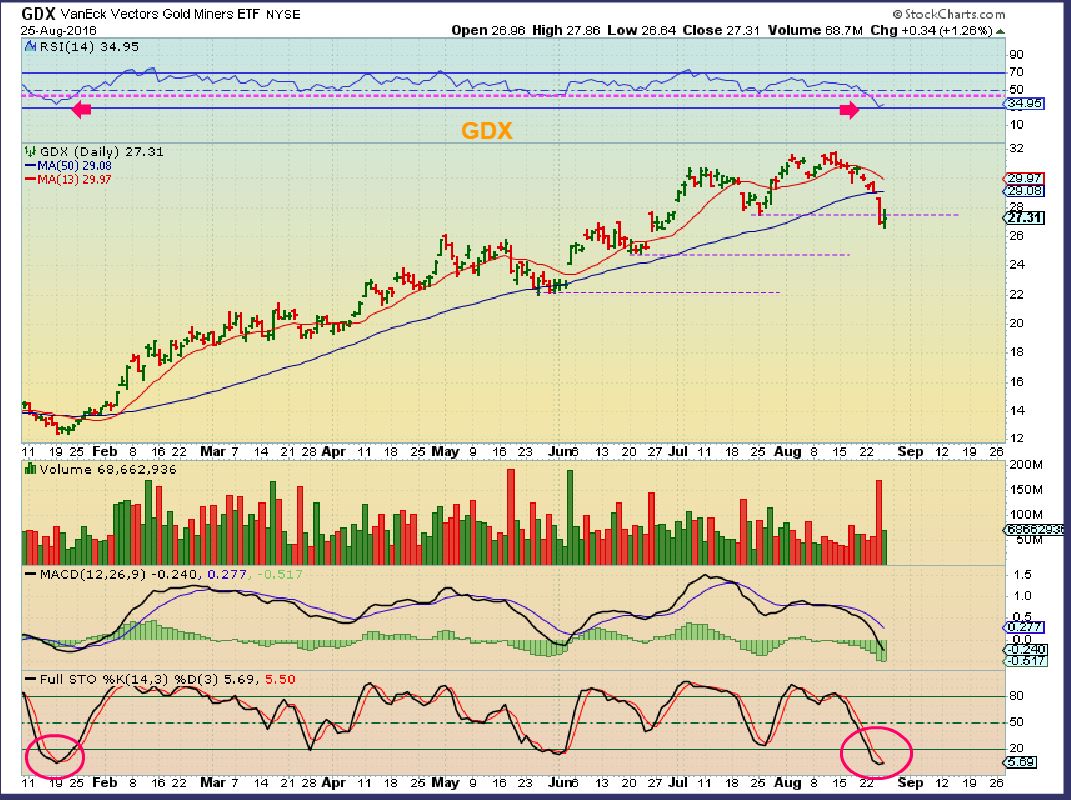
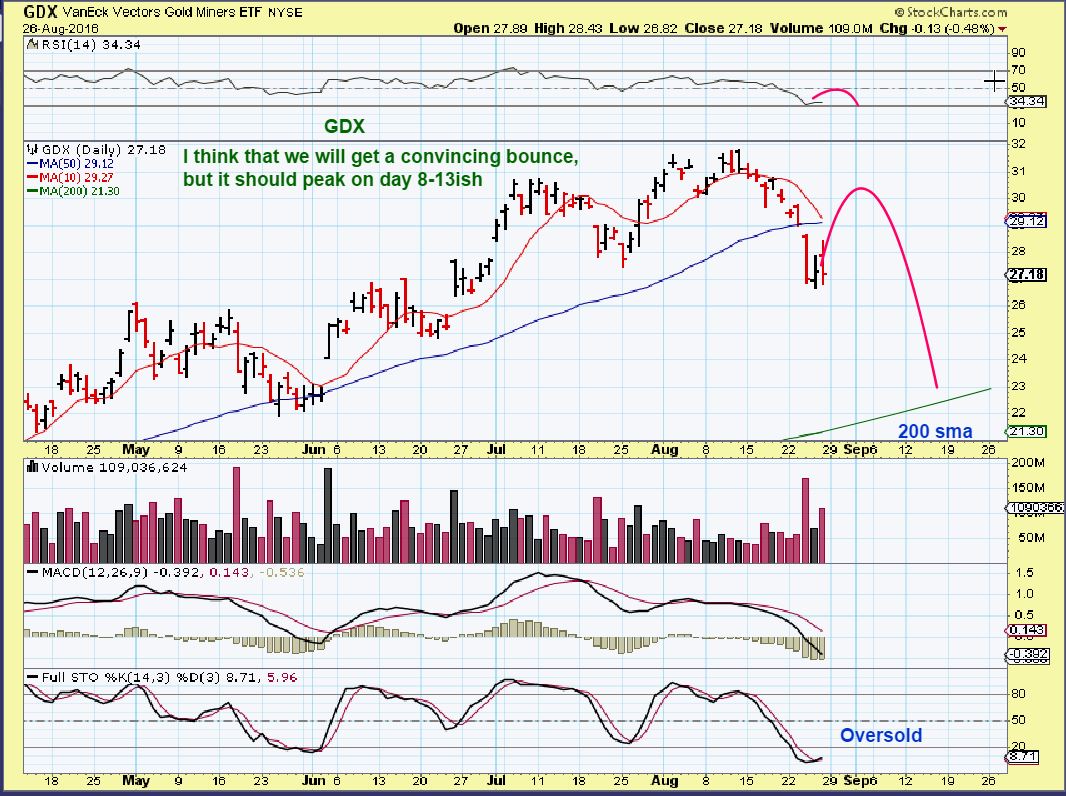
GDX – A bounce can peak by day 8,9,10,11,12.
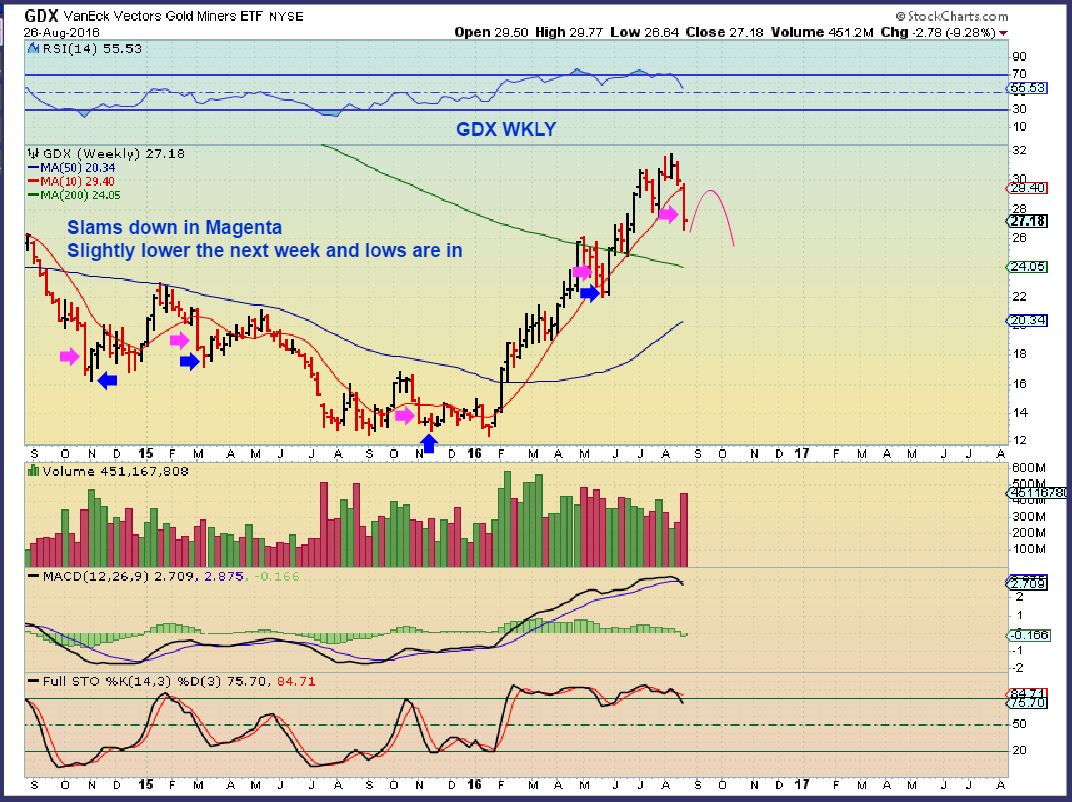
GDX WKLY – A low in place or a low next week.
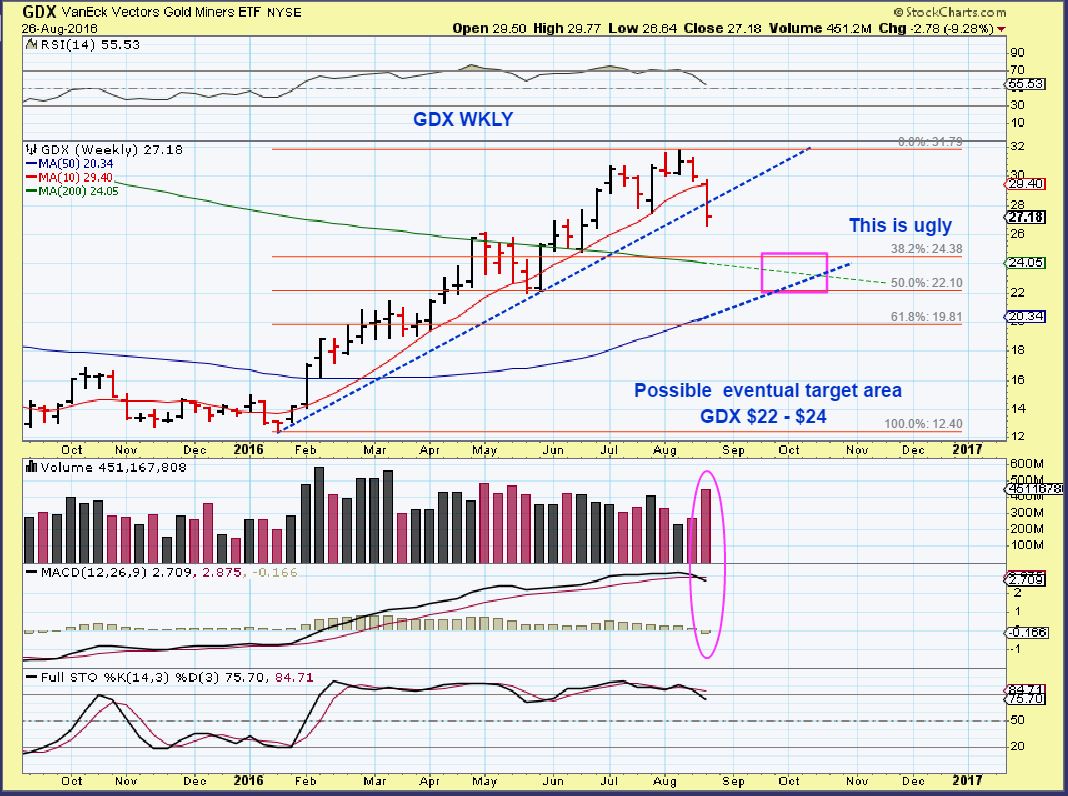
GDX WEEKLY possible ICL targets once we start dropping again.
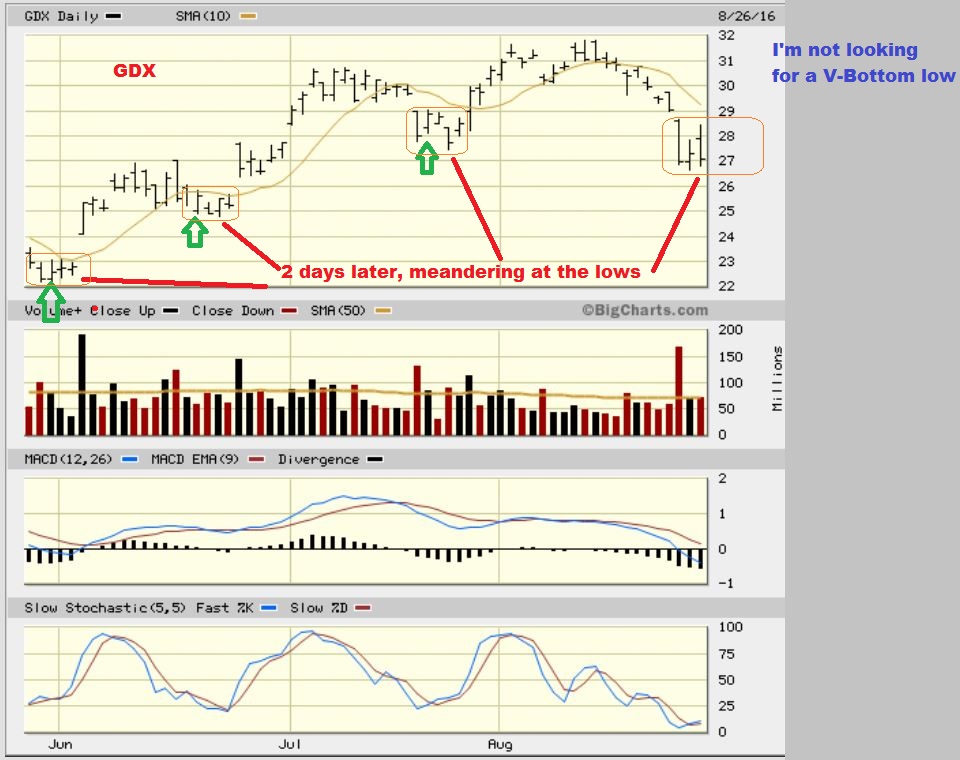
Here I am just using an old chart pointing out something with the red arrows. This late in a daily cycle, after a steep slam like we just had, we have seen the lows develop a day or two later. The sellers are exhausted by the move. Expect GDX lows in place o within days.
I used this in the comments / chat section Friday mid day – when people were concerned that the gains Friday were going away. I have seen this before, it doesn’t mean we aren’t forming a low here.
.
3 sets of charts for perspective.
.
Short term and longer term. These are going to be Miners that we loved once. Lately, nobody loves them or wants to own them. I’m using this part of the report to show why they could become much loved again, after an ICL.
.
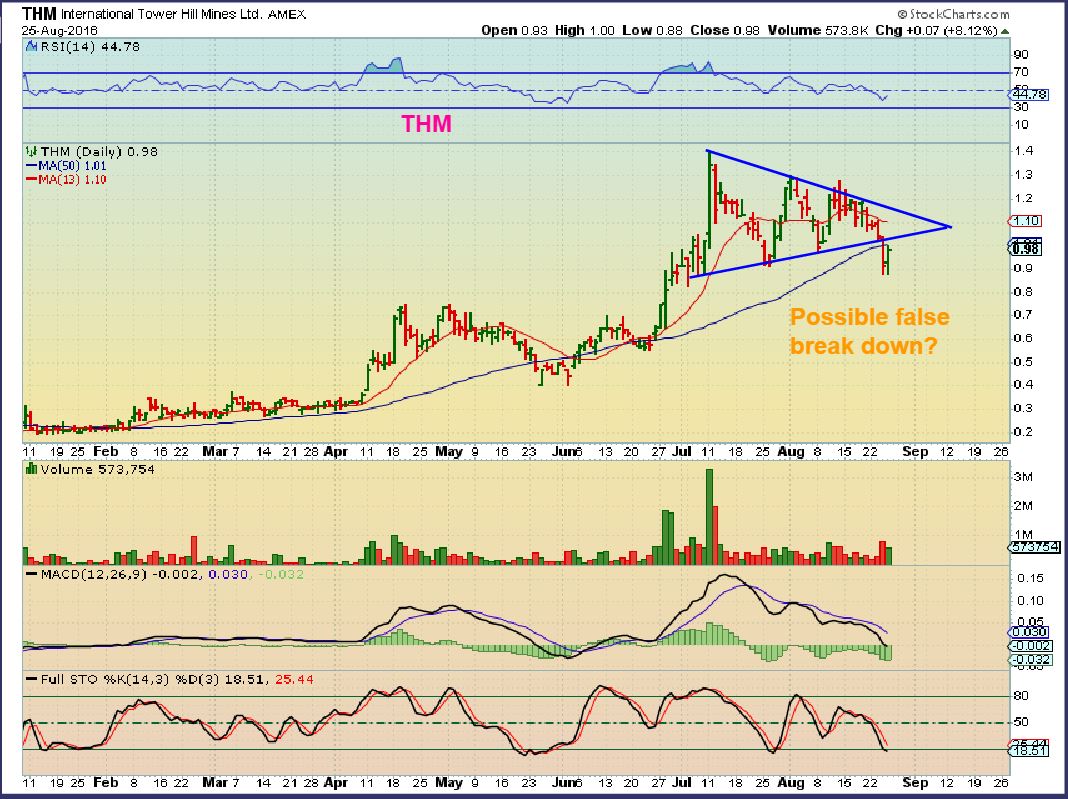
THM – This was loved, and if you took this trade when I pointed it out at 50 cents. We made some great money on this one together. It almost tripled from there. Lately, after breaking below the triangle and the 50sma, it is not pretty anymore.
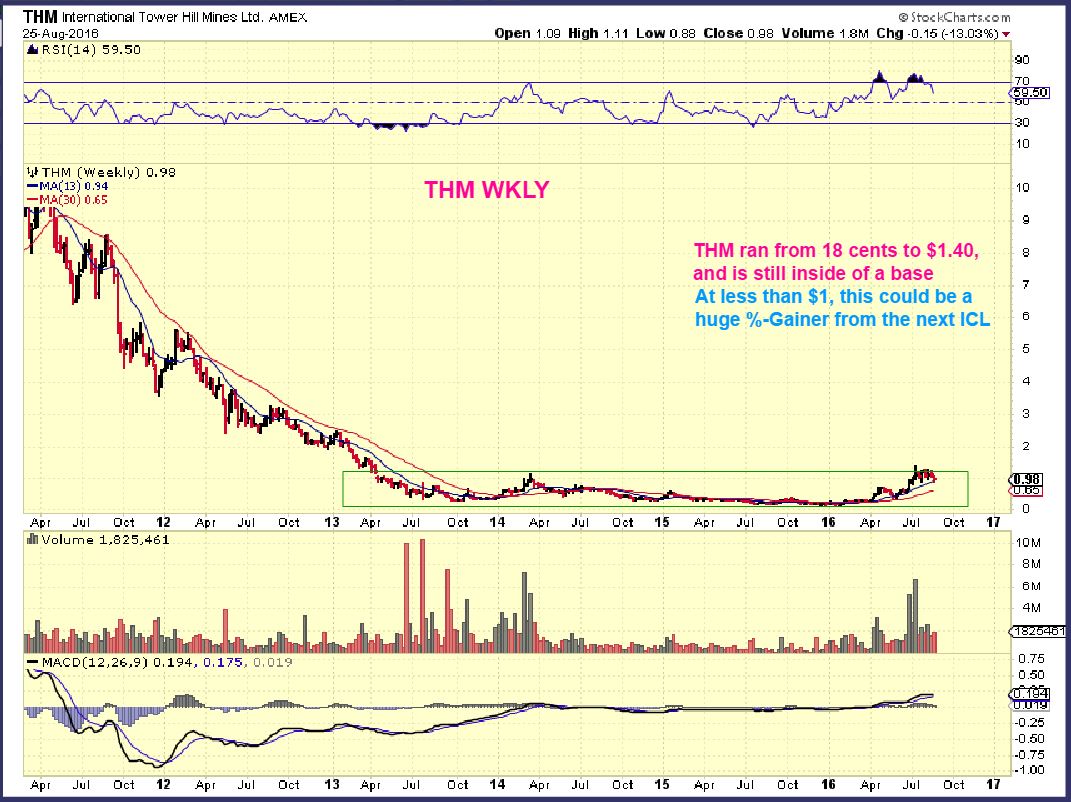
THM WKLY – Very pretty in my opinion. $1 to $2 in a bullish heart beat after the next ICL.
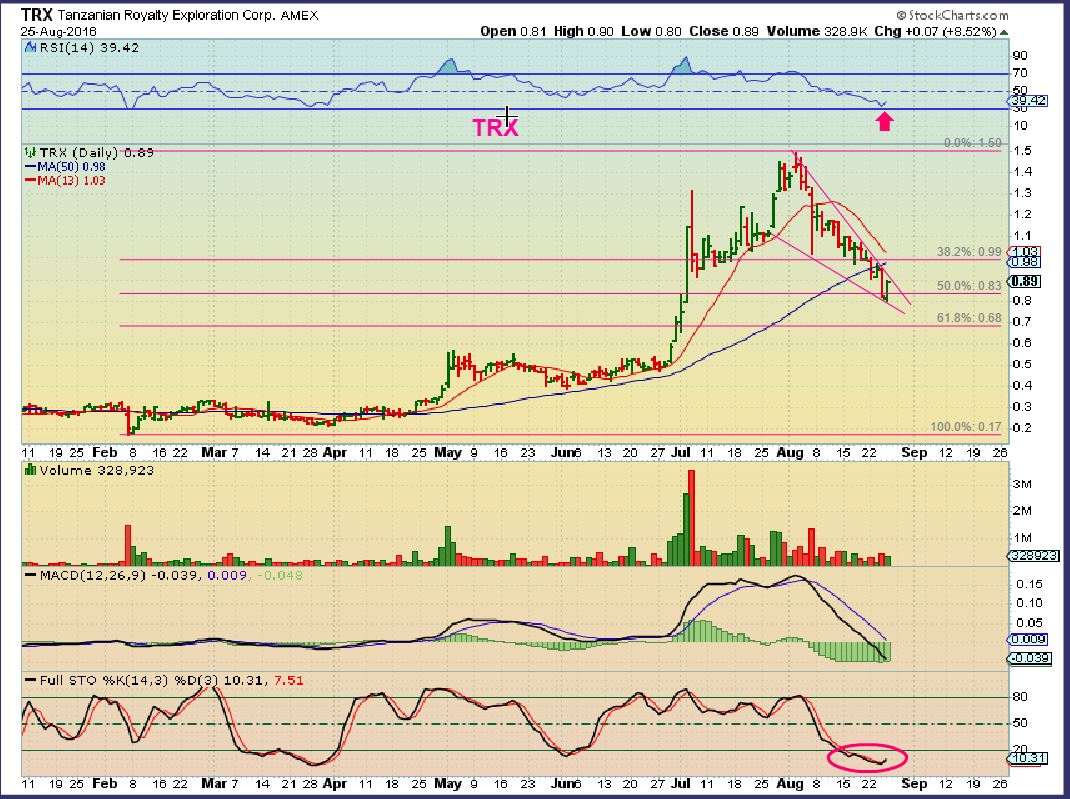
TRX – After a very bullish run and some great gains, TRX is now rather weak and ugly, also breaking below the 50sma for the 1st time since April.
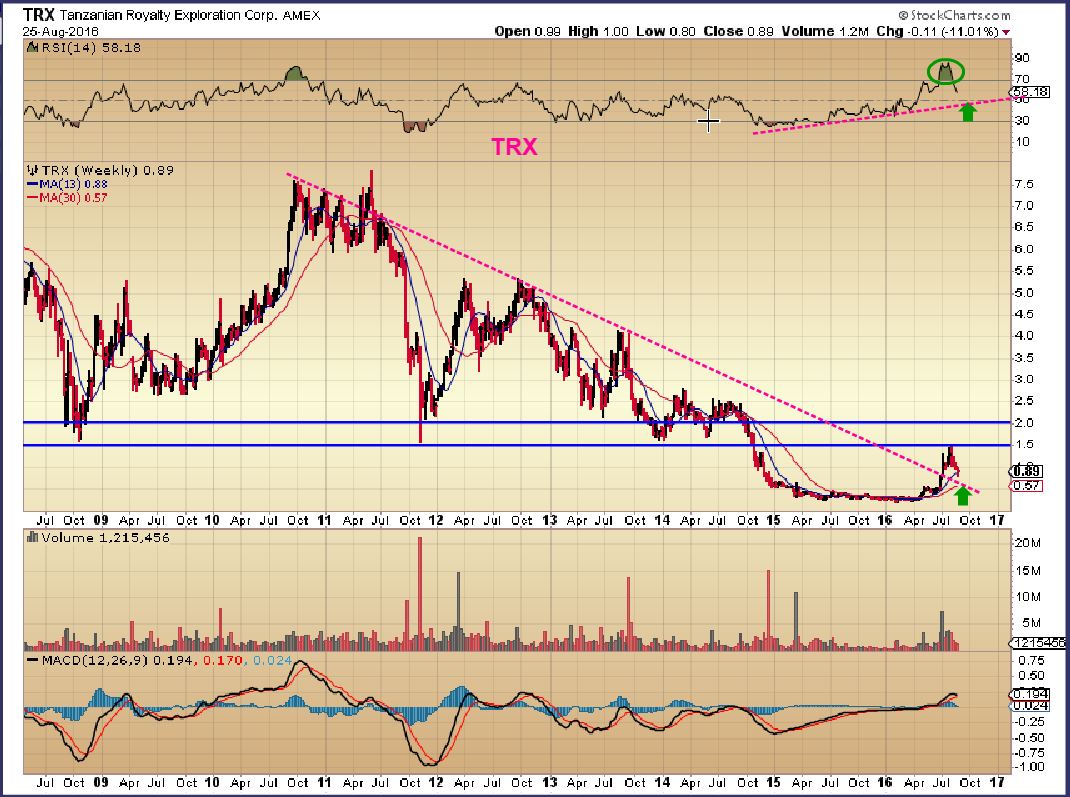
TRX WEEKLY – TRX ran strong and became very overbought on a weekly. It has tagged the underside of resistance, but it broke out from a down trend in the big picture.
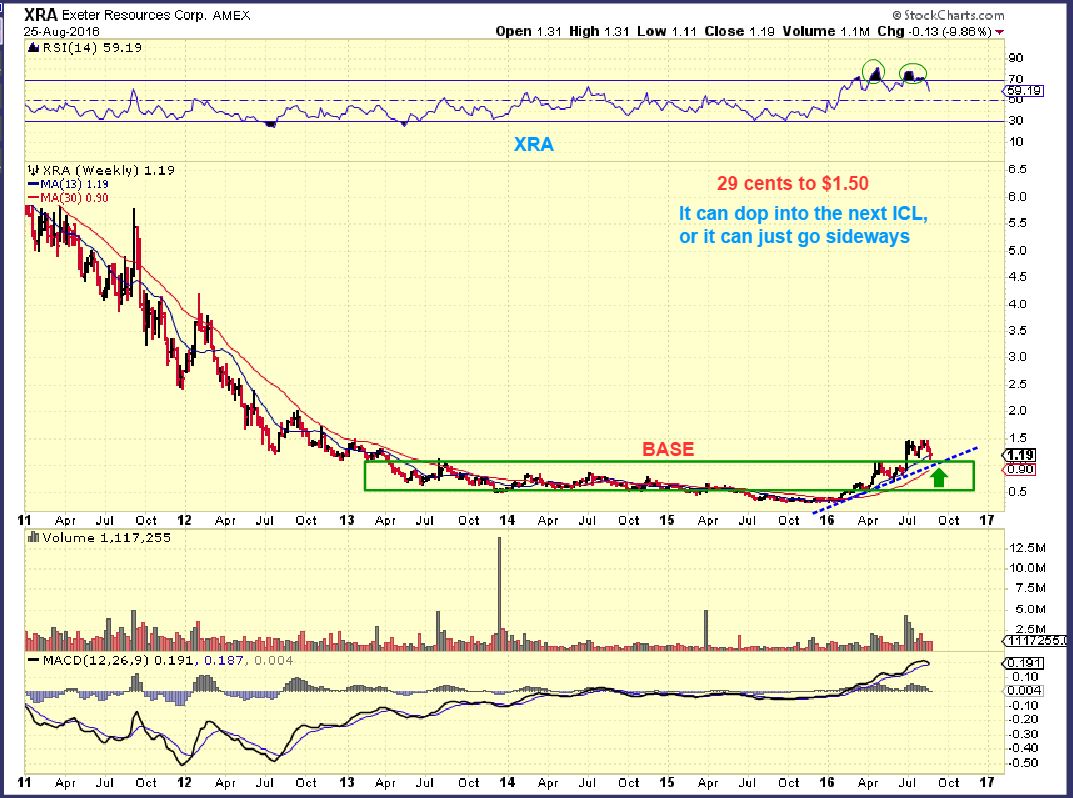
XRA WKLY – Bucking Bronco. HUGE GAINS, but many buyers hate XRA recently, especially the buy & hold group.
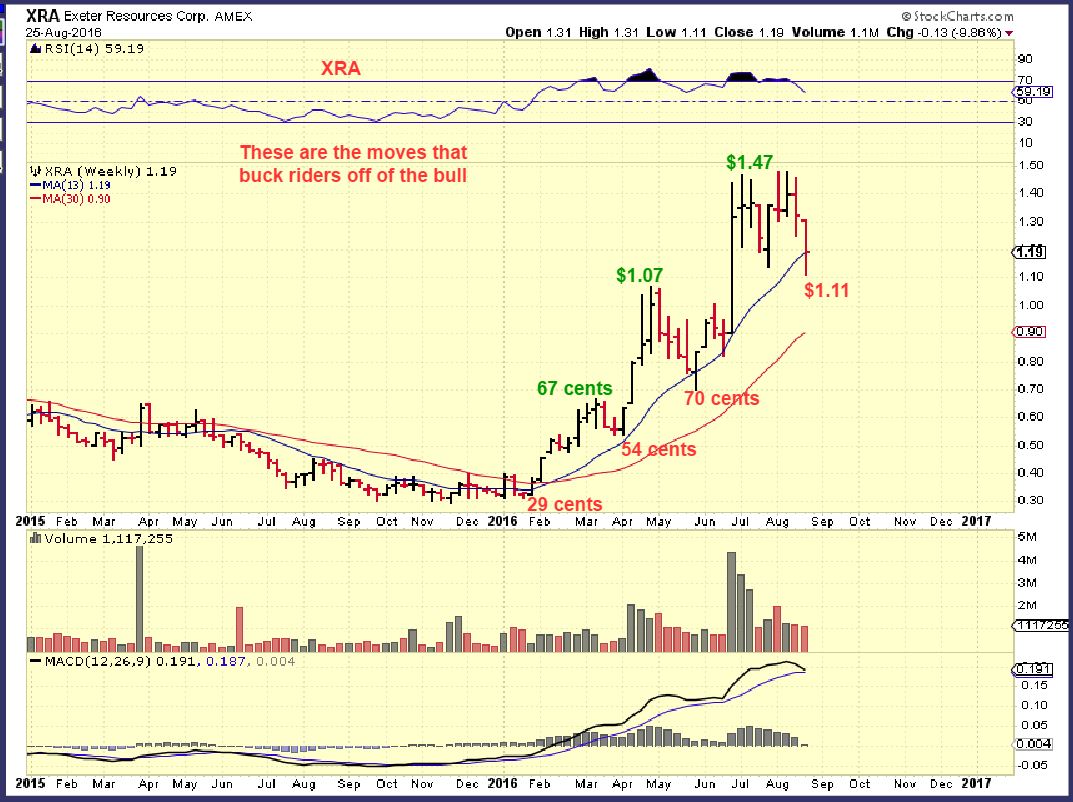
WHAT A BEAUTIFUL CHART – 29 cents to $1.50. Huge gains. We have a break out & back test in progress.
That is your weekend wrap up. Gold & Miners look a bit tricky in the short term, but I wanted to impress on everyone how Bullish the longer term charts look. These are the wiggles in the big picture, the ripples in the pool. As a trader I may trade the bounce in Miners here ( I already bought few like AUMN, AXU, ), but it may not be buy & hold time until the next ICL. This drop just goes as a reminder that no matter how bullish Miners look, they can always get sold off.
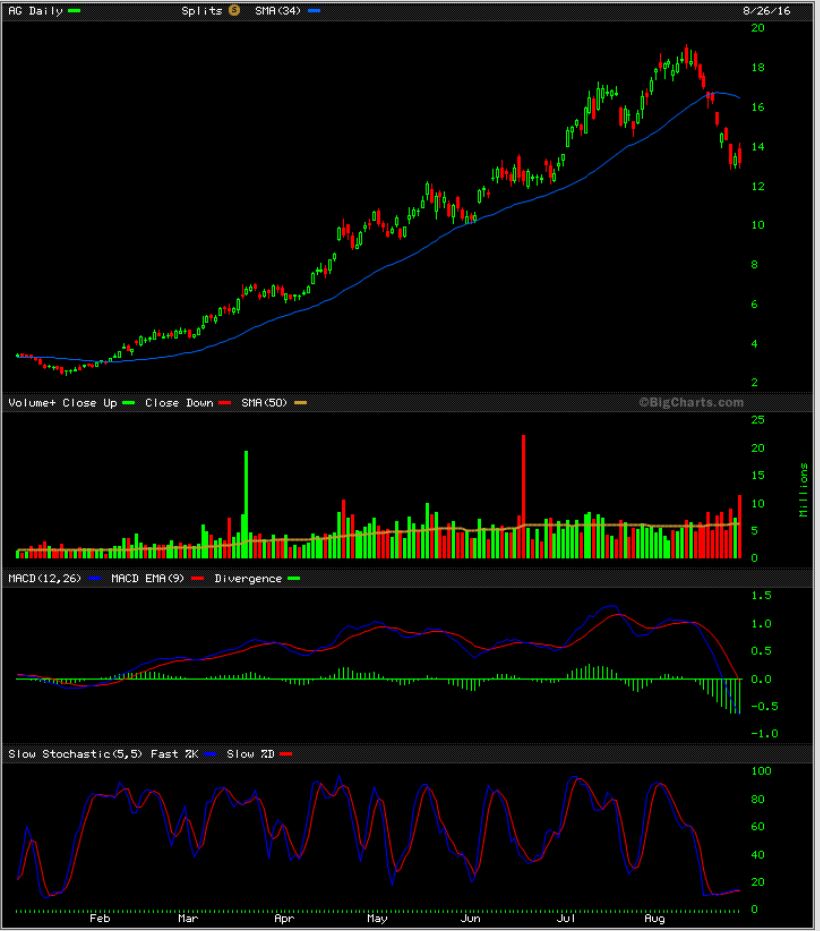
AG – One of my favorites ran to $19+. Suddenly it is at $13 again, and below the uptrend line.
We’ll have to see how the Miners play out going forward. The recent selling was up to ICL standards, so it has me wondering if this was a FLUSH OUT sell off that bounces with a final daily cycle, and then when Gold drops to its ICL, will these Miners just double bottom? A slight under cut low? I have a few thoughts on the matter, but time will give us the chance to add important info to these ideas and gain a better understanding of what is really taking place. EVEN IF this was an early ICL wash out in Miners , before Golds real drop, they would still drop into a higher low on that sell off in Gold , and that would be a buying opportunity. We still have time for adding longer term additions of Miners from what I am thinking. Being patient is playing it safe under these conditions, not missing a bottom.
I am still bullish OIL & ENERGY, and most of my positions are there, buying the pullback. I will cover more after we see Mondays trading. You may want to read this report a few times to absorb all of the thinking here. The last chart below is the mind blower  Enjoy the rest of your weekend, and thanks again for being here!
.
~ALEX
.
THE PIPE DREAM?
.
There is a teeny tiny chance that Gold could digest the “Inflation” talk of Jackson Hole and burst higher at lets say three $30 per day bursts to new daily cycle highs by day 29, and THEN drop into a dcl by day 33, changing this to a right translated 2nd daily cycle, and GDX to a ‘fake out – shake out’ . I was just staring at this chart and saw the 2 other patterns with striking similarity ( orange circles). Sideways, weak, and then a BURST & drop. I dont think ANYBODY ELSE thinks this could happen, or even can see this.


Love the gold “pipe dream”…wouldn’t that be grand?! Thanks for the report.
I KNOOOOOOOOOOOOOOOOOOW !!!!!!! I like it too : )
Good-evening ALEX.
Excellent explained, I see what you mean, especially how you see your ‘wishes dream’, how this could easily happened.
Have a blessed weekend.
Thx Geurt,
best to you too, as always
Very nice work chotfreak… big fan of your Pipe – dream as well…. 😉
Heehahh…
MAAAAH REEEEHAAA ( like Arnold Schwarzeneggers voice )
I jut wanted us to all wish it true, to make it happen. It did happen in those other orange circles, right?? It is least likely of my thoughts, ut it could happen : ) Have a good Sunday.
..
Thanks for your vision and perspective! Dumb question .,,, but would you characterize TGD in the same way as you see GDX? I still have a decent amount, thought not as much as I did a couple weeks ago. Now at a small loss but not sure if I should hold out for that giraffe we thought we would see ..,,
Crystal, I am with you on TGD. I still have a bunch also. I plan to keep it as long as I can. Alex did mention recently that he likes the chart. Even if the giraffe hasn’t arrived, it keeps on slowly moving upwards.
Hi Crystal ( And Johnny)
I do like the long term chart for TGD, but the giraffe neck at this time in the cycle work is likely not going to come about at this time.
If we are at a dcl, TGD could make a nice run higher over the next week or two. Notice how it keeps probing the 5sma and losing it? It is above th 50sma now. DUE TO THE POSSIBILITY OF A SELL OFF INTO AN ICL I would sell it on a bounce, unless you are holding it as a core.
Poo. That is bad news.
Thank you Alex, my TGD is a core position. That said, I still get concerned about it on a dip.
To be honest, it could drop lower and still be in an uptrend. If Gold heads down onto an ICL in September, I would expect it to dip,but we may get a bounce first
refresh
.
Thank you Alex. I appreciate the chart. I see the uptrend.
Yeah, I have some too at a tiny loss, have been wondering if it’s too dangerous to hold on to not knowing what the cycle might be doing….
Same answer as Choot-freek!! I realized 2 weeks ago that giraffe necks were over, I’m on. So, I sold TGD for some small gains, much less than I originally wanted thinking it was better to wait for gold to reset and try again. Sure, could always burst higher again but went with larger miners for core, personally.
Hi Cason. Which miners did you keep for you cores?
Hey Johnny. I kept MUX, BTG, and EXK. Is that the best combo? Maybe, maybe not. I bought EXK early and have been trading in and out all year. BTG on a CF recommendation and it really outperformed peers after three May ICL. MUX was a late add bc I love the chart and the management. The other companies I had were either too small to hold as a core, imo (TGD, AUMN, VGZ, etc) or I liked – SAND, SAND but just knew I could get at a lower price later (which is really proving to be correct, SAND is a full $1 lower than my sale point already.
I do like all three. MUX would be my favorite but imho, all three are good
Also just an idea after having a glass or two of wine …. And then looking at the gold chart on the 2 month time frame –
The last Fed Reserve meeting was July 26-27 — look where gold is now and where it was at right at that meeting. Could this Very simply be a back-test of that break out? that Gold dropped back to that point in July just because of Yellen speaking at Jackson Hole…. And was ready to drop in case she gave a strong rate hike hint for Sept?
And now that is out of the way, we might be clear for take off again?……..
I like it, and I do think that we are at a DCL area in the next day or so.
How far she bounces? Cycles say no new highs, and a drop into the ICL this fall
Alex, the chart you posted GOLD’S INTERACTION WITH THE MOVING AVERAGES is so cool! I see what you mean about building confidence with all three lines (blue, red and green) lining up and behaving properly. Even when you select daily instead of weekly, they are behaving as well.
Alex,
Excellent Report…..
And I couldn’t agree more, if GDX moves up and gets close to 30.73 (right shoulder) I am planning on Reducing Exposure in the metals, other than my LT holds. If it breaks above 31.79 I would jump right back in……
What also concerns me is if GDX might be beginning a wave 2 Correction, wave 2’s can be very deep ….. 50% to 62% is certainly Not uncommon.
Another concern is my LT count for the USD, I will try to post The count maybe tomorrow , if interested.
Hi Ken
Sure, show me the E.W. count on the USD, that would be great.
It is obviously a volatile time, and when I see volatility, I often see that sideways chop and no one enjoys trading in that environment : ) P.S. —— A wave 2 correction matches an ICL. Icl’s are deep and come out of no where. No news, No logic, they just sell off and people always ask “Why did that happen?”
Funny, but the recent selling in Miners came out of nowhere and got a bit deep too. I imagine you view that as just the start. A 30-50% correction in miners is not out of the question for me.
And with the USD, For me – I just see the USD as weak using cycles. It should not break to new highs, and if it did, thats kind of a game changer, but I dont see it.
“A wave 2 correction matches an ICL” That is what intrigued me months ago about if/how EW could work together with Cycle therory, makes since to me that they should to some degree…..currently I am working on: does one trigger action before the other? I.E.: Does wave 3s (the largest wave in EW) usually the second DCL in an IC? Or is the norm combining the 2nd And 3rd DC (possibly a weak 4th) to complete that wave 3? Then a A B C wave 4 correction (IC) but with a higher high into the final wave 5 (IC with 4 DC’s) ?
I have done that too, but it seems to vary a bit from different sectors. think it can be both, and it depends on which Cycle ( Oils is longer,so 3 can be the 2nd & 3rd together, and the dip o the 2nd dcl is smaller)
I also wonder about the bigger picture where the entire first intermediate cycle would be 1, the recent dip to the higher low was 2, so is this entire intermediate cycle going to be a huge 3, that would take us further than the first one.
So the first was roughly $26 to $52ish…. will this be a run from $39 up to around $70 as a big 3.
I am not sure I am following. See attached chart…..
I am currently leaning towards my “b” being the next DC in late Sept early Oct. ………
What concerns me is GDX has not even reached the 38% Fib. Retracement yet….
Hmm..ive used this as well but was bugged by the shortness of 3…
So.. u thinkn A may hav completed..? (Im on my cell in gazebo so cant see all that great…even with my granny glasses) 😉 oh u just shhhh
Lol….Pool side with my 2.5 sun glass readers on. 🙂
Agree on the 3 being short but a definite 5 waves inside …..
Why cant 3 be July?
u mean like this count? https://new.tradingview.com/x/2O4qthO6/
i like that count for the rule of alternation… 2 was shallow.. 4 deep zigzag..
Either way, next low is certainly a buy!!
Yes.. exactly.
Omfreakngawd…had to read that 3x..lmao. ive read they work stupendous together but hav been scratchn my head wondering the same.
..inteestingly seems both ew structures and cycles ‘fail’ & trigger new counts. . I also question how on earth ICLs reconcile with the rule of alternation?
Me too, but has ever definitely seen cycles and waves work together on gold/miners!!
As my Oil/energy positions slowly bleed into the red, I just keep looking at this chart, keeps things in perspective,
I’ve tried to put it in the weekend reports each week just for that reason
Yes, It started in Early August ( f5)
Ive used it occasionally to build confidence
.
Yeah, As I mention when I first joined your site, you do an excellent job of keeping the bigger picture in focus for me. It was one of my trading faults prior to joining and you’ve helped me tremendously with that. Still trying to make it a habit for me.
I agree, and for me, I try to look big picture at the weekend report, so the weekly chart simply completes another candle.
Good perspective. I’m in the same place, slowly bleeding red but bullish on the possibilitit’s. Just think if miners had turned around in Feb to pick up the stragglers like oil did.
Yeah, I’m hoping this week will turn it around before stops are hit, but all my fault, bought a few higher than my initial targets and now watching them slowly drain down to there is just getting to me, hahaha. The crucial moment comes when they hot those targets,,do I buy more there..and I will on a few if oil still is holding up at least.
That’s always hard for me – add to bring down cost basis or stop out. CF is pretty confident and that has really helped in the past!
Yes, slowly bleeding into the red over here as well…..I’m doing the same…looking at the long term chart and just keep repeating to myself that we’re early in the new intermediate cycle….early in the new cycle….early in the new cycle…..
Alex, Sorry if I missed it from one of your reports, but if the current IC in gold does not make a new high, won’t the IC be left-translated? And if so, what can we extrapolate from this?
My concern as well… we shall soon see
Yes, in theory, and thats a good observation. It’s tricky. It would for Gold. Miners peaked in August, so they are fine. If you look at the weekly chart in this report for Gold, I didn’t draw it in, but it is in a triangle.
I never trust cycle counts when Gold forms a triangle. In the past triangles have messed things up, they prevent timely breaks to new highs and look left translated. I’ll just see how it unfolds going forward from there. Unless we get the Pipe Dream burst higher. That would solve that.
Alex- being that we came out of a severe bear market that saw many miners get way overdone and the lst IC seemed very mild I was thinking maybe we just had a very long IC and now we are looking for an ICL before many expect? That would make the next cycle very strong and align with Elliot wave folks who are expecting a powerful 3.. Following this next move that would test the april 13 breakdown we would have a much deeper consolidation/wave 2 icl phase. Do you see this as at all possible? Ty
I really dont, because the ICL in May met criteria that we look for when identifying an ICL. The uptrend was broken and showed that the intermediate cycle was in decline and as it dropped it broke to a new lows in May. In May Gold broke the March lows.
Look at this list of miners that were all up on Thursday AND Friday:
AUMN, AXU, CDE, EXK, GFI, GPL, MUX.TO, NMI, RIC, SAND, THM, TRQ
EGLE – Eagle Bulk Shipping- Went from $5 to $12 ( reverse split in the recent past).
give arex a push thru… it wannnnnnts to break…
Big Short Interest Maria – 9.2 days – could be a squeeeeeze coming up
im fine with that 😉
can even take a tiny rest at say 5ish before it heads to 9? giggle….
#PipeDreams
I took it as a trade, and would be happy if it gave me lunch money.
vroom vroom 😉
I’ve been adding for a while as mentioned in comments. Nice high volume pop & break out today
Woohoo
SXE looking unsexy today
Alex could you have a quick look at the chart for SRAQU and tell me if I’m wrong. This is a new company that was set up as a blind pool with 450mil cash so Mark Papa – the guy who created EOG energy – could go and do it again. There is no volume in it today.
Low volume many days
Alex – when you get a chance can you say what you think of CLNE chart? Thanks!
Looks good
Oil has to hold $46.42 or unless it’s just a quick undercut reversal, it could get even uglier quick in my opinion,
LOD $46.62, now trying to break out on the 60 min chart, starting to look better if it’ll close above $47.12
Thanks for the update!
Alex, are you still in AMRS or did you dump?
Still holding closing above the 20 sma. Still in it, but I think it is still ‘basing’ consolidating.
Anyone know how far AREX might run? 🙂
If anyone else has BBG, good news that CO won’t have a vote on restricting drilling…not enough signatures on petition to get it on ballot.
Thank you, Nancy.