
Have You Been Shopping?
Tuesdays markets sparked my interest in a few ways. Let’s get to the charts…
.
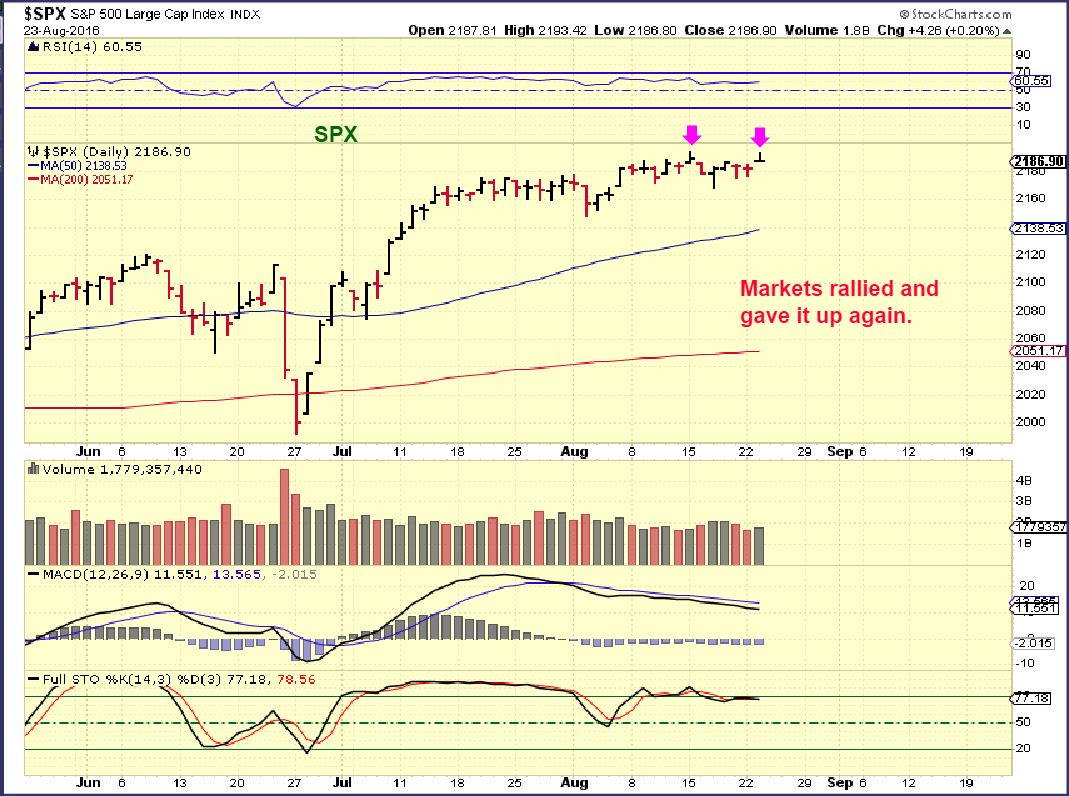
SPX – We’ve certainly seen this before. Frustrating the longs and the shorts, the sideways move continues.
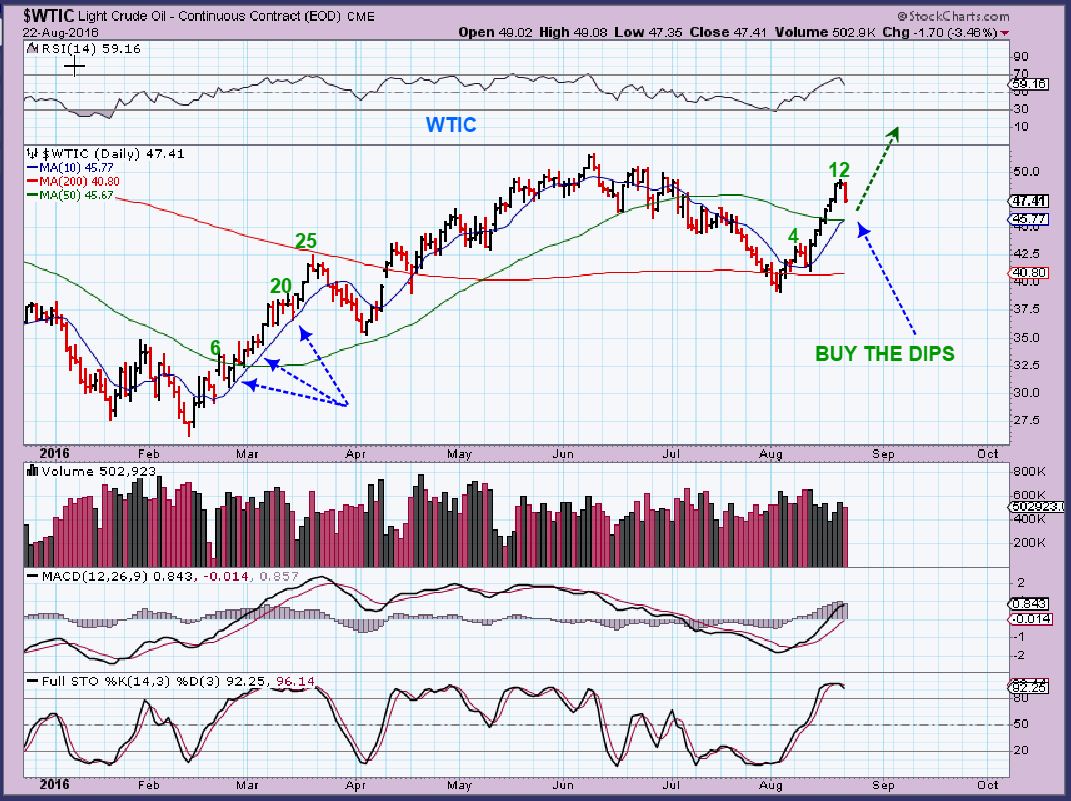
WTIC – This was important to me. I posted this chart and mentioned that looking at the first run out of the ICL in February, we saw price hug the 10 sma, and continue higher for 25 days. Look at the current price for the 10sma and notice that we are not at day 25 , we are 1/2 way there. “BUY THE DIPS” is written on the chart.
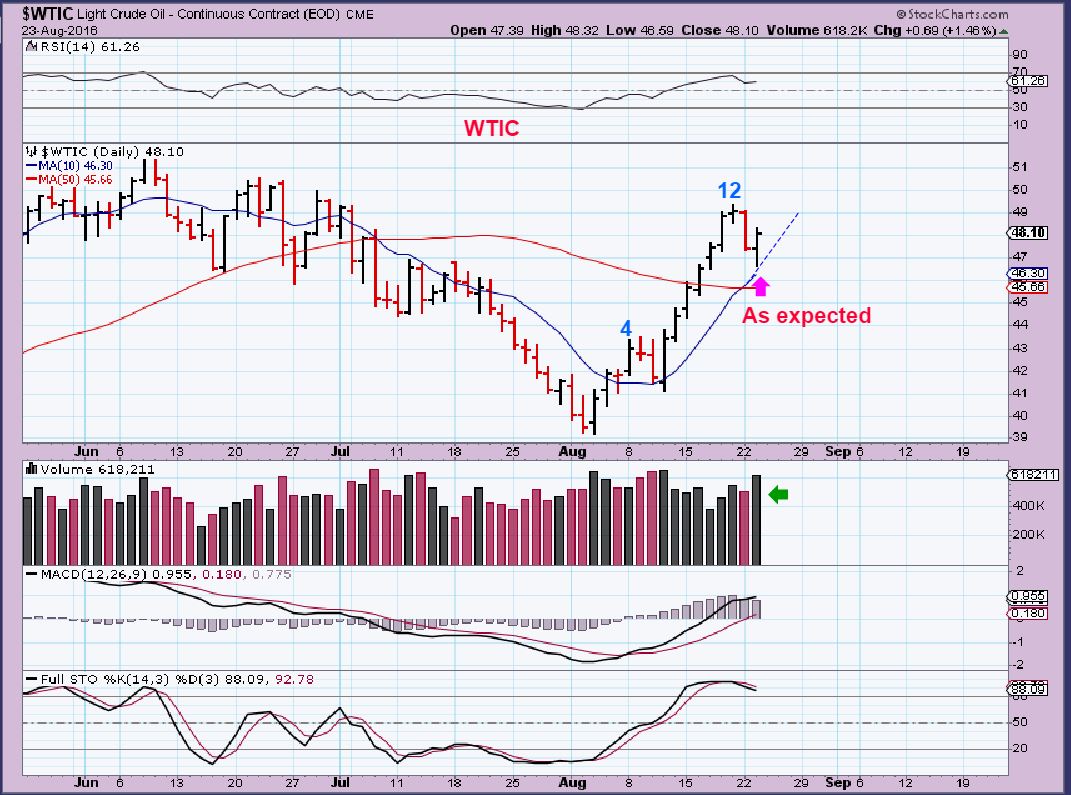
WTIC – Oil continued its drop and then put in a timely reversal. Each day it is important to keep a watch list and watch how your oil stock picks, along with the XLE, XOP, OIH, etc, act during Oils selling and reversals. I will discuss more at the end of the report. If OIL BULL FLAGS to the 50sma here, it will give an additional buying opportunity. So far it reversed at the 10sma and remains above the 50sma.
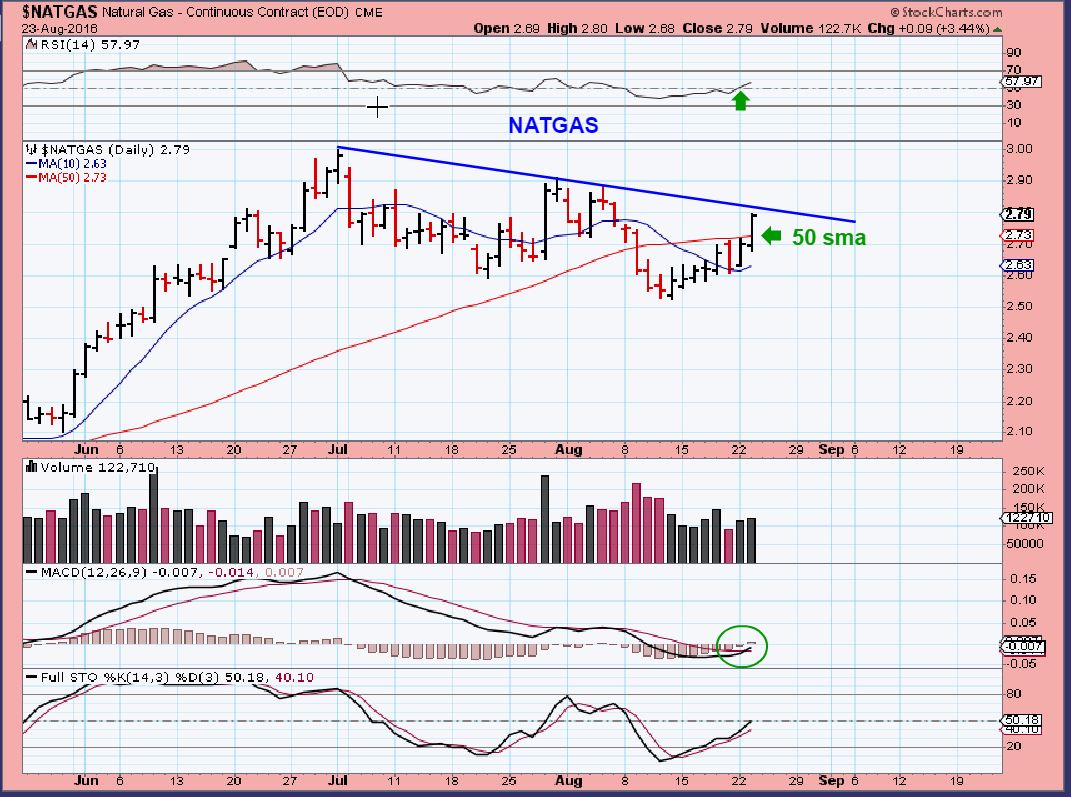
NATGAS – Rejected at the 50sma on Friday, it rebounded Monday and showed strength along with an improved MACD and the RSI ready to try to move above the bullish 50% line.
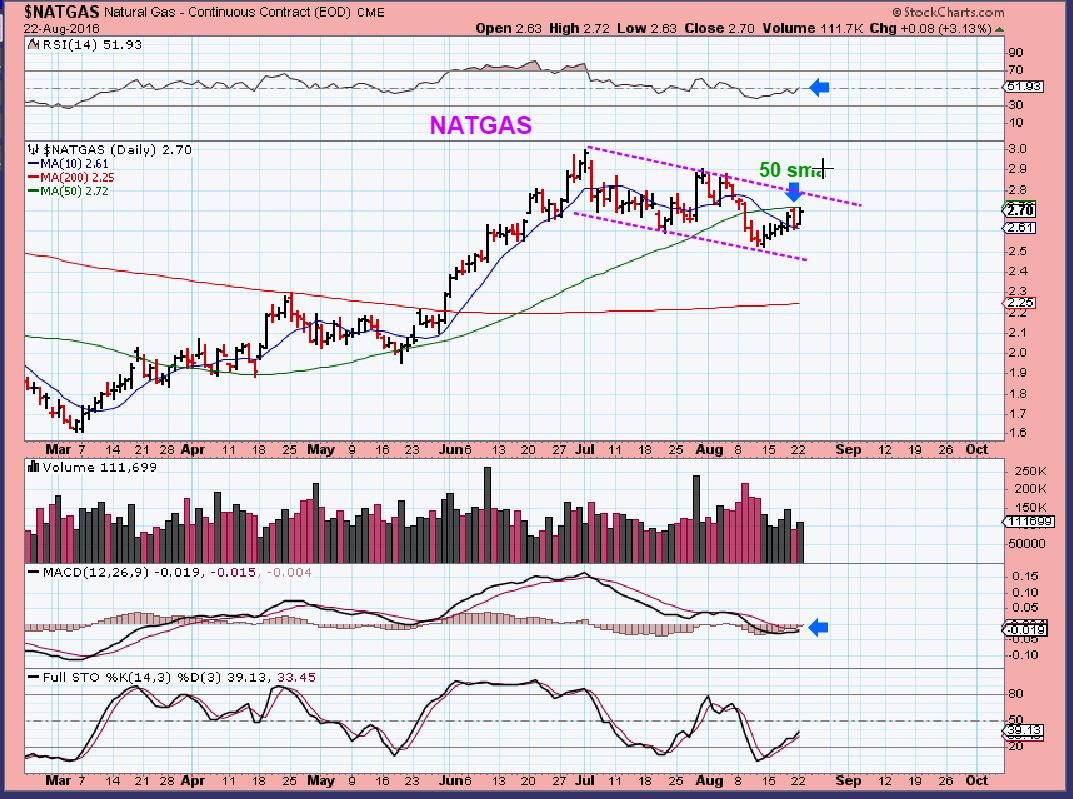
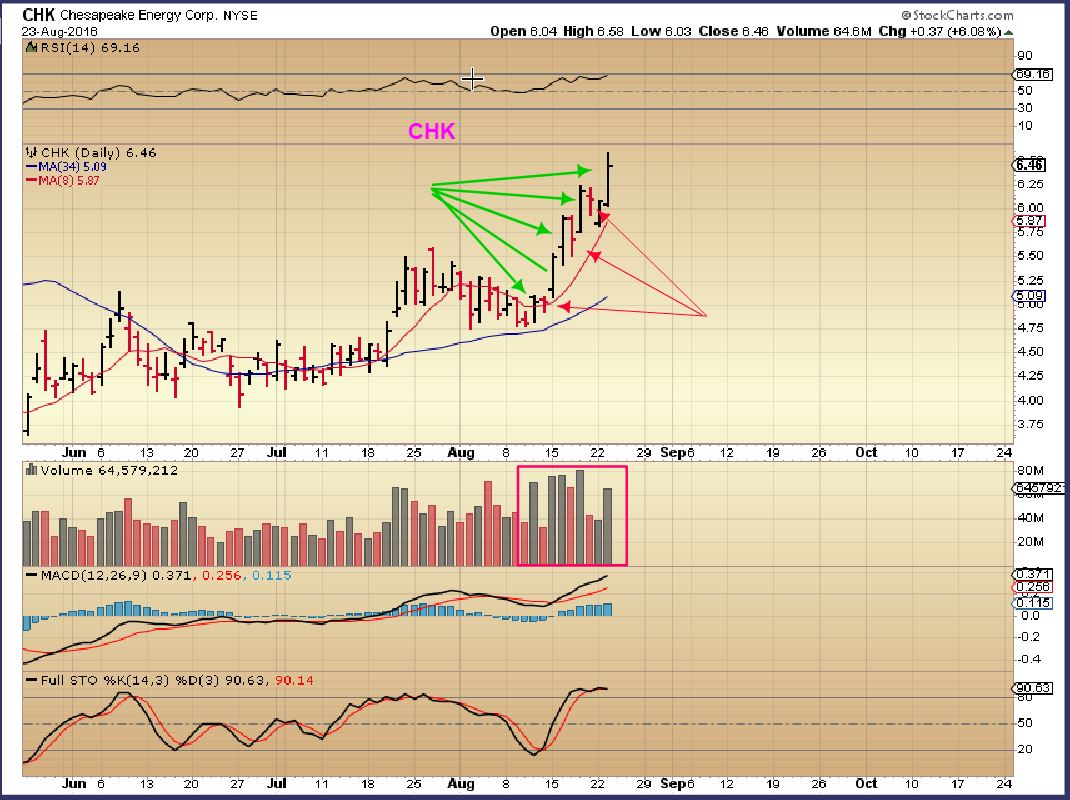
Tuesday NATGAS had important follow through in all areas. Notice how NATGAS ran higher in June. When it gets running, it can move well, so if your Energy stocks consist of NATGAS & OIL, they should do well. Both look bullish going forward for the next few weeks. For example : Chesapeake Energy (CHK) has done well out of the lows and was up another 6% Tuesday.
.
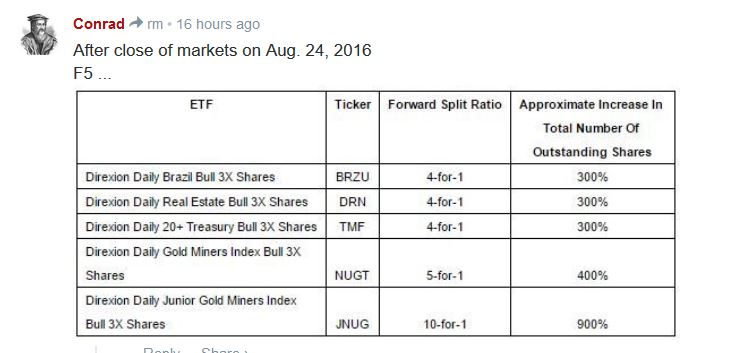
This was a nice reminder for the active traders here that use these 3x leveraged ETFs. Thx Conrad.
.
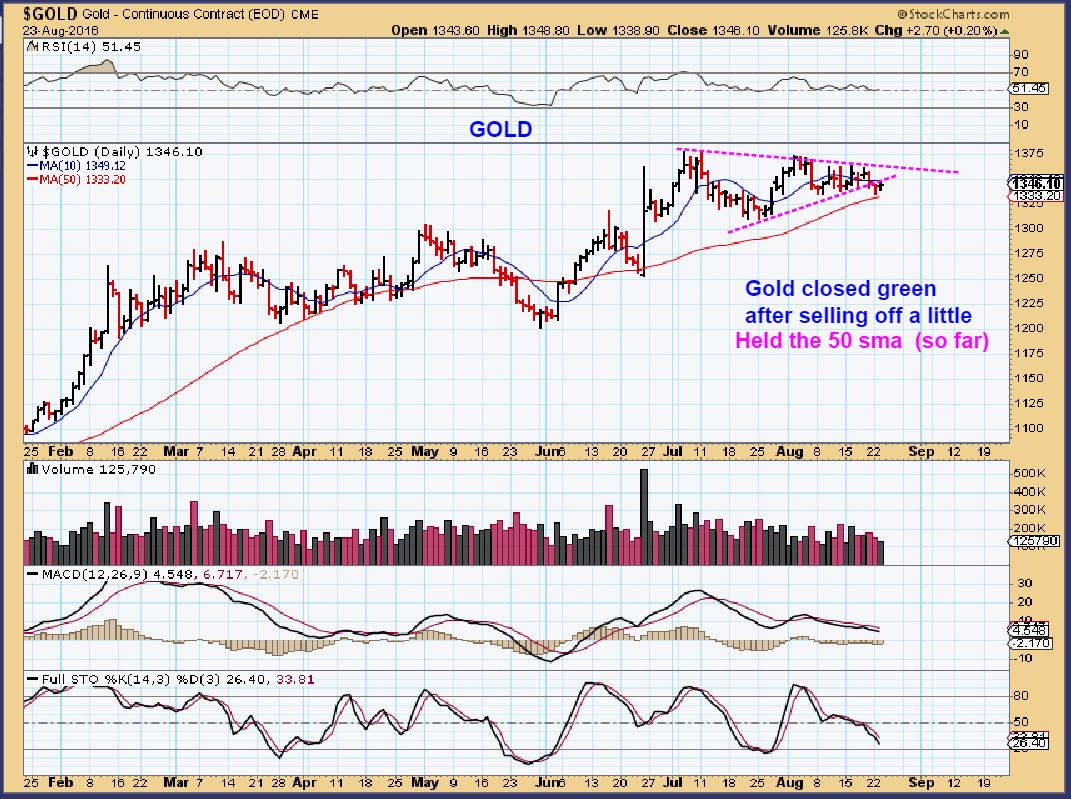
GOLD – No big change. Read yesterdays report for details on my thinking in this sector. It needs to burst higher, but even that may roll over into an ICL.
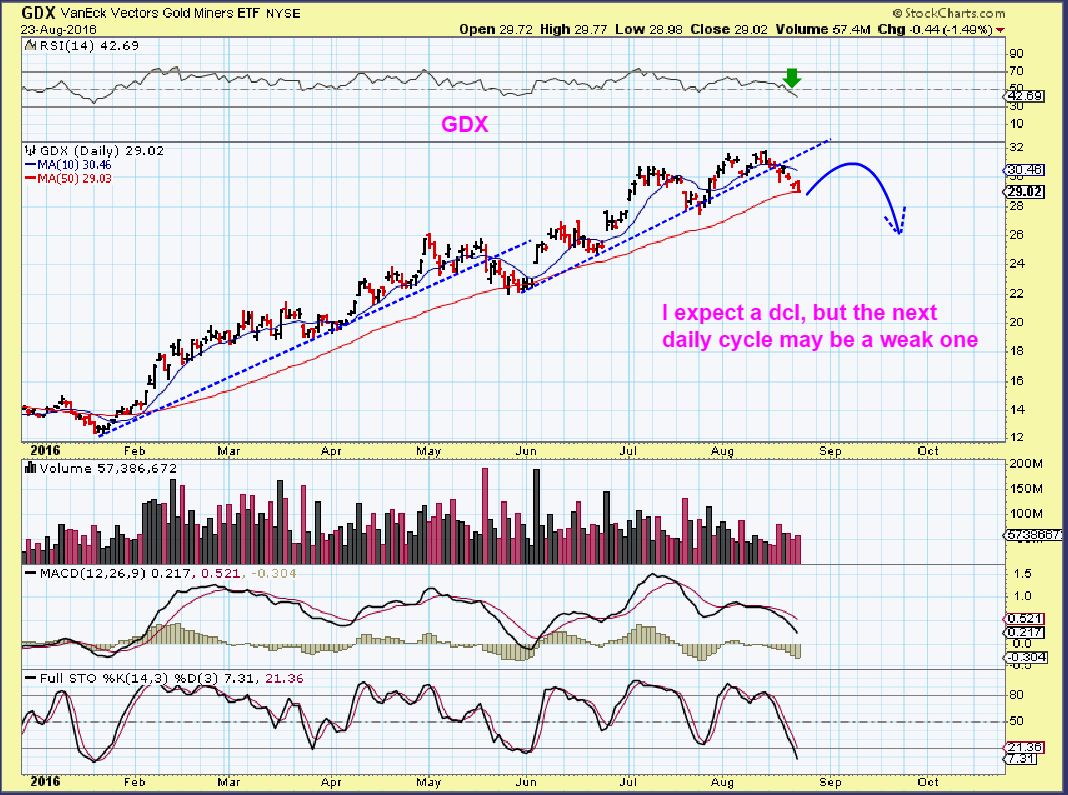
GDX – GDX could be close to putting in a temporary low, but I am thinking more and more that it will be a weak bounce and then a drop into an ICL. The drop into the May ICL did not destroy many miners. Some just dipped a bit and went sideways. MAYBE Janet Yellens speech Friday will put the lows in for precious Metals ?
.
SO lets review a few charts.
.
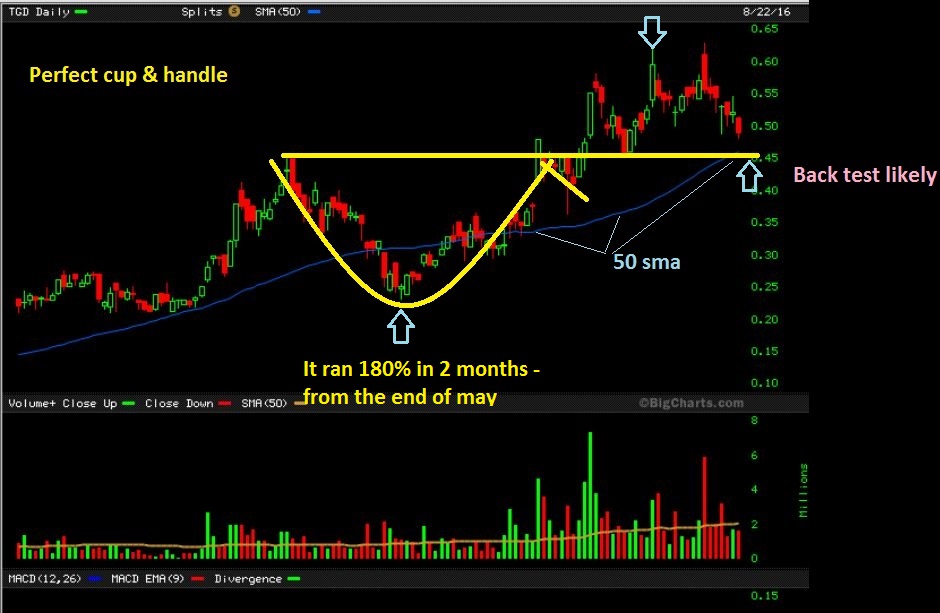
TGD – Some own this as a core holding. It has run up 180% since the buy at the 200sma and the recent consolidation looks to me to be a normal back test / consolidation. See the chart.
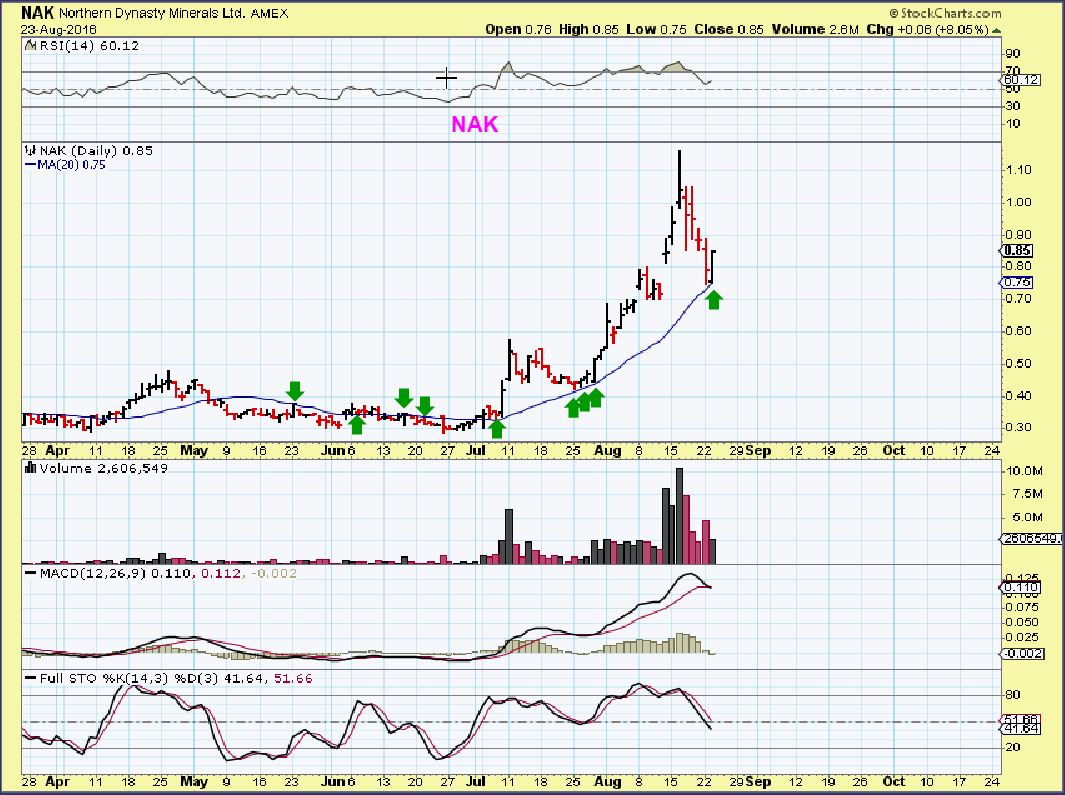
NAK caught my eye Monday & Tuesday. I noticed that the 20sma held as support in July, so I wanted to see what happens when price tags it again. Tuesday we got a reversal on the 20sma. I own NAK from the buy recommendations at 30-45 cents. This could run up & double top, it could bull flag, it could even break down and lose that 20sma, NAK could do many different things, so I am watching it and also comparing what I see going forward with what TRX, XRA, or THM did on their 1st pop & run, drop, and 2nd run. Buying at the 20sma was low risk, but you have to stop out below it if the trade goes against you.
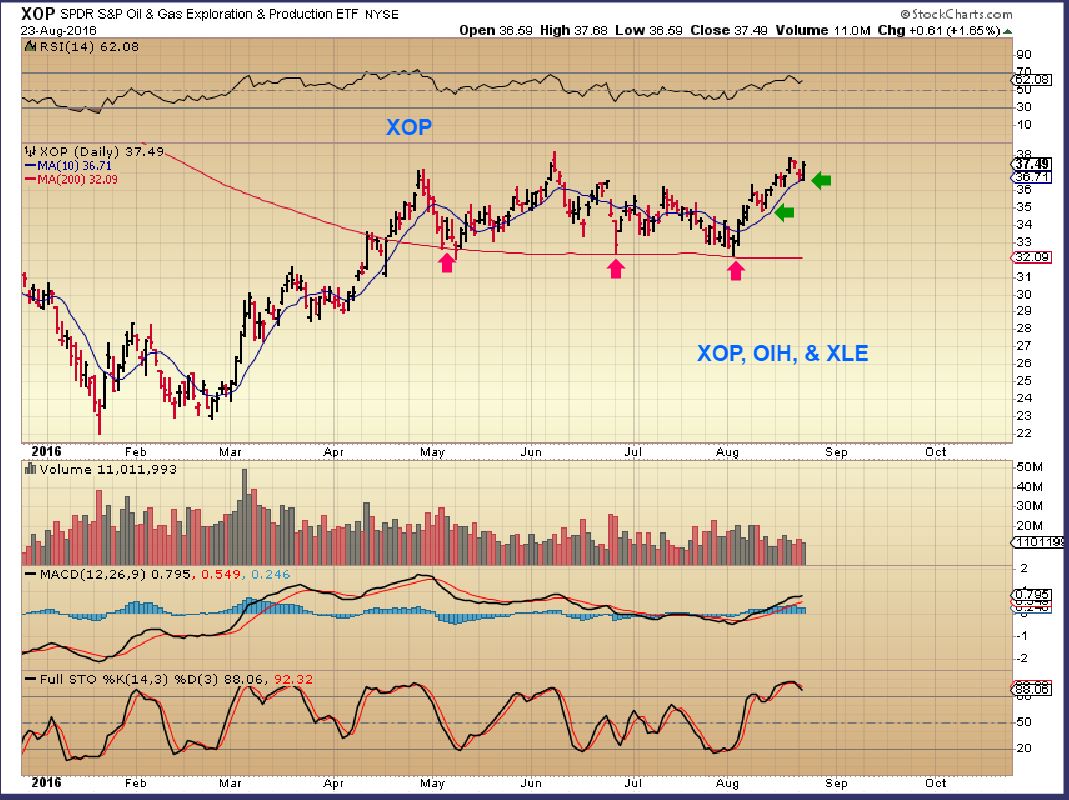
ENERGY – I am watching the XLE, XOP, OIH, OIL, etc, with the pull back recently. They remain very bullish looking charts, yet some analysts continue to call Oils run higher “just a dead cat bounce”. They missed the first run higher too. 🙁
.
XOP – This shot above the 200sma and held on like a champ when OIL sold off. This remains Bullish and looks ready to break out to new highs.
.
OIL & ENERGY STOCKS
.
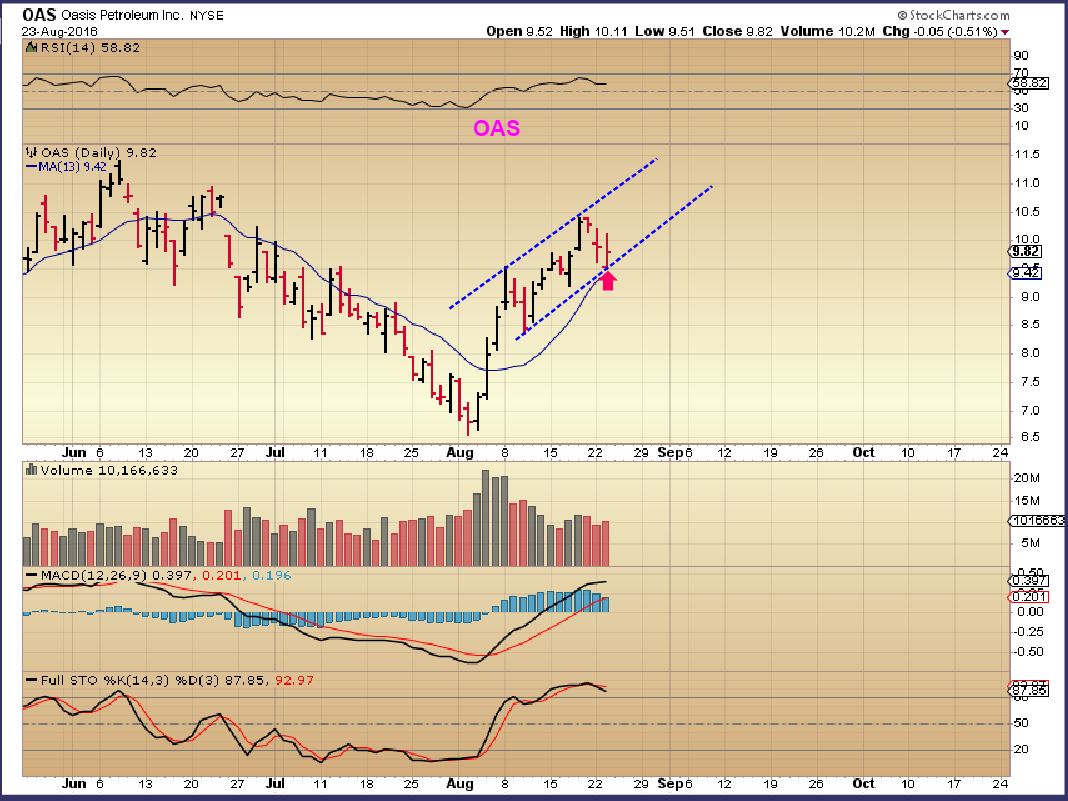
OAS – I think that Tuesday was a low risk buy. If oil starts out lower, the 10 sma may get tagged 1 more time for a buy.
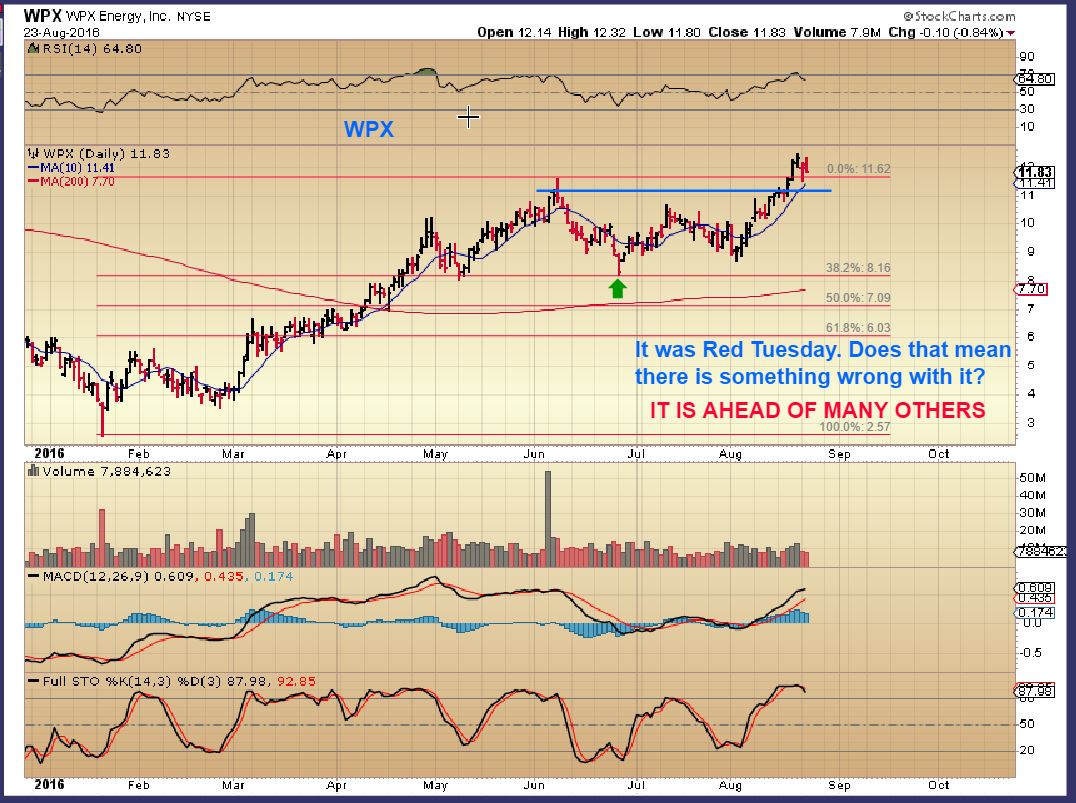
WPX – WPX is slowly selling off. THAT looks like a gift, I have also mentioned the weekly chart being bullish in past reports.
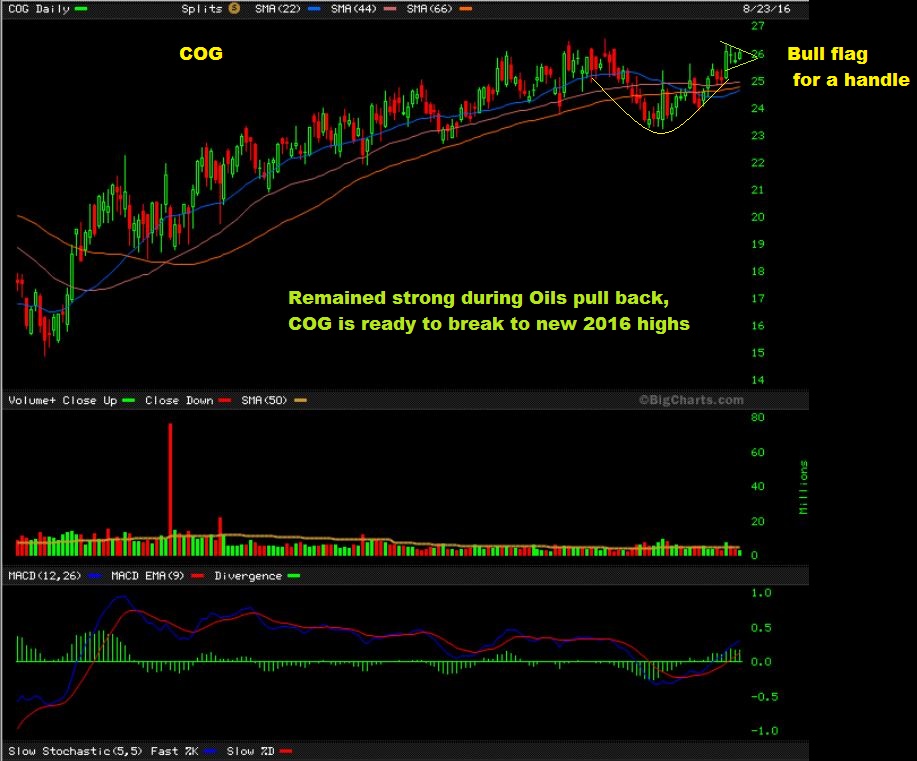
COG – BULLISH, this is also a BUY right here. I would have a stop below the $25
CHK – I mentioned buying this when it was near $5.00 and it has been a steady climber. So far It runs up, down 1 day, higher, down 1 day. If you see a down day it seems to be a buy. It held the 8 sma so far, but CHK is often a little looser than that.
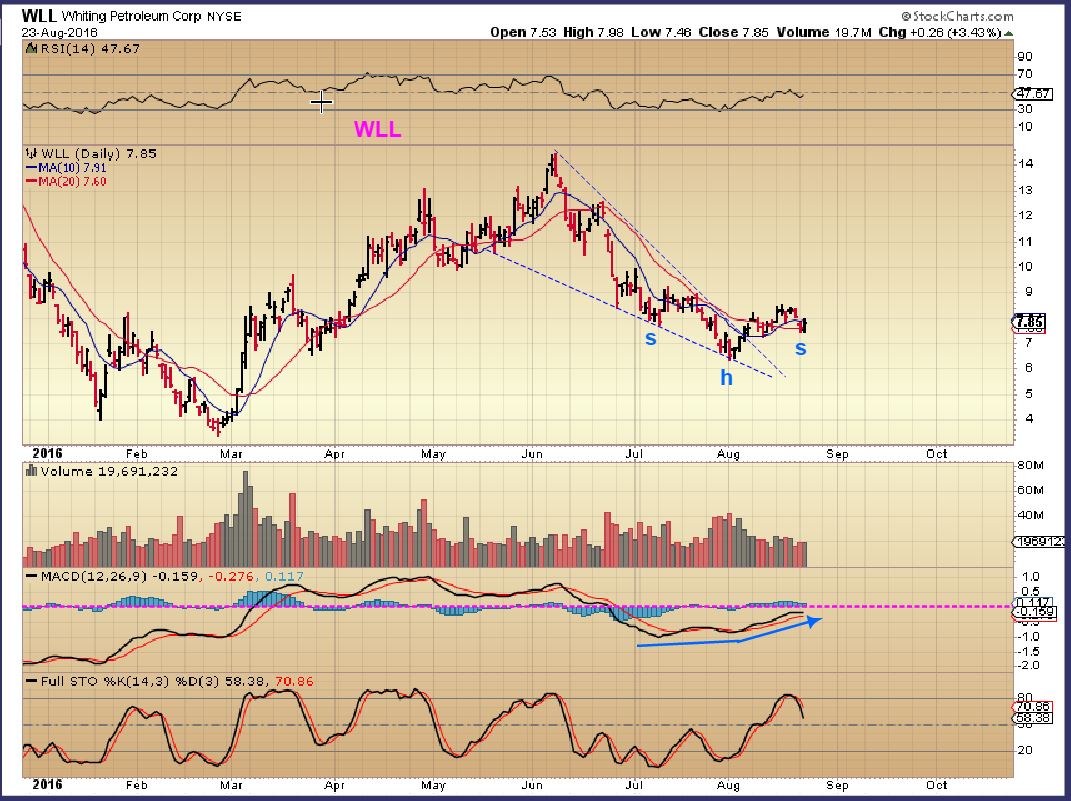
WLL – This stock hasn’t had a strong run upward over the past several days, but it did basically run from $6.50 to $8.50 & is setting up nicely. I think that it could be bought in this area as an inverse H&S
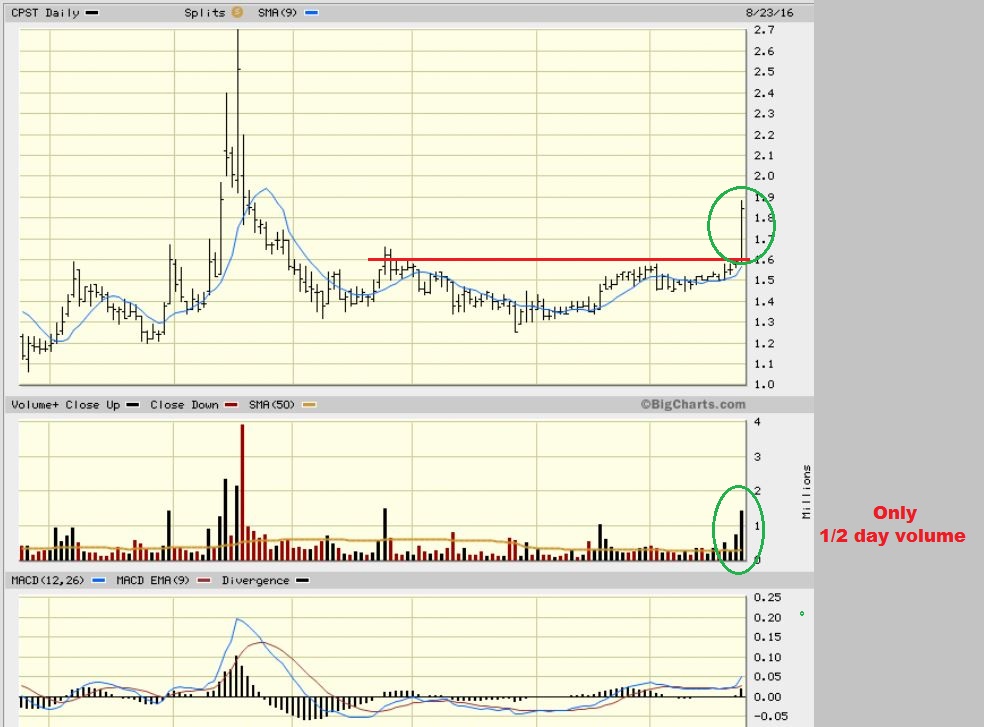
I was watching CPST ( AND SXE, LGCY, and a few others that have had long bases / consolidations). On short term charts I got a buy in CPST and entered and posted this chart in the comments real time.
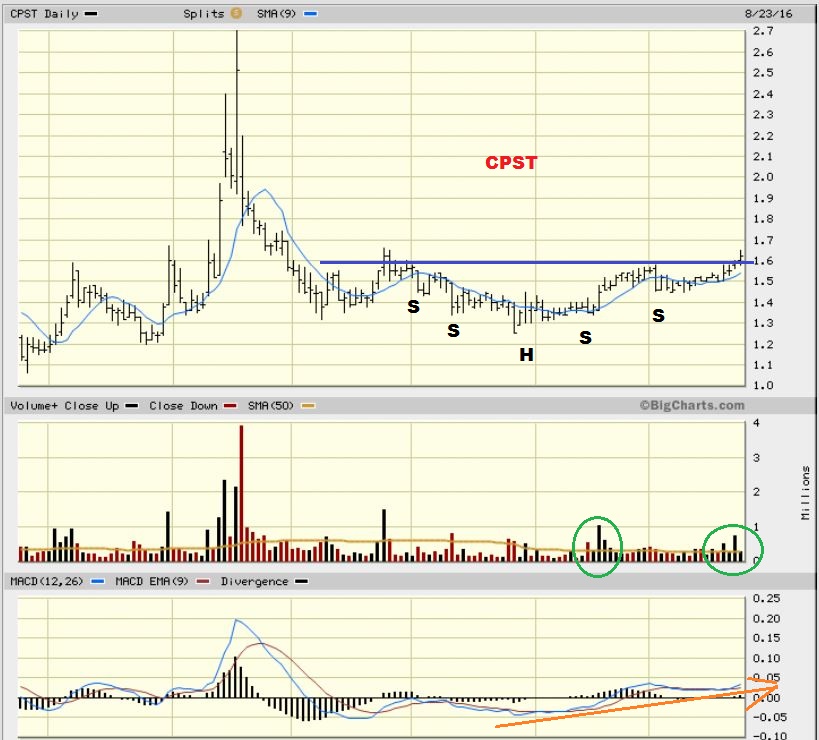
CPST almost immediately started to run higher and volume kept surging in. This actually closed with 3.6 million in volume and it ran to $1.97 intraday. If this pulls back or bull flag it may become a second buy point ( or you could take a trade in it for a 2nd strong pop higher).
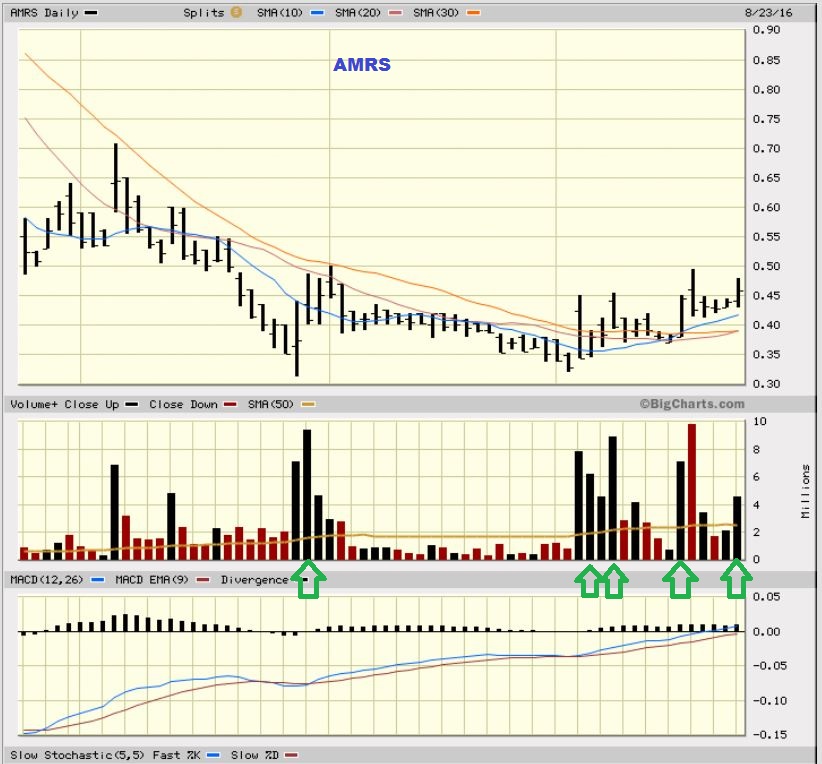
AMRS – I mentioned before that I bought this. It has a steady base and I added yesterday when I saw steady volume start coming in. I posted this in the morning.
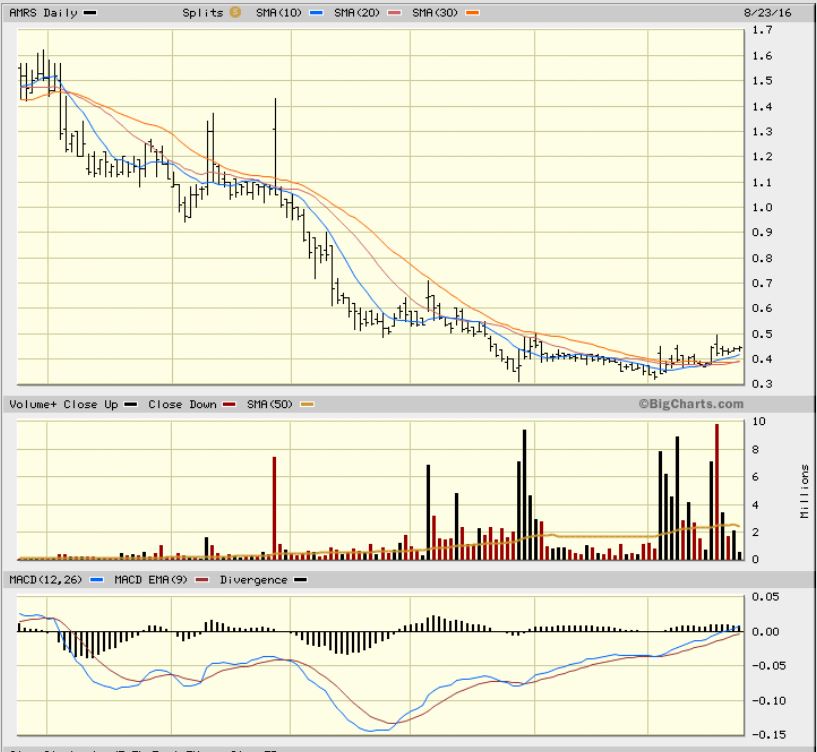
AMRS – ended the day with over 4 million in volume and has started moving higher. I just like the base.
.
SUMMARY:
.
We are still waiting for the markets to make a move out of this long consolidation. Each day it either runs higher or sells off, and then gives back the move by the close. This frustrates both longs and shorts and anyone that confidentially held a leveraged position is getting chopped up. Oil and Energy have been the best trades and the recent pause or sell down looked like a buying opportunity in many of the stocks, as shown. Oil just put in an ICL and the gradual run higher can last for months, so buying there and then buying pull backs is important and rewarding down near the lows. Precious Metals are also choppy, volatile, and pretty much directionless. I am waiting for a dcl, but as time goes forward, I’m thinking that it could be lack luster and just a shorter term trade for those that buy it. Time will tell when we finally start to move higher for more than a day or two. Metals stocks like CLF, AA, CENX, AKS, VALE, SID, etc look to be shaping up, but most gave up gains after running higher Tuesday morning. AKS broke down a bit more than I think it should have, so I am just watching this area, I am not buying anything. Enjoy your Wednesday trading, but energy stocks if they are acting well above support as shown in the examples above, and MAYBE Fridays speech by Janet Yellen will cause a reaction low in Gold, Silver, and Miners. It also may get a directional move in the general markets and clear things up a bit. As always, thanks for being here at Chartfreak!
.
~ALEX
.


has MUX gone down too much to be a good candidate for a buy ?
No, but I dont see it giving me a reason to buy it yet. When we have a dcl, it may be a good candidate for a trade.
Thank you Alex. Good stuff!
Thx Johnny : )
URRE up big premarket
Yipeee!! Green again after all this time!
URRE acquired first lithium property in nevada.
Alex, BAA still a hold?
Hi Steven
For the long term, yes. It is a long huge base on a 3 year weekly chart. Short term, Miners will experience choppiness in this sideways consolidation.
I think we are searching out a dcl right now, and may get the lows near Fridays Yellen speech at Jackson Hole.
Thanks boobala
Ur welcome…Is this Stephen?
rockn report (again) boobie
Thanks Michelle
Michelle?
Yes, with the v though, not ph
My timing on NUGT was awful Yesterday. I got out after a small loss. Looking at NUGT now, we have made a Bullish Bat Harmonic pattern. If the selling stops we could expect a 50% retrace to $151 area. If we continue lower, I’ll look for a double bottom @ $117. Anything below that has serious damage to this Bull. F5
Well, $117 didn’t exactly hold today. Most oversold for GDX yet this calendar. This next ICL should be a pretty awesome buy point.
GDX and XAU HUI breaking important trend lines; GDXJ safe for now
Thinking Alex’s call for a bounce lower high and this morphing into a ICL will be right on.
Some oil stocks hanging tough with oil down again today.
CRYSTAL?
Did you buy any of those dips in BREW?
I think it hit all time highs today 🙂
BB Crash in both GDX and Silver…..
whew …
Definitely in a wave 2 Correction now in PM’s …….. just Not sure if this is a down or c down ? I am leaning towards c down at the moment.
I did add a bit to my SLV Calls today…….
lean a down
I am sure Janet will let us know on Friday……. 😉
Could provide a rally and then wave c down
Yep….agree
My next add will be at the 38% SLV Fib level.
show me please… 😉
a weekly close below this channel will be the nail in the coffin.
that’s GDX weekly, btw…
.. and don’t forget … f5 !
There’s the $1.57 I was looking for yesterday in PGH, unfortunately I think even lower prices may be in store now,
Watching UUP and this usd run looks anemic. I would be surprised if it pushed much higher.
That would be a good thing……
If you look at UUP and visulaize what it would look like if it was not for the brexit bump in June, it would have printed a lower low on 8/18/16. My guess is that after a very weak rally here it will head lower.
Will the SPY follow this miner move?
EXK pain point today. I did lighten up at the top. Buy the dip?
A trade yeah but way too early to rebuild core if that’s what you mean.
Wow this is a major significant event today in miners. Can’t wait to hear what Alex has to say about it.
feels like trend change and check mate for a bit. what I love about alex is his analysis is very clear and he always seems to be early with his reads so that if one is off sides its poor risk/trading. these EW cats just adjust counts and back track and claim victory. Everyone got the move off the jan lows but not many have traded the cycles like alex. well done sir.
Possubly Going long for ctash trade bounce GDX 27.50 area,
Fell right through it,, $27.20 maybe ? Lol
Not a chance, selling getting stronger taking out all the stops but sure seems like capitulation/climax sell at some point, only miner I’m carrying is TGD core so not hurting too much, unlike my energy holds, lol
Oil trying to make stand here , even though I’ve got lower targets may take trade here if it shows strength out,
I was going to buy today but decided to hold off.
Yeah, I let pass quite a few stocks I would have considered bargains at these prices but I was waiting to see if the 10d ma held and also kind of expected OIL to see around $45.50 actually give or take .30 and since im already way overweight energy, I didn’t add today, may regret it tomorrow though. But I may add on a swing low reversal tomorrow if we get one.
Same tomorrow. I’m content to buy higher tomorrow if it’s safer.
Looking for BTE $4.90-$4.95 buy point, easy stops,
Hey All – Just checking in after lunch and a quick update.
What we are seeing is one of our possible expectations in the weekend report playing out. I grabbed the chart from the weekend report and only added 2 updates to the chart, the price of the last DCL and a circle where we are now. IF THE LOWS OF THE LAST DCL GET BROKEN, that confirms to me that we will seek out an ICL , possibly in Sept after 1 more daily cycle. IT is a scenario that we visited and seems to be playing out here.
.
REFRESH for the chart from the weekend report explaining what I think we are seeing. I have added an explanation off of the chart on the right. Click the chart to enlarge. I will explain more in the nightly report, but this should help for now. We still might find the dcl on Fridays Jackson Hole meeting.
.
.
now at 27.39
I can see that happening……although I would hate to see the 200 sma broken AND/OR the May ICL low broken.
That’s a hell of a drop to 200day and May low. We need a higher low for sure.
In that case Alex, it would seem that there were two surprises, the shortness of the daily cycles lately and the shortness of the proposed intermediate cycle that may follow in September?
I was thinking the same thing…short cycle? I wasn’t prepared for this big of a drop in GDX right now….some drop yes…but….?
now oil stocks joining the miners party down
Since GDX took out the 27.44 low I am leaning more towards this drop is a wave a in a wave 2 correction.
What kind of magnitude? A quick two or a Major 2 (with subdivisions of course) that will make its way to next ICL. I ask bc that informs the amount of time for the move. 🙂
Alex are you adding oil stocks on their dip?
GLD and gold are only down about 1% – so I’m not sure what all the panic is other than a lot of stops getting hit.
Wondering if it’s folks switching out of JNUG into UGAZ?
Jackson Hoke and Yellen Yellin’!
trq must be in strong hands – they didn’t flinch today
I think it is just a “Death Grip”; sort of like prying a gun out of Charlton Heston’s hands, from a famous speech on the Second amendment. They wanted to sell TRQ but alphabetically it was just at the end of the long list!
LOL
Ooh. NOo. not good. Came home after a beautiful day in the neighborhood of Misses Rodgers: took a look at my account: and said the F-word about 5 times in a row 🙁
Yeah.
This is me today!!! https://m.youtube.com/watch?v=8WO6_IiZ_WI
hahah… yeah … crappy day..
Red is definitely not my favorite color ; ^P
much more ‘fun’ when it’s all green and hoppin .. right? giggle
See above Tonto for the GDX Count……I am here to please 😉
ooophhh .. meeeOwww
thank u dear …. 😉
I’ve always missed the boat by not being patient. I can’t keep selling for losses so will hold on for dear life!
Not bad. More like 6 here. No, really I went to about 50% cash in my IRA trading account, miners have been asking for this besting recently. Strength just hasn’t been there. I got thumped in energy as well!
GDX Count.
Huge BB Crash…..
38% Fib. Retracement not uncommon at all in a bull market.
Hope so Ken, I took the crash trade at $27.17,,seems a bit climactic today so hoping for a decent bounce with tight stops,
I did also……. 🙂
do you have a target in mind?
I would like to see 30.73 hit again then c wave down…….into Alex’s ICL…..then ADD again into 1/18 Calls.
Off the cuff I was think $29.50-$30 so we’re close although I like yours better , nugt may look appealing here for a bounce as well if gold reverses tonight or tomorrow. I’d be a buyer on a dip to $100
Yep…….although I dont play the 3x etf,s I perfer Options ….. I am thinking a Stop run today.
If we ID the next ICL, I’ll be loaded up on options for sure!
looks to be an impulse move though, no?
a back test of the 50sma may be as much as we get.
btw.. where you talking about a 38% retrace of the whole bull move so far?
A Stop Run move imo…… lol
Yes 38% based on the Jan. 2016 low……since I am trading SLV and GDX Leaps that is my preference for when to Add.
hope you’re right kennyboy 🙂
Looking forward to it SOG …… should be a fun ride !!! 🙂
Yeah, I couldn’t help it. I bought NUGT late day, avg about $108. Nothing long term, just a reaction back to norm maybe.
This is pre-Jackson Hole stupidity. Like Alex, wouldn’t be surprised to see a turn around Friday.
Man, I had to go back to July 2015 to find a BB crash of that magnitude!!!!
with gold hardly moving today I wouldn’t be surprised to see the fix at the same price it started the day. In any event it is just trading in the same range it has been in for months.
There was heavy selling in miners and all miner related funds, leveraged and not. Lots of technical stops just blew right through. Definately change of character over last few months.
Should I be shopping today?….Today seems pivotal.
Those trend lines in the gold miners (HUI, GDX and XAU) were important. We saw stops getting hit hard today.
I sold Friday. 🙁 🙁 🙁
WTF!!!
Received a daily buy signal on volatility today. Should start getting choppy and then drop. We’ll see Playing the short side during this seasonal rough period on spx and vix Next ICL in gold will be awesome. October is possible suggestion it lines up on some cycles. CF has been warning us on caution in this daily cycle. I took it as a serious note to play close to the vest. Trailing stops took me out some time ago. Cash is king for me until the next safe entry in gold / gold stocks. Much higher prices to come down the road but I don’t have the stomach to sit in the house of pain very long.
Yeah, I cut all non-core positions last week. Glad I got out of all newer positions. I’d be significantly underwater if I had not.
Bullish volatility, eh? You think it will take energy down with it? I’m pretty heavy right now so a SPY Wipeout could really hurt.
If I go buy DUST and SCO then everyone will be just fine – because oil and gold will then go up. 🙂 Then I would expect some steak dinners from all the money you guys would make. :):)
Deal!! 🙂
My energy stocks were all red today, anywhere between .08% to 4.5%. My one other stock (GHL) was also down half a percentage point. “Who floated the meatballs??” However, when I look at the WTIC chart, it’s not that bad. Looks like the 10sma held, and there’s a few key supports still in place–38 fib, 20 & 50sma. Probably more. So while I’m not worried, I am also not impressed enough with the picture to add here. Anyone add to energy today? *bort*
Also, talk about a giant meat BoWl, this is the largest number I’ve seen (not saying much) for GDX. Huge!
So….I’m analyzing some of the oil and gold stocks and what percentage they have fallen in the past week – do you think the ones that fell the MOST will go up the most when things turn? Or the ones that didn’t fall as much will be stronger and go up more? Just wondering – making a potential list to jump back into when the time comes and would sure like to jump on the ones with the best potential…. 🙂 🙂 Or maybe it’s just looking at each chart set up at the time? For example, OAS has fallen about 9.8% while ECA fell about 5% in the same time frame…..I feel ECA is definitely the stronger stock and in better financial position – but….?
OAS seems more bouncy to me. If you look at the movement since the beginning of August till now, OAS started lower, peaked higher, and fell more in the past few days. Based just on that “character,” I’d guess OAS will move more on a percentage basis. Of course, I’m invested in OAS and not ECA, so I’m biased.