
Just A Minute
Fed Minutes are released today. We have seen a few sideways moves in various sectors, maybe this will be a catalyst for a directional move.
.
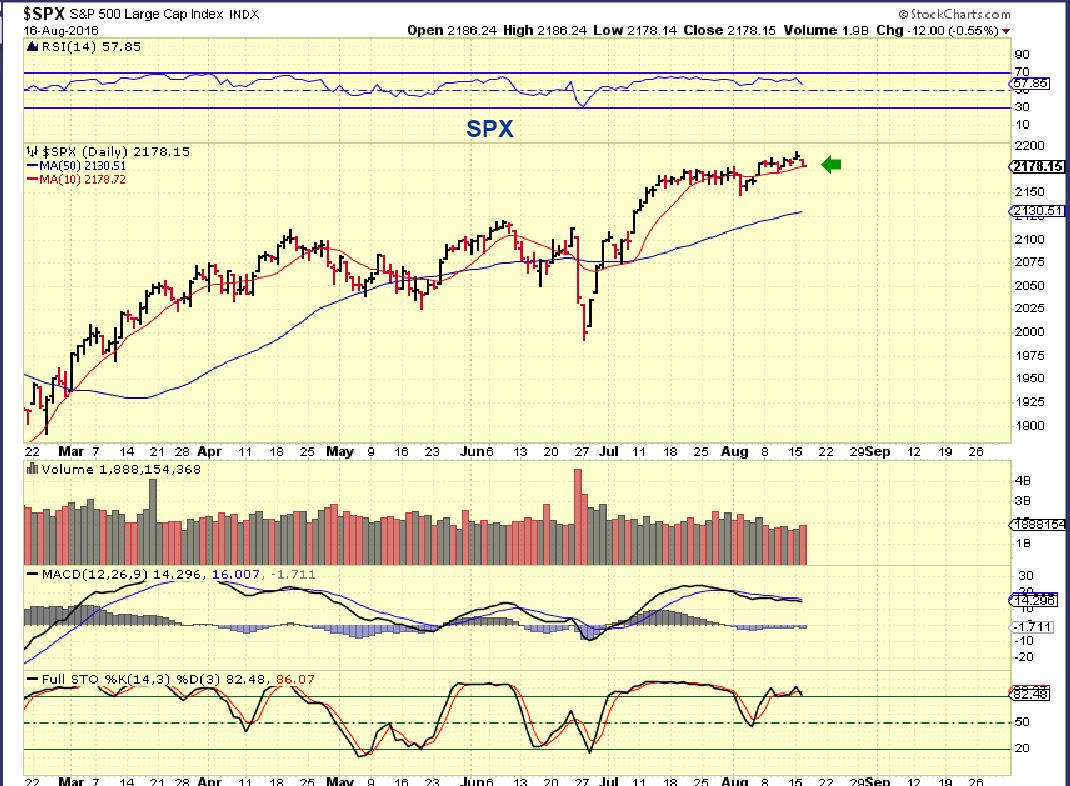
SPX – If you re not long or short, don’t jump the gun. After a long consolidation, the move can be prolonged, and I have actually been expecting a dip into a dcl. I dont think that the early Aug dip on day 25 was enough.
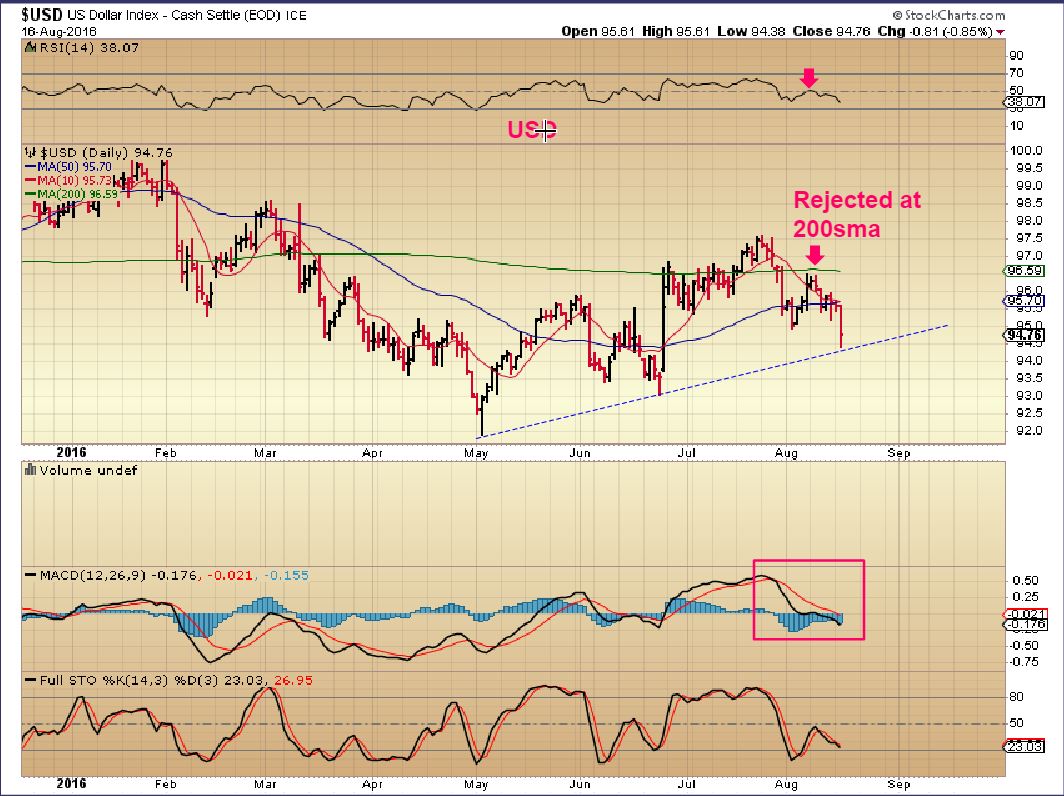
USD – That was quite a dip. The USD was rejected at the 200sma. Notice how May through June took on the exact shape as July through Aug. If they are the same, that was a fake break down yesterday.
WTIC – Yesterday I mentioned that I thought that OIL could push right through that resistance of the 50sma, and posted this …
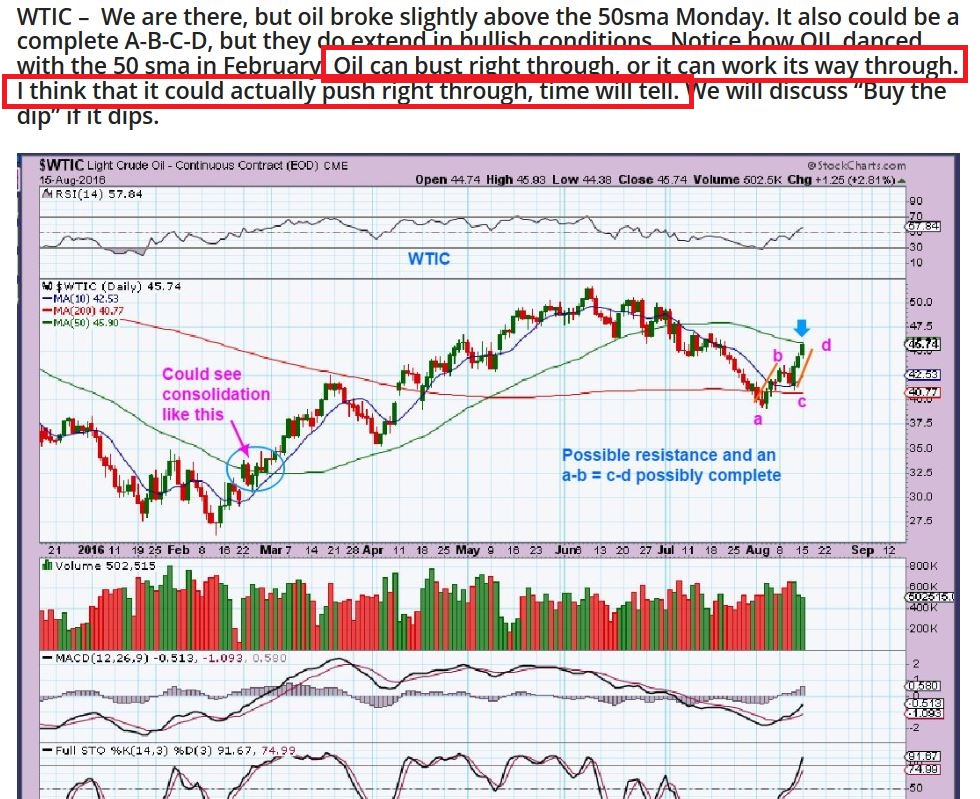
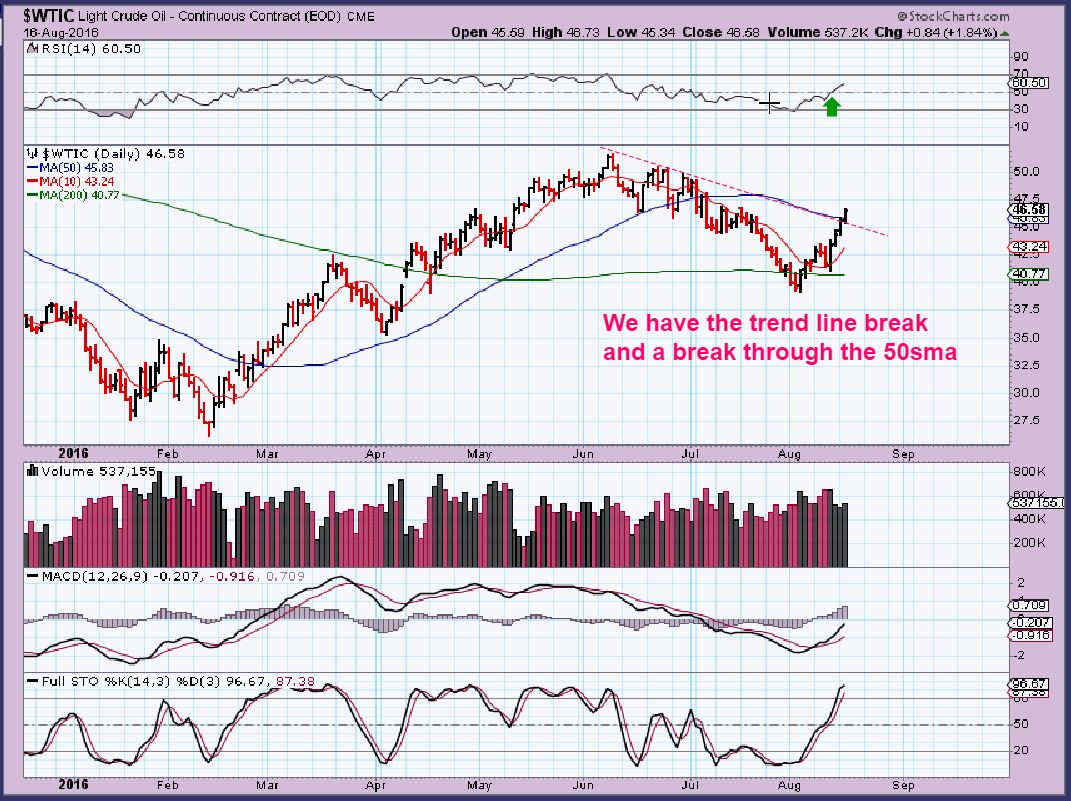
Oil Pushed through and also broke above a down trend line. That is bullish for the longer term trading.
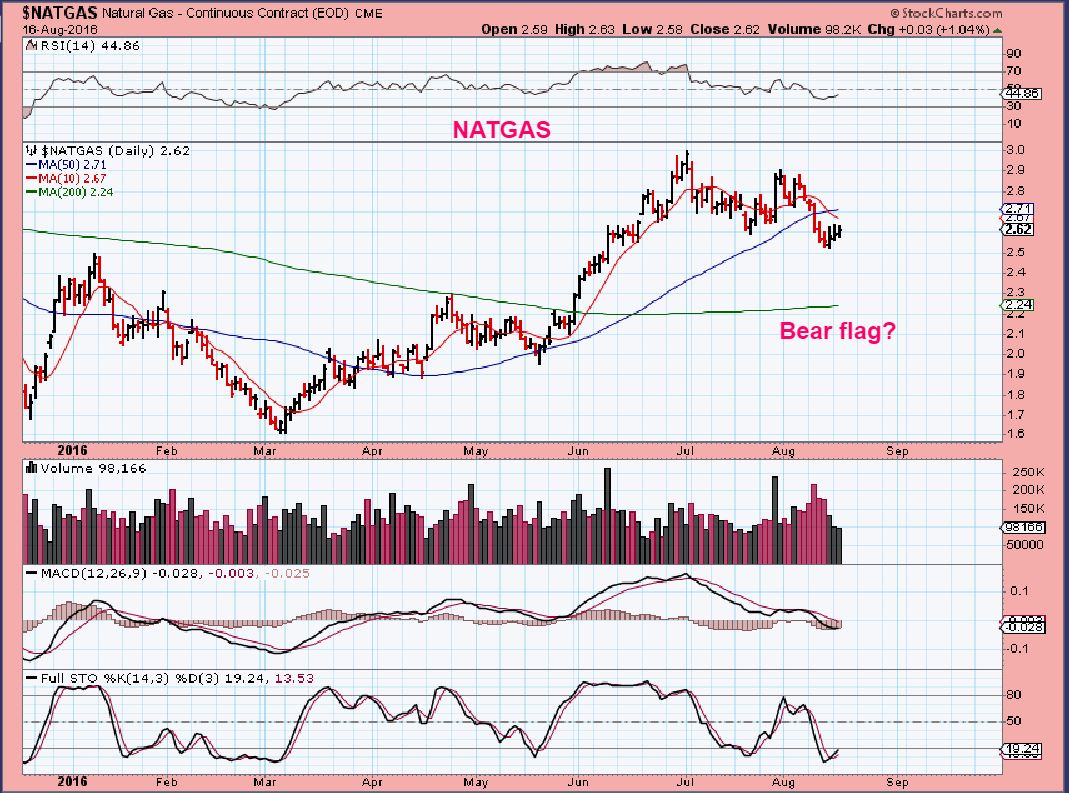
NATGAS – This still looks like a possible Bear Flag and has not taken out resistance.
.
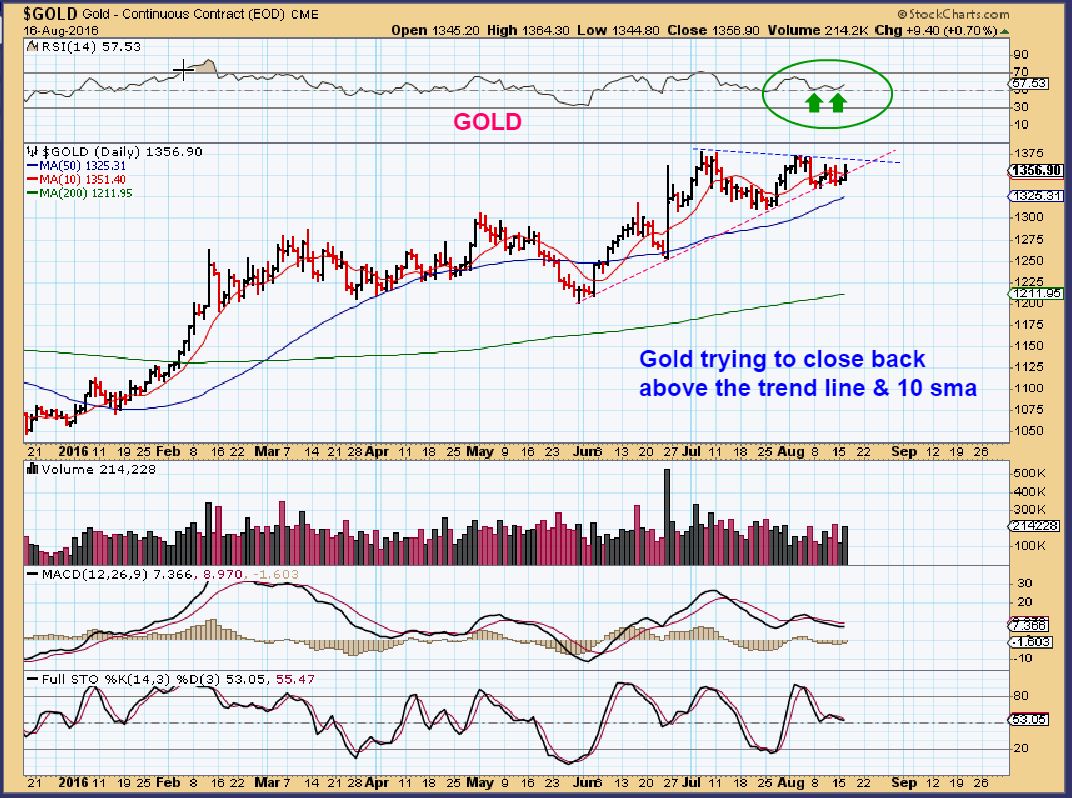
GOLD – The weakness that I was noting is easing. Look at the RSI. Can the release of the FED MINUTES give Gold a boost at this point? Yes. On day 16, a push to new highs would be great, and this consolidation could be a bullish set up now. We should break to new highs , since the last Daily cycle was R.T., so let’s see what the Fed Minutes can do.
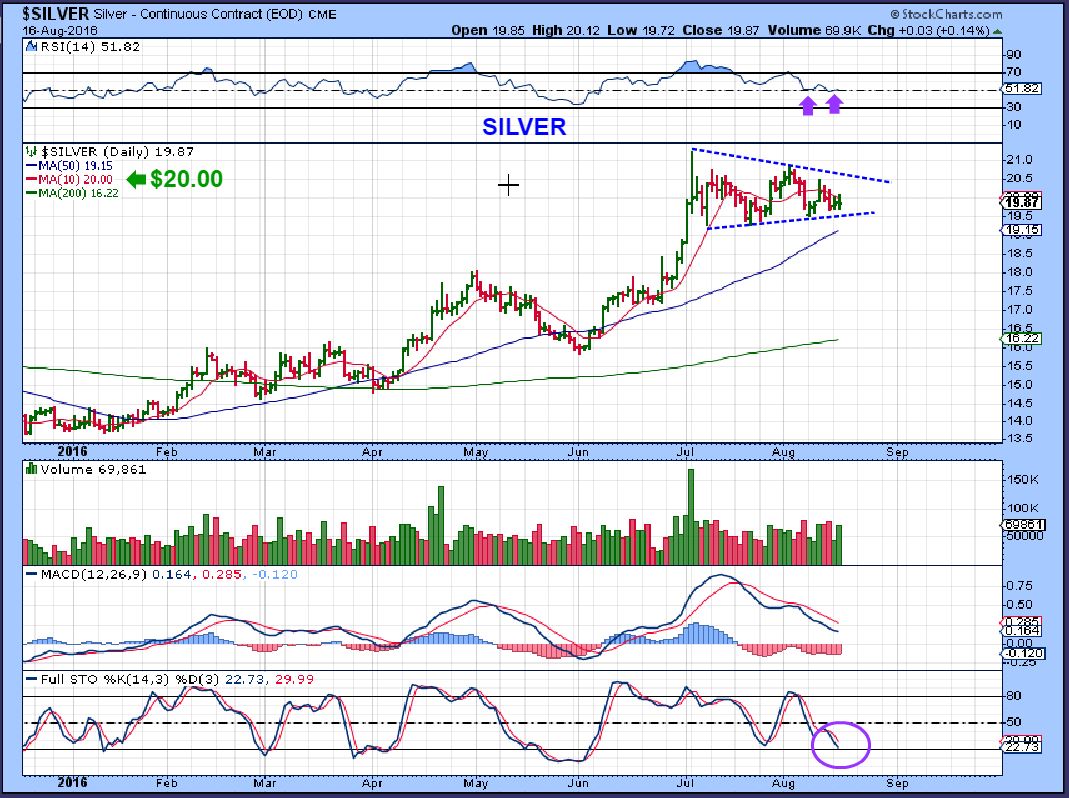
SILVER – Silver has worked its way over to the 50sma with the passing of time.
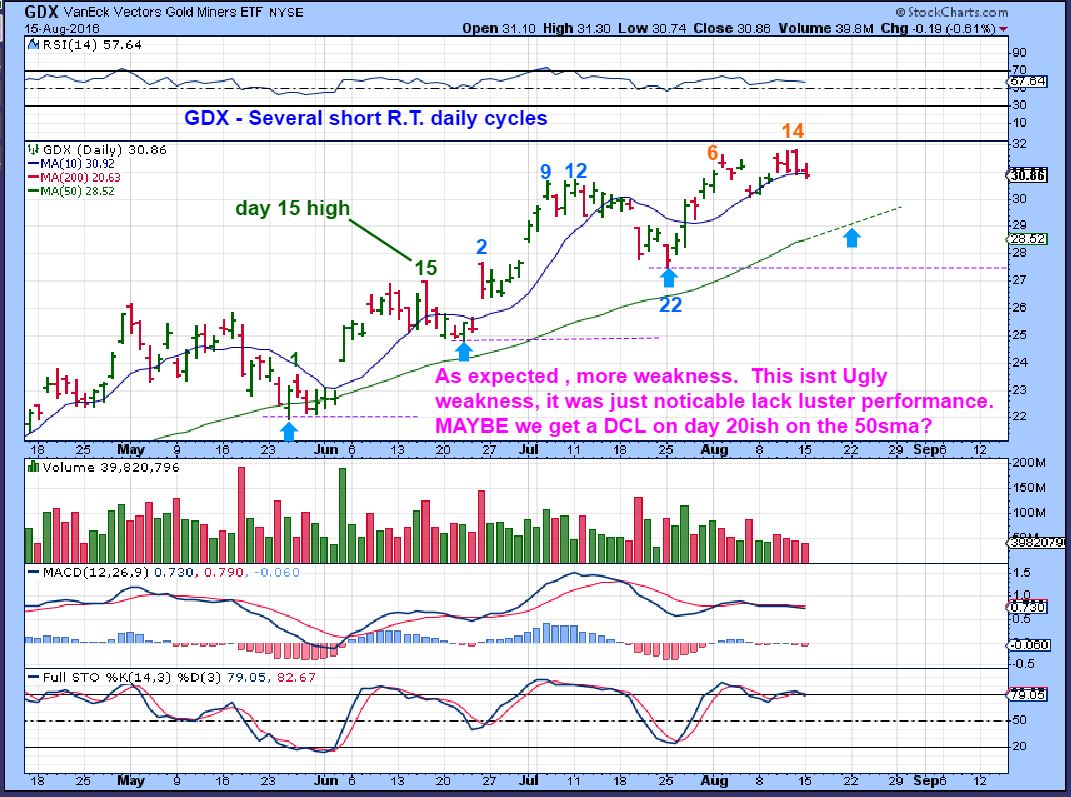
MINERS barely changed,and this is from Monday. It too could go either way.
Summary: The release of the Fed Minutes could send some of these consolidations into a directional move. Will the SPX drop into a dcl, or break out and run higher from this consolidation? Time will tell. For now I am Bullish on Oil & Energy stocks. In the past, we have seen a small pullback as oil works around the 50sma, but this set up looked rather strong and I was thinking that it would just leave people behind. We’ll see if Oil inventories can slow it down. If you listened to the Kyle Bass interview on energy, he said some interesting things about the Oil inventories and out put slowing down. He is a smart man, and I enjoy his interviews. Precious Metals showed weakness last week, and I mentioned the possibility of volatility and lack of a break higher short term, based on what I was seeing. I also mentioned that consolidation can repair the weakness, and we may be seeing that now that over a week has passed. I also used a lot of 2008-2010 charts to show how this type of sideways chop and volatility can be difficult with leverage.
Lets just see what the Fed Minutes can do, if anything.
.
~ALEX
.
SO let me just review a few trade ideas already in progress or setting up. There are many, a few are good until we get past the Fed Minutes. I have mentioned the 50/50 set up in precious metals, and the Fed Minute release may push it one way or the other, so I am only going to mention that some Miners look bullish.
.
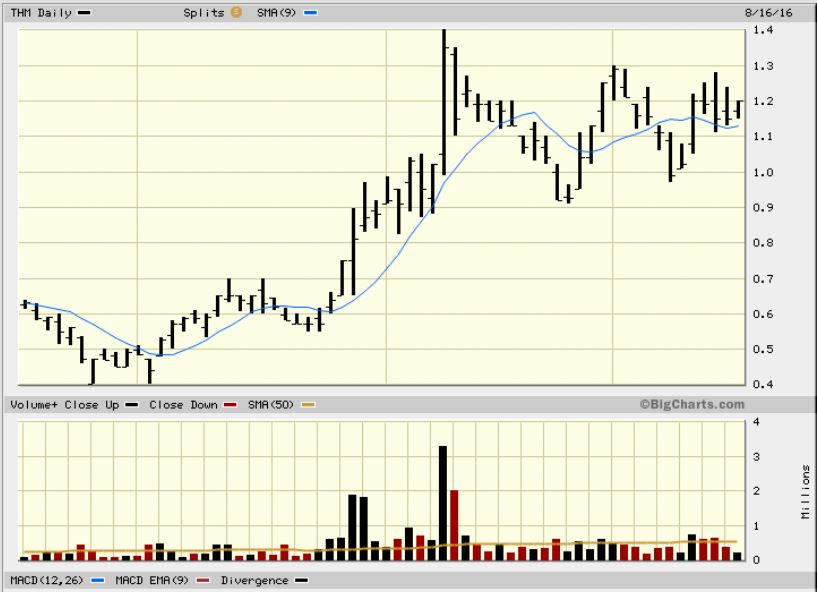
THM – Among others, this looks bullish at this point. XRA had a similar look last week, and now it looks more like a double top, so I remain cautious in this area until the Fed Minutes come out.
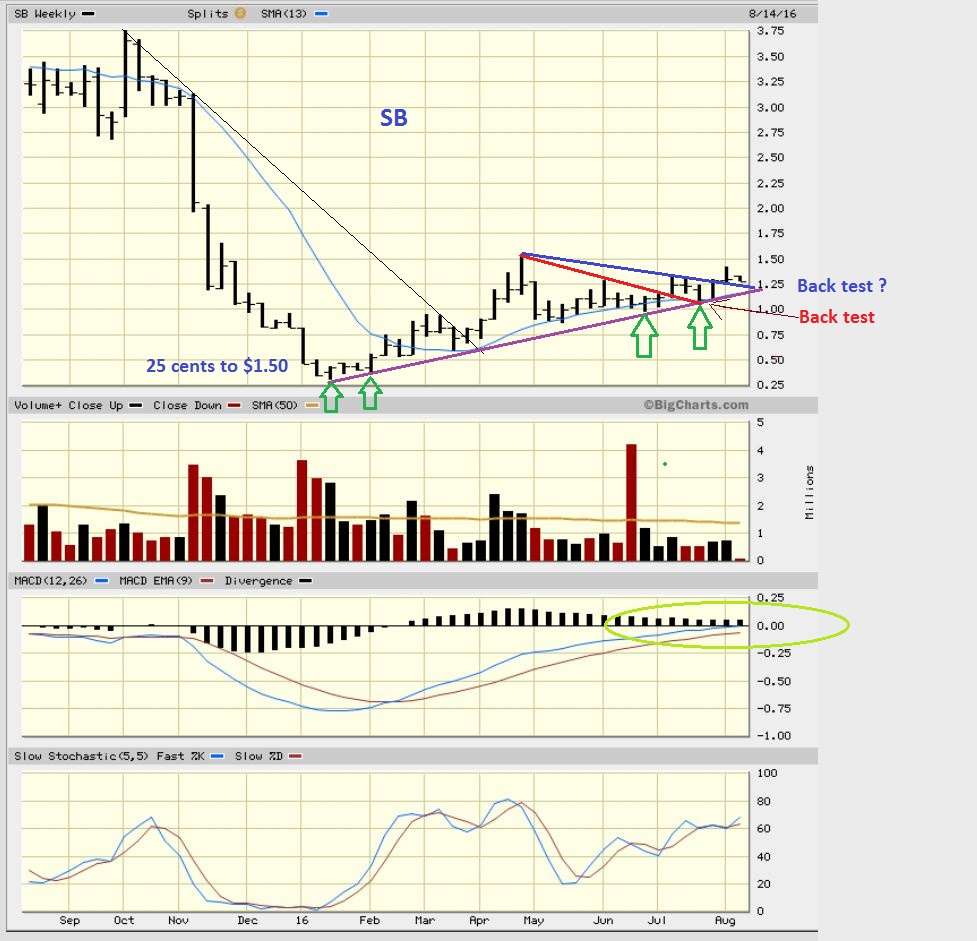
I was asked if SD was “Still O.K.?” It is in an uptrend, has run from 25 cents to $1.50 and is a lot closer to the highs than the lows. It looks like a break out & back test. Use the lower trend line as your guide.
Immediately after a bear market sell off, when I am buying a bottom, I buy all bullish looking set ups, because there is usually massive short covering and the companies aren’t really close to bankruptcy yet. They have acquired debt, but often have cash on hand too. When you get the initial 6 month run higher and pullback, the true condition of a company comes into play as possible future struggles come to light. At this point I look for those that held up a bit better. I do still also play the occasion possible break out of a Base, or other possible short term bullish set ups, because I am a trader.
I have been looking for stocks that look healthy at this point a bit more than the low priced ones for that reason. I already traded OAS and I Bought and still own ERF, BTE and LGCY. LGCY is more of a consolidation base, and I will let it go if it doesn’t run soon or breaks down.
.
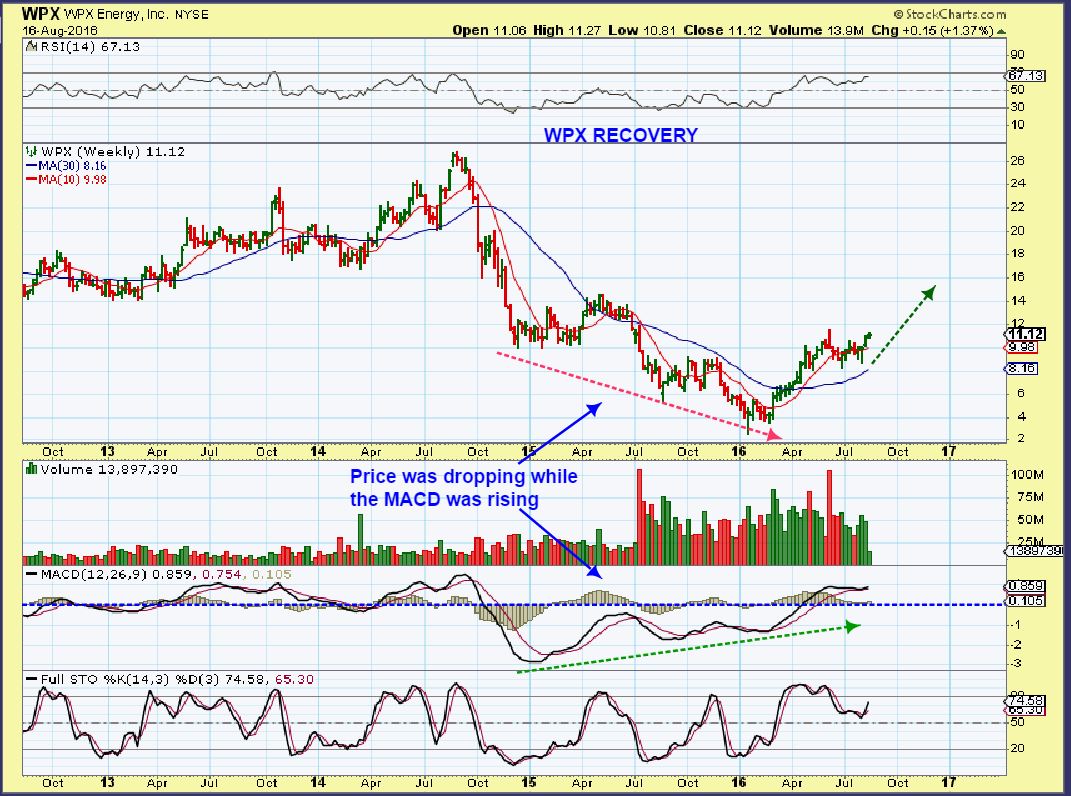
WPX – A nice shallow pullback as Oil sold off, WPX was back near the highs with Oil still in low $40’s. The RSI is near 70 already, I see this as a stronger chart.
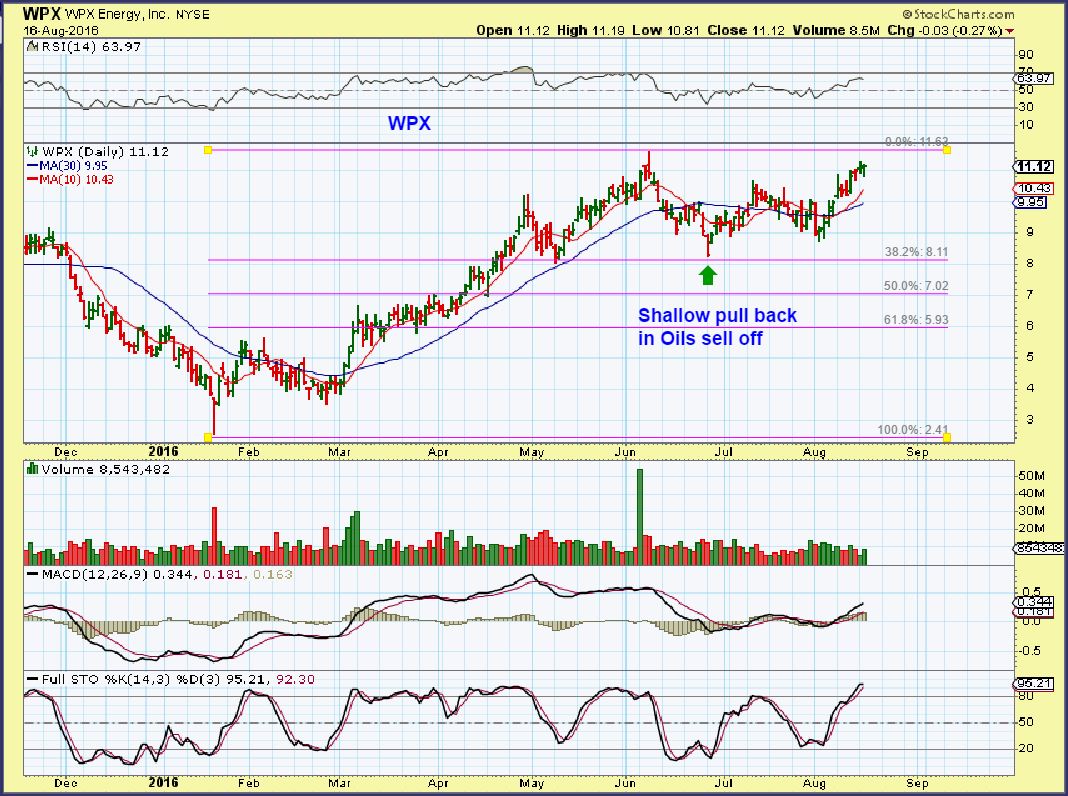
WPX – Bullish consolidation. If Oil is going to run higher for weeks, even months, this can too.
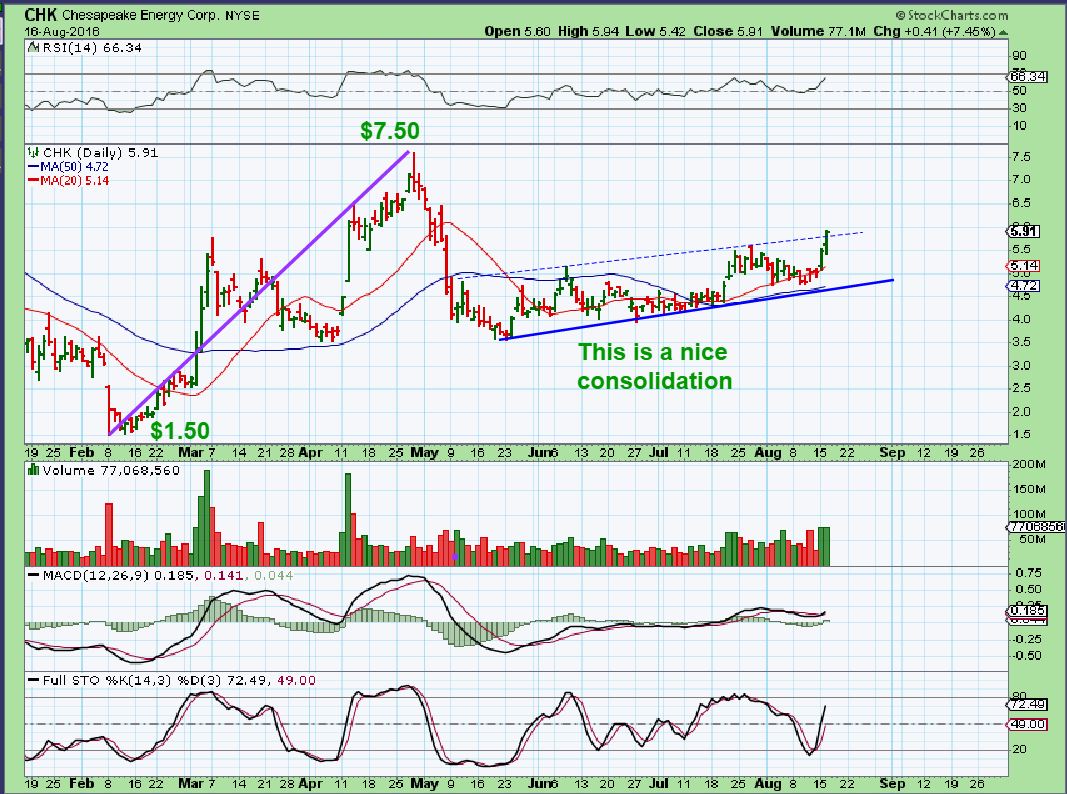
CHK – There has been some good news for CHK, and it is starting to show in the charts. I bought CHK Monday and Tuesday and I do plan on holding at least to recent highs of $7.50. I think it wants to run there sooner than later, forming a giant cup.
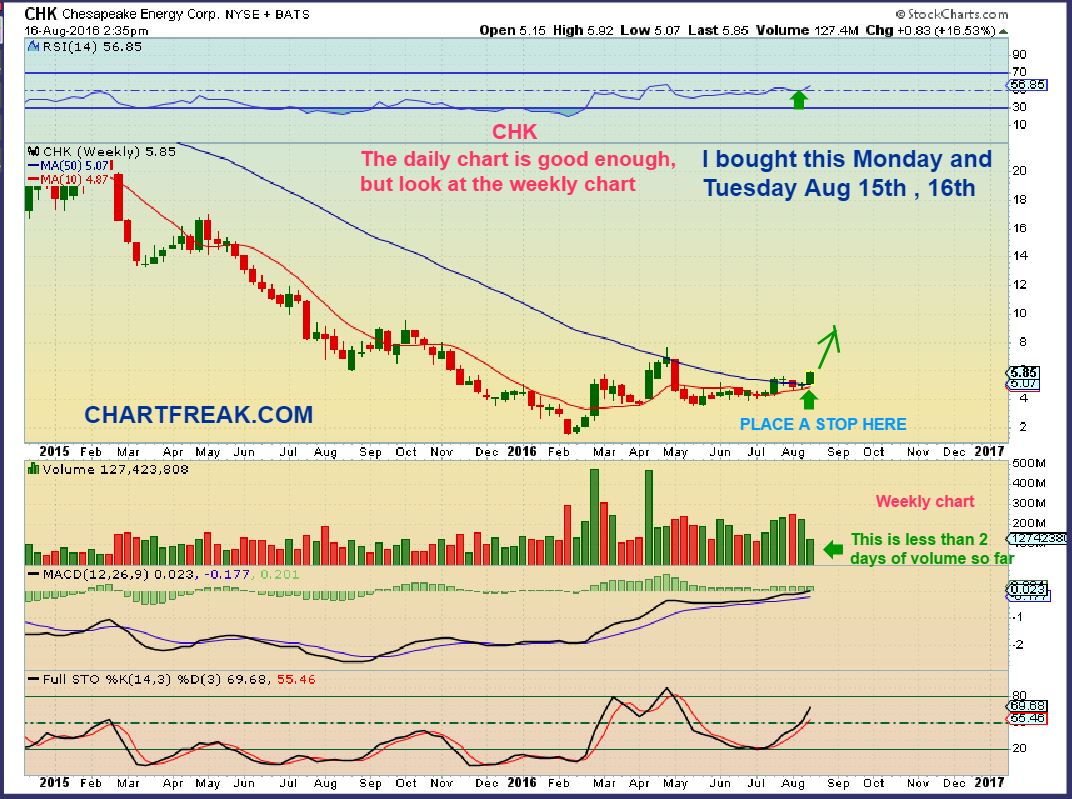
CHK WKLY – This is just breaking out now according to the weekly chart and this has very nice potential if Energy is in a recovery phase.
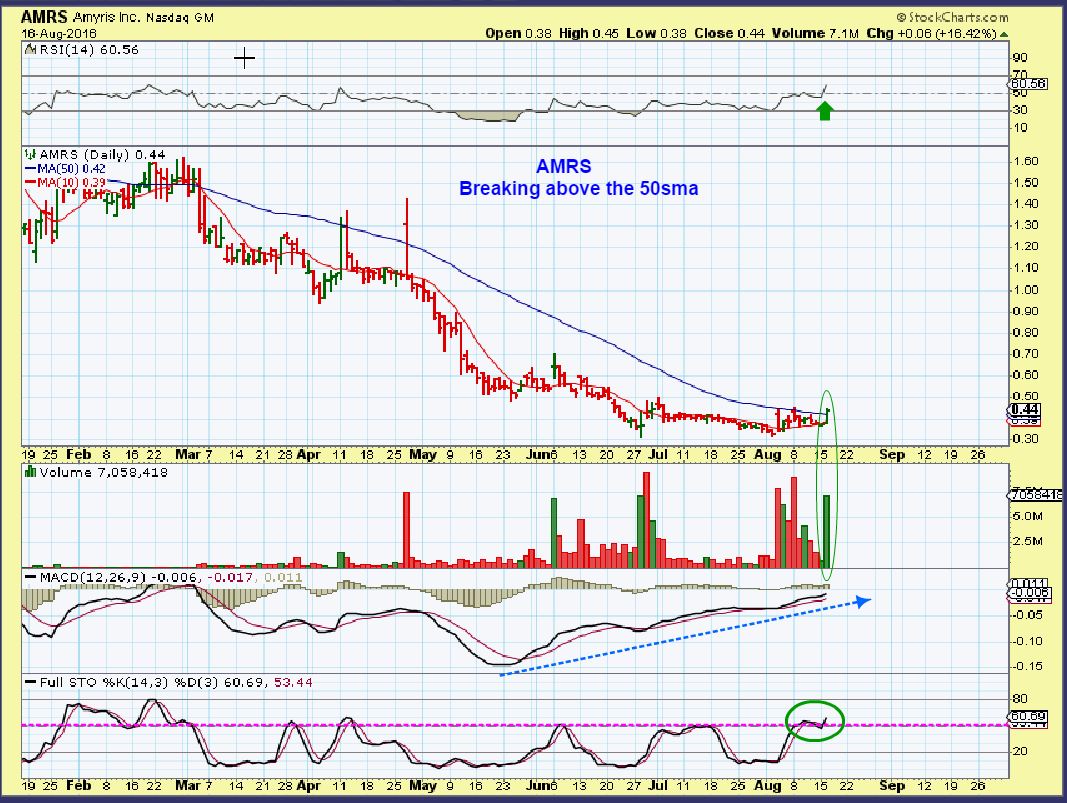
AMRS – This is more of the “Gut Feel” buy, and I bought it yesterday. Earnings are behind us as of Aug 4th. It has a nice base, it is breaking above the 50sma with strong volume, etc. etc. When I take a trade like this, it may be that I only hold as long as it stays above that 50sma and performs as expected. It is a NASDAQ stock and will likely require that AMRS trade above $1 soon, so they could receive a threat of delisting and then they get a deadline to act upon it, so there is risk. I have read a lot of news that they’ve been signing new contracts at a record pace, and will post earnings below on the link. It was mixed with good and bad (improving at least). Could be risky, I like the chart.
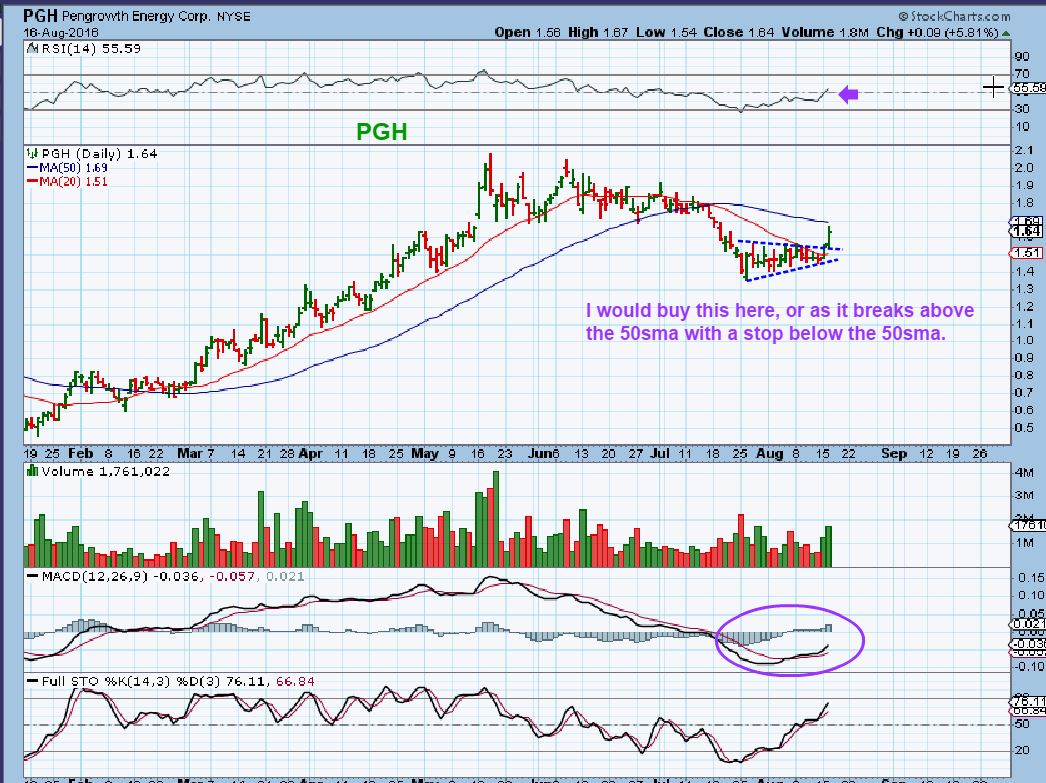
PGH – I did not have this energy company on my watch list, Robert mentioned it yesterday , so I decided to look at the chart. I love this chart and the long term chart. It was climbing higher in a very orderly fashion, and that can be Bullish in many ways. The recent sell off in OIL did take it down well below the 50sma, but it is about to attempt a recovery. The MACD is still below the zero line, but in many ways, I really like this set up for future gains.


Thank you Alex. Great work!
Thx Johnny. Just so you know, I did get your email the other day, I have a bout 20 that I need to still reply to. It was a busy weekend and I’m still playing catch up.
No biggy. There just seems to be so much question as to the placement of recent dcls that I just request the last 4 for $GOLD for my own reference. Anytime you get around to it is fine, thanks.
thanks & good morning Alex!, your $Natgas text description says Bull flag, comment on chart says Bear Flag. I think Bear flag is right?
Oh sorry, yes, Bear flag. I just fixed it, thanks for pointing it out so I could fix it and others would understand too.
I’m trying to remember who said nat gas looked like a bear flag last night. Hmmm….who was that smart guy?
Alex, recent;y you said you liked the charts of CPE, BTE and ECA. What are your thoughts now?
Hi Bill, yes I do, and ERF , RICE and a few others that really have a bullish look to them too. I own and have accumulated a bit more of BTE too. BTE weekly chart is what really looks good.
Since I posted the charts of ERF, CPE, ECA and RICE, they have acted correctly for break out and run candidates.
CPE & ECA need to be bought on pull back, because they are a bit extended at this point.
Bear Flag on the US Dollar 2hr chart. Should take it down close to $94. Then we will get a rally.
Hmm.. Alex, look at MCEP. I’ve been doing research into horizontal vs conventional vertical drilling since my recent vacation and wish I had come across this stock a month ago! MCEP from what I know does almost all of their drilling in the conventional way— which not only is less expensive than fracking but also less susceptible to environmental crackdowns.
I missed the big move this month, but look at the bigger chart and there is a lot of room.
I do like that chart and it is a bull flag sitting on the 10sma.
One fly in the ointment…look at it on a 6 month chart with the 10sma and compare it to March 2016. It may pop and run now, or it may repeat that extended bull flag.
EDIT – I just looked at a 3 yr wkly. Very nice
pre-market GPL… bit of a drop
i get 1.47, back down to 1.40… hope that doesnt stick beyond opening
Alex, would you say that the 10sma is a good place for a stop for PLGTF, or would you give it more room? It was down 3% yesterday, but on little volume.
Good news / Bad news
Good news, it looks like this drop is probably a back test of the recent break out. Using a ytd or 6 month chart, it looks that way.
Bad news, that may drop it to the 20sma, since it went there on the first run higher. I was thinking of adding on a successful back test and reversal . Something like what RICE did.
I don’t now what you think about the chart for PXT.TO – for those playing Canadian stocks – it is debt free – actually operates in Columbia, and has great prospects for the drill bit.
Watching the action in XAUUSD (gold) today. Looking at the hourly chart, lots of up and down tails. Indecision.
I added to AMRS on that dip to $0.43…added at $0.445
Where would you have a stop on that?
Probably a mental stop for me…
The 10sma is at $0.40 and the 20sma is around 38 cents, I’d like to see it hold above 38-40 cents, but I’d also hate to be shaken out of the base building process. I was taken out of my NAK trade one time and I’m just glad that I got back in.
No stop, too early in the cycle.
Just so you know, this is not an oil stock
You know, I didn’t do a good job of DD on this one, I jumped in on the volume and then did a company profile. Not at all what I expected. My bad.
I’ve traded this one before as a clean energy play, but they also have a few other environmentally safer programs
Dude, CLNE!!
I was just looking at AMRS again. It broke out above the 50sma, and has now reversed and landed on it.
One could view that as support and if it breaks they could exit there too.
thanks
I added too, good volume again!
I bought CPE today – missed it at the pivot- this company is a really solid Permian Basin player with serious torque to the upside, and I it is free of overhead. I think it could be like CDE where it gets away and just keeps going like an energizer bunny.
The Widowmaker returns!
I have to wonder if they’ll all begin to roll over after Fed Minutes, into the next DCL.
I THINK, the last Fed Mtg spiked the dollar and dropped Metals.
BAA not doing a bad job either… but am expecting some turn around at the 0.33 mark
And Gold just turned higher, but again, it’s still in that triangle apttern.
the Fed Minutes may be the real directional changer
Speaking of Widowmaker, think of all of the money one could have lost on AUMN if they bought in the last two weeks. Barf! Glad I cashed out of that one. Speaking of little miners, TGD is virtually guaranteed to not giraffe at this point. Not sure how much longer I can stay in this one with essentially no chance of upside surprise.
UEC seems to be staying strong
Some energy stocks sold off and coming back BTE, OAS , WPX ,
CLNE breaking out
ANW, EMES
I bet the whole sector is green by the end of the day.
Oil went green
Really sad I started selling USO last week; could have been epic if I held just a bit longer (but I was way in the green so can’t fault too much taking some off of the table).
Stopped out of LGCY for a small loss, No Biggie, it wasn’t breaking out as expected.
save the funds to shop on the MIners pull back : )
pretty good chance that LGCY shook me out of the $1.55 lows : )
It’s my fault. Everyone here makes money on LGCY. Except me and Bill. I bought it after swearing it off. My bad!!
Took a crash trade on BAA, 15,000 shares at .3450, looking for a reaction bounce of 15% maybe. Tight stop.
GSV – Bull Flag?
BCEI : )
just watch out for that 4hour 65ema!
I don’t have 4hr charting, where would that level be?
try the 33 or 34 on the daily.. or 130 on the 2hour.
BCEI has horrendous fundamentals – they have 1.147 Billion in Debt and a current ratio of .19 and a retained deficit of 700 mil. Unless they have some amazing (sort of) news like CRK did, (which I did not look in to) then they have a high risk of bankruptcy. The problem with playing these high debt companies is you don’t know when the trip wire for covering shorts is going to be triggered, or when the trip wire for stop loss orders is going to be triggered.
all the more reason to take your money & run at this ema tag ,.. should you happen to be in it..
That’s funny. I often use a 34 on the daily. Just did the math on the above chart….BING! (that’s the light coming on)
it does seem to have a significance, don’t it?
Refresh, he posted a chart that will show you
oops.. hadnt realized it couldnt be seen
forget F5!
See it now : )
you can easily access 4H charts & indicators (and the rest) over at Freestockcharts…
http://www.freestockcharts.com/platform/v1
Thanks- I usually have my scottrade streaming quotes charts open and they only have hourly. You don’t expect BCEI to get thru, or just not right away?
couldnt know that for sure.. but just look at this HK as an example of a bounce.
a lot of these drops have that 65ema as a ceiling/resistance coming back up
btw…..F5!
LGCY!!! Oh wait….nevermind. 🙁
EGO, GSV, BTG, AKG – red to green and GOLD was all over the place
What was with that big spike in GOLD?
Fed blather
Lol
I bought MUX above the 10sma and my stop will be a break down
Might be early? Although I have MUX and it hasn’t pulled back much. My chart for GOLD is completely destroyed with that 2:00 movement. I still expect NUGT to hit the lower trend line at around $142.
Could be early but it is low risk at support , and it didnt pull back much with this recent sideways move.
MUX also didn’t set a new high this daily cycle like the others.
REFRESH ( F5 ) 🙂
.
Hard to know what will happen tomorrow, so I chose to buy a Miner at support
F5
.
coincidentally filled 2 gaps too
.
So it is difficult to know if there will be follow through to these reversals, or are they just relief bounces and will selloff tomorrow, but I added a few positions at support and we’ll see how things go , especially 3:30 to close.
For example: EXK was 25 points lower, right on the 10sma, and now ran up 25 cents. BTG, EGO , and others also acting bullishly. I’m just going to make sure I stop out if things start to drop below todays lows.
SPX and NASDAQ also reversed green
refresh
.
EXK stopped right at that overhead line and is selling down again, so now it is in between short term support at the 10sma and short term resistance of that over head trend line .
Battle of the bulls and bears. We’ll have to see if either gives going into the 4 o’clock close : )
Nice. But I have now pared back EXK and BTG to ‘core’ size positions. We can certainly get another pop or a bit, but I’m prepared for us to eventually start dropping into the next low. idk, just doesn’t feel that strong to me, but situation can certainly change. My spidey-sense has just been tingling recently…
I’m noticing a full $3 difference in the contract price between Brent and Crude– that’s a divergence, no? Isn’t the spread normally about $1?
Depends. Used to be much more than that before the bear started in 2014. Then they were at parity. This likely reflects the OPEC rumors as they deal in Brent mostly versus the higher US inventories that we had for the prior month. But I wouldn’t read too, too much into it unless your monitoring crack spreads for refiners.
Also quite the wicks on the green bar for gold futures on the hourly chart
Alex, would love your thoughts on BCEI here. Picked it up this am because I had no Oil exposure and dumb luck made 30% in one day. Would like to hold if oil is going to continue march higher, but a 45% move in one day is pretty steep. Would you suggest adding if it pulls back and where would you add if so?
Hi Ann
Someone ( Jim N.) read your post and emailed me and asked me to pass this on, because he is having trouble posting here. He has concerns fundamentally, so you may want to take the money or at least some of it off the table.
Please be careful here Ann, best to read their most recent PRs and look at their current situation.They have retained financial advisors and are pondering a restructuring, are intentionally missing a debt payment and have suspended asset sales activities. this could well be just short covering
So…..gold up $12 after hours….USLV up .71 after hours….wish I’d had the guts to get some today…..but the leveraged funds are so……crazy. 🙂
Hi Tammy
If you scroll up to the top of this page , I have a live gold feed on the right side, I only see Gold up $5.
That’s weird Tammy. I checked FINVIZ and it also showed up $11, but other sources show only up $5.
Odd
That’s weird – I’ve watched gold price on marketwatch this evening….go from up 8 to up 9, then 12, then back down..now sitting at $8.80….this isn’t the first time their gold price was wonky – I’ll have to stop looking at their chart if they’re not going to be reliable…:) 🙂 I usually go to kitco charts to check out other metals as well but tonight I was being lazy…..I forget you have it up there on the right – that’ll be easier if I just remember to look up there! 🙂
BTG looking good for low risk entry here,
What are your thoughts on HCLP here Alex? Seems a great looking chart,