
The Eye Of The Beholder
Not much has changed since the weekend report, and we are still seeing once semi-ugly charts becoming diamonds in the rough. Let’s review…
.
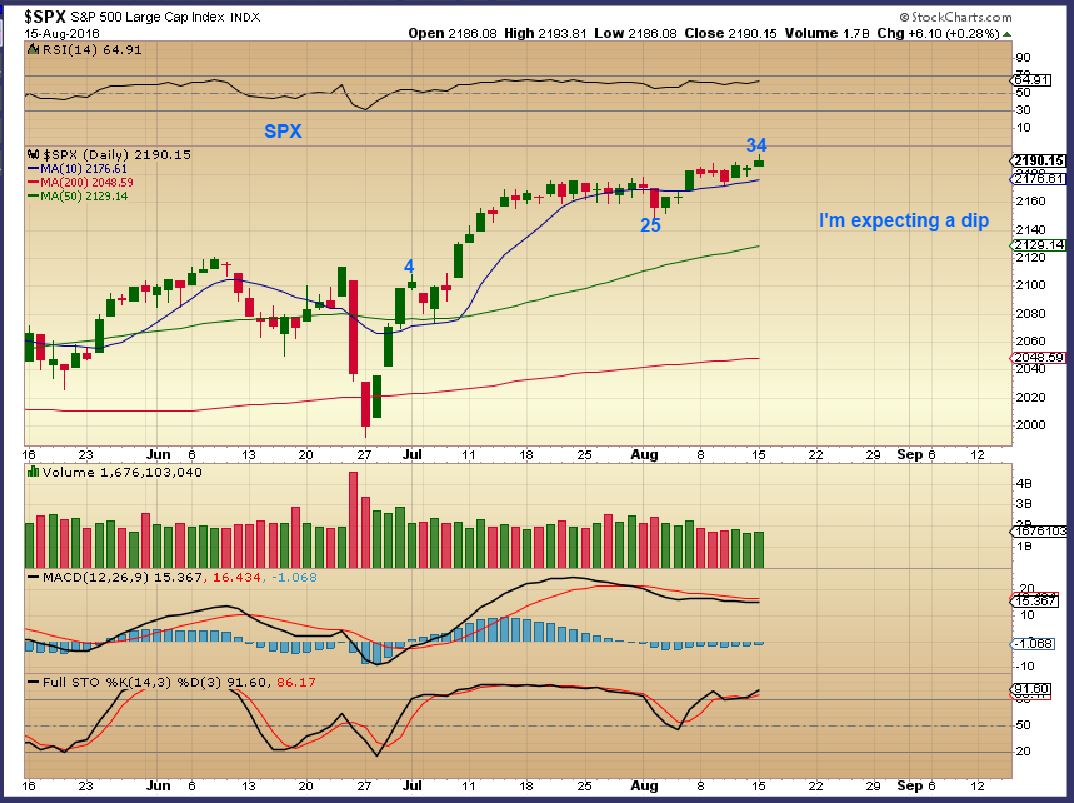
SPX – I personally took a long trade after calling the ICL in June ( And pointing out the 3 white soldiers very bullish pattern), I didn’t stay long during the long sideways move started getting drawn out. I still expect a dip soon into a dcl, though this break out does have an occasional pop higher out of the sideways consolidation. I think you are looking at 1-2-3-4-5 completing for now. It may become a buy the dip in the future.
NOTE: This report is released an hour later than normal, because it is as long as a weekend report.
.
NASDAQ – New all time highs after 8 straight weeks of green.
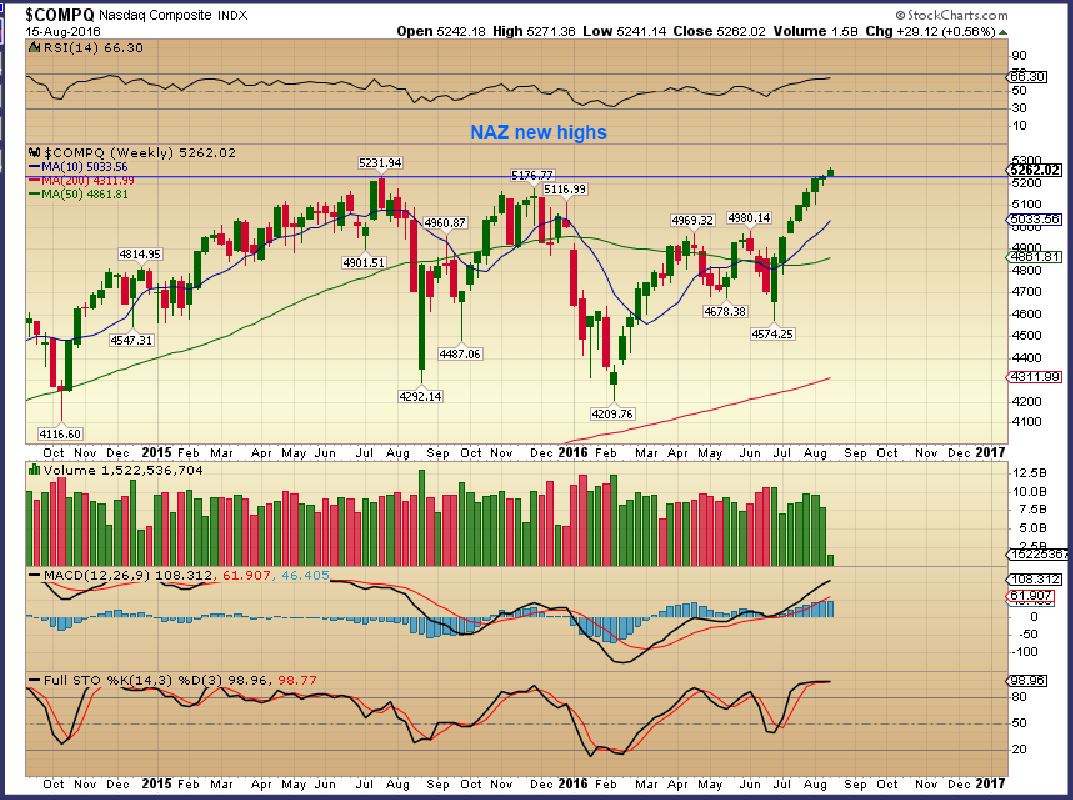
NOTE: I have been emailed and told by far more than one reader that they have read that this break to new all time highs is not bullish action. They are reading that this is a final break out to suck in the ‘dumb money’, and that this is a bull trap with a huge sell off is coming. I have heard many reasons why some have said these things and I am asked, “Do you think this is the case?”. I’ve heard of a Kondratieff Winter cycle, or a 7 yr cycles following the 2000 tech crash, then we had the 2008’s crash, and after being stretched with funny money, it is now due again. I don’t want to dismiss it completely, I do understand why some are calling for a CRASH, but at this point I cannot say that I am seeing that. Many crashes start in October and they do seem to come out of nowhere, so I will try to do a little discussion on this idea of a possible crash coming in the weekend report. For now, we have a break to new all time highs and I see it as that.
.
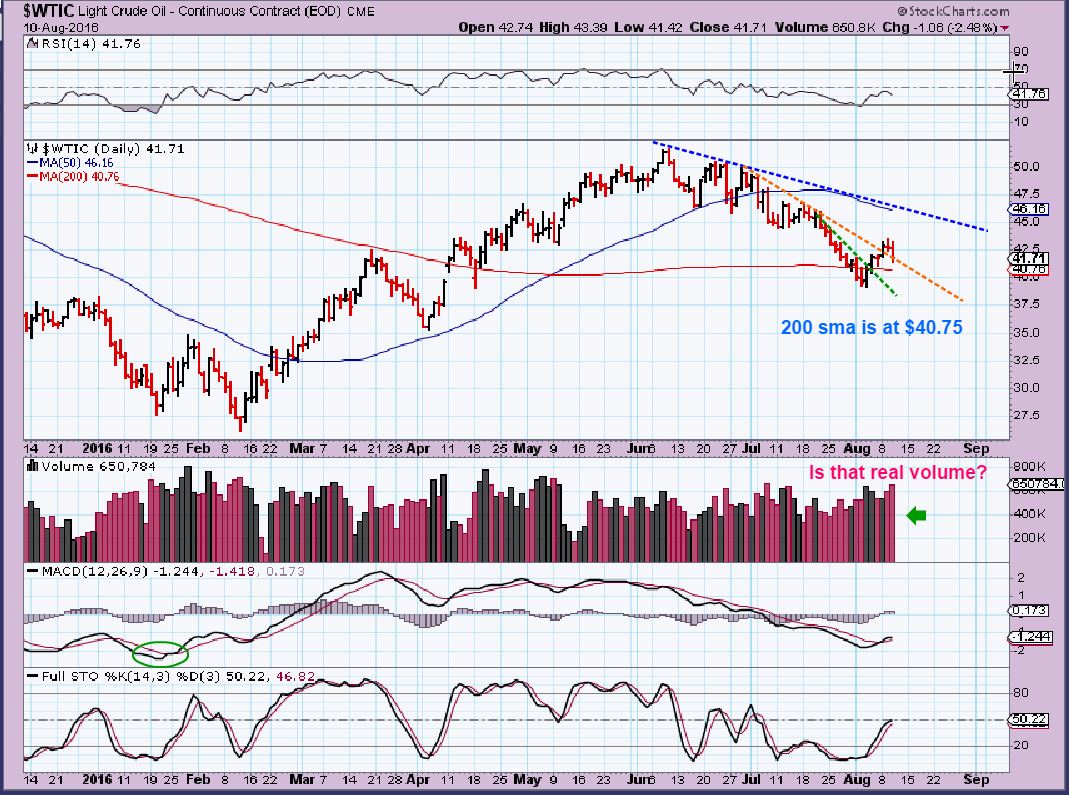
WTIC – On AUG 10th I pointed out what resistance to look for going forward if you were long Oil. Resistance could pause Oil at the 50sma and trend line as shown. You might lighten up if you had leverage just in case.
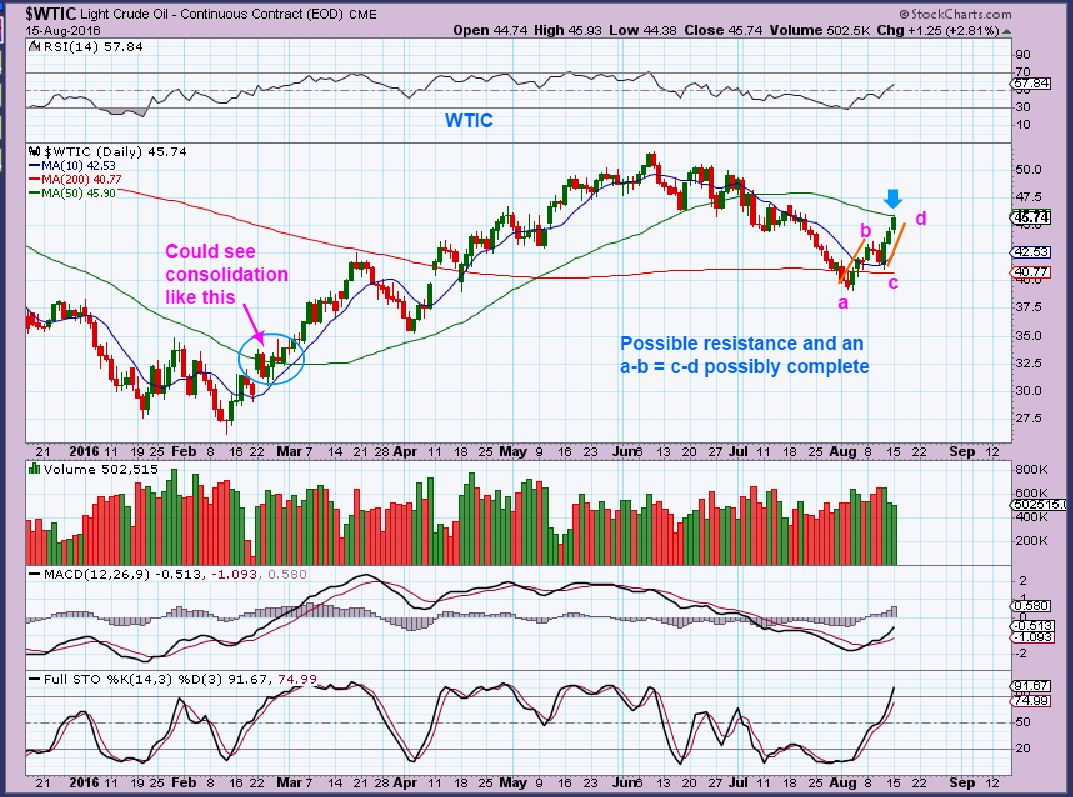
WTIC – We are there, but oil broke slightly above the 50sma Monday. It also could be a complete A-B-C-D, but they do extend in bullish conditions. Notice how OIL danced with the 50 sma in February. Oil can bust right through, or it can work its way through. I think that it could actually push right through, time will tell. We will discuss “Buy the dip” if it dips.
.
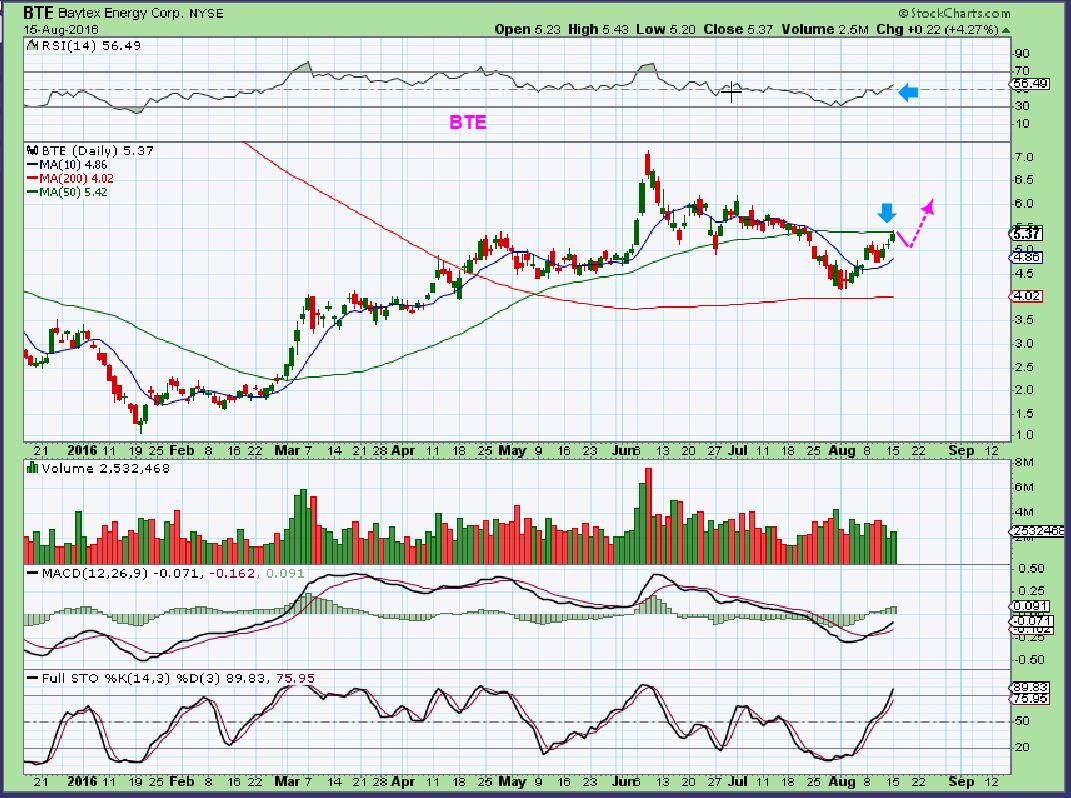
BTE – I looked at some Oil / Energy plays and they may be at resistance too. I bought BTE 2 weeks ago when I discussed good looking set ups in Oil and the possibility of a DCL / ICL. I am not selling here due to resistance, I will added the dip if I get the chance.
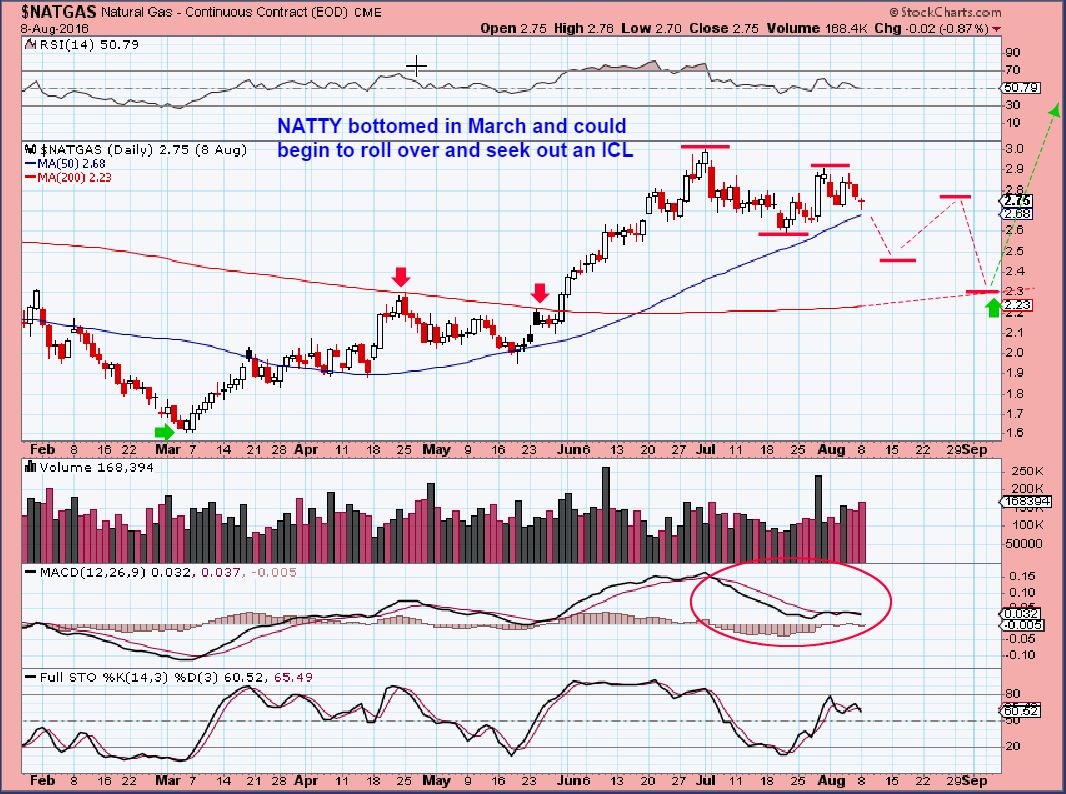
NATGAS – I think that NATGAS is due to bottom, but where and when? Has it bottomed, or just bounced? I drew this on JULY 8. I showed how even with a reversal on the 50sma, it MIGHT drop down and do an undercut, then bounce, and still go all the way to the 200sma as an ICL.
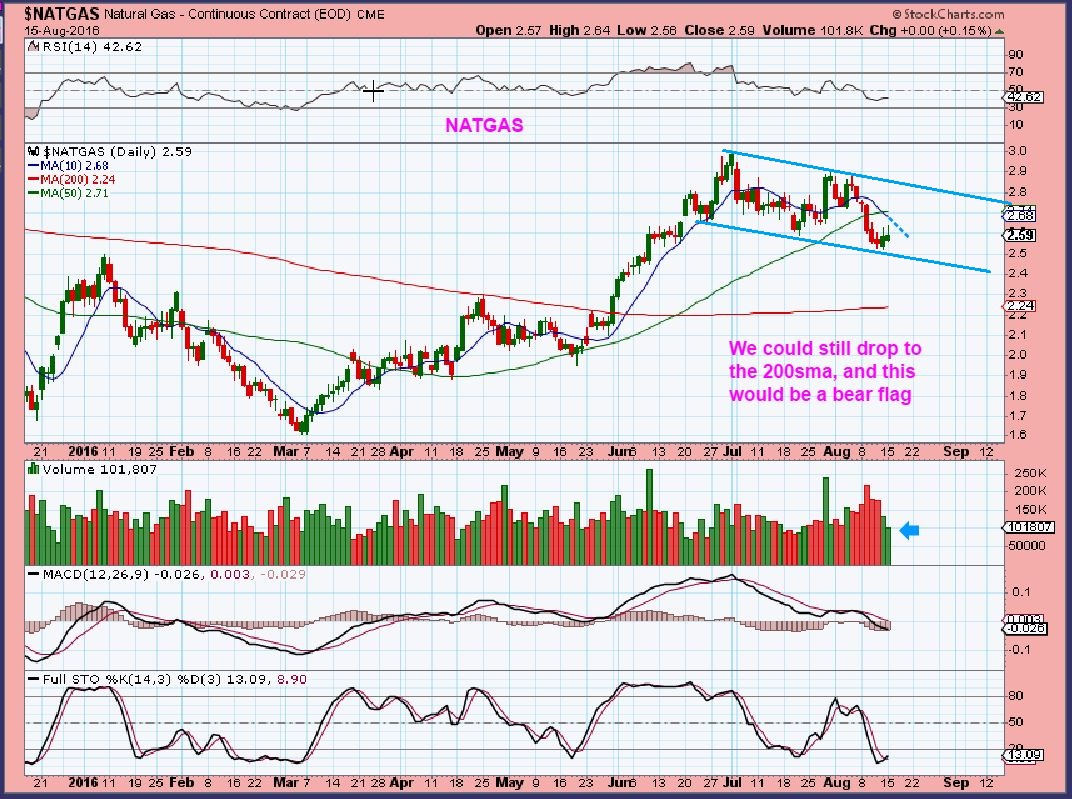
We see that NATGAS did drop below the 50sma, now we got the bounce, but is that a strong bounce, or a bear flag? So far, that bounce looks rather weak, but it is on a trend line for support. We’ll see if it can push above the 10sma, but even 1 more day higher could be a bear flag. I’m watching the 10 & 50sma.
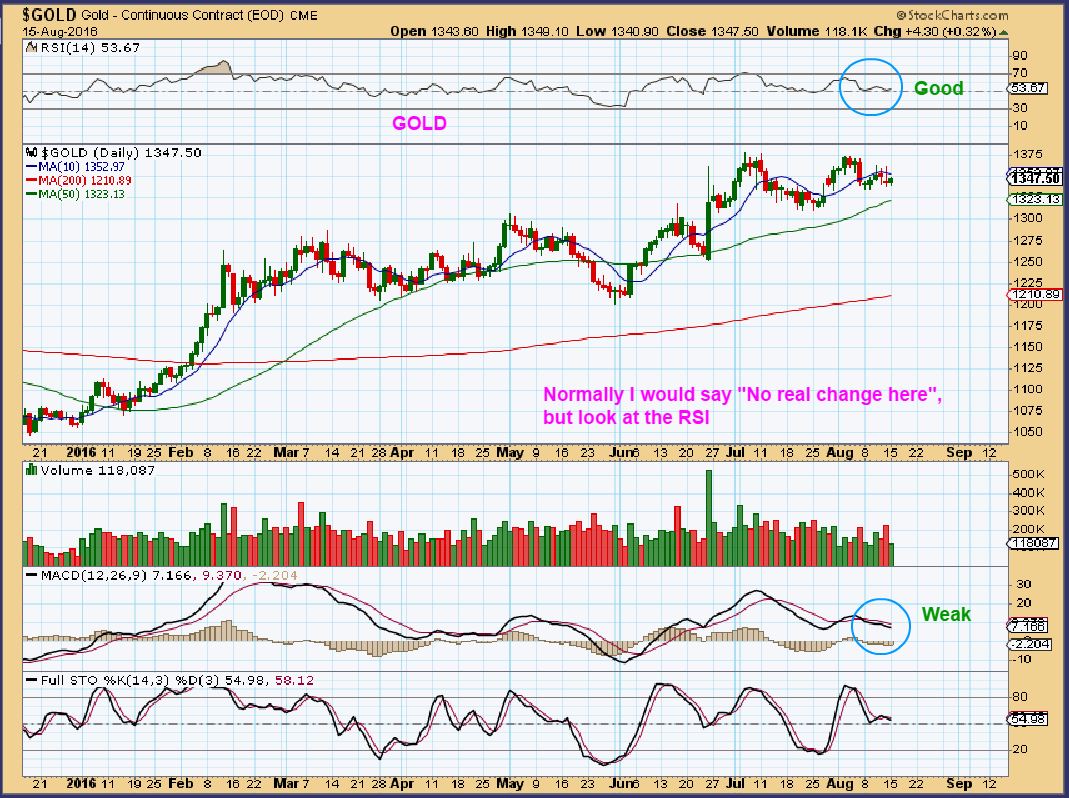
GOLD – No real change from the weekend report. More lack luster action, BUT look what happened to the RSI. It actually curled up though it couldn’t get above the 10sma ( $1353 on Tuesday). Watch the 10sma and that RSI, our consolidation is still in play.
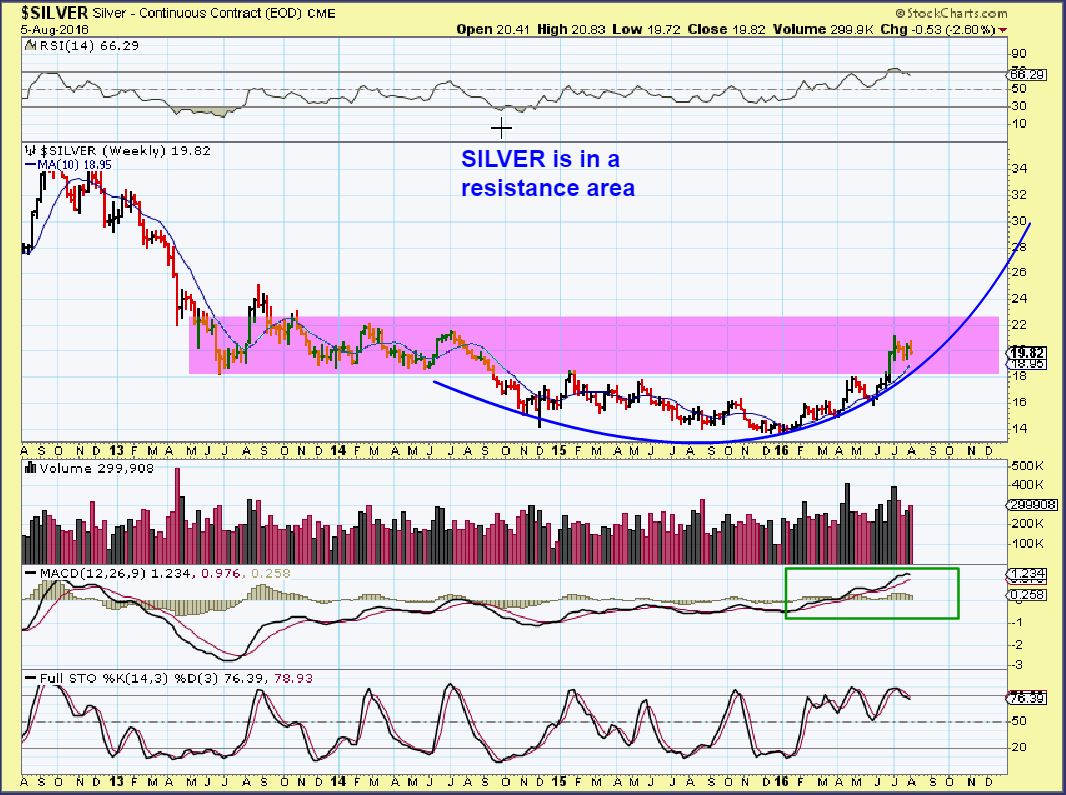
LETS LOOK AT THE PROGRESSION OF SILVER SINCE JULY
SILVER had a strong run, so normally a rest is expected
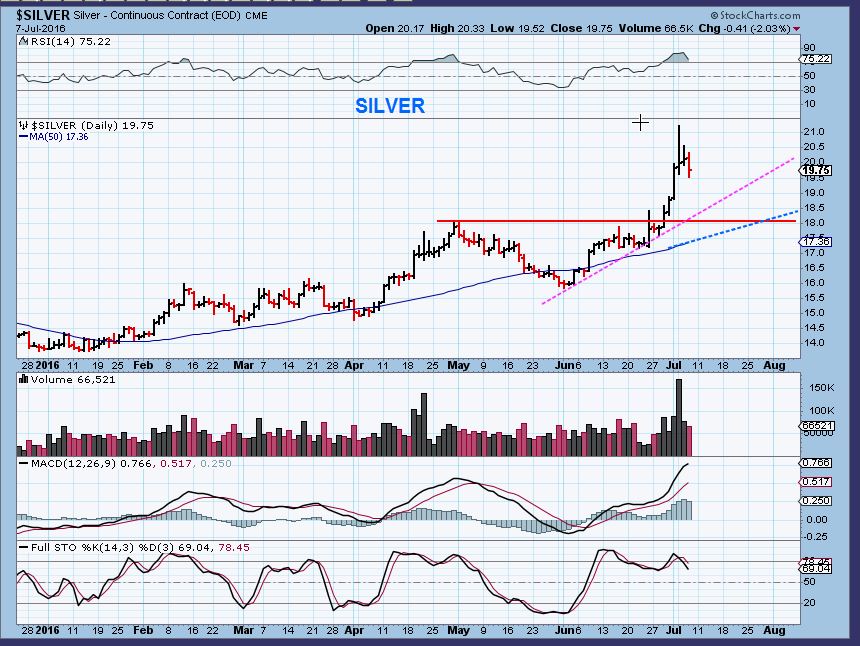
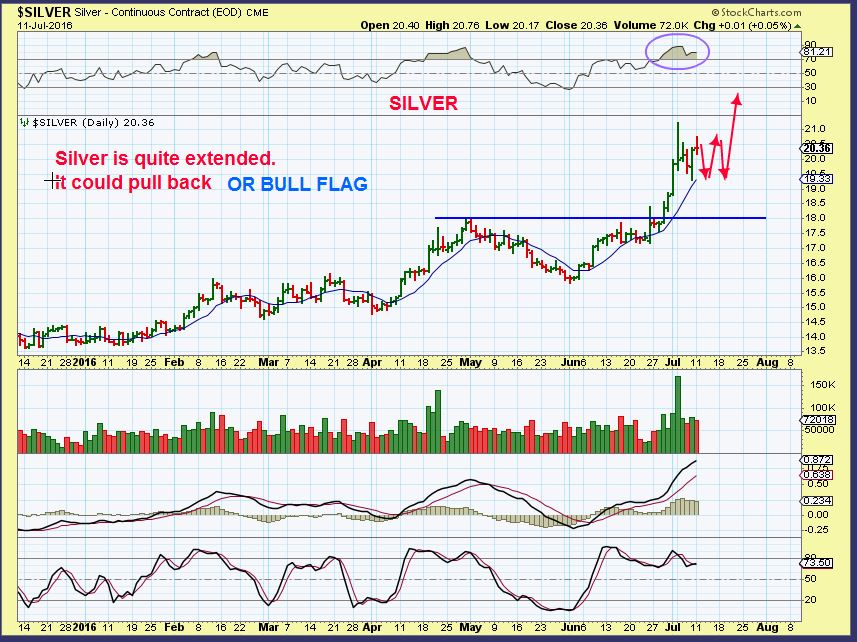
On July 11 I proposed 2 scenarios possible to offer a buying opportunity. A back test or…
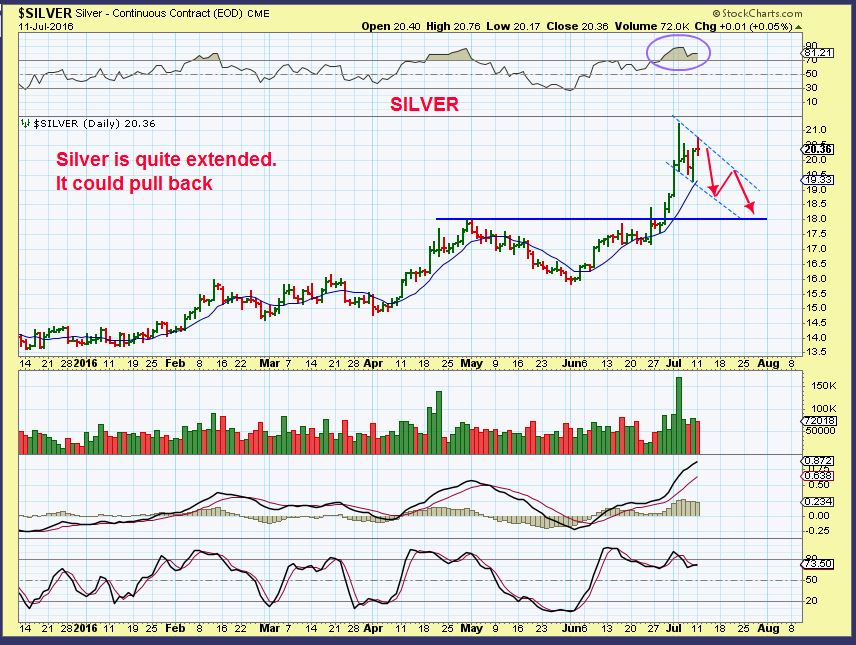
A flag / consolidation
JULY 28th – We see a wedge / flag type consolidation. A break out & bullish run was expected by me.
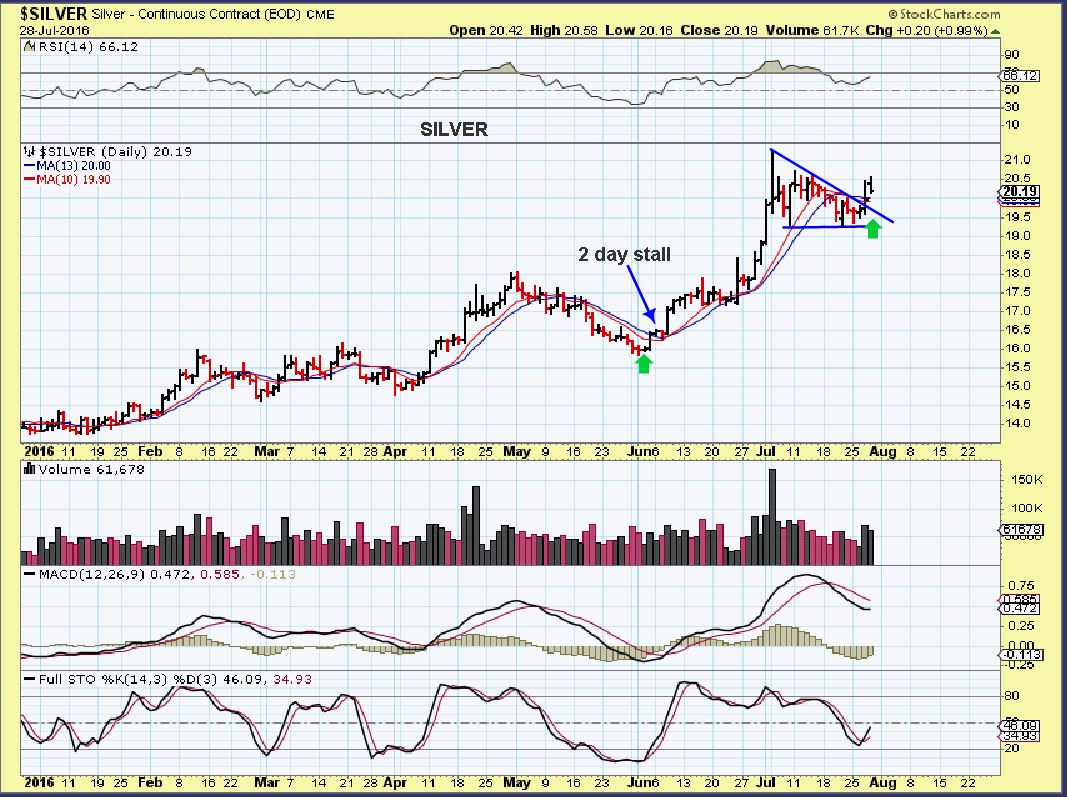
Shortly after that break, you may recall that I mentioned that Silver was looking too weak to continue this break out. I cautioned that something didn’t feel right. At that point my gut was not expecting the break out & run yet.
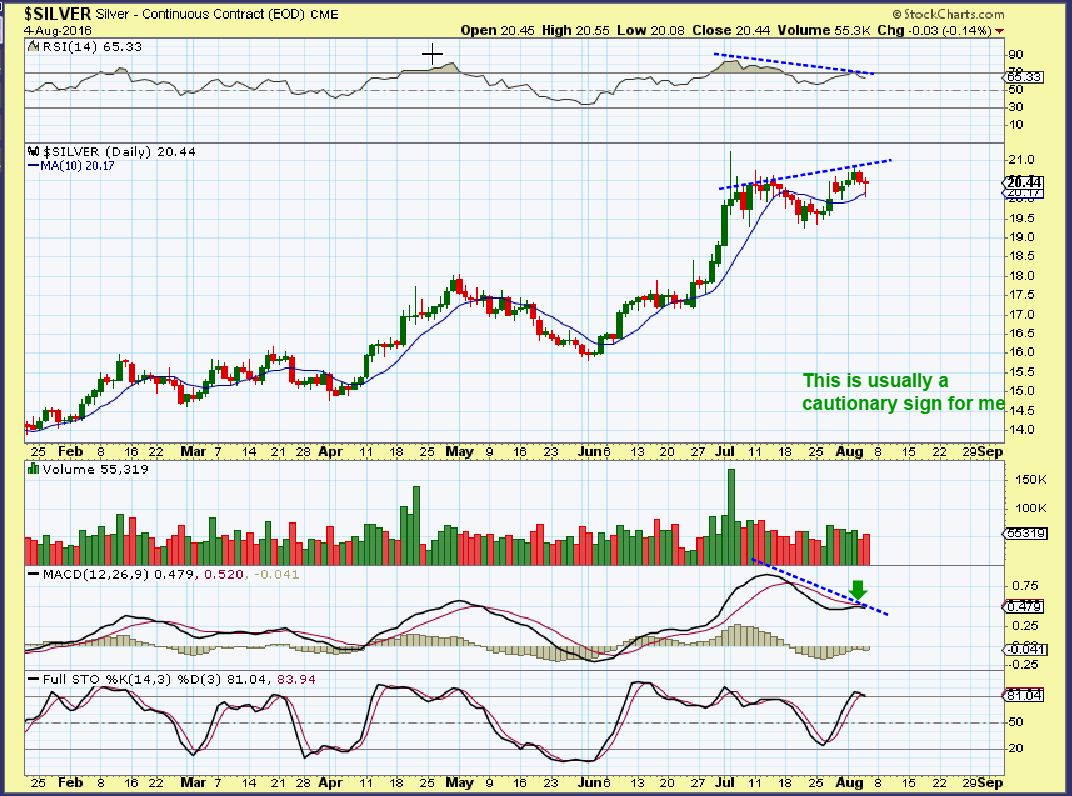
And then it just dropped. 🙁 How could this remain bullish?
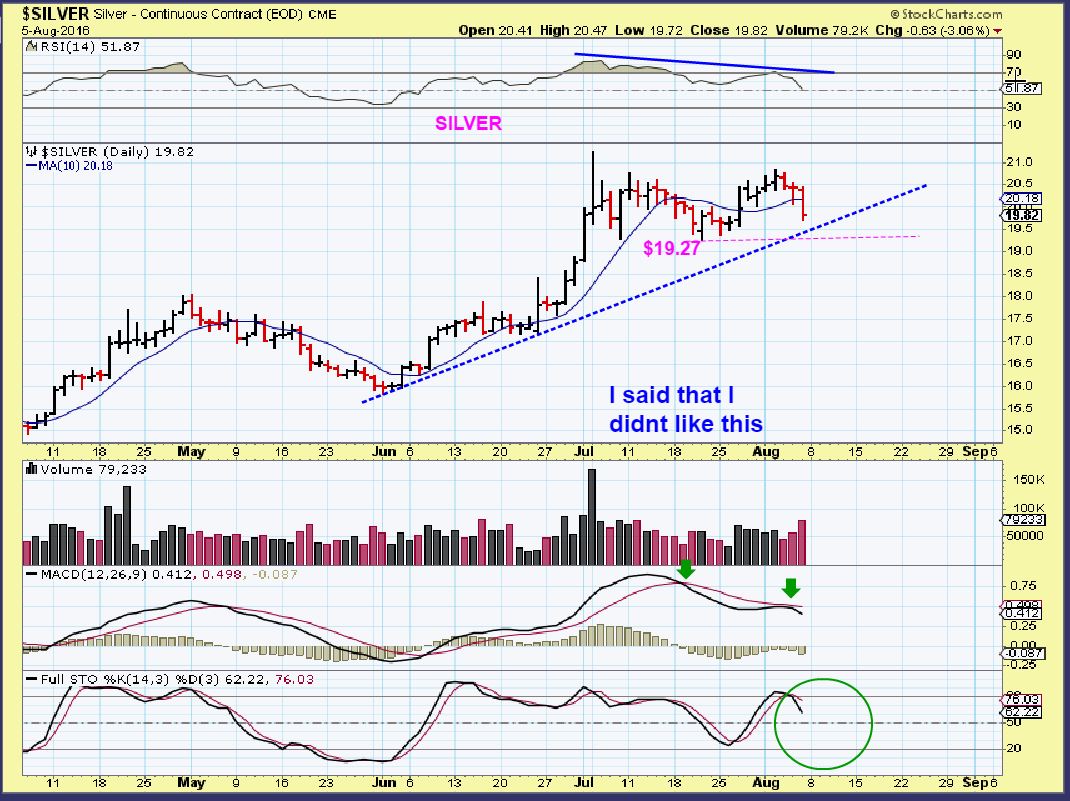
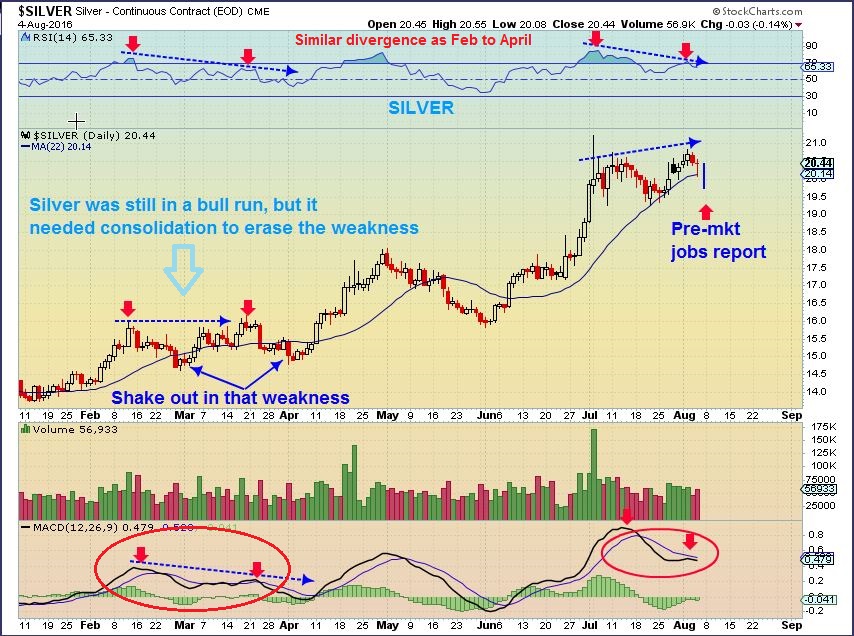
AUG 4th, I also said that this can correct itself in time with consolidation like we saw in Feb t0 March.
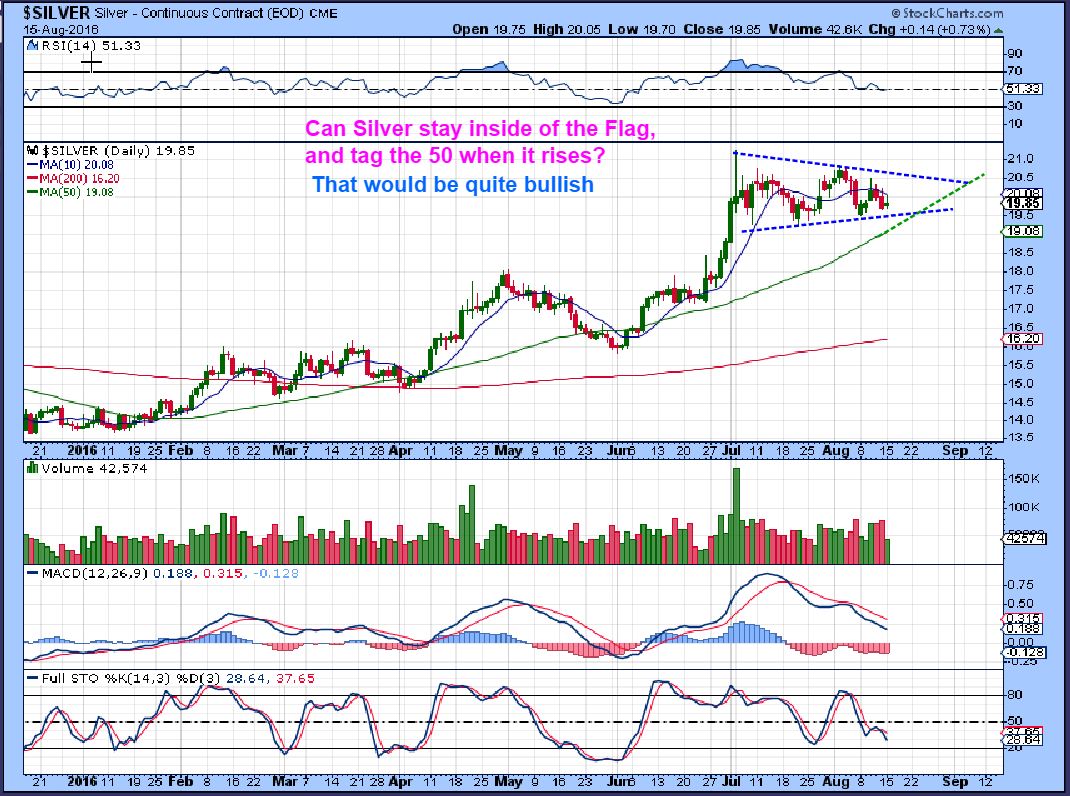
SILVER TODAY – BETTER
It remains bullish by continuing to form an even bigger flag in that consolidation. This could be an example of a diamond in the rough. 🙂 A Future break above $20.50 could continue higher.
AUG 5th I SHOWED THAT SILVER REMAINS BIG PICTURE BULLISH
.
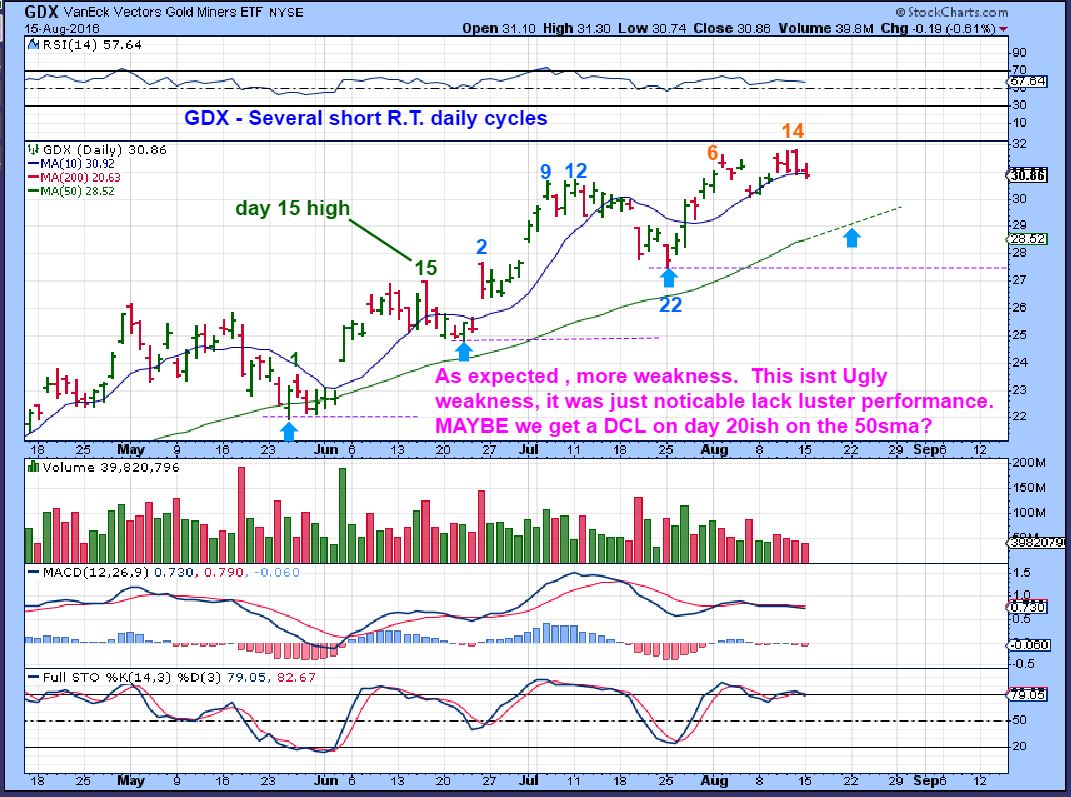
GDX –
So as we saw with Silver, repair work can be done with the consolidation phase. I also saw weakness in the GDX & GDXJ , so I reported that last week. Each POP HIGHER at the open has sold off. We may be looking at a diamond in the rough again here. We currently have a bouncy, volatile, consolidation that consists of Higher lows. Read the chart.
SO the thinking has not changed since the weekend report and the reports posted last week. I like Energy as mentioned in prior reports and the follow through on many stocks and Oil has been good. I believe that we are early in the next Intermediate Cycle, which means that we should see weeks and even months of upside ( gradual or volatile remains to be seen). Short term , we’ll see if Oil pauses here or breaks through the 50sma. We’ll also see what individual energy stocks do at this time. ETFs are the safer trade if any are worried about risky companies struggling with Debt, so some may be watching UCO and USO. If you can take some wiggles, they could be buy & hold for weeks. There are also leveraged ETF trades known to the experienced traders. I believe that Precious Metals and Miners can and should move even higher, but they may need to work through this consolidation phase first. I’ll discuss that consolidation phase at the end of this report. When each pop higher sells off by the end of the day, it means that we may be riding one now. Enjoy your Tuesday trading!
.
~ALEX
.
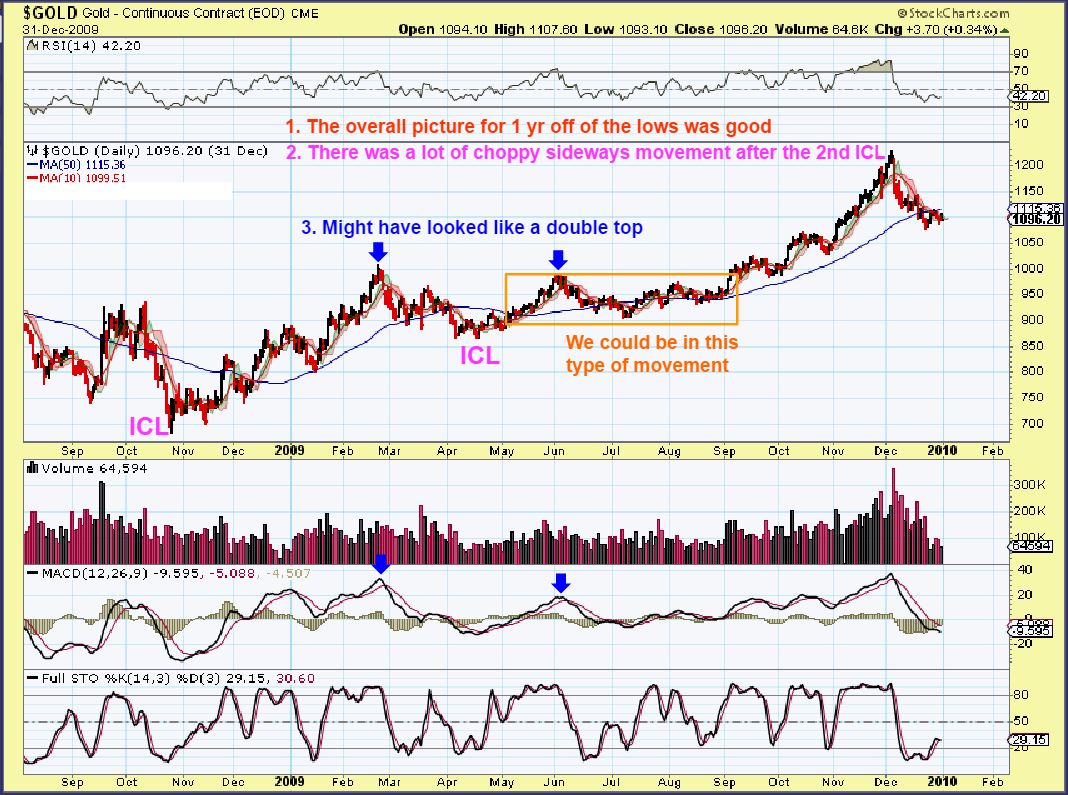
So in the weekend report I had drawn up 5 charts to discuss this consolidation phase. They often come about after a bullish run higher starts to run out of steam and needs a bit of a rest. It should be noted that they aren’t bearish longer term, just lack luster and maybe short term boring or frustrating. For the buy and hold investor, they can be weeks or even a couple months of gains, losses, gains, losses, until the next break out run higher takes place. Let us examine this phase as it occurred coming out of the 2008 lows.
GOLD – Notice the run higher out of the lows, and then it got choppy and went sideways for many weeks until it finally broke out & ran higher . It went sideways for over 6 months actually. My point? Look at the “Wiggles” through out 2009 before the launch, could you ride that with your core? Please read the chart.
HUI 2008-2009 – I wanted to show that late 2008-2009 was basically uphill – BUT – could you enjoy this ride? Look at the lows of April and the lows of July. That was $275 to $400, back to $300 in 3 months. So when I felt that Miners looked a bit weak last week, I wanted to take some off of the table to hold my gains. I still said that I would ride a core and a bit more, and I can always re-enter if it perks back up. I still own Miners, but I am not 100% in like I had been, I am spreading my trades to OIL / ENERGY as mentioned.
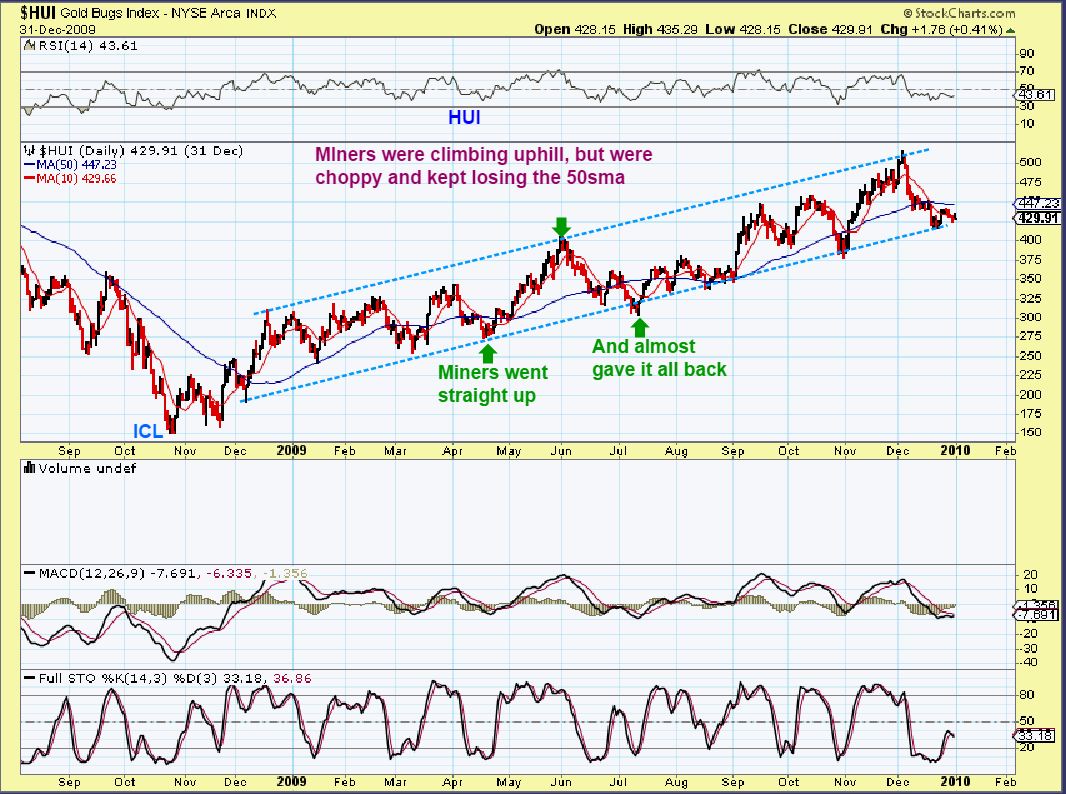
HUI 2008 through 2010 – That ramp up in Gold that you see in the fall of 2009 in the Gold chart above, was not as easy for Miners. For this chart, I also just mapped out the TIME in GREEN from the lows to where we would be now. I’m not looking for a repeat, I am just saying that 8 months into the run out of the 2008 lows was very volatile.
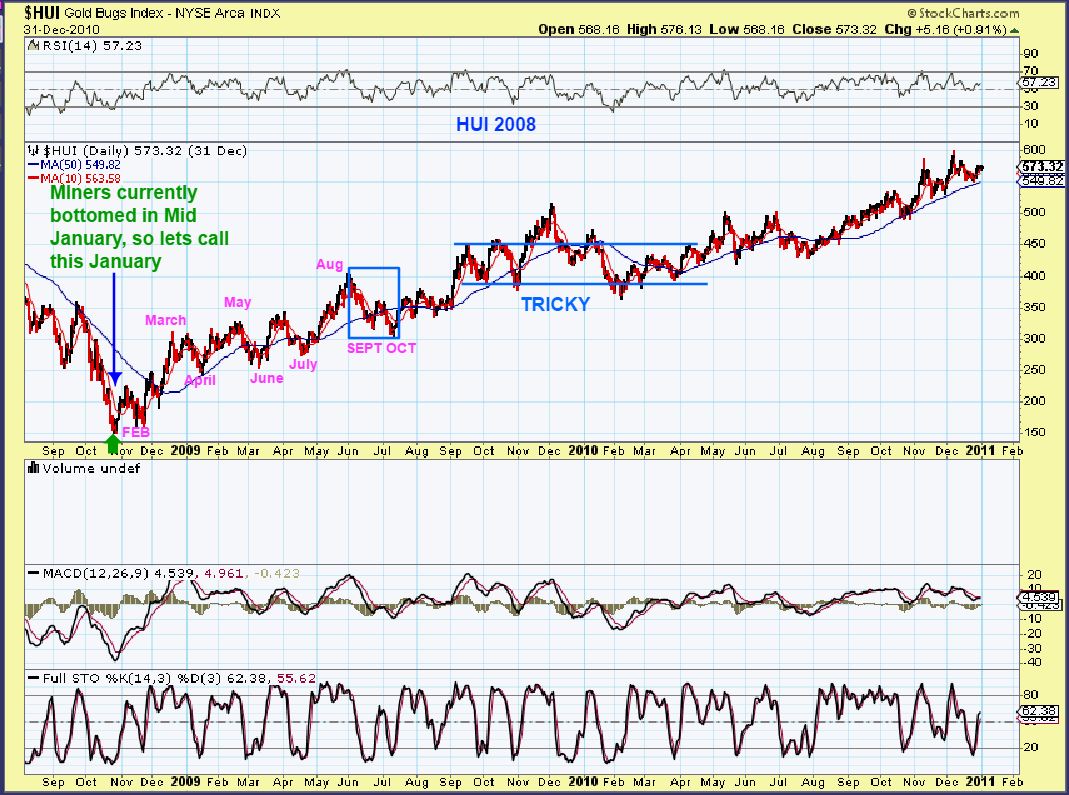
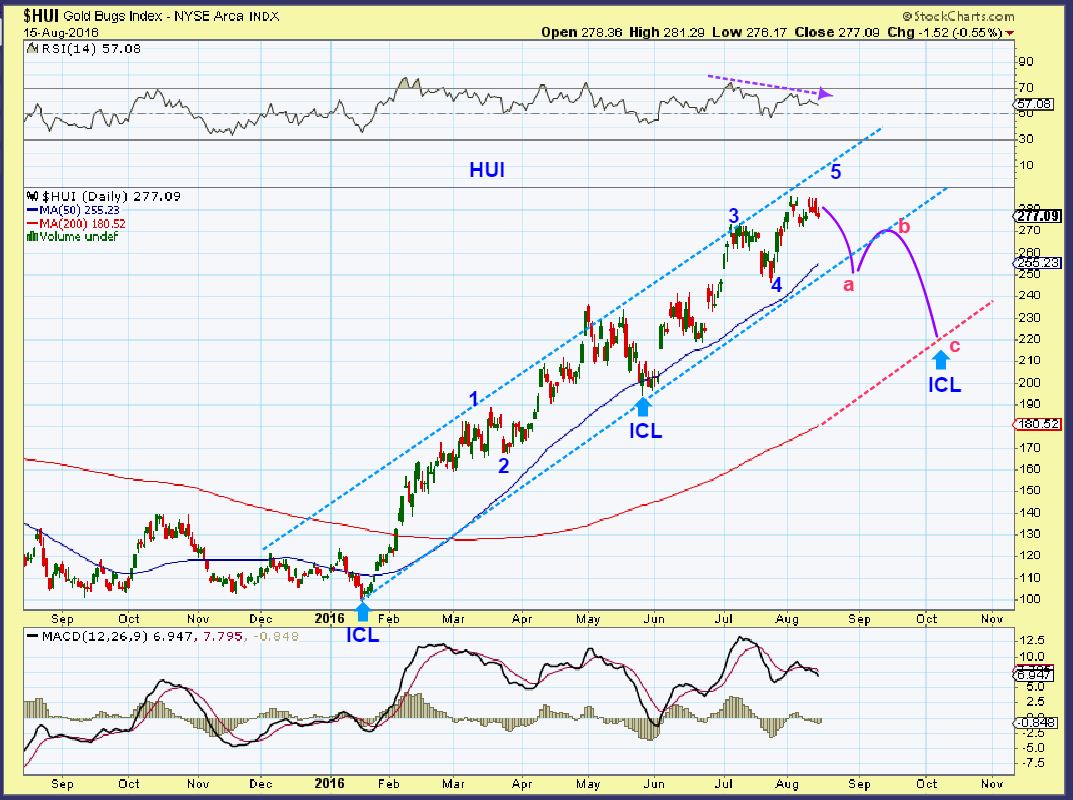
HUI NOW – SO I wondered if we could see this? It is similar to that HUI run from $275 to $400 back to $300. This would be 200 points from the ICL to 300, and back to 220 & a tag of the 200sma at the next ICL this fall. In the back of my mind, I think that we will see a good sized dip going into the next ICL, but when will that be? That remains unknown. The First Intermediate Cycle lasted only just over 4 months in Miners from mid January to late May.
.
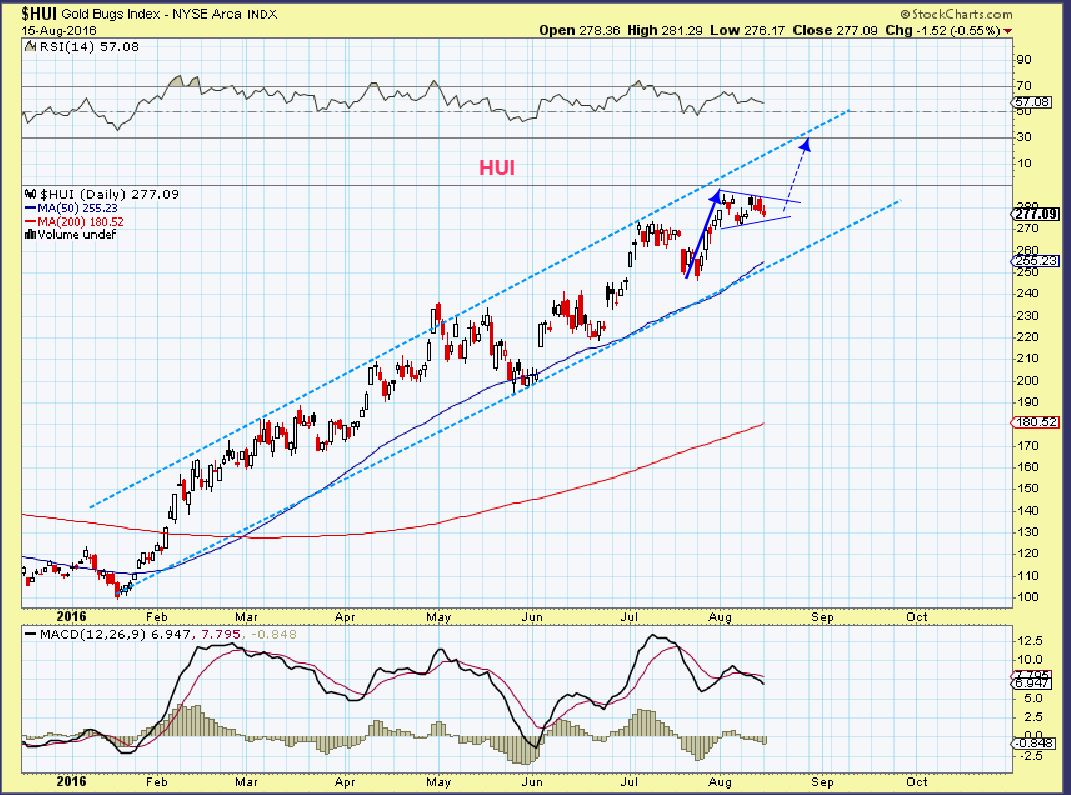
HUI CURRENTLY – I think that this sideways flag is a reasonable possibility for short term and would correct any current weakness. We would get another run higher before a drop into that ICL.
Another burst higher is not unlikely.
.
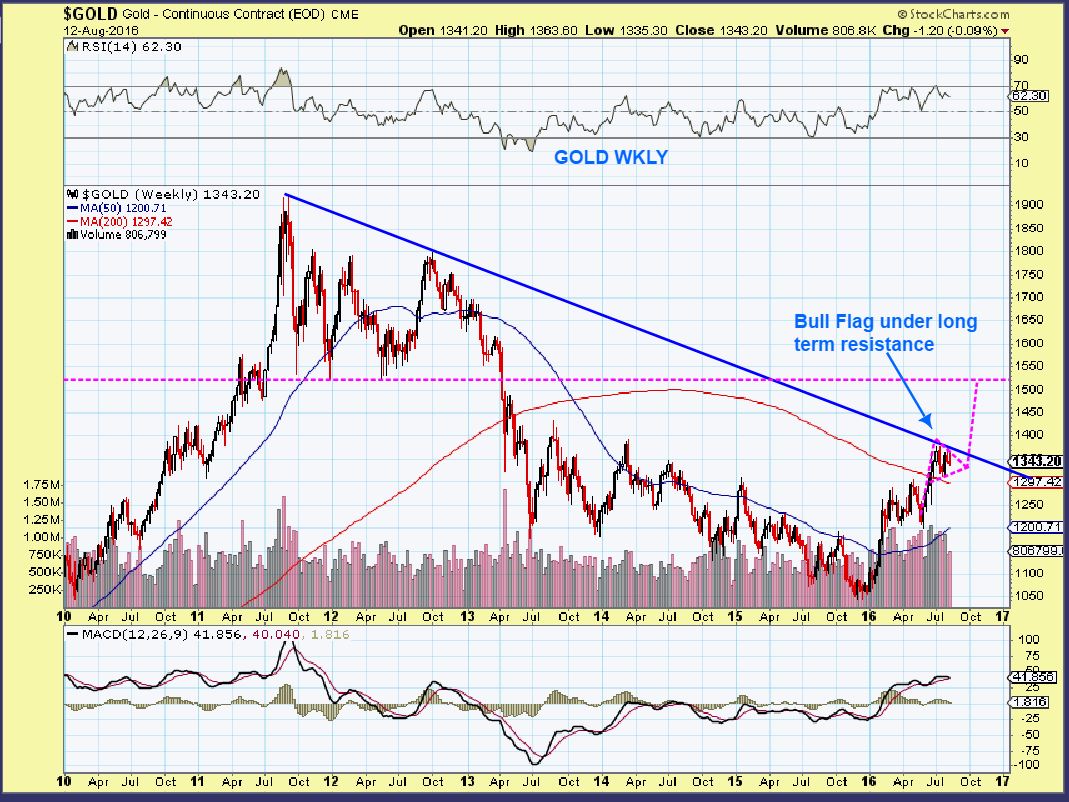
GOLD LONG TERM POSSIBILITY – Flagging under resistance.


Thanks Alex,
I posted a wedge pattern a few days ago, where GOLD was trading between the boundaries, Looks like we got a break out higher and maybe its a trap! The US Dollar is very near completing a AB=CD pattern. Refresh
,
I see POP and break out after Pop and break out in GOLD failing by the end of the day. I’ve been seeing this for many days.
It has a toppy feeling, like a bull trap where smart money pops Gold and buyers rush in so they wont miss the move, and then Smart money unloads to them.
I can’t tell if it will ever break out with legs higher before the next ICL or not., so I remain ready for whatever by taking profits closer to the recent tops.
If it breaks out & finally runs, I’ll take note at that point for a fresh long position, maybe even buy dips here, we’ll see.
And then Energy is helping to increase the gains : )
Hey Bill,
I was using the same wedge, but on my chart, I dont have a break out yet. Just trying to help out here , In your Gold chart your lines aren’t running across the early August tops – I only see the green line resting on 1 peak. If you use the 4 peaks of early august, you may not have a break out yet. Can you redraw that way?
The DOLLAR did bounce & Gold did drop after that move
If I redraw like you asked, then there is a small breakout and drop. But then it doesn’t include the 10th and 15th highs. I tend to tray to include the whole pattern. refresh
Yes, that one is closer to what I had and it was a flash break out , because it did also break above that daily 10sma too.
This is actually the whole pattern ( refresh)
which shows why I wouldnt use the Aug 10th and Aug 15th highs for a break out
.
It does remain bullish this way too.
.
.
EDIT: Actually Bill – I zoomed in on my wedge and I do see how it could be a small fake out break out as you have it. too
Great observations on gold and potential future paths. thanks for sharing.
Hi Shermo- Ur welcome
I look back at various similar times, and really it looks like almost anything could happen, right? This has been such a straight shot higher that we could be due for increased volatility and I just wanted to prepare everyone, especially when I get emails that people are leveraged heavily and ready for the run to $1425.
Every break / out fake out that lingers here for a week or more can decay certain leveraged positions. Things just didnt look like Break out action yet to me.
You got me out of NUGT at $178, thanks! 😉
Yeah, that was actually a good trade, but look at the chart below on GOLD that I drew and added here. It looks like a bull flag still, so a re-entery MIGHT / MAYBE / POSSIBLY be coming up for a real break higher. SIlver seems to be consolidating too, so the weakness may have been temporary.
ditto.. 179 for me … snicker
#hb
I got in earlier than you. $118……Snicker, Snicker! #HB
damn….
everything I’m reading on AU looks positive, yet the chart looks negative?
I agree
Good Morning everyone – I have to admit that I come to the gold trade as
a nervous Nellie, and tend to look at the downside risk more than the
upside, and it does seem to me that we are in a time of distribution and
a possible Stage 2 process. But as of yesterday, and today again the
“other” miners are running – and they recently seem to presage a run in
gold miners. AKS, VALE, CLF are all up again in the pre-market.
HK – received notice from NYSE drops below NYSE continued listing standard. Soon we may not able to trade in NYSE. Anyone still holding? FYI.
Noticing that VALE, CLF, X, AKS, FCX – all are coming up as top advancing stocks this morning
Yeah, They forgot NAK, huh? 😉
Regretting that I lightened up to lock in gains — still have some but was expecting a little resistance …..ha ha
I sold NAK for only a 10% gain :p
Crystal, CLF looks real tempting here. I had it earlier and sold when they announced the dilution.
I sold the rest of mine last week, locked in some great gains. Started to add again yesterday, might add again today.
CLF was a low risk BUY 3 days ago at the 50sma, with a stop just below it.
Hi Alexander
A few days ago, you suggested NAK as a potential girafe. So I bought it and now it’s up 65%, what do you foresee for that one now ? Thank you for this recommendation and your great work.
I own it , but it is getting extended. It has moved higher on strong volume, and that is good.
Can it pull back, yes. Can it bull flag? yes.
I cant know whether it will just go sideways and bull flag to the 10sma as it rises higher or will it pull back to and drop right down to the 10sma. I have given the long term charts ( look at a 5 yr weekly) and the potential is good, and the companies potential is great IF THEY GET PERMITS or they could be bought out.
You have to decide when to take profit or to let it ride based on that info .
Look at other stocks that shot up ( TRX, THM, XRA, VGZ, MUX) they dont always just keep going higher & higher, but I do expect that if the Bull is back, yrs from now they’ll be much higher.
Hope that helps.
Going vertical now…..
CRAZY NAK ( I lightened up just a bit yesterday and thought I was locking in solid gains of over almost 200% from my purchase in the $0.30’s , now this thing is really plowing through resistance).
Yeah bonkers, nice tip though sir….. just going to let it run with a trailing stop I think.
Bought a (little)bit of ERX this morning on that small dip.
did NAK get that license of approval or something!?
Is everyone still hanging in there with SB. Any thoughts on it?
Daily looks like it’s rolling over, minimal volume; weekly looks to be at resistance. Actually, from what I’ve read, the weekly setup could be shorted.
However, I wouldn’t do that either, because oil has been pushing higher. Contradictory clues = no man’s land. That’s my opinion, of course. I’d move to greener pastures if it were my $$$.
Hi Alex,
Any thoughts on LGCY? Do you hold any? Diving me crazy. I know Bill Loves it! LOL
Nothing has changed, it seems to be consolidating above $1.50. On a 1 yr chart that shows as support. It broke out to $2, and gave it up.
Still consolidating.
I bought CHK yesterday and added at $5.50 today, it has break out type volume and should break from this recent consolidation
I’m in!
CRK is moving too
I was watching crk too, and I like that whole set up. It just did a reverse split, could run
What do you think of WG Alex? By the way, I think CRK has better fundamentals than CHK from what I have read Dallas Salazar who deals with distressed debt is my main source.
Thomas, I found some good news on their debt…posted at top of thread.
can you send me the WG debt stuff again? I don’t see it
Me too.
nice..
thank u… love it
ALEX, what do you think of the chart of LABU here?
Not much 1-2-3-4 and now trying for 5?
Exactly
UWTI = 3 white soldiers?
I dont see it at all on a daily
8-11, 12, 15? No?
oh,
They must be 3 days in a row – equal length
They are in a row, weekend 13 & 14. BUT, they don’t occur within the previous days body.
They aren’t equal length
They don’t have to be equal length! Anyway, I like energy sector right now. I’m mostly in that sector with a few miners left. CDE, MUX, TAHO.
… do i need to get in the middle of u two right now?
#Meow
#CFSandwich
Look who finally woke up! #HB
..
Just need your chaa-ts (CF accent) and coffee!
Not by definition. Never mind!
What is ‘Three White Soldiers’
Three white soldiers is a bullish candlestick pattern that is used to predict the reversal of the current downtrend. This pattern consists of three consecutive long-bodied candlesticks that have closed higher than the previous day, with each session’s open occurring within the body of the previous candle.
Here goes GBR again but with no gaps this time!
It’s a fun chart , not so fun to ride at times 🙂
wow the pop for fcx, clf etc had a change of character!
Alex, thoughts on BAA, still bull flagging on the weekly to me. Building up stream before real breakout above .49?
Pretty much. I expected it to move higher by now, but it then looked like it could dip to the 50sma on a daily and then try to go.
It almost tagged that 50sma today .
whats your rating of TGD currently…
still wanting to pull back before higher?
The weekly chart shows that it is at resistance.
I own quite a bit, and I watch it using only the 20sma. I loved it last week, but that 20sma is just starting to roll over (Still acted as support today). I dont want it to roll over, and I think that it will do as Gold does. If one of these false beak outs sticks, it can take off higher. If Gold rolls to a DCL, TGD and BAA may also.
Added on morning dip on TGD.
I see higher lows.
the weekly is beautiful. over 100wma. (refresh)
waiting for our TRX type move. (or a la Nak)
BAA…. works me. A zen patient attitude required. (i started buying last year!)
No TGD to go before I get bored. OR I can sell nown and you guys starting minting tomorrow!
I had BAA for a while, it tries your patience at times.
i still do .. and yes it does
It certainly has tried mine, but I think I’m going to sit tight on this one. Went in and out of it. Now just holding. How did there earnings go? Do they pay a dividend?
I’d rather have BA. Cross over on weekly MACD including a backtest of the 50wma, daily looks ‘aight too. *bort*!
Ticker “GOLD’ looks rather good today, appears to be trying to break above the 10sma and the volume is heavy for this time of day.
Added to CHK on that dip. Love the action
I took a position on CHK too! Dumped AA after too much sideways. OAS still looking good. I also bought some GHL because I liked the chart. We’ll see how it does. Overall, I just need at least $25 so I can get myself one of these:
Bort!
Ok, I need 1 of those as well! Come on OAS!!
Someone emailed me and let me know that I had written the wrong number next to the first GOLD chart in todays report when I pointed out where the 10sma currently was. I had written $1053, meant to write $1353 obviously.
That error has been fixed, thanks.
thank u for the HUI charts… verrrrry nice.. only been able to skim report.. but thank u also for labeling the waves.
tho.. now im *&^% confused again w/ the icl dcl….. arghhh :-/
RICE could be making a move now – pushed through a previous high on volume
Yes, and the back test went as expected. Very nice chart
I’m liking the set ups again in AAU, THM, and a few more. yes, even GPL as I mentioned a week or so ago.
,
Then I look at this ( refresh) and we are close to the APEX. Break out higher coming?? We’ve had a bunch of higher opens that fade away, maybe to lull us to sleep? the stocks look more bullish than not.
.
GPL. BOO!!!
For energy, I’m buying PGH and PRMRF
That PGH wasnt on my watch list, I really like the chart – I’m adding it to my list – thx
EDIT: I know nothing about the company, but the chart is really nice
.
giggle…
all you have to know about PGH is one of the smartest resource investors Seymour Schulich is buying a boatload of it.
also ERX triple leveraged and XLE Dec 70 calls
REI is pushing up out of the cup – small Permian player with a tight share structure, net cash and top quality management.
Look at CRK now R.B.
I knew buying every last share i could would pay off. 90% of my ira was in this pig
WHAAAAAAAAAAAAAAAAAAAAAAAAAAAAAAAAAAAAAAAT
Nice trade : )
I can’t see any news about the company – and it was/is of the zombie tribe. I can see a short interest listed at -53% on marketsmith – don’t know exactly what that means – but could this have been the mother of all short squeezes?
OK, Who popped that CORK again
CRK – WOW. R.BYRAM mentioned it this a.m. and it was only up about 10%?? I was watching it, but never bought it.
I have been in the red SO long on this…what the heck is going on?! I can’t believe the giraffe neck. I am so tempted to dump it, but I so often sell too soon after I am disgusted with a stock that seems to be punishing me. Any suggestions? Targets?
That’s exactly why stocks have resistance!
Glad my partial sell order did not go [that was my wishy/washy decision…sell half and at least get something for the annoyance I have had for so long]…after hours it is at 6.56!
AMRS – Just landed a multi million dollar contract, released earnings a few days ago, and looks to be breaking out.
REN just doesn’t stop! Amazing
A lot of the ones with reverse stock splits ( NADL, REN, SGY now CRK) go from $3 to $30, like they would have if they were penny stocks going $ 0.30 to $3.00.
It’s amazing, because I was taught not to buy stocks that did a reverse split, they may be desperate and near bankruptcy. I may need to change that idea, that is why I didn’t grab CRK.
Same here – I have stayed away….and wish I hadn’t….but those seem to be the ones that pop nicely…..today OAS is down, ECA is about level, DNR is level, BTE barely up…and oil up $1 – ? Maybe some of those are just consolidating gains from previous days….?
That was my assumption. Also general market down, likely help put pressure. Also was oil up that much or just $$ getting hammered, right? :
True! I think dollar is going to continue down….hopefully at least until I get out with a profit on all I have right now! 🙂 Oil down after hours….hope that turns around in morning….:) 🙂 Ever since the GPL fiasco I’m …a little timid……:P Hoping the companies I have now won’t do an offering….ECA already did one so should be good on that one at least!
API stats, crude down 1M but gas up 2.2M!
Alex, do use automated alarms to let you know when stock volume picks up?
yeah.. his ‘beautiful mind’ …
This is true, I do not use an alert, I just scroll through
I have been reading “analyst’s” stating how Oil and SPX are Correlated I am just Not seeing that. What I see is that Oil is currently Correlated to the USD………..as is the Metals.
USO (Crude Oil) looks and feels Heavy at these levels…..I reduced exposure by 75% yesterday, as soon as USO has a daily swing sell signal I will sell that remaining 25% and ReLoad at the bottom the of wave 2 correction….still holding a basket of Oil Jrs. unhedged.
Long Nat. Gas. Long Sugar. Long Metals.
Long Sugar? How are you playing that?
SGG and CANE are one way.
WEAT and CORN also look interesting.
WEAT and CORN look like they are in a bear market. Keep going lower lows.
I am playing Sugar via SGG straight up no options……stop below 42.71……I am seeing a wave 5 up currently, if it breaks down below 42.71 it is still in a wave 4 correction and will ReEnter long again at that wave 4 bottom.
I dont agree with the correlation of OIL & MKTS at all times either.
Gas needs to get going! I sold USO yesterday as well (100%), all out leverage except for a couple of OAS lottery-style calls. Sold final GLD calls this AM on a fortunate pop, glad to be out of that one. Paring back miners, especially juniors but as still fairly heavily invested as I rotate that into energy names.
I watched UGAZ today…..go from up over $1 to back down again, to back up again, to back down again….each time I saw it up I thought…geez, I’m too late, I should have gotten some….when it would fall back to near starting price – I would think, well geez, I’m glad I didn’t get it…..then I’d watch it go up all over again…what a roller coaster ride! It ended the day up $1.13….but wow – knowing me I would have jumped in and when I saw it fall I would have bailed….I wonder if it will continue up now since it ended on a good note…
I didn’t realize quite the Rollercoaster, I’ll have to look Intra-day chart. Daily looks like a bear flag today.
CHK….up over 6.50 after hours…hunted for news and found this:
Chesapeake Energy (CHK +6.8%) enjoys a second straight day of strong gains following steps it announced to rehabilitate its balance sheet and liquidity and to eliminate its midstream liabilities (I, II).
CapitalOne upgrades shares to Equal Weight from Underweight with a $6 price target, up from $4, saying the company “seems to be pulling out of its death spiral” without no bear concerns likely to drive meaningful underperformance going forward, outside of a deteriorating commodity price environment.
Also, Barclays triples its price target on CHK shares – although only to $3 from $1 – to reflect the recently announced Barnett transaction, midstream contract restructuring, and continued efficiency gains evident in CHK’s new guidance
CRK up to 6.68 after hours. I hunted for news and found an article on Globe news Aug 15….It is all financial stuff but apparently the market likes it:
COMSTOCK RESOURCES, INC. ANNOUNCES AMENDMENT AND EXTENSION FOR SENIOR NOTES EXCHANGE
FRISCO, TEXAS, August 15, 2016 – Comstock Resources, Inc. (“Comstock” or the “Company”) (CRK) announced today an amendment to its previously announced offer to exchange any and all of its existing senior notes for three new series of secured notes and, in the case of the Company`s 10% Senior Secured Notes due 2020, warrants exercisable for the Company`s common stock, upon the terms and subject to the conditions set forth in the Registration Statement on Form S-4 filed on August 1, 2016 with the Securities and Exchange Commission (the “Exchange Offer”).
It’s a short squeeze. Bad news is out. Over $5 brought institutions back in. This was near all time high volume. 15x average volume. Anticipation of bond swap means no chance of bankruptcy but some dilution. This is not even 1.5 pre split. Currently a super low float of 12 million shares
Bounce – good observation – this is $1.22 pre-split after what I can only guess was a massive squeeze – every short in the country had to cover today.
An idea AOT is poised for next move. I see 2.95 from 2.15. I’m in for $5.00 – 6.50 when pog breaks 1550 next cycle. I am an ancient turkey 🙂
Best to all on this generous site.