
And They’re Off
Hang on, They’re running again!
.
I ‘m going to skip the general markets and get right to Oil and Precious Metals. Why? This is a chart from yesterday, and again, nothing has changed.
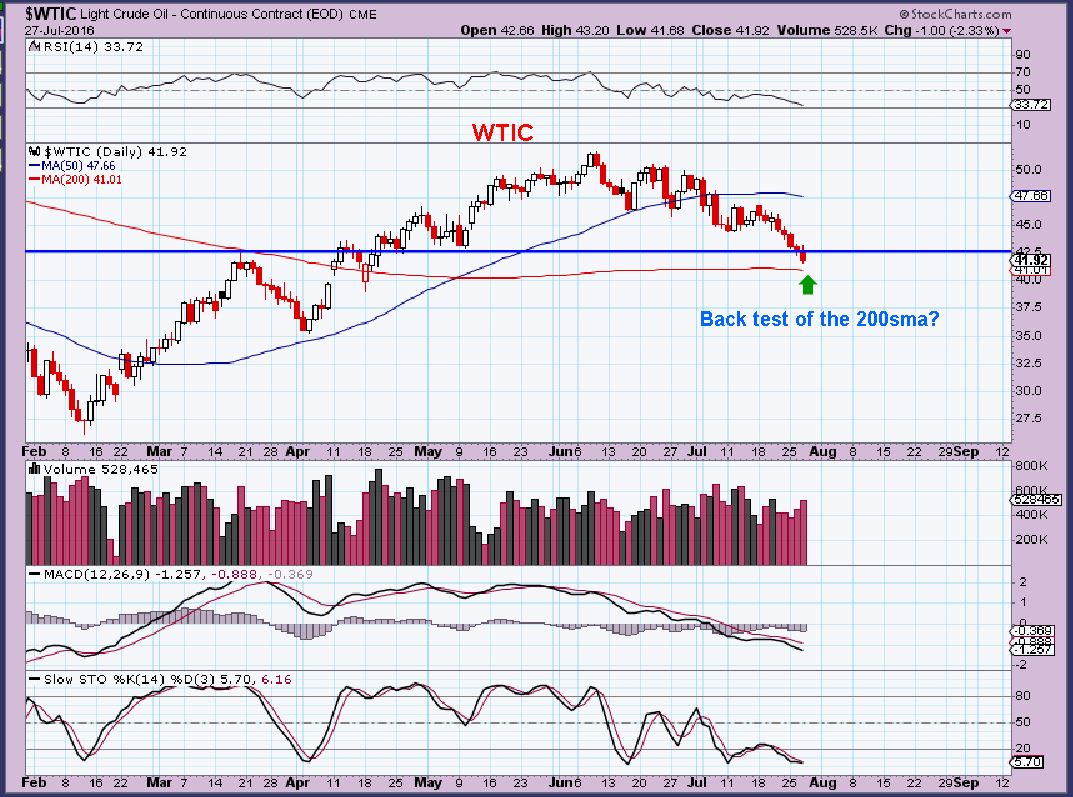
WTIC – I am still getting requests asking, “Is it time to be buying Oil yet?” I look at Oil daily, so I wont miss it when it is time, but for now Oil needs to show a sign of strength first. I had requests 3 weeks ago about buying Oil & Energy, and now we look at the chart and we can be glad that we have been patient. Oil remains weak and though it is close to the timing for a cycle low, Oils cycles can really extend . Lets wait for the chart to show us a sign of strength. Maybe simply a test of the 200sma is what OIL wants to do. Watch $41.
.
GOLD, SILVER, & MINERS
Even though we have been patiently waiting for a daily cycle low here, I have advised holding positions too. The ICL was at the end of May, so timing-wise it is early enough that the pullbacks could be held and positions could be added to at a sign of strength. WEDNESDAY WAS THAT SIGN OF STRENGTH that we were looking for. WEDNESDAY was the buy, but it is not too late to add if you were at work and missed the pop. I’ve also noticed that SOMETIMES the day after the POP can be a small drop to scare weak hands out. We can view that as an opportunity if it happens. To the charts…
.
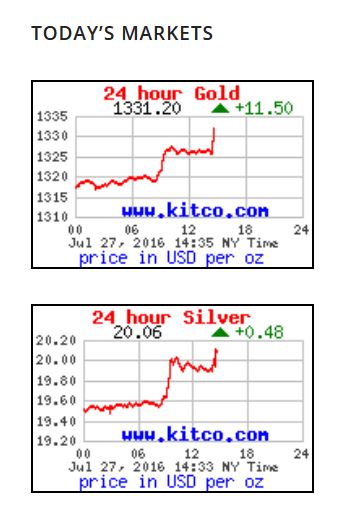
2 GOLD CHARTS from Wednesday mornings report. We saw divergence starting and the blue circle would be a safer Buy point.
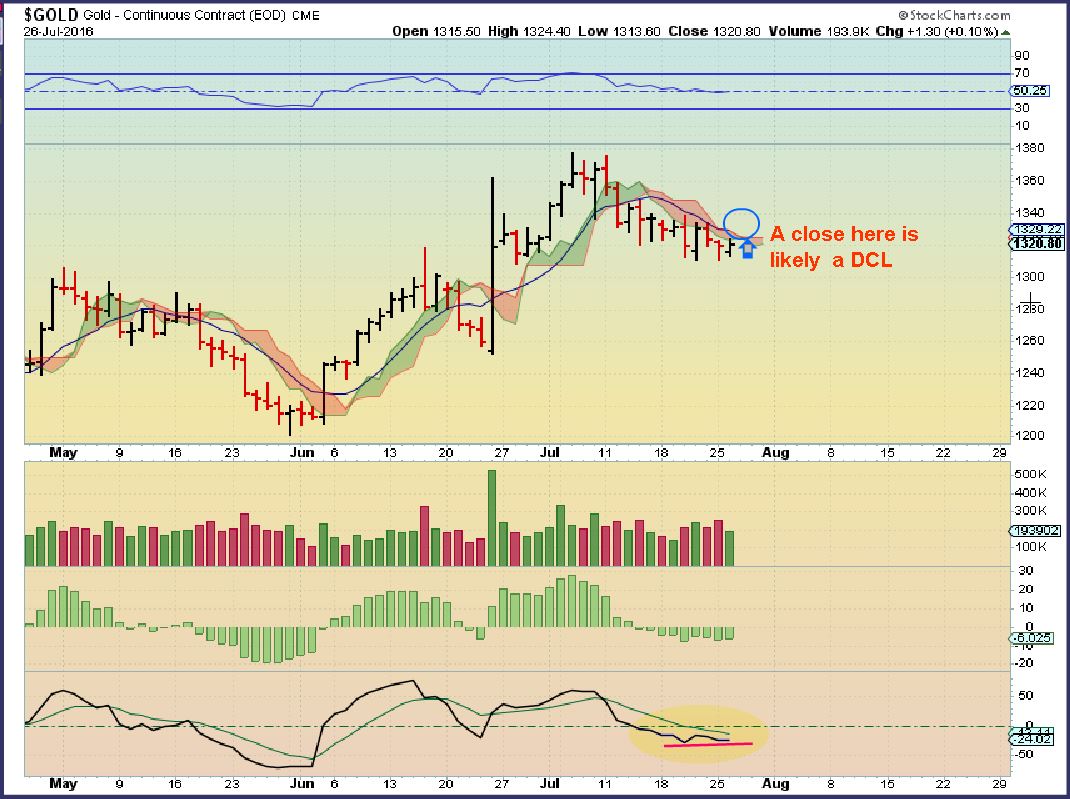
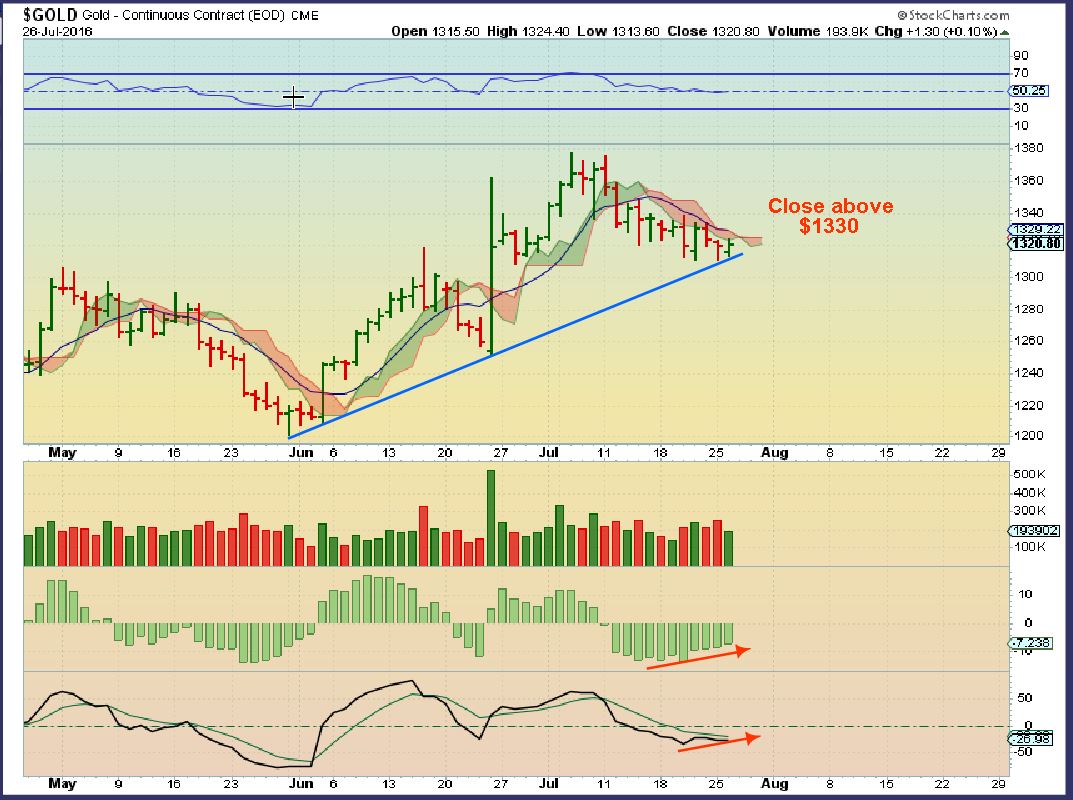
So it would be a buy closing above $1330
GOLD WEDNESDAY – this was POST FED after a quick shake out. It continued higher from here.
.
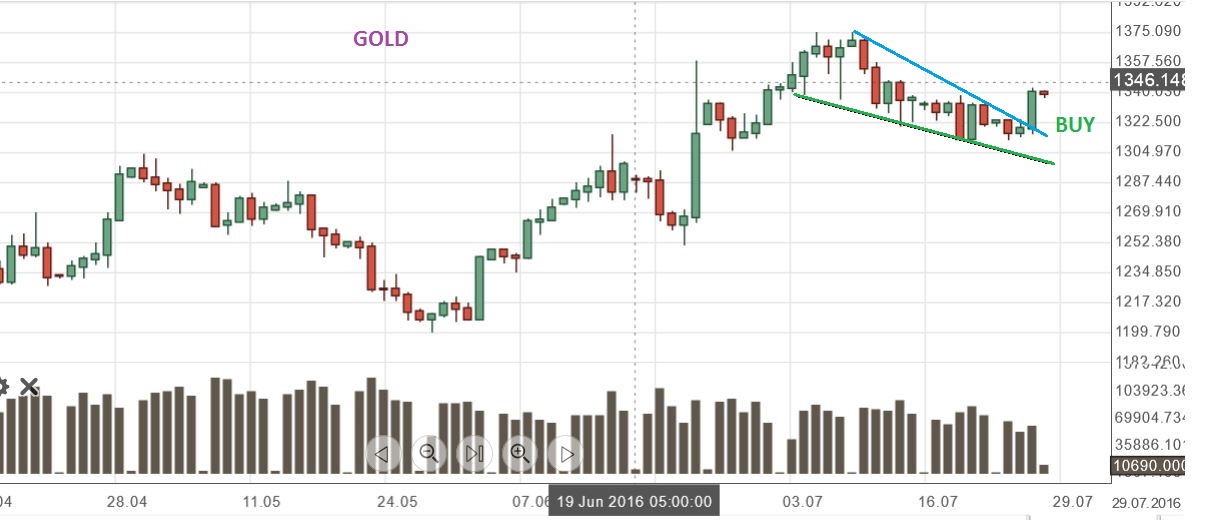
The STOCKCHARTS chart of Gold doesn’t show the close, so I’m using a different chart of Gold. You can see the clean and clear break out
.
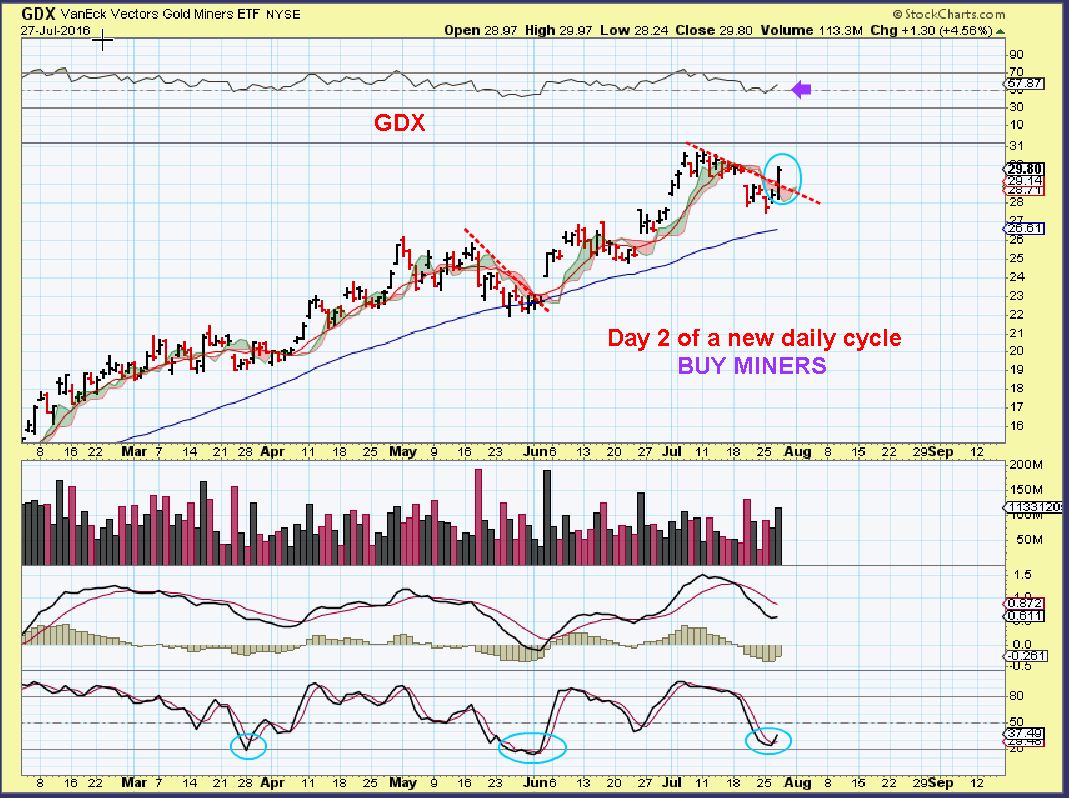
2 GDX CHARTS from Wednesday mornings report, showing the point that we would have further confirmation of a DCL in place. A close roughly above $29.50 would constitute a break out
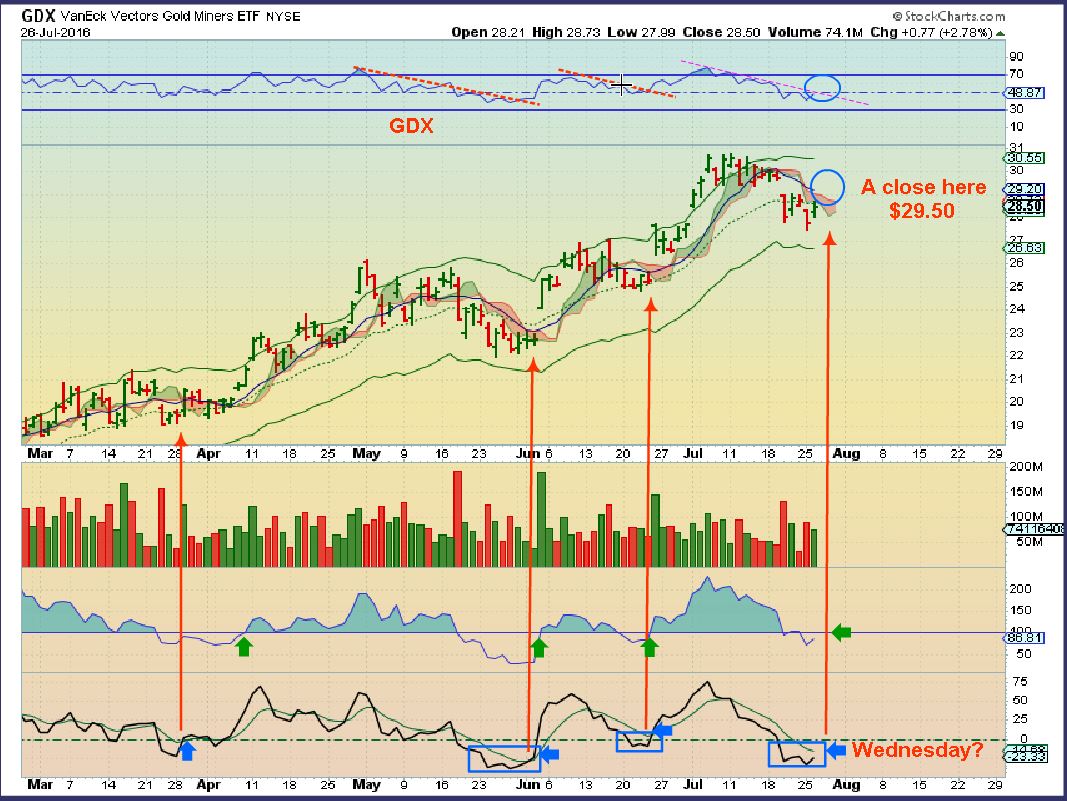
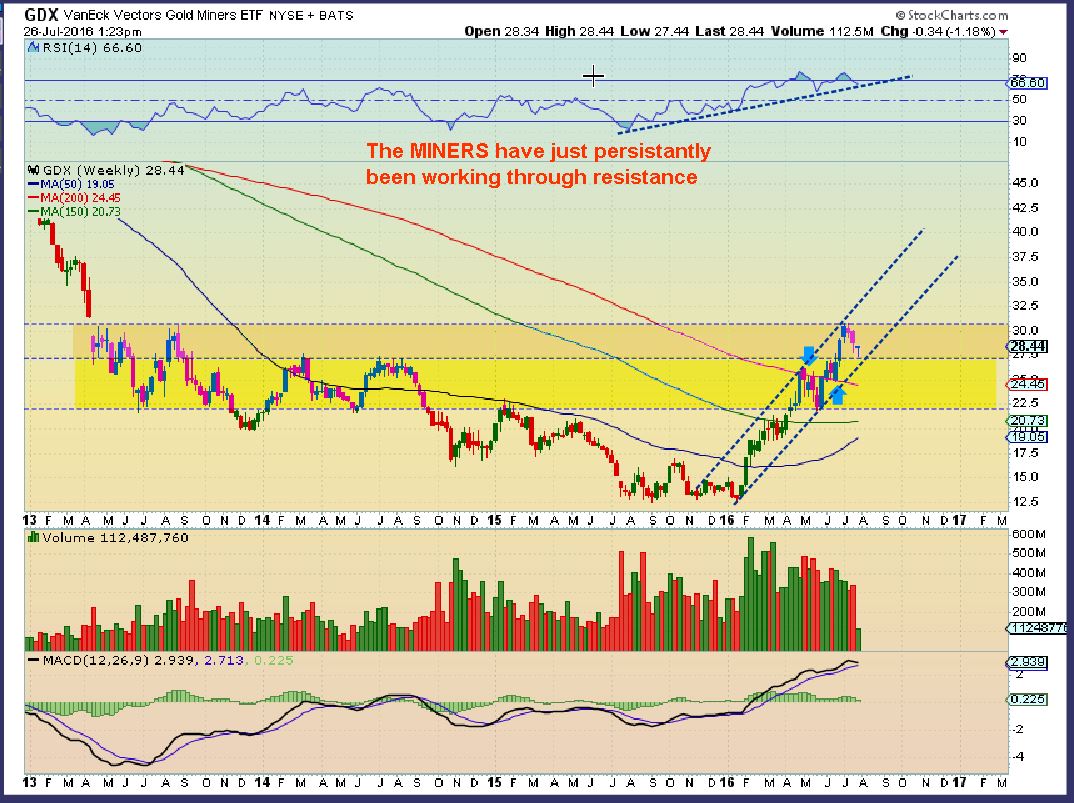
And I wanted to point out that we already see a back test of resistance on the weekly chart, and we were near the lower channel line.
GDX POST FED – GDX almost tagged $30 ( $29.97). This is a nice break out from the down trend line. We are likely only on day 2.
.
So some are still holding core positions from the Jan ICL, or MAY ICL, others trade in & out and may still be holding positions since the end of May or early June. New trades will be put on when others go long the GDX or GDXJ ETF ( or NUGT / JNUG -but those are high risk leveraged vehicles for the experienced traders), and some bought yesterday or will buy individual Miners. I’ve been showing various set ups in Miners in the recent reports as they’ve dropped. We will review a couple of those set ups, and then look at a couple more Miners, to point out the idea that they are all looking like they’ve bottomed. Yes, Even GPL jumped almost 10% Wednesday.
.
AUMN – This was a nice set up pointed out in the Wednesday report. Break out and back test.
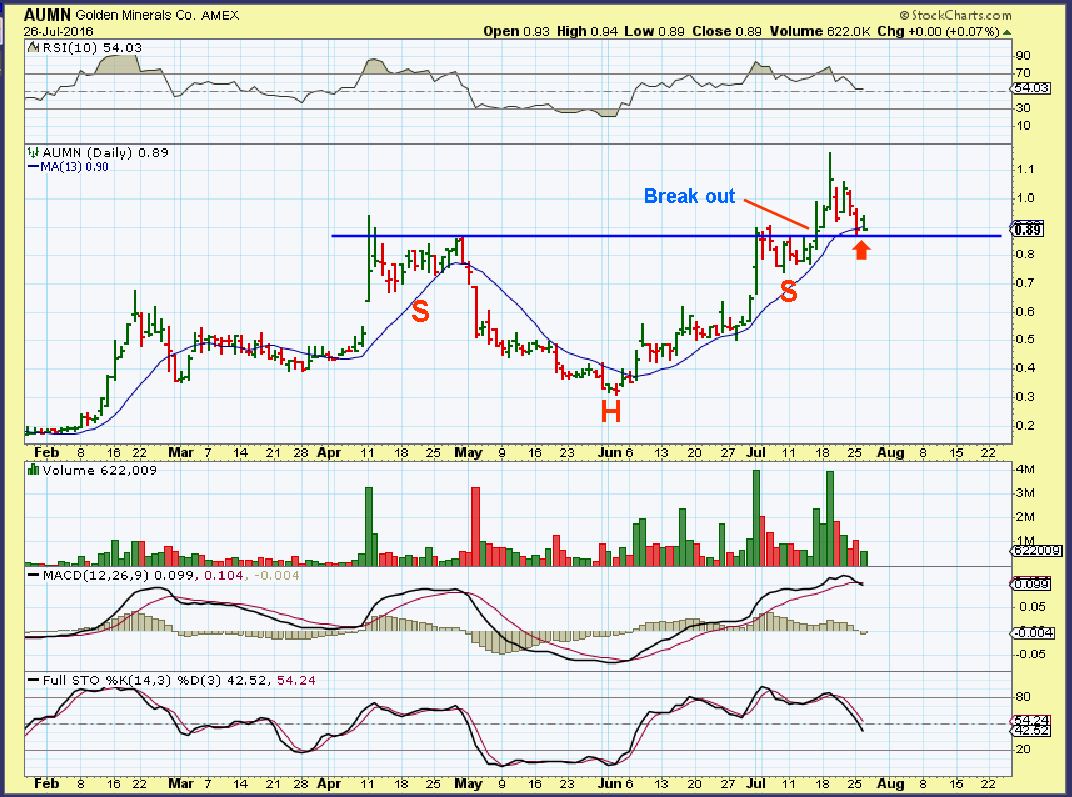
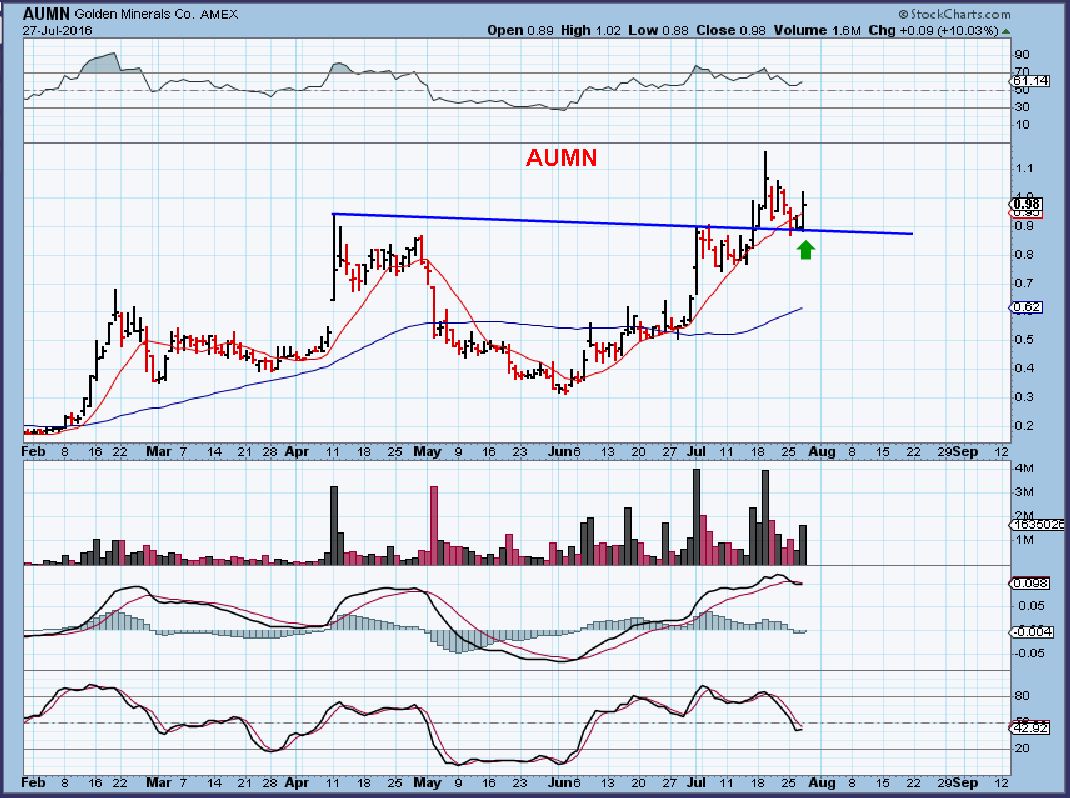
AUMN – Now that the dcl is in place, this could have been bought on that support almost all day long. It is still a buy right now in my opinion, this stock moves quickly when it gets going. It ran up 14% in the final hour of trading Wednesday, and closed up 10%.
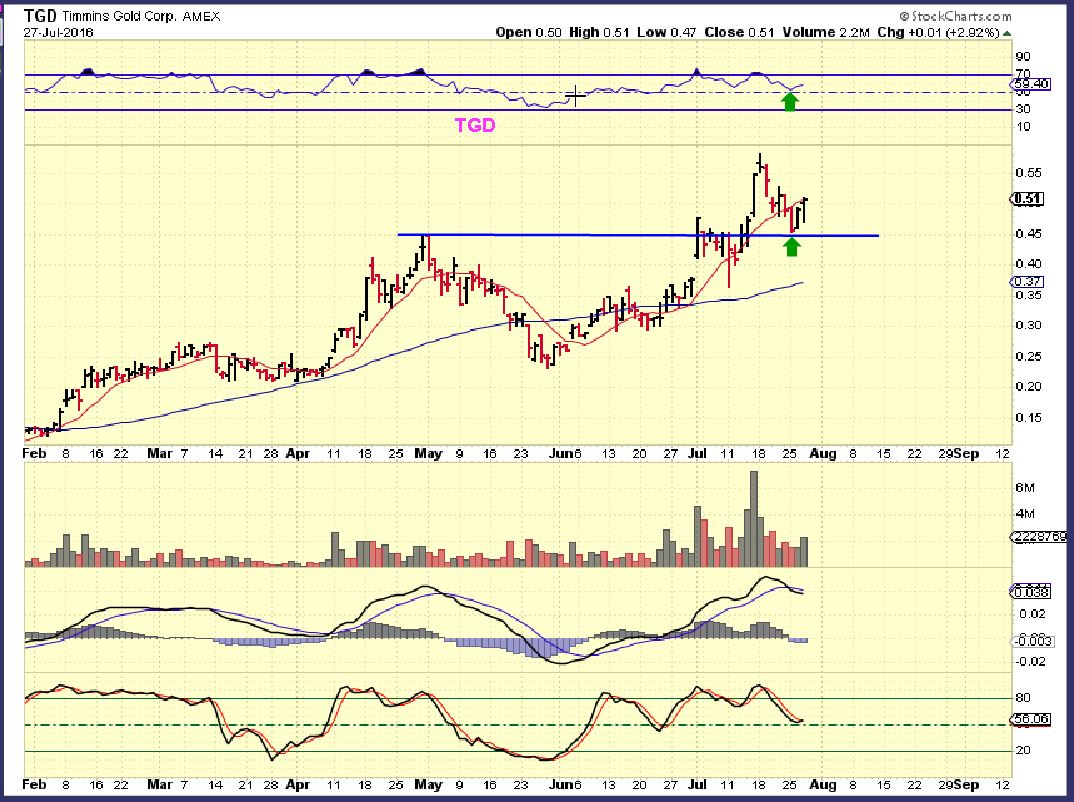
TGD – I pointed out the same type of support. In a Bull Market, it is amazing how clean technical analyses often plays out. This could be bought with a tight stop too, but coming into the FED WEDNESDAY, it is a tad riskier due to possible shake out action.
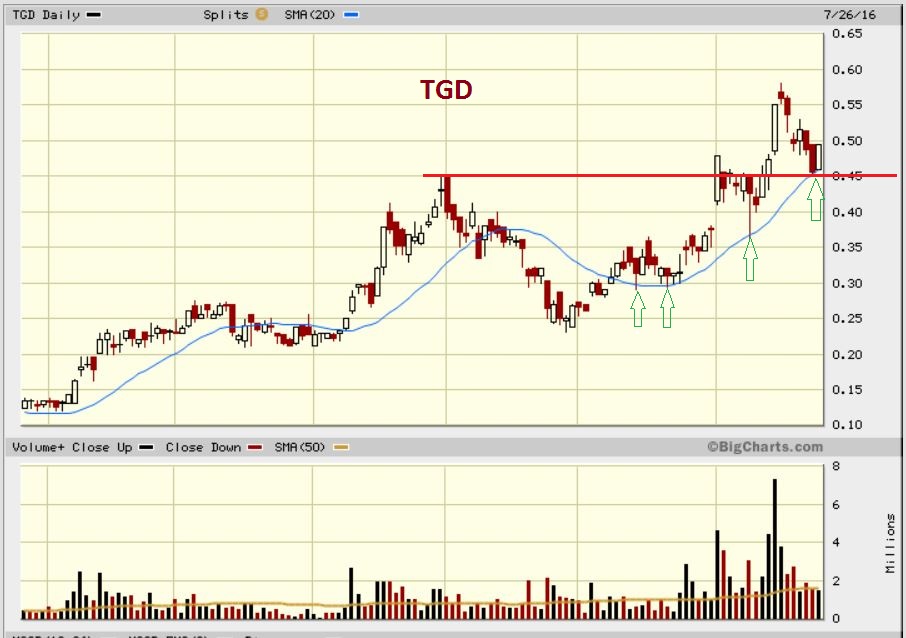
TGD – So TGD is a bullish set up, though it only closed up 3%. Consider that it was down earlier in the day to $0.47 ( Still above support) so it really moved up 9% off of the $0.47 lows. This is still a buy, since it hasn’t really taken off.
.
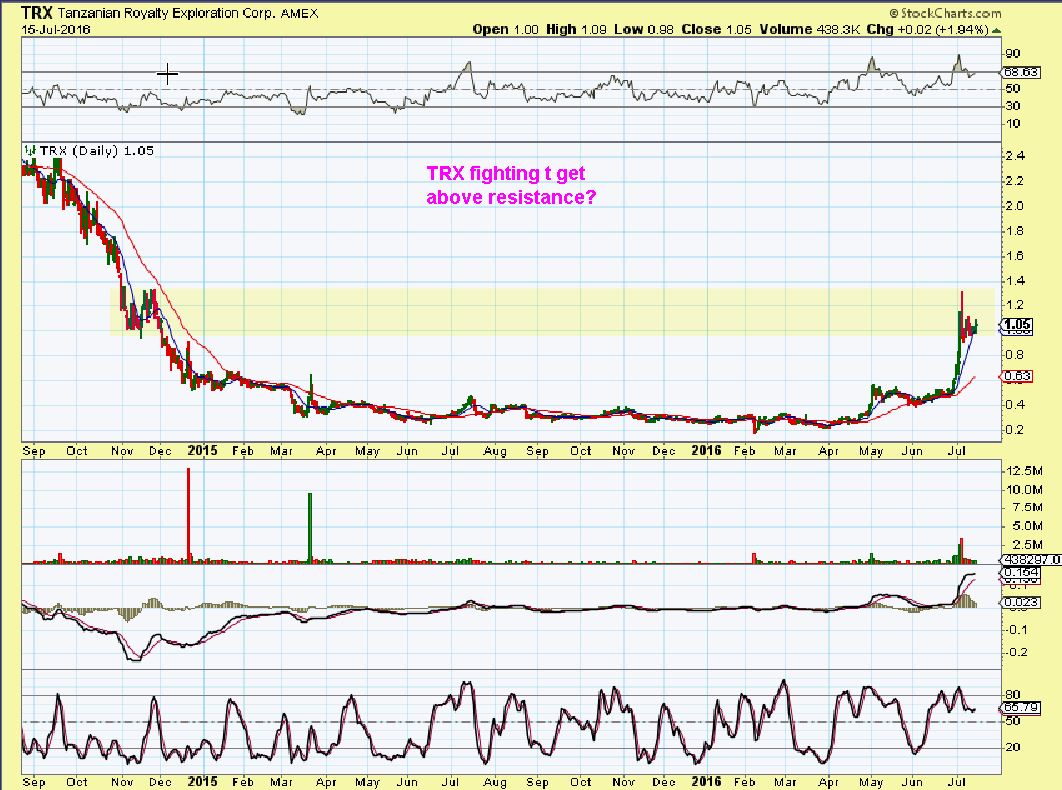
TRX – Breaking out moving 14% Wednesday. It’s a tad bit of a risk to add here, but honestly this could really get running. Look at the run from June 29. It ran about 100% in 4 days.
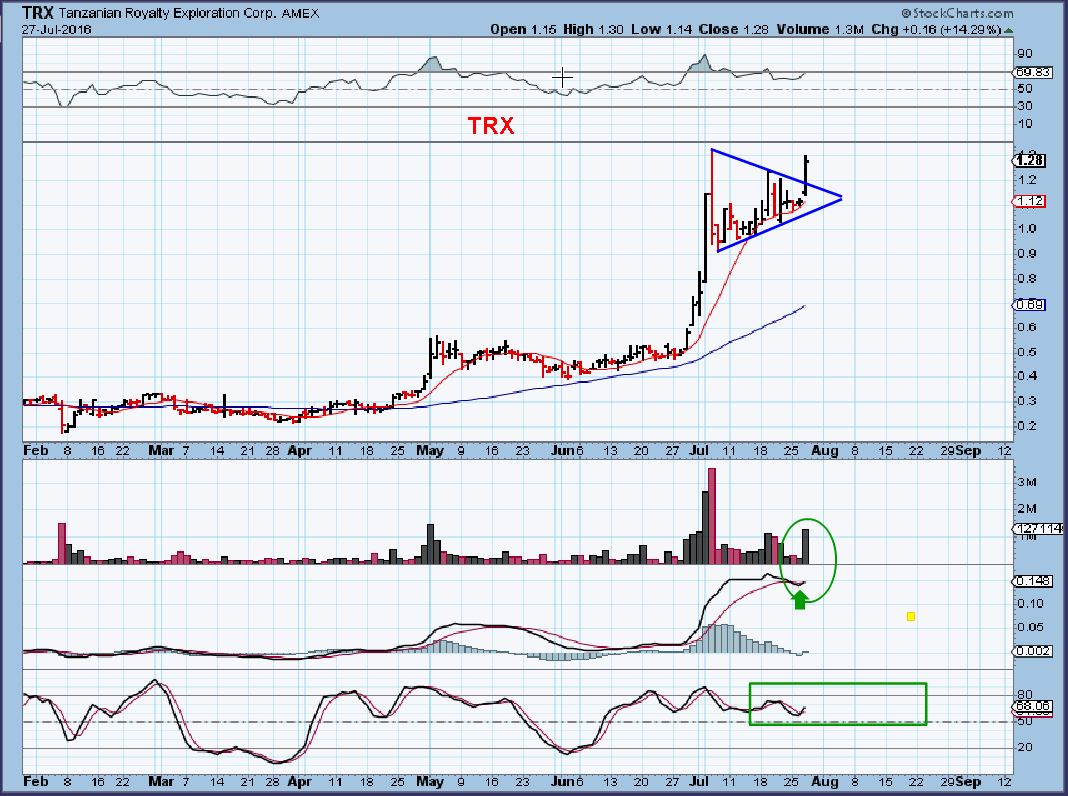
I believe that the upside potential is great, so I own it, and I’m not in a hurry to unload it. I will probably take some off as it rises, but hold what I bought below $0.50 from this beautiful base as a core position.
.
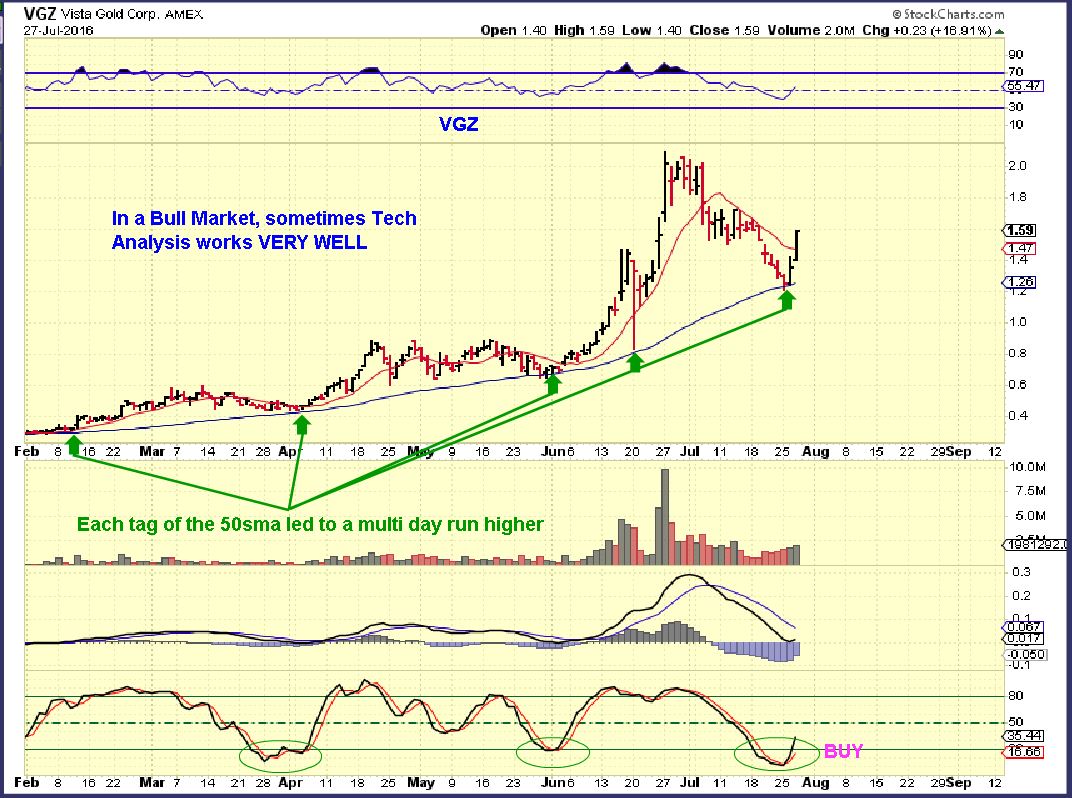
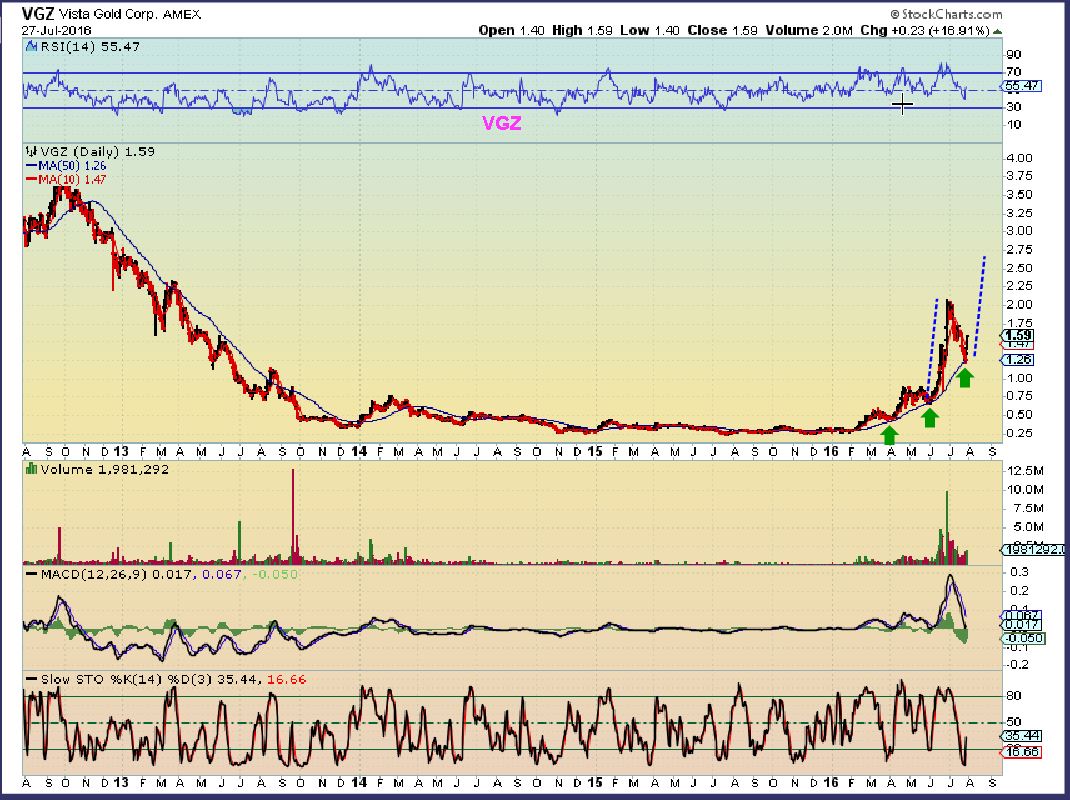
VGZ – This is another one that can really get going, and I’ve pointed out the potential here.
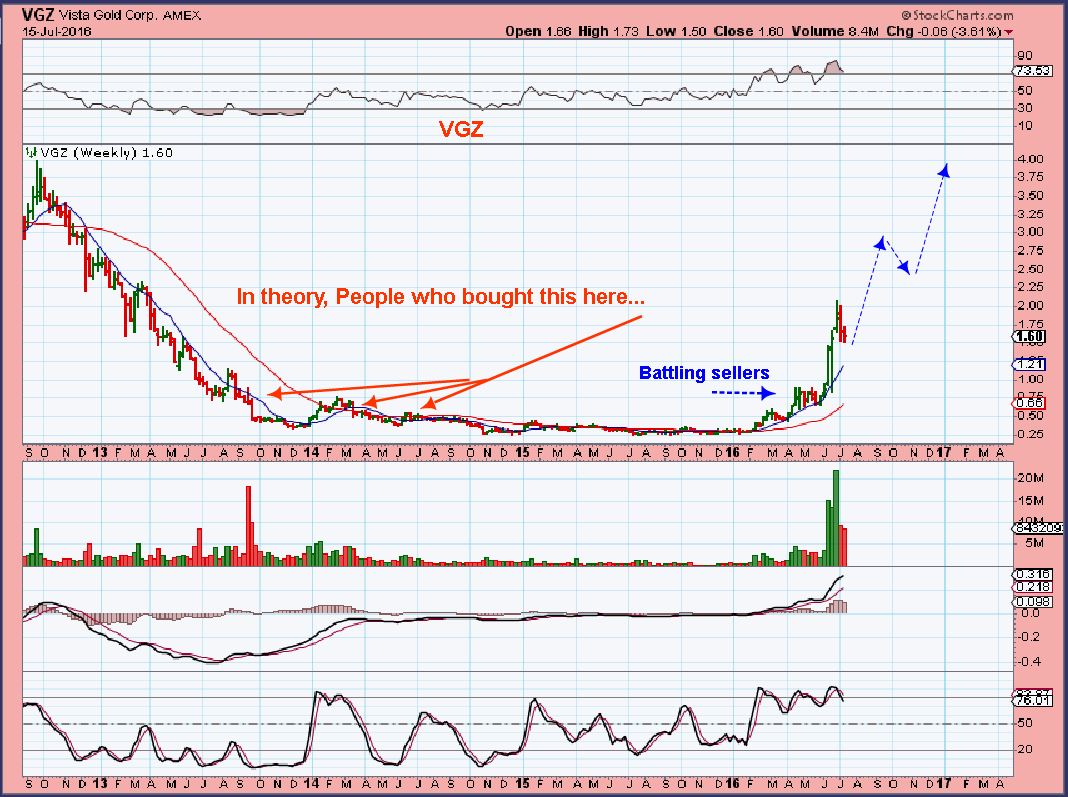
I mentioned it a couple of days ago as a good looking bullish set up. This is it currently. YES it went up 17% Wednesday, and was also up Tuesday, so it is up about 30% in 2 days. Is it done?? No way, just look at the chart. It may just be getting started again. I think it could be bought to scalp quick gains ( I added to my position).
.
VGZ did a perfect pullback to the 50sma. No guarantees obviously, but I could see this doubling from the recent tag of the 50sma.
.
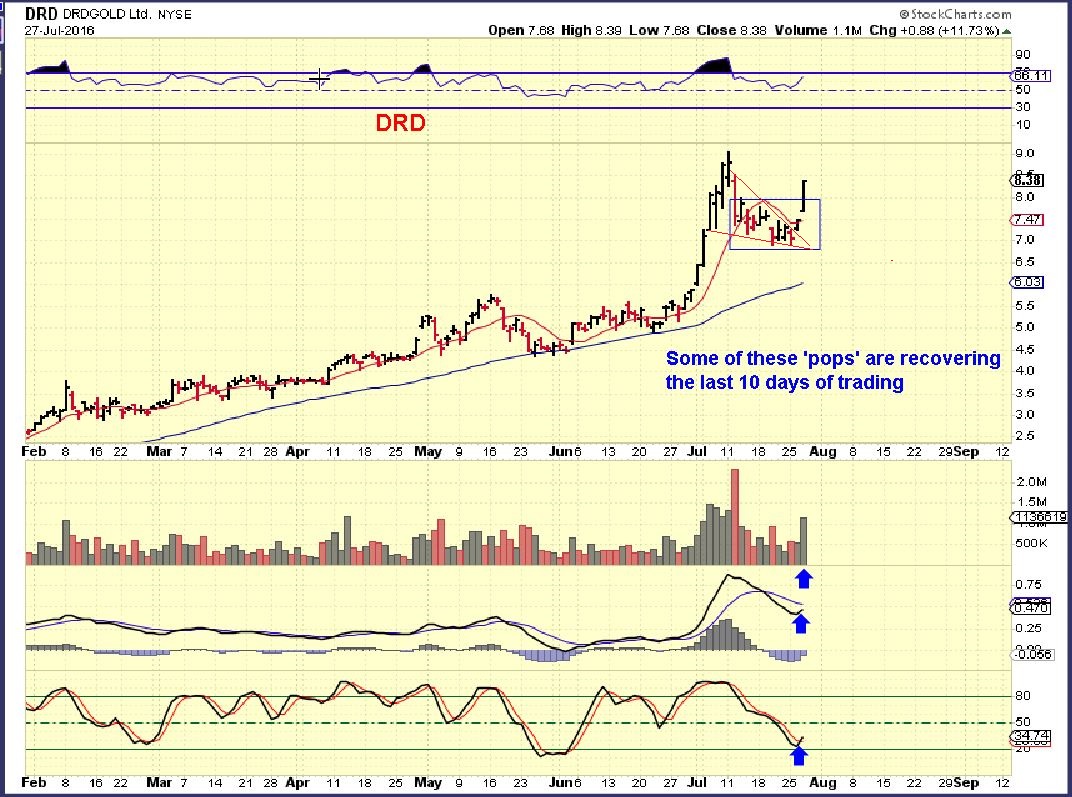
DRD erased the last 10 days of trading losses. If this back tests, it would be a lower risk buy, but I think that it could be bought here before it breaks to new highs too (Again, there is a small risk of a gap fill / tag of the red line 10sma).
.
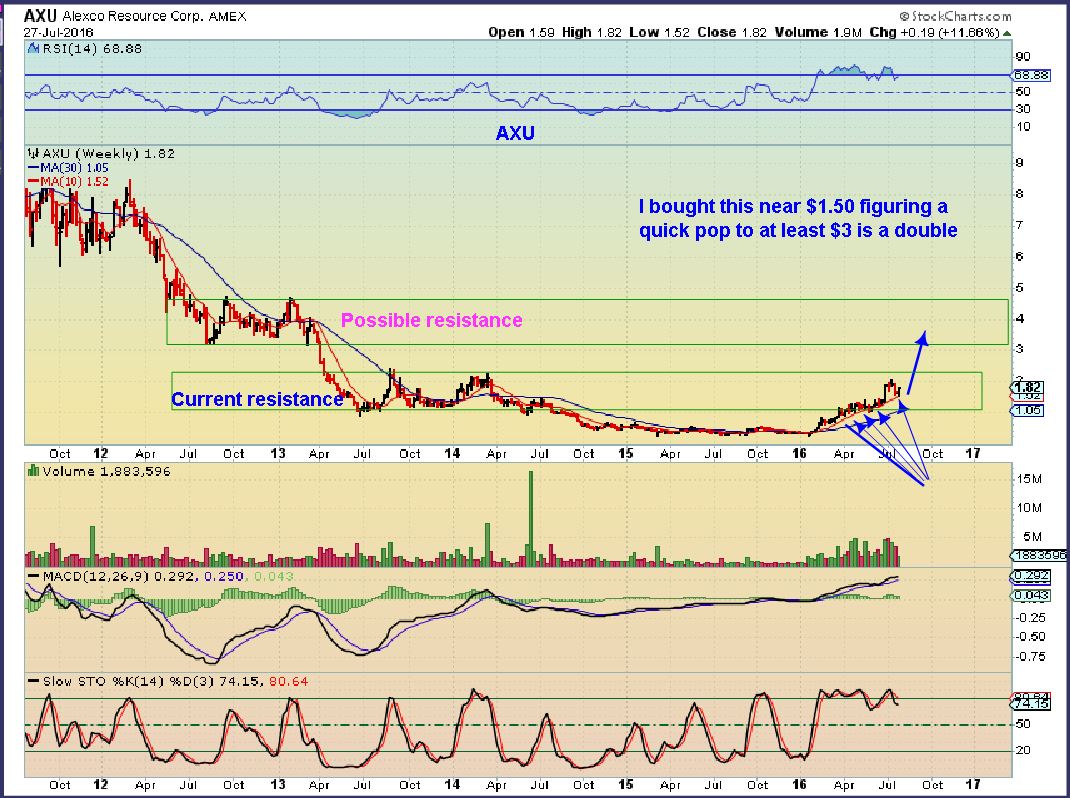
AXU – I mentioned that I bought AXU 2 or 3 days ago. It was sitting on the 50sma and got to oversold, I liked the set up. It CAN do a public offering in the future, since it has applied to have that opportunity to raise funds. I think they have a waiting period that has not expired yet, but I like the chart and will take that chance. It may just be that I hold it for this run, because…
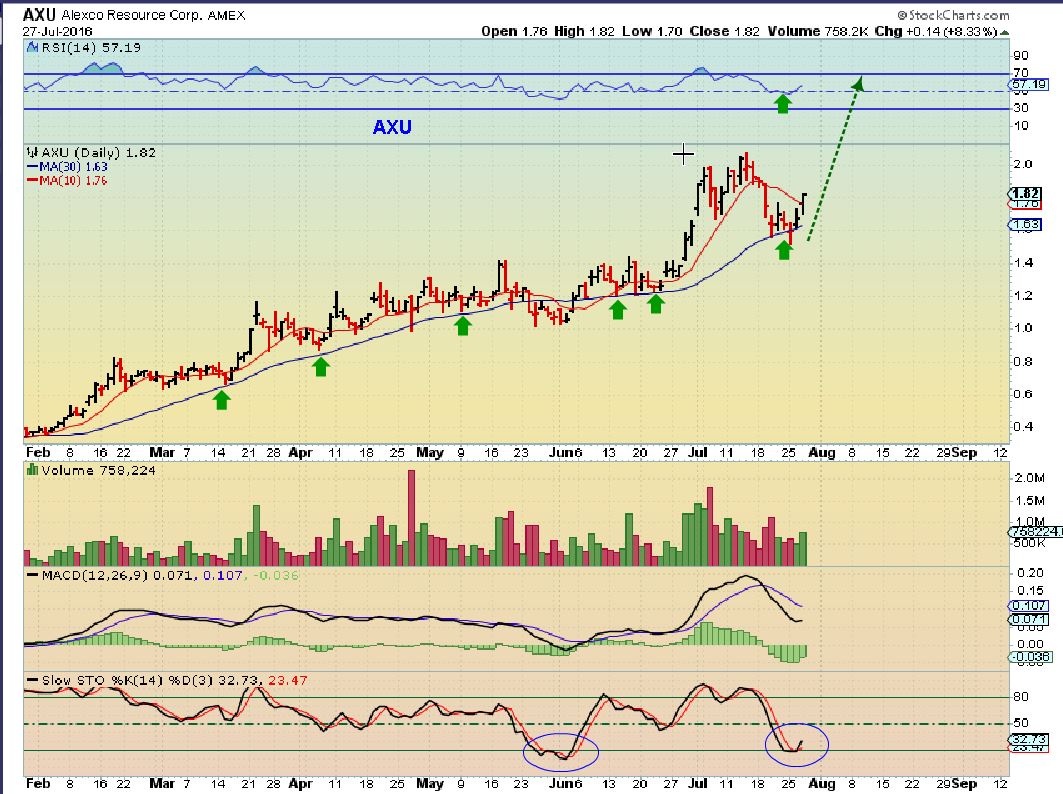
AXU WKLY – The potential is good.
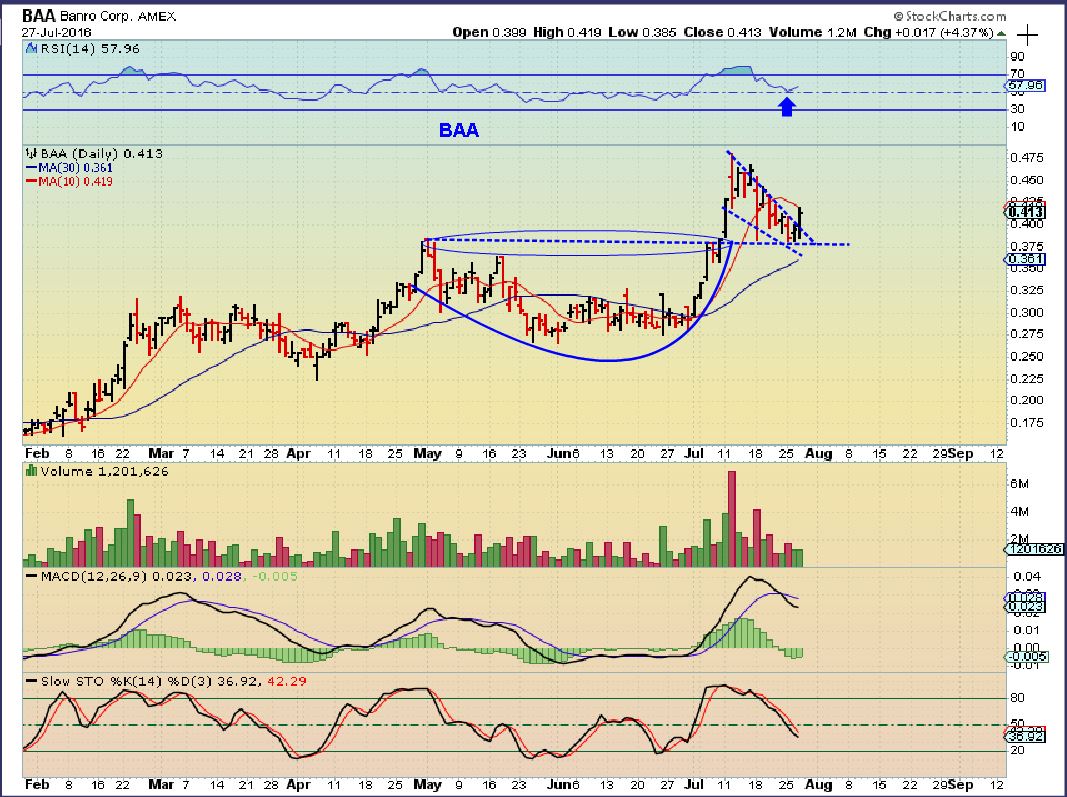
BAA – BAA was ‘only’ up 4.37%, but it too was down earlier in the day and moved nicely. This is a low risk entry and could run nicely.
.
BTG – An old favorite, this has been so solid that the pull backs havent even measured 38%. It is about to break to 2016 highs, also having good potential to run nicely. Look at the prior runs, they are slow but steady.
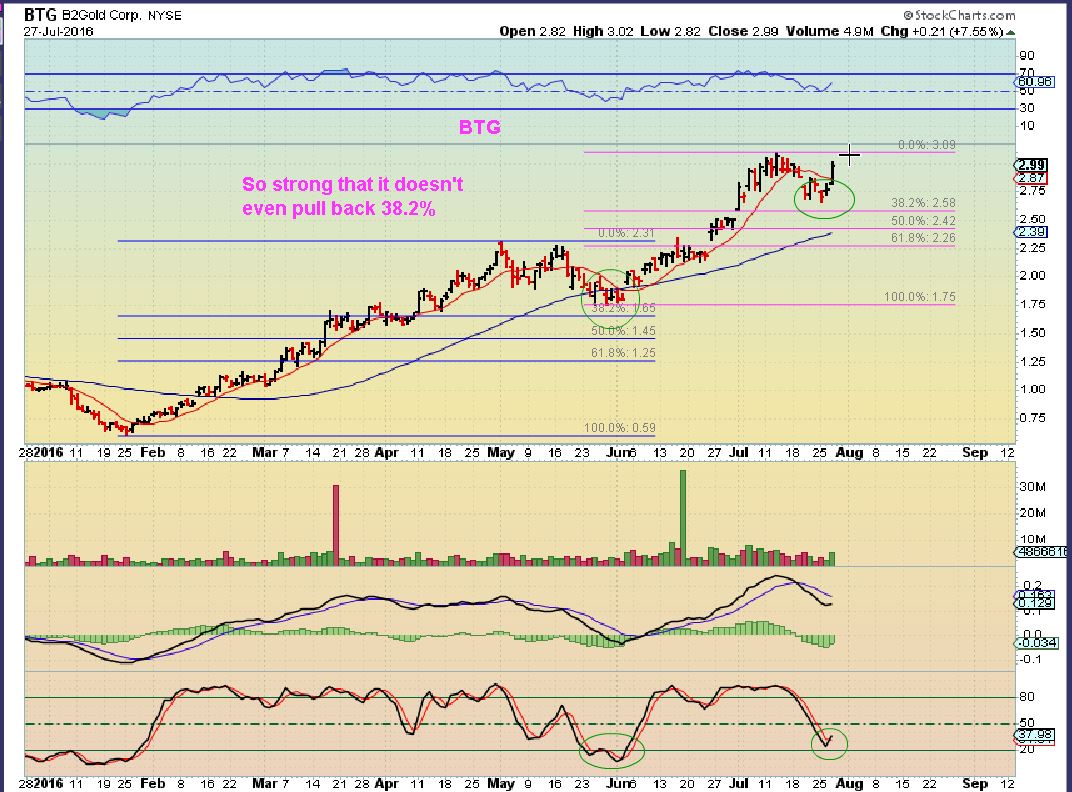
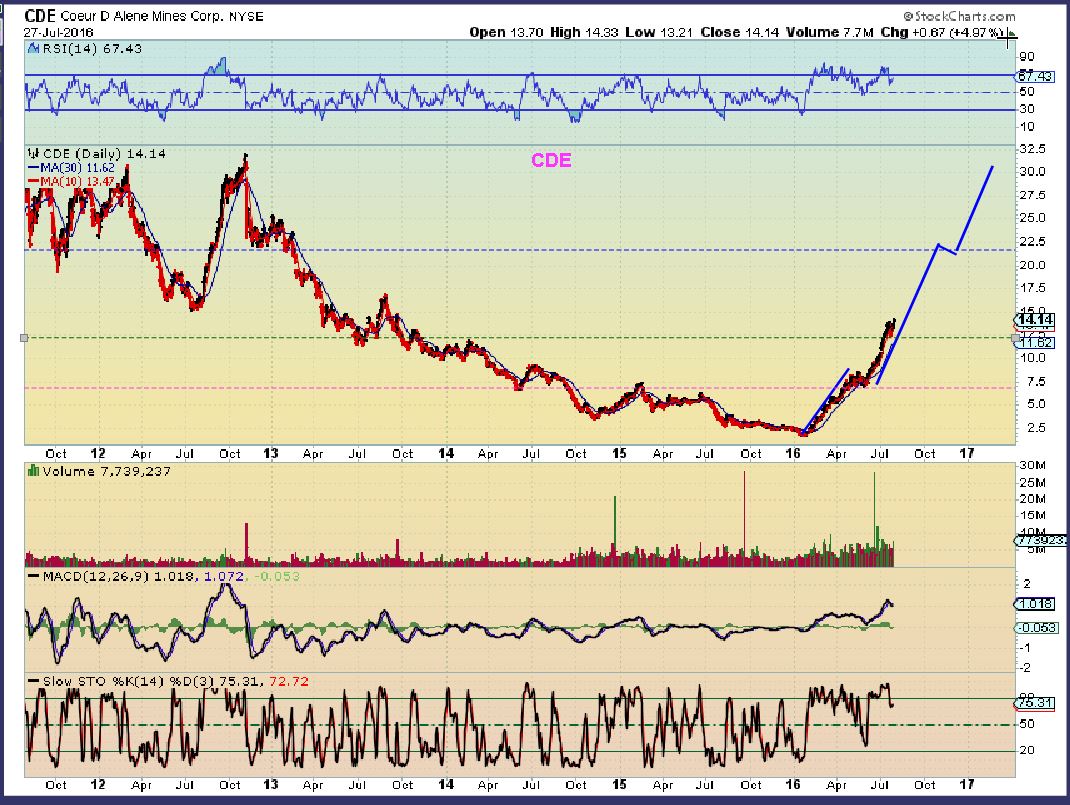
SLOW BUT STEADY can be very good, because price doesn’t get too extended and then needs to drop rapidly back toward a moving average. For example, look at CDE.
.
CDE– CDE really ran smoothly along, and held to the 10sma quite regularly. No giant pull backs to worry about.
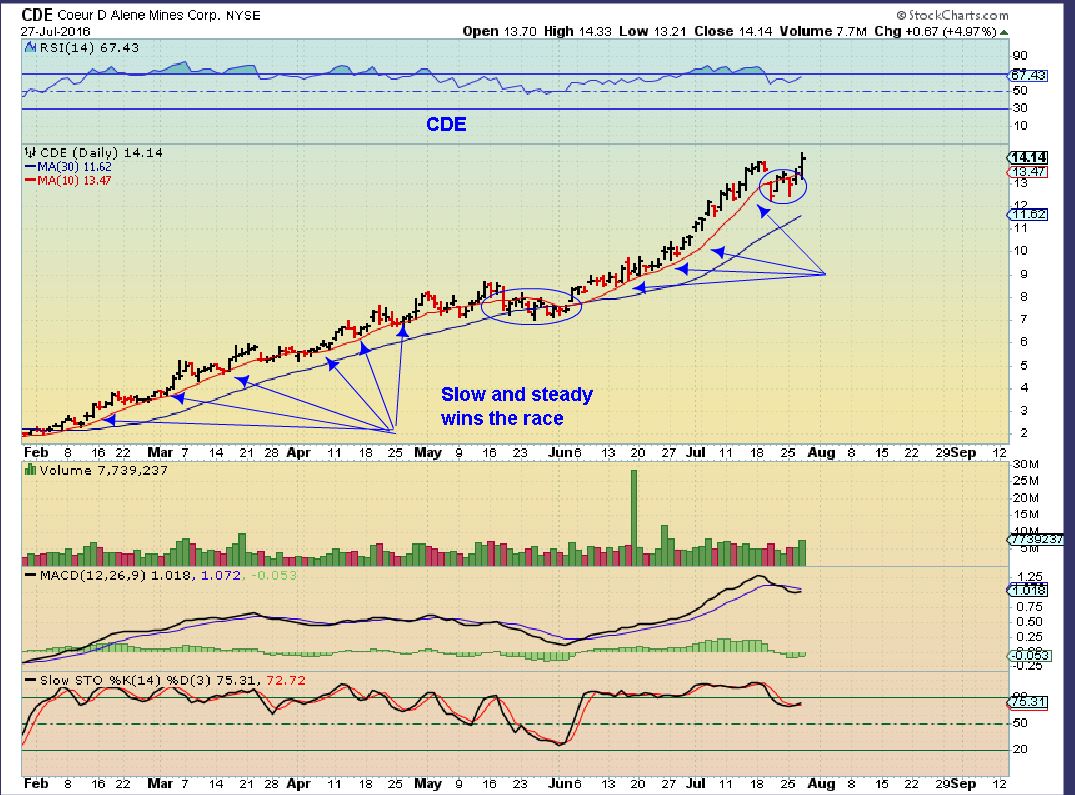
CDE – And it can just keep going if conditions remain favorable.
.
SO if we get a little pull back Thursday morning and you had cash that you wanted to deploy into Miners, that may be a good opportunity to do so. Maybe look for some that are still closer to support, but have moved nicely in the past. Some of these do look like they are just starting to run, and we are on day 2 for Miners. That is still early in this daily cycle, so I have taken position, even adding while they are on the way up. Hang on, it looks like we are ready for another run in Miners 🙂
.
~ALEX
.


Alex, Thx for the great reports and keeping us on the straight and narrow. Just curious if you have any opinions about some miners all ready at/near 2011 highs (guy.to, big, kdx.to, ogc.to etc) with $gold only sitting at 1340? The obvious answer is that we’re in a new bull—but given the rapid rise (some miners have wiped out 42 months of bear in only 6 months) do you think we’re in for a good correction and/or a long period of consolidation after this ICL? Hope your crystal ball is shiny today. 😉
Hi Deshy-
My guess would be that Some will put on handles to giant cups that they are forming, others may just break to new highs and without resistance, they can just keep going. Take a look at GUY.to ( or CA:GUY on some chart services) This could form a handle, but look at KDX.TO- that blew right by former highs on a 10 yr chart.
I think individual Miners will just continue to trade like individual companies most of the time, maybe they will be a bit heavy in times that the ICL comes into play. EVERY good stock does considation phases, so we will see it.
See AAPL, GOOG, AMZN, PCLN 10 yr charts and you’ll see current stronger stocks that didnt just go straight up.
hi ho silver too!
Yes
Hey Bill .. CLF ER Is in ! 🙂 http://ir.cliffsnaturalresources.com/English/news-center/news-releases/news-releases-details/2016/Cliffs-Natural-Resources-Inc-Reports-Second-Quarter-2016-Results/default.aspx
Looks good….. I think.
Yep up 6%
VALE:
https://finance.yahoo.com/news/brazils-vale-2nd-qtr-profit-120558953.html
Look good as well!
Read the full report here (make sure you are “comfortable” first as its a long one) http://www.vale.com/EN/investors/information-market/Press-Releases/ReleaseDocuments/2016_2Q%20_Vale%20_IFRS%20_USD_i.pdf
Thanks Crystal, i’ll take a look. “Lazy-boy reclined” 🙂
Just skimming so far, looks ok to me.
I’m no expert by a long means, but I think I’m the case of Vale, cash flow is important. I took a screen shot of page 65. I like the numbers 🙂
I always scroll to the Outlook section first. This is great!
Had a proper look, yes indeed it is great!
Fingers were crossed, excellent news, thanks Crystal.
Yay! I just scanned it too. Vale looked good too. KGC and GG not good but I will still keep them in my core…I bought them so cheap. AUY and EGO report today too I think. HBM was supposed to report yesterday…anyone hear anything about them?
Will have to see how that effects KGC and GG stocks. Maybe we will have to be more aware of miners and their ER dates. ie AUMN on 8-4
When last earnings came out for GG and were bad, it dropped a lot and I grabbed a little. I remember that company from years ago and I just stubbornly wanted it. Well, in this bull run …all boats float and it recovered well. I only have a little but I will just keep it. Often I have noticed bad earnings and recovery shortly after. BUT…there are always the ones that go BK! I have had 2 of those since Feb.
Did you guys see the report for X? Compare that to last year. Wow, just WOW!! difference.
PEIX earnings out, and it is breaking out to new 2016 highs in pre-mkt. It has had a nice run.
That’s one hell of base there Alex 😉
Yes, it is .
I’ve kind of liked PEIX and GEVO lately for the clean energy sector ( Maybe CDTI too) , but I’ve been totally engulfed in Miners since May,
CDE had earnings, they must have been good, its continuing higher.
That is strong volume in NAK right out of the gate, so I think NAK is going to move higher and try to break to new highs too.
I have pointed out in prior reports that NAK has a great long base on a 3 yr wkly
apparently it didn’t like my ‘wipin up the rear’ comment.. .. giggle
giddyup pony…
Agreed. Been holding NAK for 10 days or so.
just got some AAU on sale!
BAA is getting ready to launch. (takkingggg its tiiiimmme).
VERY BIG volume for TRX in the first 15 minutes.
( My prediction? See opening picture : )
Good morning Alex. Great report:) Just have a niggling issue that I was mulling over and I’d be grateful if you and/or anyone else in the room can provide insight into re: cycles. I recall you saying something like you’d go into leverage during the first & second daily cycles and then remove leverage during the third daily cycle (or something like that)? And how does this play into the intermediate cycle dips which are harrowing (do you only hold a small core or go cash)? I realize this is a complicated issue, especially as I’ve got nice core positions that I’m planning to hold through the bull. Just wanted some ideas as to how to put it all together. Thanks:)
Hi kathleen
Let me explain what I have done, and also let me just say that I do not recommend this approach for everyone. there are some that cannot stomach seeing their account down on a bad day. NUGT can drop 10% or 15% even when things are going good on other days.
That said, I look for the ICL, and when I am fairly confident that we have one ( And as you’ve probably seen, I am pretty good at catching the low by a day or so), I take NUGT and ride it for around 2-3 weeks ( Thats 15 trading days) and also hold other Miners that I will not let go of. We usually start a dip into the first DCL after lets say 16-20 days in a bull market, so I am often out of NUGT or leverage by then. Then I look for the DCL and would go into NUGT at the DCL and ride it again in the 2nd daily cycle for 2 or 3 weeks. I’d also be holding other Miners again. After a dip into the 2nd dcl, I buy Miners only, because often the 3rd dcycle tops after ( lets say roughly ) 8-13 days.
Why didnt I buy Nugt this time? I have been finding the giraffe stocks and they have been running up 100% in 4 – 6 days. These are special set ups that do not come around all the time, so when I find them, I focus on them. They are a leveraged move all by themselves. ( VGZ, TRX, MUX, THM, XRA, AUMN, etc were those explosive moves as we were coming up and out from the May lows).
VGZ tripled, MUX doubled, TRX tripled plus since early June, THM tripled, etc etc
I hope that helps, but it is a style that I developed for myself, and is volatile and not all can ride those daily swings with confidence.
Then what? When third cycle tops?
.. annnd then …. he sits on his gold throne .. reads the paper, and uses his dollaholla Tp to .. well ..
Oh Wow, Those look like my Under Armor socks too!
Nice tough with the chart on the front page of the paper.
Funny! I had forgotten to refresh…but when I read what you wrote Maria, I thought there would be a surprise picture!
He’s reading about giraffe necks.
At the moment, we’ve just started the second daily cycle, right?
Thanks for the detailed reply, Alex!
This is great information, Alex – while we’re on the subject, please let me ask some more:
Can bull Gold/PM Intermediate Cycles have either 2 daily cycles or 3 DC? Do you expect this Intermediate Cycle to have 3?
And here’s my really dumb question: Must the bottom of the next IC stay above the last ICL of 1200 in order to remain in a bull market?
There are no dumb questions, it just falls under the ” This is unknow, so why not ask?” dept. 🙂
The intermediate Cycles can have 3 or 4 daily cycles usually. occasionally you might see 5, but there would probably be a small one or two in there for that.
The next ICL really should drop and hold above the last one. If you look at the HUI from 2000 to now, when in a bull, they were higher lows, B-U-T 2004-2005 had a long consolidation period that was kind of close.
2008 -2012 was a steeper climb and higher lows for sure.
Alex,
Off topic, but when you get a chance take a look at MJNA, that’s some base too, just sitting on 4 cents lately, think these stocks like to move after elections too.
Hi Steve,
I used to watch MJNA, ERBB, HEMP, CANL, ( GWPH – The better one) , PHOT, GRNH, and many more.
When the legalization of medical marijuana came about, and dispensaries started up, these things were ROCKETS. They may have their day again, and yes…right now many have fairly steady bases ( I have also seen a few go BKRPT, so be cautious until demand picks up).
They may have their day in the sun again in the future, but I can’t tell yet which will perform the best.
holy ugaz
Maria, if you were/are in UGAZ would you sell or hold?
F.W.I.W. – I would hold
Thanks! – (I broke my oath against 3x etfs 🙂
You picked a good time to be weak : )
I had that oath too…let me know how you do….maybe I will get brave again sometime.
wait what call? lol
i did not have ugaz.. just saw it this am before I left – but – yeah what CF says..
BOIL is the 2x ETF for Nat gas. Its a bit low volume but bc gas moves so fast, it is a little safer and has less slippage then 3x UGAZ.
Nice drop in Precious metals…Gap fills and buying opportunities in my opinion .
XRA, performing well in todays decline and finally breaking back over the 20sma.
I noticed as well, she’s been slow to react recently.
Alex- I think I have been holding IPI too long. Is this a bust here?
Hi Dasoldenburg
Thats a tough one. I looked at AGU, MOS, MON – Not too bad. I looked at POT, not good today.
IPI is in the middle. I didnt want it to trade below the 50sma when I was in it, but it keeps dipping below and recovering.
At this point, it is just a long base that is trading between $1.00 and $1.50 ish
It honestly still doesn’t look tooooo bad, and even looks like it has divergence in the MACD histogram, so I cant really say to hold or sell it based on what I see right today. It’s rather 50/50 at this point, but it has not broken out the way I expected it to back when it was near $1.10
Personally, If I owned it, I would dump it if it goes under $1.20 and put the money in a Miner that is looking good, but not too extended. Actually, I am me- I did dump it to put the money in a miner already.
lol, good point : )
I have that too…unfortunately slightly above the $1.50 of the range you point out. I think I will watch it a little longer. Earnings Aug 8
Looks like IPI is breaking down from a raising wedge……..
I’ve been surprised how well SN has held up the last two days with oil’s drop – they must have some NG plays…
Wow .. Look at their hedges—I took a screenshot of their ratio of NG hedges to oil from the last investor presentation
http://www.mlpassociation.org/wp-content/uploads/2016/06/Sanchez_Production_Partners_Presentation.pdf https://uploads.disquscdn.com/images/549cdd7059841ea227cd7b8604e8e7b9c39b3583119c0a371ae43c0197e8587f.png
some of the oil stocks must be hitting their stops today – BTE, BAS, BCEI, GLF, JONE, NADL, SXC, TPLM, WLL – wow – a long list getting roughed up.
Anyone else notice that the markets sell off at 10:30 and buy back at 1:30? What could be the reason?
WS Big boys taking a long summer lunch break?
Ha, Funny! I thought about lunch, but why the sell off?
So, here is another idea. This comes from a cubicle neighbor’s son, who has some financial job. When the trading day starts the computers need some time to assess and grab data. So after an hour of going up they sell their holdings from the day before, thus driving prices down. Once the computers see a buy point (1:30), the again buy large blocks of stocks and drive the market up . Repeat daily.
Everyday, brother. I time my guys according to it. Intra-day your trend sets up first 30 min, runs btw 10-1130, countered through lunch then resumption of trend btw 1-1:30 and into the close. Watch SPY and NUGT, they’ll both do it. Maybe not 100% everyday, but if we have a down day and you buy bounce during lunch sell by 1PM cause its going back down or if up day buy the low at 1230 and watch it return higher all afternoon. Clockwork.
Exactly, what’s the reason?
No sell off Today. Nice ride
Alex, is there a reason you don’t reference the HUI charts in your reports? I don’t think i’ve ever seen you mention it, yet other seem to put a lot of weight in it.
Just looking at the monthly, its about to regain the 200MA and then zero resistance to 400? Or maybe i’m way off and reading things wrong. If you have the time, what do you make of it? Thanks.
Edit: Shoot me if being simple, TA is all new:)
Hi DAZ
You’re not way off, there is a lot less resistance over the hump.
As for HUI, I do use the HUI or XAU charts to go way back to 2000 – 2008 run in Miners, because GDX and GDXJ were not around then. I dont use HUI and XAU for current moves because they dont show volume.
To me, no volume on a chart is exactly like asking me to fly an airplane without a gas gauge. How far will it go
before it runs out of gas and drops? Volume analysis isn’t always 100% predictive, but I use it in everything. I need volume to see supply and demand in some form.
Rodger that boss. Makes sense.
Every day is a school day………
You know what is odd though. I knew a guy that COULD get volumes on the HUI and XAU using a special Bloomberg set up. he paid a lot of money for it, but I always wondered, if the volume is available, why is it not available to the regular guys?
Alex, What do you think of PPP, PZG, AAU? I sold some Vale today because I wasn’t too happy with the earnings but kept some for my core. Now, I have a little more $ to deploy.
Also, I wanted to re-ask the questions from earlier today both for myself and Kathleen… I got diverted by Maria’s funny picture of you on your gold throne! This was after your detailed explanation of cycles of gold. kathleenchow chartfreak1 • 7 hours ago
At the moment, we’ve just started the second daily cycle, right?
Thanks for the detailed reply, Alex!
nancytheartist chartfreak1 • 7 hours ago
Then what? When third cycle tops?
Almost all miners look set up now to miove higher, those 3 included at this point.
As for 3rd daily cycles…they are often (Not always) the top or peak of the intermediate cycle, then they roll into a dcl, the 4th daily cycle bounces and makes a lower high & rolls over into an ICL
Right! But I’m also looking for a bit of a change of character as well. Before if you found 3rd daily cycle start you waited 5-7 days then could ride DUST for 2 months. Maybe we’ll get more consolidation type moves than the old plummet off a cliff! 🙂 That would allow one to hold the core and maybe hedge a bit depending on the current charts.
Hi Alex … Trying to study cycle timing here too, like Nancy and Kathleen.
Yesterday’ report said gold:
– We are close to a dcl, and I think that a close in the blue circle will confirm that. If this is all part of the 1st daily cycle out of an ICL, it is day 40 today… OR day 4 with the low in place last Thursday. Peak on day 25 (R.T
When does it become more evident that we are in the 2nd dcl And not the first …thanks (and if we are still in the first dcl will this run be shorter than if this is beginning of the 2nd dcl?)
Added Muxie-Mux and BTG today. AUY has been looking good, imo.
Man, next time Alex says oil looks weak or so and so failed (referring to cycles), hit the short button (inverse ETF). I keep meaning to sell SCO but it just keeps going up; stop is crazy tight at this point, not giving it back. Which is good, near 100% in this and shedding VXX (that didn’t work out) will give me plenty of spending cash for next week!