
July 22 Weekend Report
I hope everyone is enjoying a nice relaxing weekend, lets review the markets and discuss our expectations for the coming week.
.
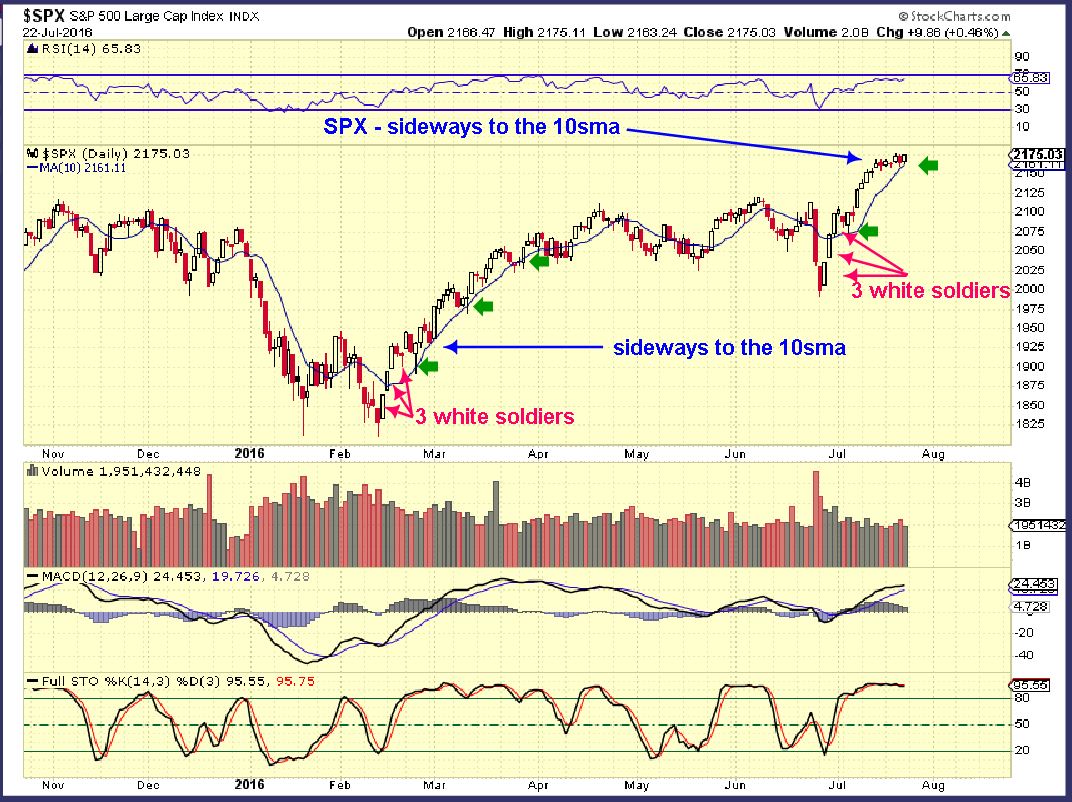
SPX – The break out that I expected after seeing the 3 white soldiers pattern is in play. Breaking to new all time highs get price above resistance, so a small sideways consolidation may be all that is needed before price continued higher. I expected a back test of the break out based on the VIX being below 12, so that still may happen.
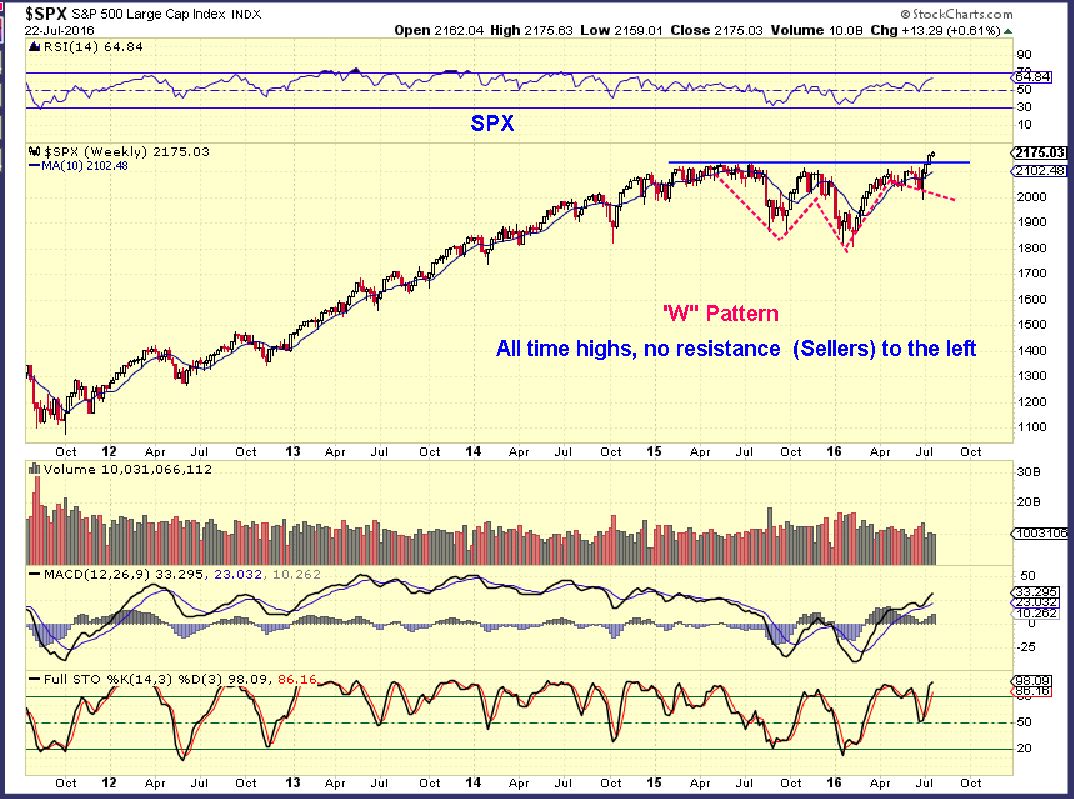
SPX WEEKLY – I know someone that is trading ( holding) UPRO and TQQQ as a result of me pointing out the 3 white soldiers, and they are doing very well. Congrats! I didn’t take that trade. The VIX is quite low at 12, leverage at this point may be a bit too much. Use caution.
Lets look at the NASDAQ…
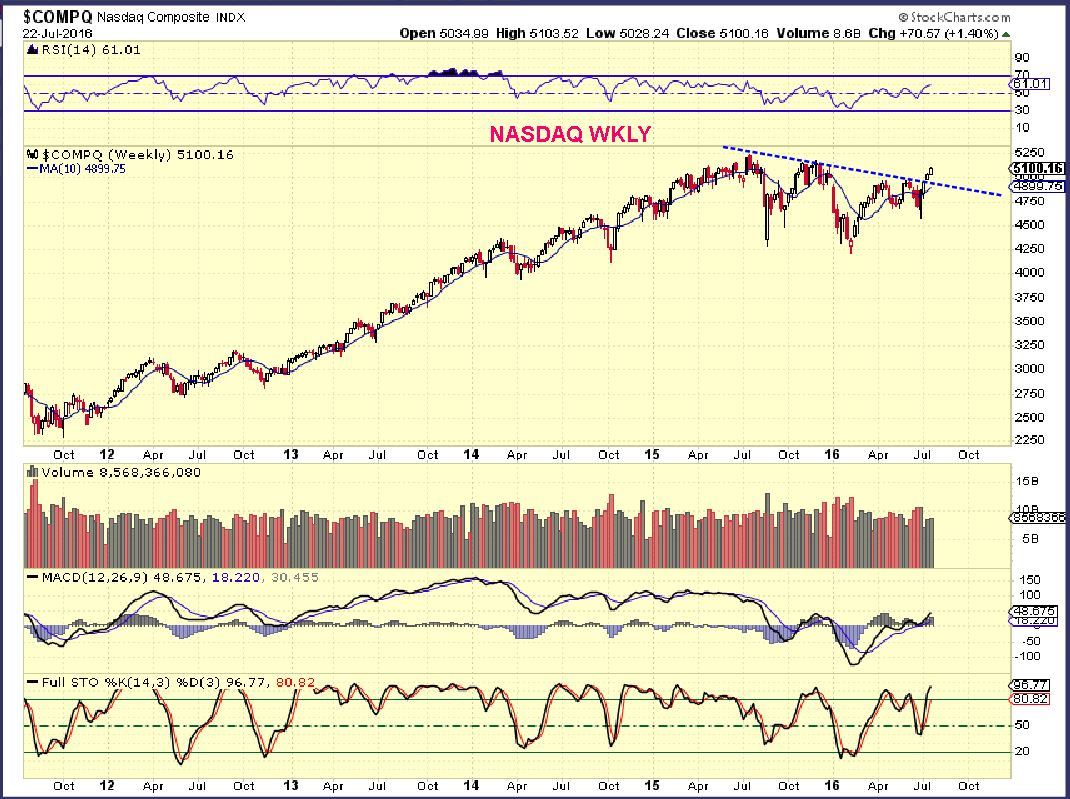
The NASDAQ has further to run before breaking out to all new highs. It is the TQQQ etf (leveraged) that captures the move in the NASDAQ. BAck test this break out? The VIX is at 12. Caution, use stops.
SIDENOTE: When I mention certain set ups in the markets that are bullish, and lets say for example that I mention ” We are at an ICL so this has a lot further to go! “ I may not take a trade, because I am focusing on trading Miners stocks or Energy stocks. Yes, by all means feel free to take that analyses and trade an ETF that you like to trade, whether I say to or not. I usually cover the SPX, WTIC, GOLD, etc and there are ETFs that you can trade for those sectors.
.
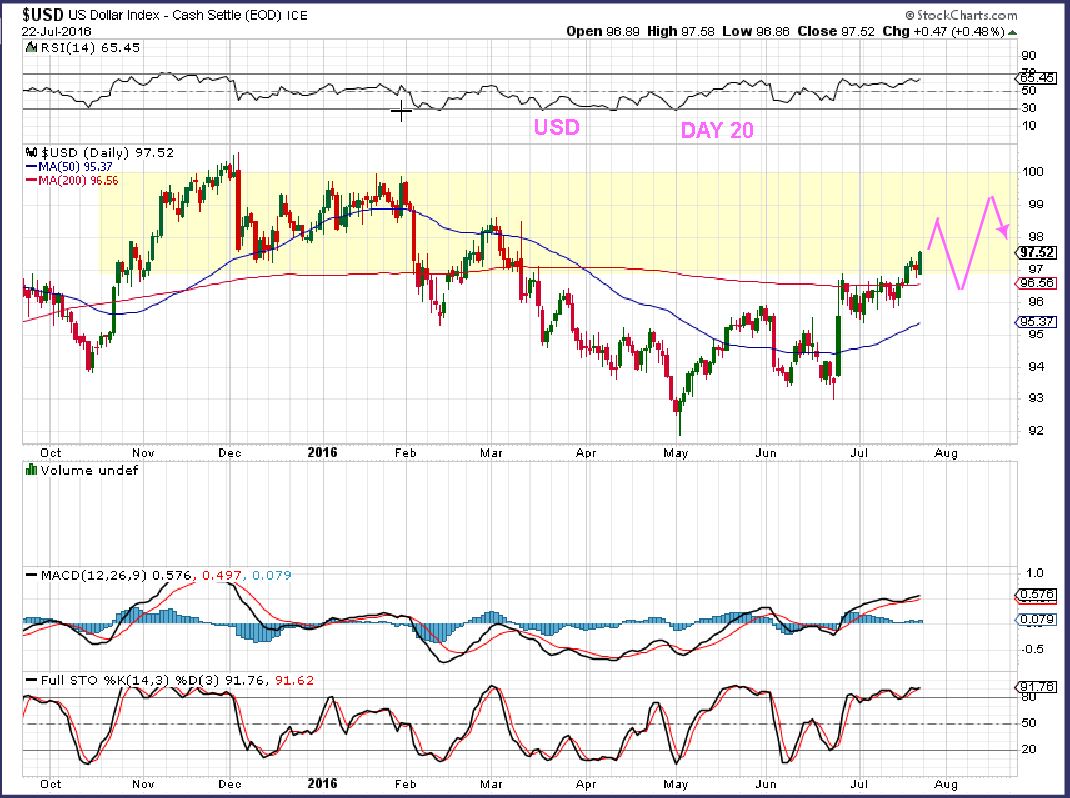
USD – The USD had a slight change of character on the day of Brexit. That candle stocks out without me having to point it out. It then struggled under the 200sma for a bit and now popped above it. This should NOT immediately rally much further for several reasons. One reason is cycle count. This should dip to a DCL first, then it may go higher.
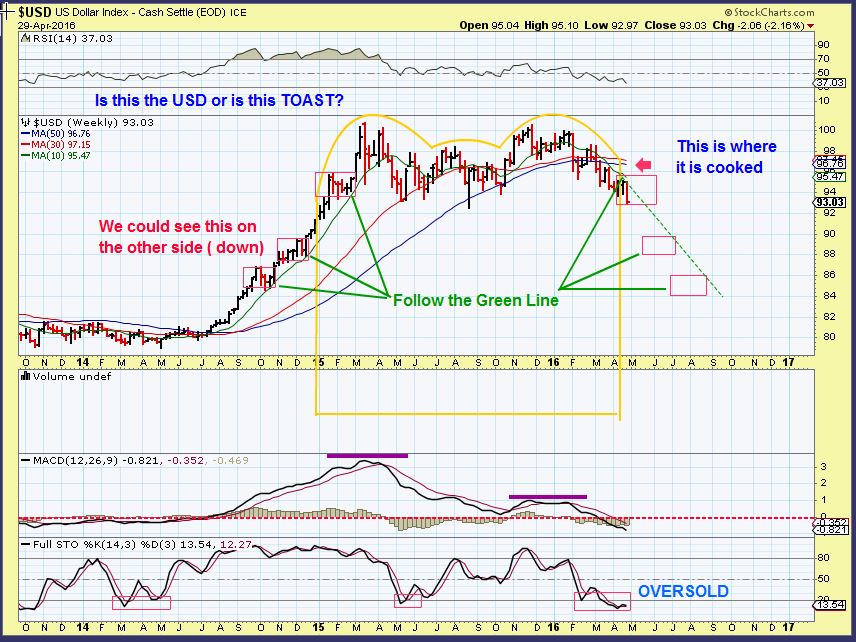
USD WKLY – APRIL 29 – THIS WAS MY ANALYSIS OF THE DOLLAR DOUBLE TOPPING AND ROLLING OVER. I HAVE BEEN CALLING FOR THAT FOR OVER A YR.
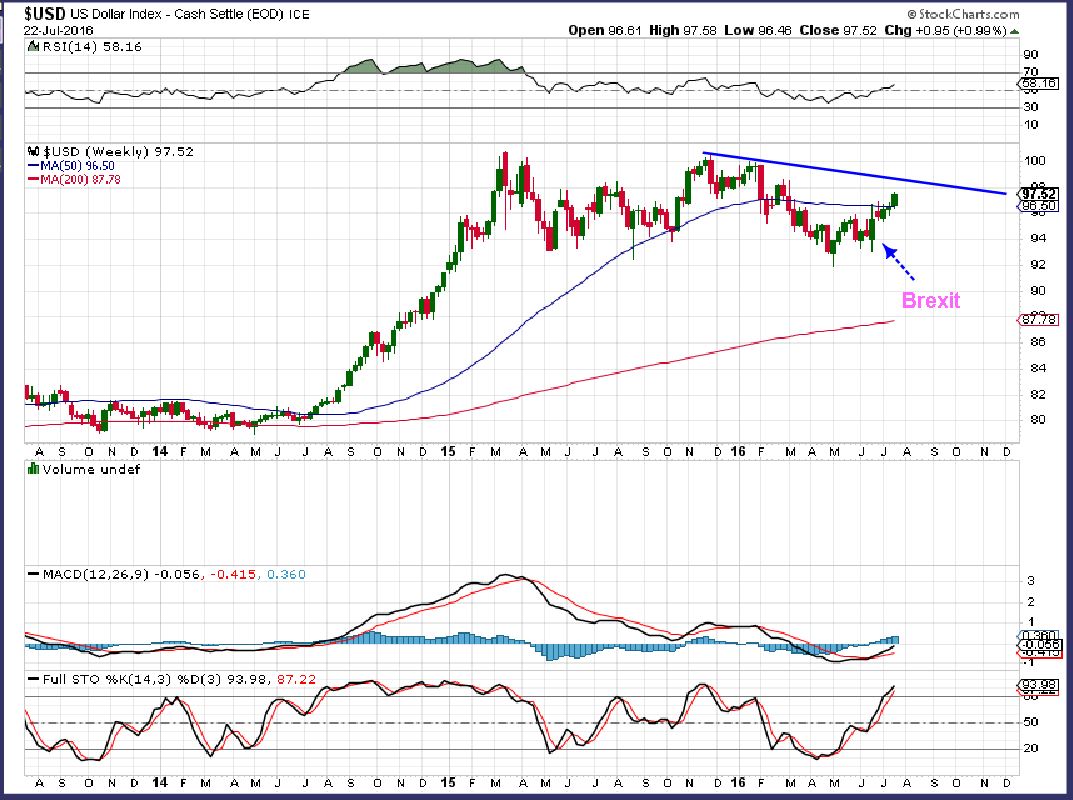
USD NOW – You can see that Brexit has added a little recovery juice, BUT this has NOT been bearish for Gold, Silver, or Miners. I will not change my thinking on the $USD heading lower unless it breaks out higher in the coming weeks. The chart does look a bit more bullish than in recent past charts.
WTIC – 2 and 3 weeks ago many started to want to buy OIL. Some Energy stocks have held up fairly well, but cycle timing was saying that OIL needed more time to consolidate and dip lower. That was a bit confusing, energy stocks looked OK, Oil was due to drop. It was hard for some to believe that Oil could stay weak, since Oil was so bullish from $26 to $50+. It is ready yet?
.
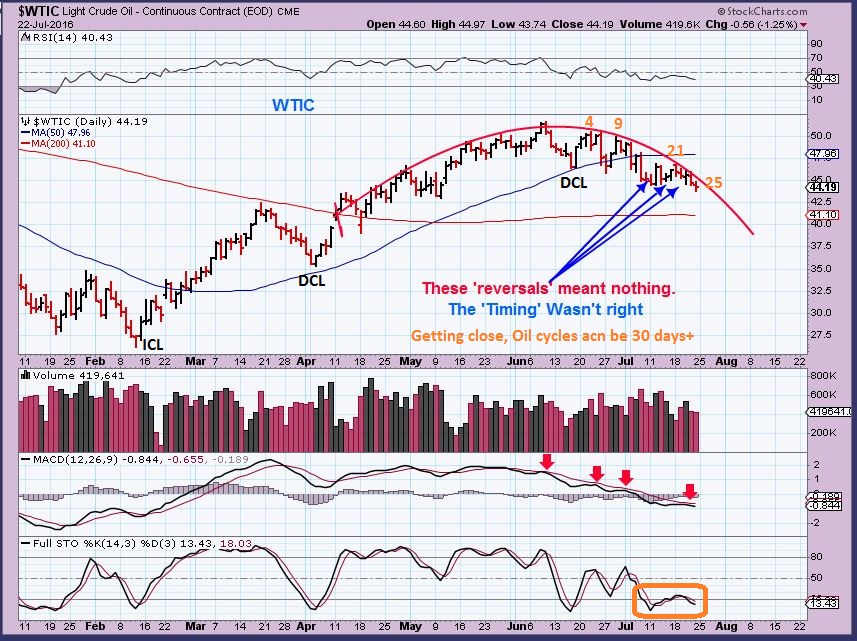
WTIC DAILY – We’ve seen reversal candle last week, but Oil wasn’t ready yet. Timing-wise, it is now pretty close. I have us on day 25, and the avg cycle timing is 30+ days. I wont jump the gun without a break above the 10sma.
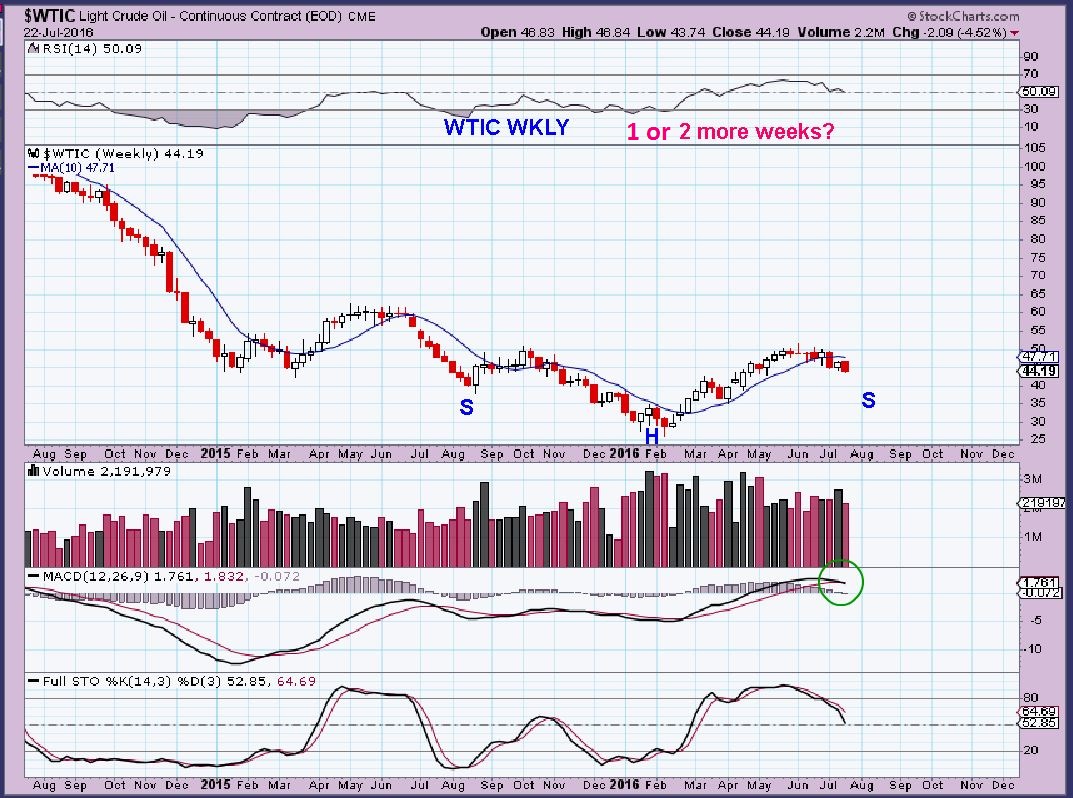
WTIC WKLY – It doesn’t have to drop to $40 to make this inverse H&S. The right shoulder can be higher as a sign of strength. IF oils cycle runs 40 days, it may drop there though. That is why I am not jumping the gun here.
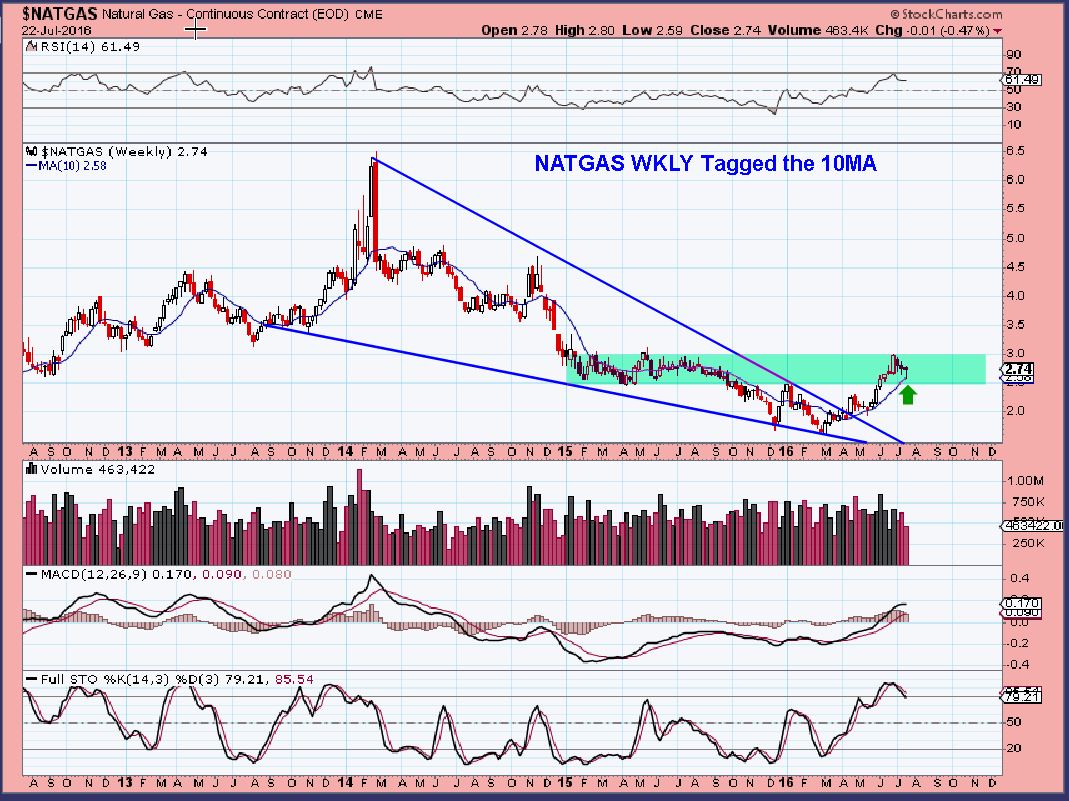
NATGAS – Natgas really took off higher in May -June. It is setting up in another bullish consolidation right now.
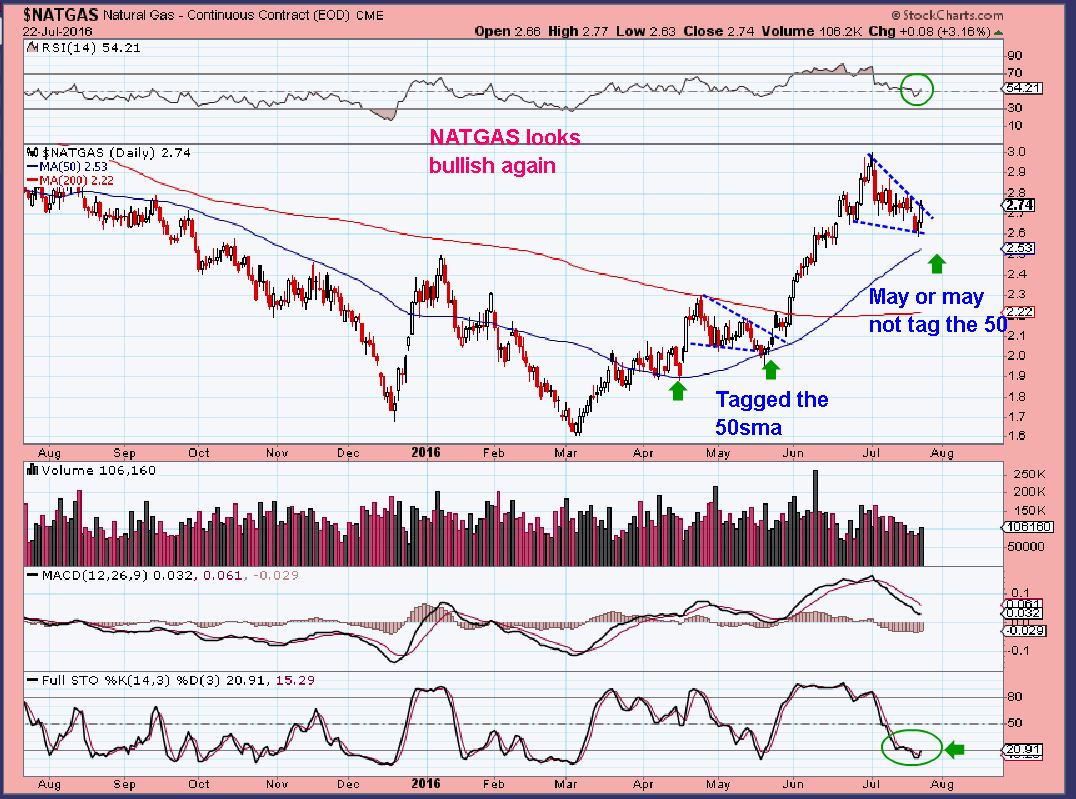
NATGAS WKLY – This is actually a bullish back test, and the daily is a bull flag. NATGAS looks ready to run even higher. If you trade UGAZ or DGAZ, you want to pay attention to the above charts.
CRB – This can drop below the trend line for a shake out, and Energy makes up a good part of the CRB, so if Oil dips, this will too most likely.
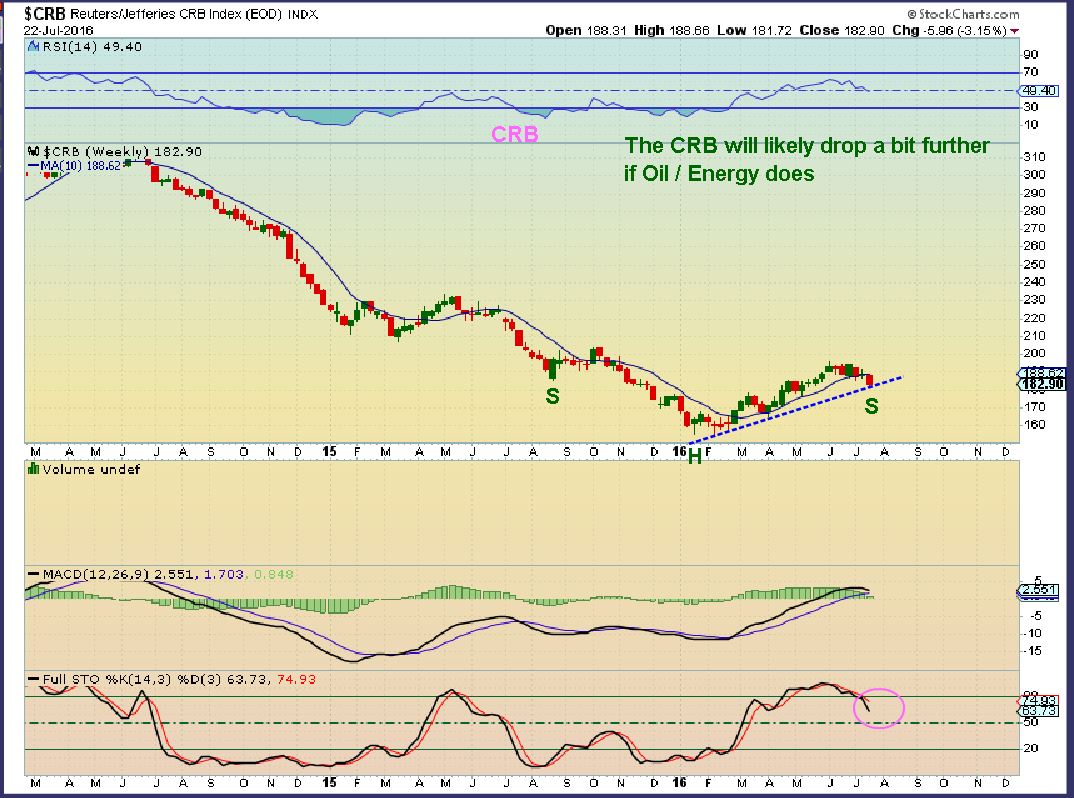
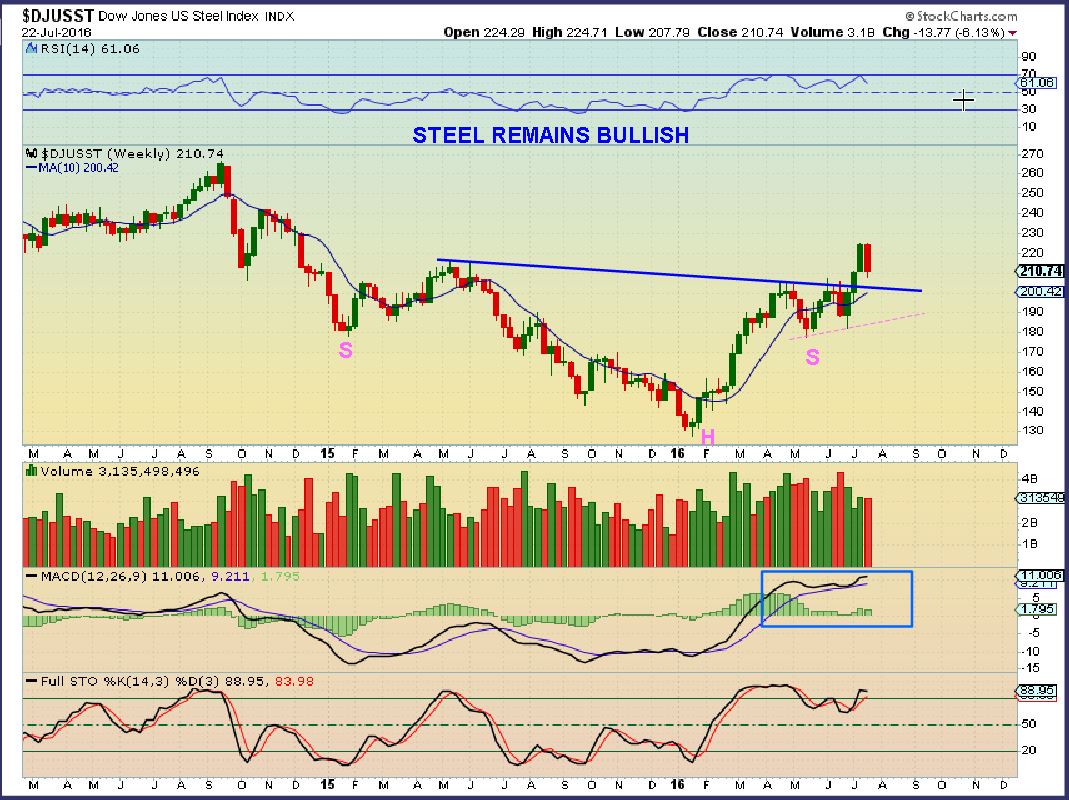
We were looking at Steel and Aluminum stocks, etc. I do not just use the CRB to track them due to Energys impact on the CRB, so lets look at STEEL itself.
Bullish even if it back tests further. Thats why X, AKS, ZEUS, etc stocks are doing so well.
GOLD & MINERS
.
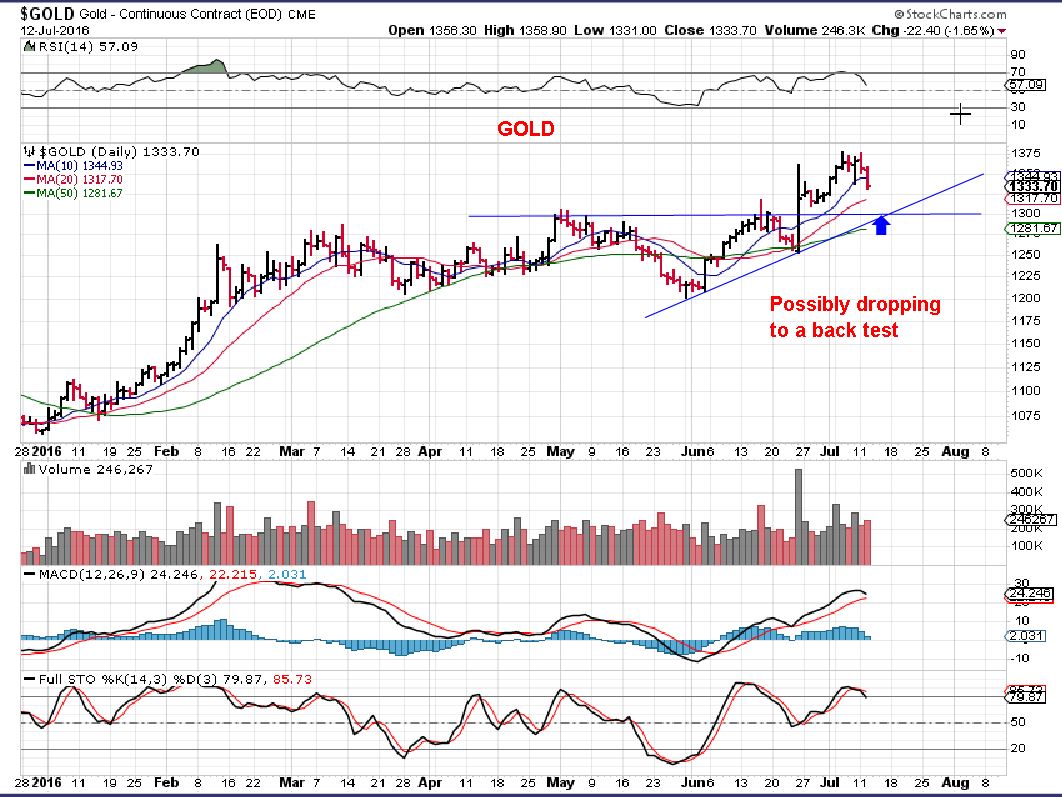
ON JULY 13th, I wanted us to expect a pull back, and showed that it could drop down and back test the break out. IT could go below $1300 and still be fine actually.
.
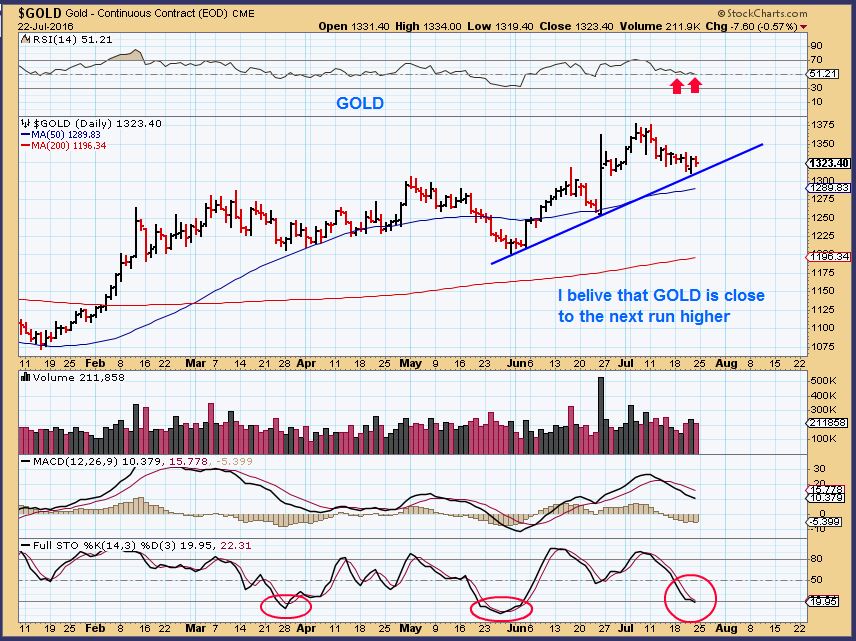
GOLD DAILY – This is a bullish sell off, and it is back testing the break out area. I expect that we could see further selling, but we are close to another run higher i.m.h.o.
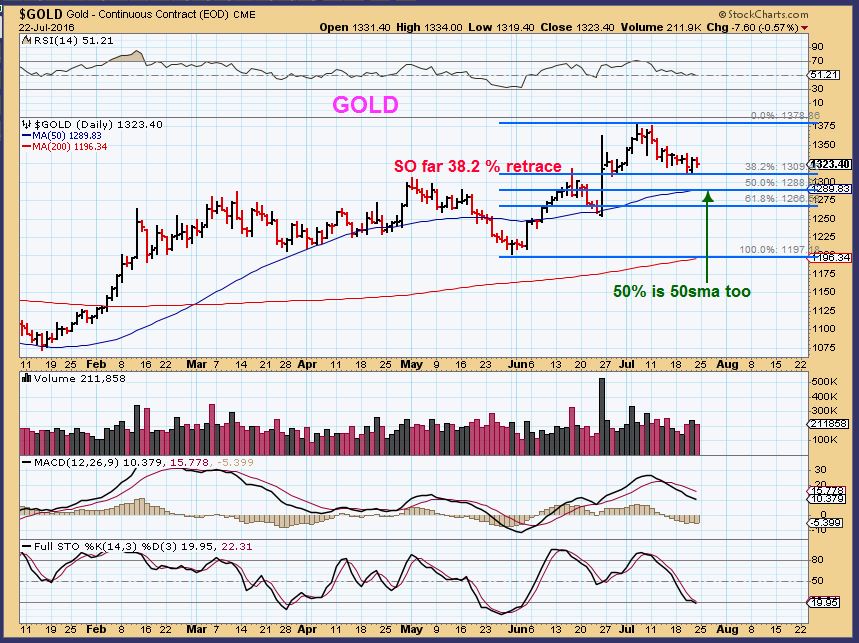
GOLD DAILY AGAIN – We have done a 38.2% fib drop and a back test too. That is enough, but we could also do a 50% to the 50sma to get further oversold on the stochastics. This is normal and remains bullish.
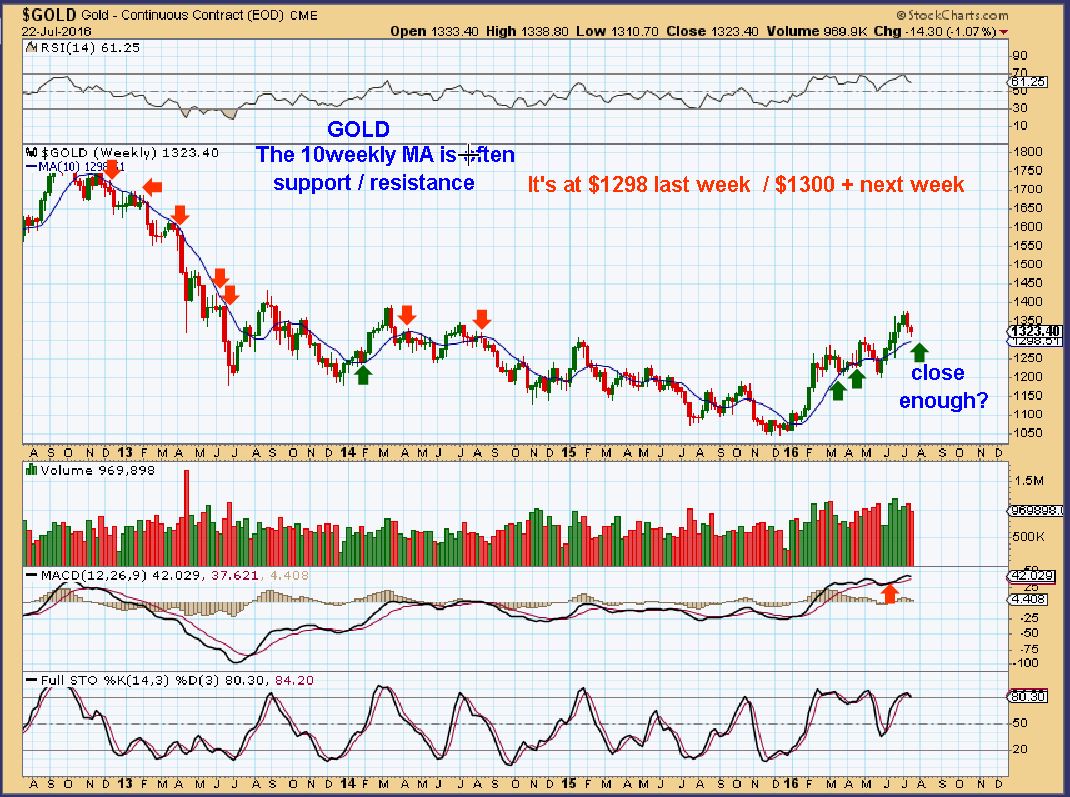
GOLD WEEKLY – Again, Gold can drop further and remain very bullish.
THE COT – Everyone was talking about the dangerously high COT over a month ago, saying Gold would plunge. I was saying to BUY, we had an ICL at the end of May. So you may recall that I pointed out that I just expected the COT to get higher and higher levels of smart money short positions ( Shown by growing brown bars at the bottom. I drew in what I expected. Longer Brown bars, higher shorts, no big deal) . I saw this in 2009 and pointed that out to build confidence here in Long positions.
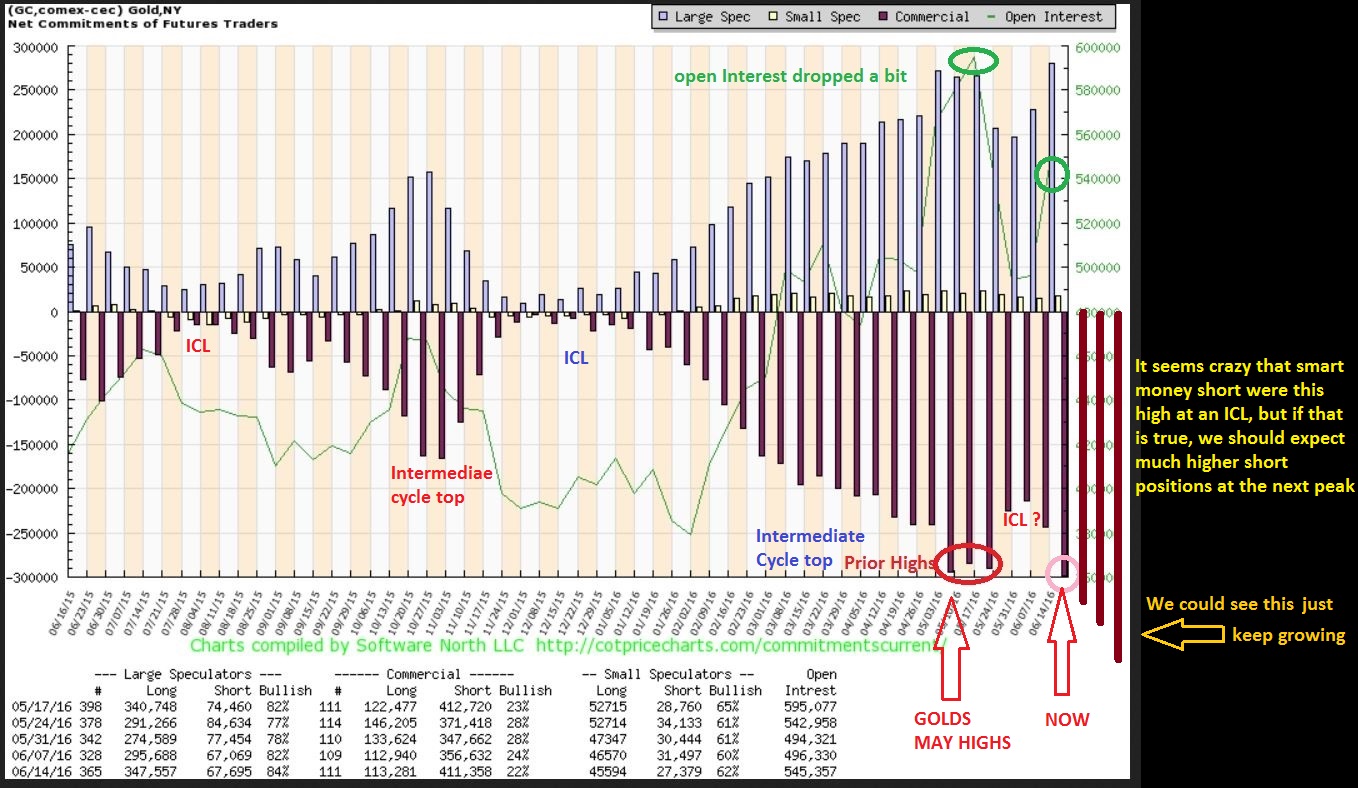
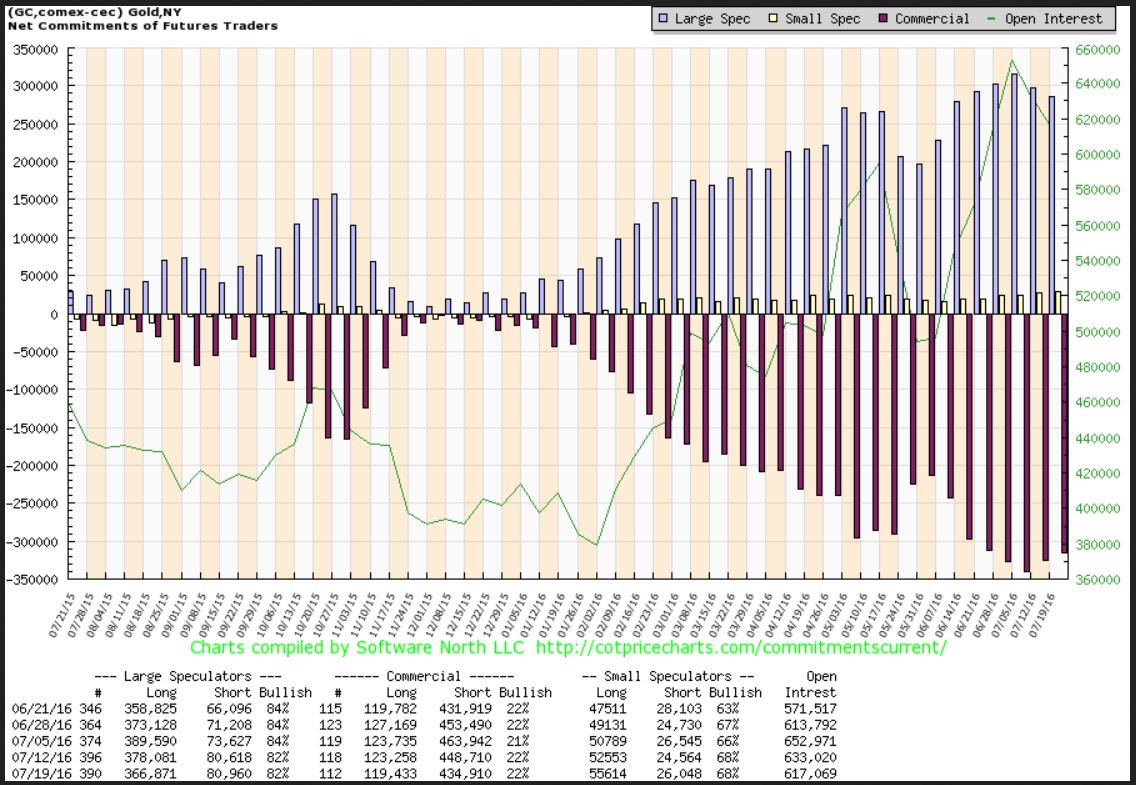
COT TODAY – The brown bars ( Shorts) Did keep growing, and with recent selling, they have now backed off. I was hoping to see this.
.
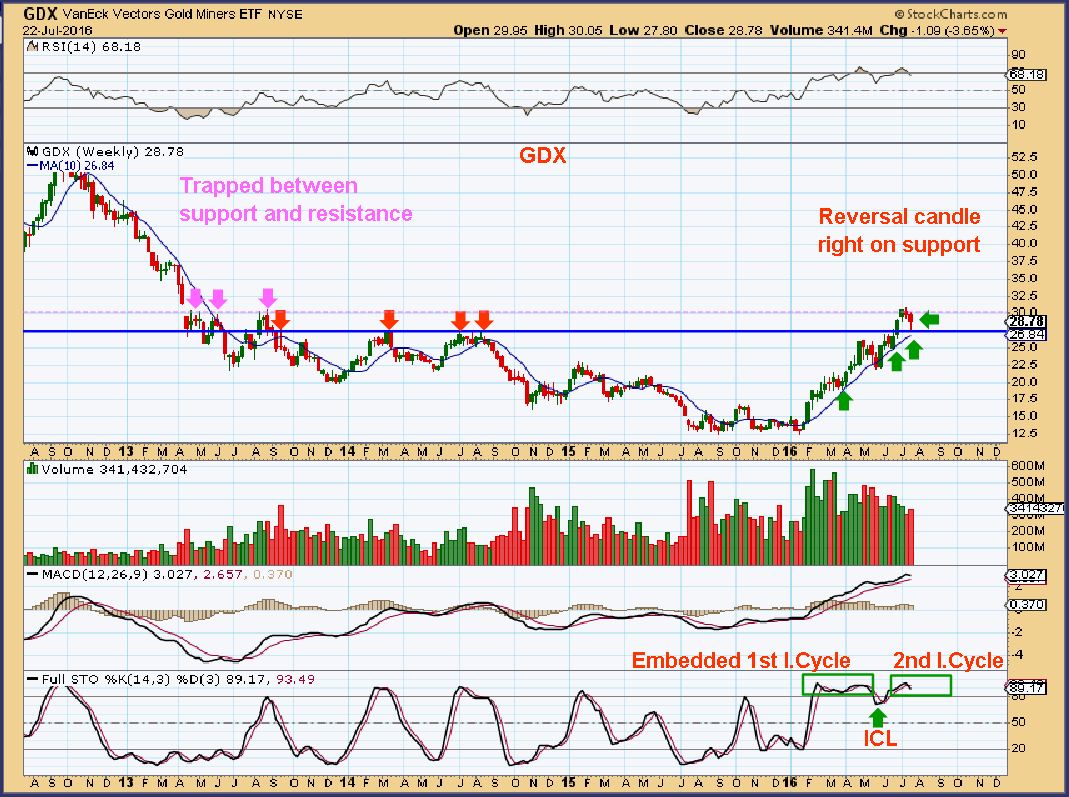
GDX– GDX has fought like a real champion through all kinds of resistance seen to the left. Last week Miners reversed right on support, but they could do it again to tag that 26.84 area. DO YOU SEE WHERE THIS COULD GO ONCE RESISTANCE CLEARS OUT? It could double again over time.
.
SO with that in Mind, let me show you this.
.
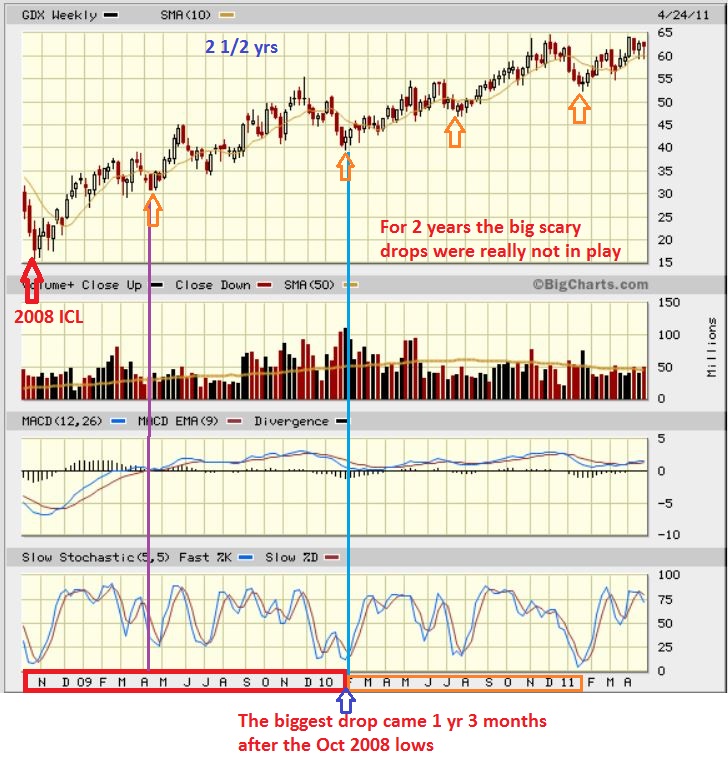
GDX 2008 onward out of the bear market sell off. Were there any huge drops in the first year? Not really. We had normal DCL’s and even a Mild ICL ( like we just saw in May 2016), but The first big drop came 1 year and 3 months later.
Since Miners bottomed in mid January of 2016, if they repeated this type of bullish action, we wouldnt see a real deep dip until 2017. Can I guarantee that that will happen? No, but history shows that it is possible that Miners just continue bullishly being accumulated by Funds, while nervous traders mentally damaged by the multi year sell off are afraid to buy the dips. WE here at Chartfreak have been buying Miners since Mid January, and have been richly rewarded, despite the occasional dreaded ‘Public Offering ‘ 🙂 I want to remain focused here for as long as it remains bullish.
To sum up the above comment on Miners, I would say that it is prudent to remain cautious in some ways, because pull backs and ICLs are normal part of the Ebb and Flow of the markets. At the same time, recognize that when a BULL is held back for years and suddenly starts running, breaking over barriers and charging through resistance, it is a BULL MARKET and surprises are to the upside. 
.
HAVE YOU HEARD?
.
I have seen where some writers are saying that “The Summer months are seasonably weak for Gold.” Did you hear that too? I got 2 emails telling me that this is what they heard, and I thank them for letting me know what others may be reading too. If this is a concern of yours , because you read that seasonality is bearish for Gold during the summer, I will tell you this.
.
I have been trading the precious metals since the year 2000. I distinctly remember bottoms in May , in June, and in July. I was a new trader back then and I clearly remember the good times and the bad, and summer was often a good time to invest in precious metals, when the bull was running.
.
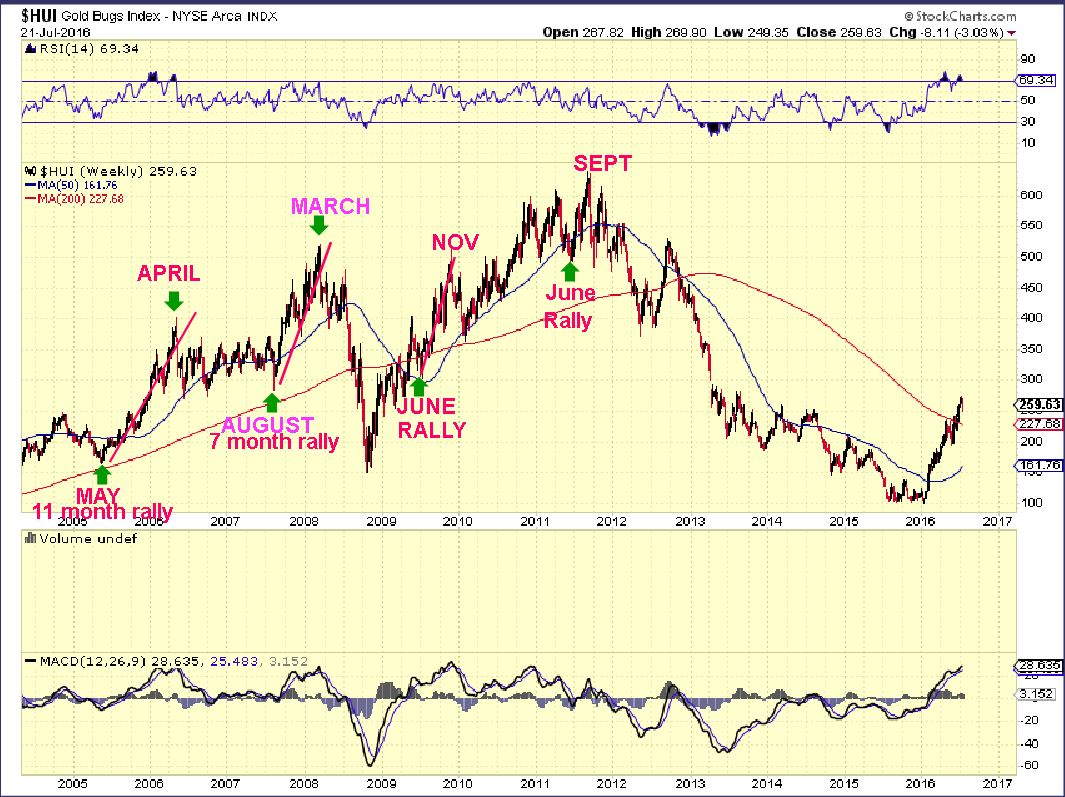
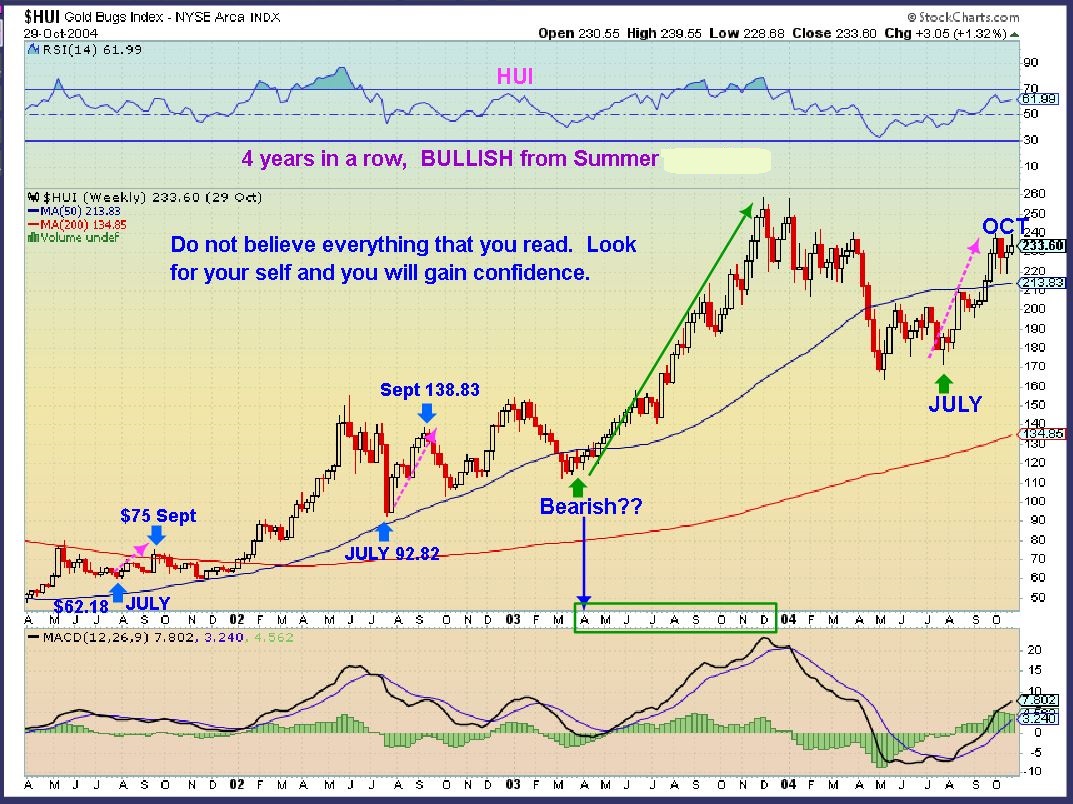
A chart is worth 100 words, so …”IS the summer always bearish seasonably for GOLD?”
.
2005 – Huge rally May through April of the next year!
2007- Huge rally August to March
2009 – June to November
2011 – June through Sept
2012 – Summer through Fall
Not enough info? How about …
.
2001 – July through September
2002 – July through Sept
2003 – April and it ran through the summer straight up & continued through the year
2004 – MAY though OCT
That is 4 summers IN A ROW. Enough said, a chart is worth a thousand words. Don’t fear summer seasonality for Gold.
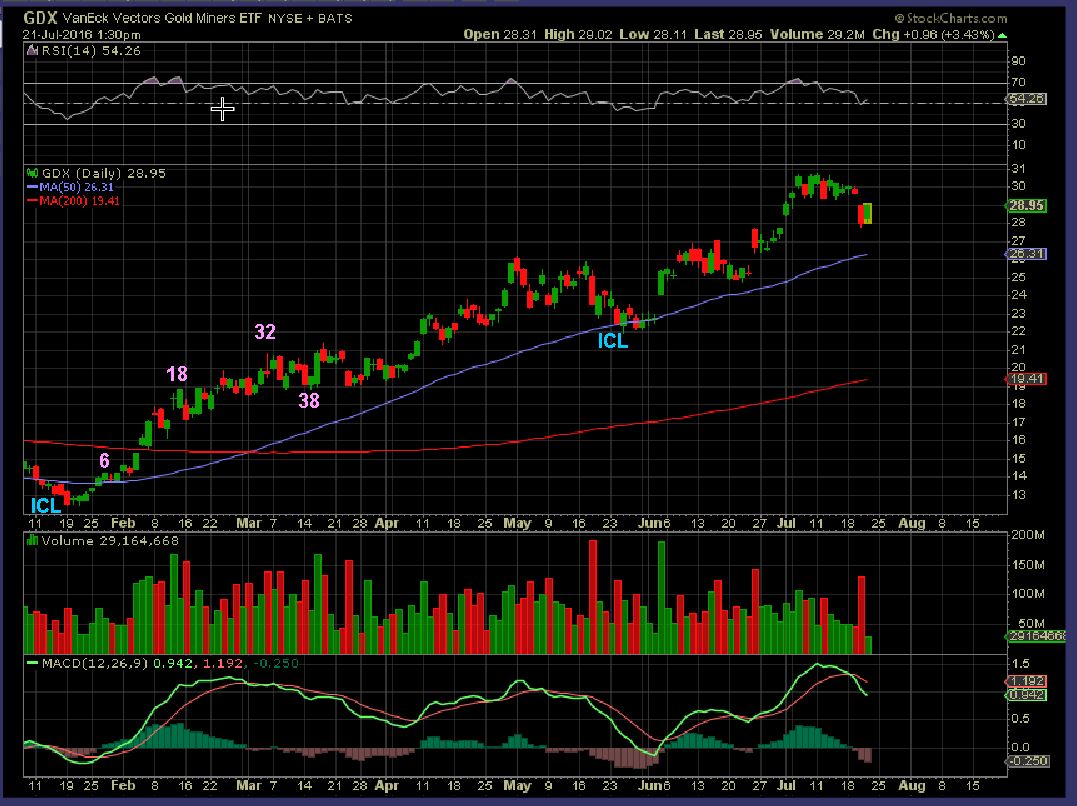
GDX – I also had this chart in a recent report, but it is worth repeating now that we dont have to fear “summer seasonality:. Inside of our cycle parameter, we see that the first intermediate cycle had day 38 as a low , and price has never gone under that low again. Selling on Day 38 would have been a bummer. We are now on day 39 ( I think) of this 2nd intermediate Cycle. I think we have time to move higher into August, then maybe we peak and did into an ICL in late Sept or Oct? Time will tell. For now, We have our dips and pops, our ebb and flow, but this is a chart of an uptrend. Enjoy it by buying the dips early near the ICL and riding itfor the 1st, 2nd, maybe 3rd DCycle to a peak.
.
And again, in 2008 onward, MINERS ran basically higher for over 2 years as shown without a huge deadly drop, just bull dips in a bull market. We are only month 7 of this Bull starting in Mid January 🙂
Enjoy the rest of your weekend!
.
~ALEX
.


thank you Alex! Enjoy your Sunday
Happy to have it typos and all. It is nice to have it early to mull over. Thanks.
Yes, great to have it early so I can study! Thanks, Alex!
LOVE having the report so early, Alex – Thanks!
Alex- what do you expect for this week.. I know you think it can go lower but are u tilting long as in bull markets surprises tend to be to the upside.
Sorry RM, I’m not sure what ‘it’ is?
We have bull markets in SPX, NAS, NATGAS, GOLD & MINERS. ( Even OIL is is a Bull market currently, it is just pulling back / consolidating).
I meant metals sorry I wasn’t clear.
ok, thx -I thought you probably meant metals, just wasn’t sure.
I do expect that it will be this week that they go higher. We have a FED WED, and that often changes the direction of metals if we’ve been selling off going into it .
I’m definitely trying to stay out of energy. Did anyone see former energy watchlister BAS on Friday? OUCH! Plotting individual miners against WTI helped fetter out that this stock clearly had future bankruptcy baking into the price.
Please continue releasing Sunday morning if at all possible! Much more time to review on Sunday than Monday morning (for those of us on east coast). Thank you!
really nice to have the sunday report this early! typos are forgiven!
I wish I could Post early more often, but I have 5 reports per wk usually. BY the time Friday 4 p.m. rolls around, I need to shut it down and refresh myself away form the screens and charts, to be able to look at things objectively. Friday nights I am off line. Whew! 🙂
I spend about 6 hrs minimum researching, looking up charts, drawing them up, uploading them and then writing up explanations so that it is clear and understandable, and to do that and be fair to my family, I need to post later in the weekend.
I had extra time this weekend because my wife was baking Saturday afternoon for the going away party Sunday. She baked for 4 hrs, I charted : )
I can’t speak for everyone but I really appreciate the hard work you put it. Thanks again.
Thanks, And I dont mean to make it sound like it’s all ‘work’ .
I love doing research and sharing it with everyone here . It’s just takes longer than I expect at times, so I end up finishing late Sunday : )
Yum! Sounds like you had some yummy things to eat! Thanks for all your hard work!
It’s only worth it if you were the recipient of said baked goods afterwards!
This week should be good. FED WEDNESDAY may turn all things around. I think that I want to be fully loaded in Miners before Fed Wednesday. Smart money could strt buying ahead of time too .
Thanks so much for the historical perspective – make sure you copyright them and then recycle those every now and then for reinforcement (and to save you time!)
I was also looking at the 5hr gold futures chart this weekend and liked that large green candle coming off 1300
Hey, I didnt get a tag of 1300 on my chart. I like that too 🙂
GSS announced $30M share offering. Any effect like GPL?.
Looks that way down 10% in the pre 🙁
Yup! Now I’m worried that others may follow suit. AUMN, TRX, etc.
Their earnings out this morning as well. I think their “All-in Sustain Costs” are a bit higher than others in the sector. Production was essentially in- line with expectations. Overall neutral. Then there is the agreement to raise additional capital. 🙁
But they do have a new mine ready to produce 2017 on target.
Nice. But no one seems to care so far this morning…
Yes, I am just trying to make myself feel better….I bought premarket today….geez, will I EVER learn! I had on my list that they were going to report July 27! And I knew about the new mine coming online soon….but I did not know about the offering. Bah.
That’s too bad Nancy. Are you going to take your lumps or do the hope-and-hold? Fortunately I was in GSS but read their 10Q a few weeks ago and sold as fast as my fingers could enter the order.
Have not decided yet….can’t sell for a day till some funds settle, so I will decide then. I do like the progress on the new mine and have been following that a long time. If we truly are in a gold bull, it will probably be fine in the LONG run.
I posted real time here in the comments, and in the report the next day that I sold mine due to the topping candle that appeared.
Maybe that was the insiders getting out on the run higher
I’m just re-studying the Japanese Candlestick Charting Techniques book – and that top was an extremely rare event. It was an evening doji star – but also an abandoned baby. I know all these names sound ridiculous at first, but the really are meaningful
abandoned babys are at bottoms
Really? I just got in front of the screens this a.m. This is probably going to start happening as they gain the ability to raise money based on future prospects.
Does anyone know what a T1 pattern is? Is it the same as AB=CD with consolidation in the middle?
quote :
A move followed by a sideways range often precedes another move of almost equal magnitude in the same direction as the original move. Generally, when the second move from the sideways range has run its course; a counter move approaching the consolidation zone may be expected.
Thanks Daz
Yes, Bill- if you picture it as an a-b = c-d that works. Its pretty much a run higher , consolidation, break out from a consolidation to an equal run higher, and possible back test.
You want to see an example of what Daz describes? Pull up a daily of MUX.
MUX put out a report that looks good to me. Has anyone else read it? Opinions?
Hey Nancy – I just read it – financially sounds good – I am not sure about the exchangeable shares that is taking place on August 22nd – ? If the ex shares can be exchanged for one share of MUX will that be dilution – ? I don’t know but maybe someone else does….
I am happy about the exchangeable shares..I have some. When the stock became MUX, they did not automatically exchange your pre MUX shares….you got what became MCEEF. So to get MUX, you had to sell those and buy MUX which cost 2 transaction fees! I was POed and in protest just let them sit. Now he wants them back, so I will get my shares finally!
That’s good you finally get your shares! So does that mean when everyone does the exchange, there will actually be more MUX shares on the market? Since I’m assuming the MCEEF shares didn’t actually count in the “MUX” share count of what is on the market?
I don’t know…LOL…didn’t you see me avoid that point!? I could be a politician. [If I could use emoticons I would put a vomit one here!]
LOL – I don’t know either
Anyone thinking to grab MUXie down here? This looks really attractive to me right now!
If only l didn’t still have stupid GPL…
I’ll wait a day and then buy NUGT. Under $120 is real inviting.
Bill, I was just going to ask you that. I’m going to make some room today and get funds ready!
Oil was OK overnight but is now dropping like a rock in a well. My best trade last two weeks? SCO. 2nd best? LABU (would have been better but I was only scalping by design). By Friday the answer (hopefully!!) is miners again! We’ll see. (but it won’t be GPL or GSS)
Alex, still like BTG here? We hadn’t mentioned that one in awhile. I bought after you charted a few weeks ago and caught a good post-BREXIT move, now consolidating near 20-day along with sector. I think it still looks healthy. Potential candidate to add or is there better elsewhere? With GSS we continue to see the basket is the best.
If I was looking to buy BTG, I would see that gap at $2.50 and also see that there 50sma is rising up from under there, so I would be patient and see if it comes down to me.
But yes, it is a good chart
Great advice! I liked the % off currently and wasn’t sure if 50 dau was too far below or not. I’ll likely set a limit and let the computer do the work from here!
Alex if you have a moment could you have a quick look at the NMI.TO chart and let me know if it looks like a possible flyer?
Nice consolidation near the highs, but I just saw that you are looking at ZJG
problem if we are looking for the explosive upside, I probably will not find it in ZJG
I know, I have been thinking the same.
THAT is when you need to know your risk tolerance. Explosive upside and they can and have doubled & tripled.
Public offering risk and they lose 12% that day, and maybe more if it keeps bleeding out.
Explosive upside stocks can drop with a greater % in the drop to a dcl too.
I usually go with a small basket of individul miners in the first 2 daily cycles, and use a more cautious approach for a 3rd daily cycle ( They often peak sooner often)
The later cycles may have increased risk of secondary financing too??
I would say yes.
In the past, when Miners come off of the bottom and can show better gains on the price of Gold ( higher prices to sell into), they get financing & raise cash to pay off debt or increase exploration / ramp up a closed down mine, etc.
It does tend to happen later in the move after they recover a bit
Alex, I have several of the stocks you recommended a while back that are struggling lately. Would you recommend holding. CENX, THM, EXK, TGD
Bill, I have EXK, TGD and am continuing to hold. The chart is getting clearer for GDX and friends, imo – we’re dropping into the DCL here but probably only 2-3 days more so could be rewarding if you can hang. Just my 2 cents. I do not have CENX currently so haven’t reviewed that chart.
CENX is in a 5 month consolidation / trading range apparently. Breaking the 50sma, but it seems to be in a trading range. I would hold if it was a long term hold to own a commodity stock, I’d sell if it wasn’t doing what I intended when I entered. It didn’t make it to the top of the range.
As for myself, I mentioned before, I have only owned Miners recently since the May lows. Many miners look like they are returning to the break out
ZJG is the canadian cousin to GDXJ. The chart looks a little bit more predictable.
If I am going to beef up I’m thinking of going into ZJG instead of the individual miners to avoid the secondary offering risk.
THM is taking it on the chin pretty hard too.
That along with most of my portfolio today!!! So, I will be leaving shortly to go to a movie. Should cheer me up…Ice Age..in 3D. LOL!
IPI is the only stock on my watch list that’s Green! Tough day
thank frikk i bought some DUST last few mins on friday!.. cushioned the blow.
Bought some NUGT here $118.50
NUGT flying higher now, the bottom may be in
Didnt you own PGLC?
I did at one time, PGLC was a good trade.
yeah, it was green this a.m. when Gold was pretty red
I believe PGLC is one of the profitable gold miners!
I noticed as well, gold up big from morning lows. Anyone else thing we could have just marked cycle bottom? Yes, I know it will be a few days before confirmation (last time I waited I missed everything)
IN!
Looks like NUGT wants to retest the bottom. I will buy more if it gets to $119.
Just remember it’s called “The Widow Maker’ for a reason. This S.O.B. can blow out an account faster than a craps table in Vegas. Stay frosty.
It comes down to believing the BULL is back.
Not so sure about that with NUGT and JNUG. Those two are more a day-trading vehicle.
Rob, you do have to be careful and have stops. BUT, if you bought NUGT in January and sold Today, how much would you have made? Now compare it to any of the other individual miners.
Bought more.
You are a brave man. If you did catch the bottom, this will be a wonderful trade.
A week ago we were all talking about NUGT at $200. I still expect that, so I fgure its a good enough entry. Even if there is more downside.
Ballsy..studmuffin
I should have hedges. Oops. I was still in kinda light. Until today. Backing the truck up each time we go to the woodshed!
For me it’s CYBR
TGB, for a miner ( ZEUS, STLD)
S, VUZI, MU on my Tech watchlist
Interesting…
Loveeeeee that theme pic btw.. ahhhh.. heaven..
.. a coffee cup or cooler might be nice add…. 😉
Meow
A necessary add in my opinion.
looks remarkably similar to my lake placid balcony view pic ……….. sans the mountains 😉
TGD looks to be holding up better than many others.
Probably dropping to back test the break out, which is the 50sma currently
I sure like the looks of a lot of the oil charts. Hold me back.
CWEI!! They do an offering and shoot UP instead of dying like miners. What the heck!
Not many liked CWEI in mid June, and all it did was drop down and tag the 50sma.
Now it’s a great chart set up, looks set to break & run higher
I’m not in right now b/c of oil chart but I’ve mentioned for weeks it’s my top choice in that space. Great work discovering that chart!
Alex,
when was the lowest day in gold? Wednesday or Thursday? and did we put a swing low yet?
thanks
$1310 on Thursday, no confirmed swing
THM – Refresh. Many are doing this as the cycle looks for a DCL
.
I just watched AUMN go from $0.87 to $0.94 rather quickly
and right back to 87 – hopefully it holds
On the good days they run up, and dip down at noon ( Eastern time) and then follow through upside into the close.
Opposite on sell off days.
Big sell off in the a.m. , mid day bounce, then drop back and test those morning lows.
GOLD & SILVER just about G-R-E-E-N 🙂
I bought AXU with my GSS money from last weeks sale
You know what Alex? You are so QUICK – I admire that about you. I get analysis paralysis (or am locked up at work) – you see it as it happens and make the move! 🙂
It looks good so far, but I can still see a drop a bit further if it wants to actually tag the 50sma.
AXU $50M shelf was filed on July 18
Thx
I went for a walk and was thinking about this secondary offering / shelf offering business. Maybe trading something like AXU is safer in a way. Notice has already been given so some of the damage must already be built into the price.
I havent looked at VGZ with any interest at all since selling it weeks ago. Just move on, BUT
It has tagged the 50sma today and completed an A-B=C-D move from over $2 to $1.21
It does look somewhat interesting now.
perfect retracement (61.8%) too 🙂
I didnt notice that : )
I bought it this morning in the 1.20’s, I tought I would never own it again after selling at 1.40’s few weeks ago. Hopefully we r close to the dcl for shares.
It looks more like an IC retracement rather than the DC variety. It will be interesting to see how it performs going forward.
Yes, It got VERY extended above the 50sma, like 150% above the 50sma, thats why I never looked at it again.
Now it has dropped all the way down to tag the rising 50 sma, which did offer support in April, end of May and early & Mid June. That’s why all of a suddenly it looks kind of interesting.
Even if it ran up & only did a double top….thats a big gain.
disclaimer: I did not buy it here yet- still watching it
has VGZ completed any secondary offerings or is there any threat of it?
SAND has looked incredibly strong since the secondary offering. I do not own any, but it could run well when the next DC gets going.
I have some and would recommend it. Looking at selling SCO tomorrow (to ensure profits, not that I think oil will take off upside imminently) and putting that directly in SAND.
SCO worked out nicely for you. I bet we see OIL at $40 before it turns, at least $40.
I’ve actually got 2 SCO trades on. I’m selling one to fund SAND b/c I think gold has more upside from here than oil has downside. In another count I’m holding with a stop just below today’s low.
Thanks, Bill.
AUMN wants to turn green.
Puulllleasseeee!!!
I am wondering if AG has completed its head and shoulders — buying back some of my shares (with a stop 🙂
Any EW analysis on KGC would be helpful 🙂
Making lots of trades today. Grabbed VXX this morning. Less of an out and out short and more of a hedge with VXX at 52-week lows and spot VIX almost ridiculously low. SCO and VXX floating my account today with miners struggling.
New purchase – NUGT, MUX, limit offer in for BTG. Adding SAND soon. Looking at GDX and GLD options once we have more stability. If we get our DCL in miners soon, this could payoff well for all!! 🙂
GOLD, keeps touching that lower trend line (blue dotted line) refresh. 50% Fibo number. As long as we don’t get a real break, this has to be bullish. DCL is due any day, so this could be right timing wise.
Adding 3rd traunch to my PM Jrs.
Adding 1/18 GDX Calls
Nice….fill those saddle bags LR
Check out VGZ at the 50day
I discussed it 2 hrs ago below if you want a bit more info
Now VGZ has a reversal candle (so far).
Hhhmmmm
Alex what time frame are you watching – hourly?
VGZ daily candlestick ( but I did say ‘so far’. )
what does Hhhmmmm mean?
It mean, HMMM, very interesting .
NUGT
Remember ROYL ?
I don’t remember that one, but its looking good!
Let’s get it going!! I went overall heavy into miners at this point, so need an imminent DCL!
same here. Let’s do this!
Lol.. did u hold?
Check it out.. gdx and gold 2008 weekly.. hmmm …
https://www.tradingview.com/x/sZ6WLPvP/
Still holding, thanks
SA??
crude went under $43 today and below its May 9 price
AUMN on a 10 day 30 minute chart looks like a possible falling wedge , with divergence forming on test of the lows.
Refresh – things I watch when I am expecting a possible low to form
.
If it breaks down, I look for another level of support. Here it looks like a wedge of support.
.
AUMN hasn’t corrected 38.2% yet. It’s held up really good for being “the widow maker”! THM now takes its place. THM down 50% and down more Today than NUGT. That’s saying something.
I still have some oil stocks….got back in too early at end of last week …….OAS here at the end of the day had a lot of buyers – hoping that is the end of the drop…all my oils are red…..GLF was a $6 stock just back in May, hoping it will go back to that level once the turn comes …..ECA had a lot of sellers I just noticed at end of day….so looked to see why…….they came out with a shelf offering today…….oh geez….hadn’t expected that from ECA, thought it would be a strong one…..
OAS has been a rotten turd for 2 weeks now, hope she can turn and make some here a few bucks!
I know…I sure hope so too! I’m hoping to buy more so I can dollar cost average my other shares down and get them out of the red sooner…..I’m hoping to do that with a number of stocks I’m holding…..just waiting now for all the lows to come in – I hope it’s soon…..
I’m pretty pissed with OAS, doubt I’ll buy any more of that crap. WPX used to cost less than OAS and now its $2 more! GL!
is this an artifact,.. or is anyone else getting this on their charts?…
TGD has dropped fro 0.46 to 0.44 after hours
BAA has jumped from0.39 up to 0.44
AUMN has jumped up to 0.93
It is 7:08 and I have TGD at .43 BAA .43 And AUMN at .93. See you tomorrow.
It’s not reliable. I saw similar but when you checked in detail the bus/ask spread was really wife. Sure, someone may put in that ask but wasn’t met – not uncommon with low volume stocks after-hours. With GDX and large caps, it’s often reliable enough.