
Fridays Check List
Tonights report is going to be a great lesson on how we can view things as the markets ebb and flow , breathing in and out. We’re at the end of the week and we saw a little selling in Precious metals Wednesday followed by an immediate reversal Thursday. Does that reversal mean that the selling is over? We will look at a number of things that help to give us confirmation as to whether a short term low is either in, or may not be in place yet. Also buying the dips tips.
.
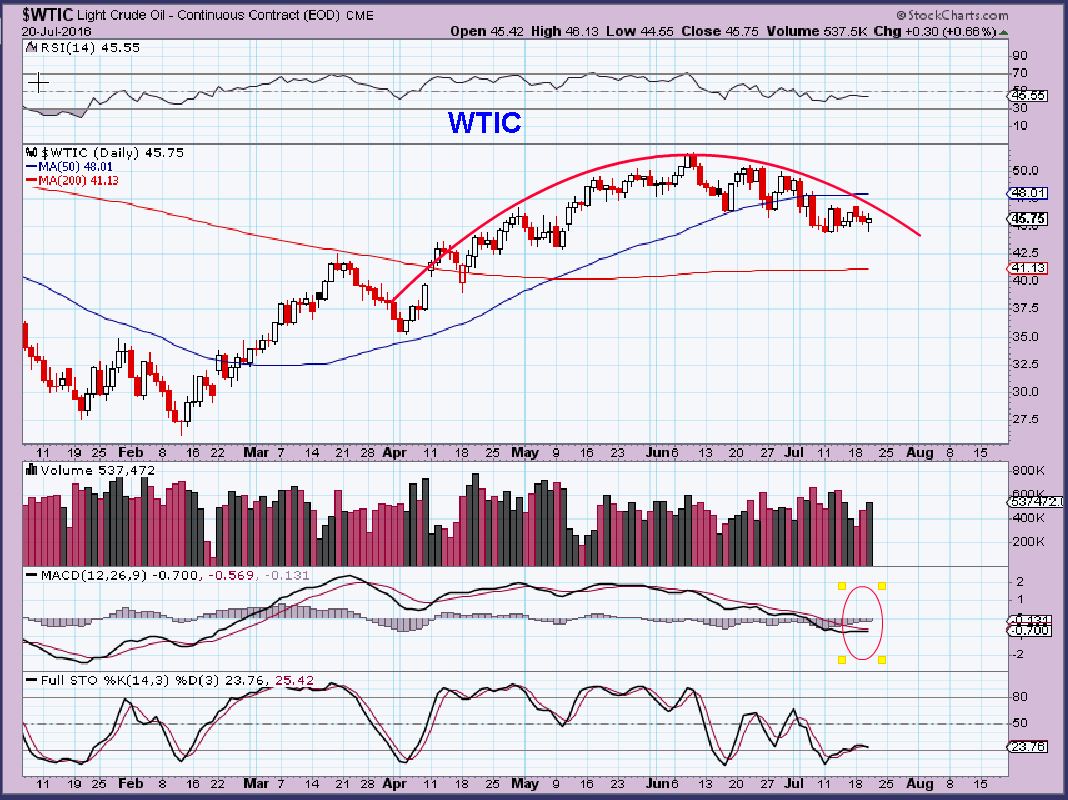
WTIC – First a chart of oil, since many do ask about the energy sector that we were trading over a month ago. We had a reversal Wednesday, but I pointed out that I still see weakness going forward. Patience is needed here.
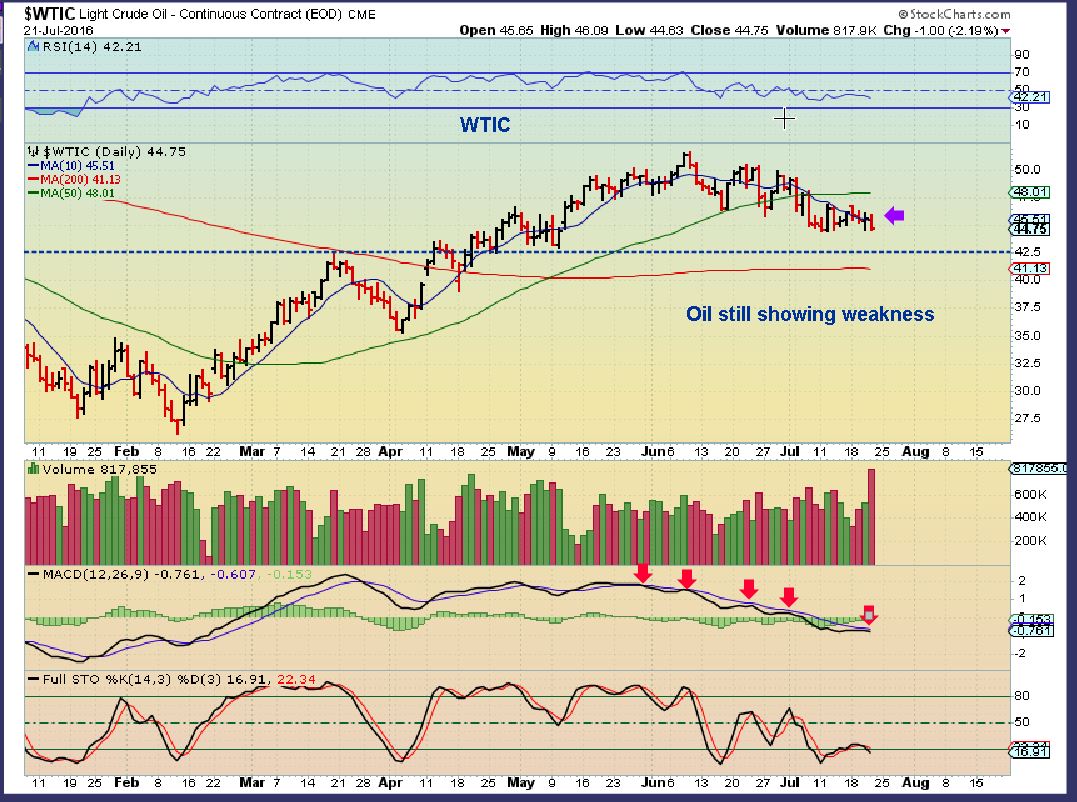
WTIC – That reversal vanished on Thursday. This needs to prove itself, and it is still proving to be weak.
Now on to Precious Metals…
This report is brought to you by 5 hour energy. I was only going to use 5 or 6 charts, but I had a 5 hr energy drink earlier and we ended up with 16 or so 🙂
.
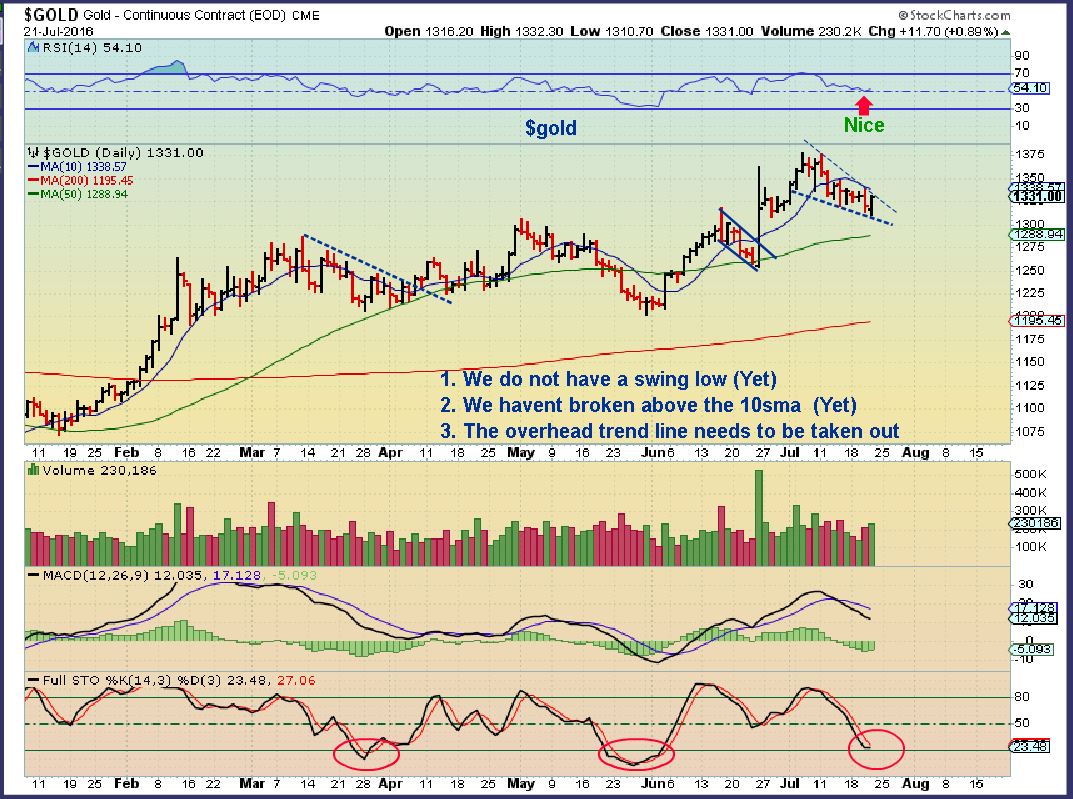
GOLD – Thursdays reversal does not confirm that the lows are in, but they may be. Timing is right, but we need to wait for a break of the overhead trend line…(read the chart). Also, are we seeing GOLD over $1340? Keep that in Mind, that would be a great start.
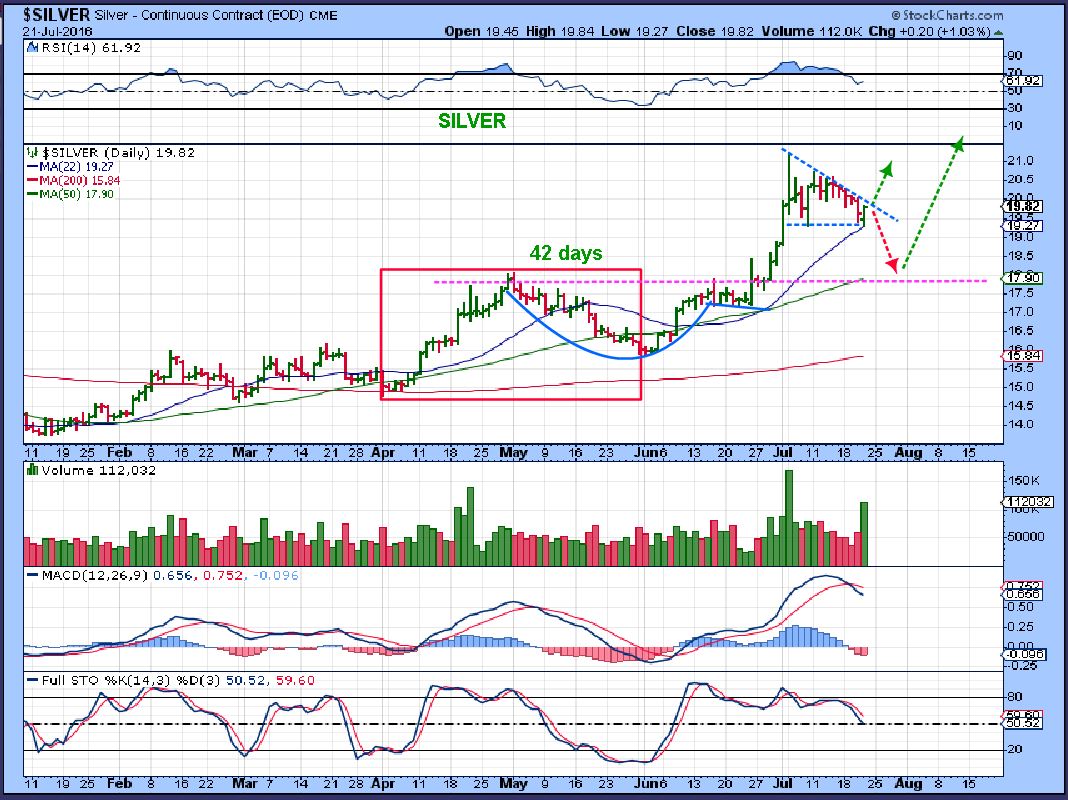
$SILVER – Silver put in a very nice reversal on the 22sma and this daily cycle is 35 days long. It has NOT back tested the break out yet, but that doesn’t always happen. Unfortunately, that volume is not real, stockcharts got it wrong, it was much less, but thats fine for a reversal.
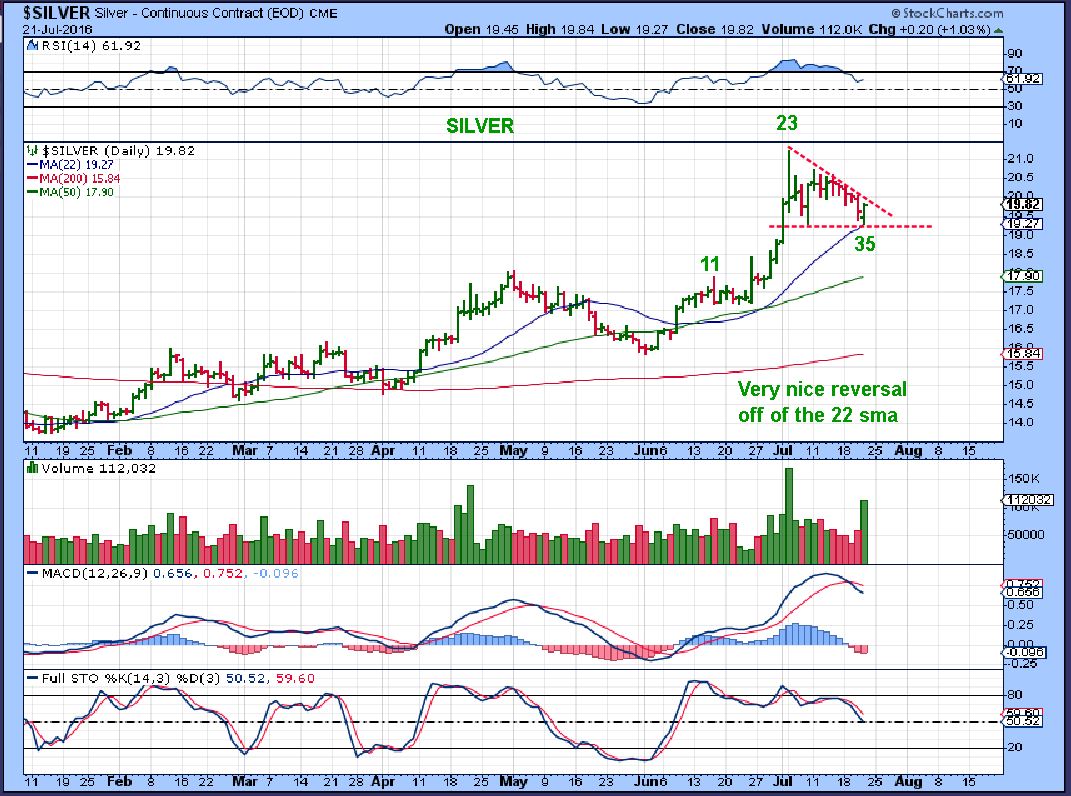
SILVER – The last daily cycle for Silver was 42 days long, we are at 35, so it is close enough, but we ‘could’ drop further. No confirmation yet.
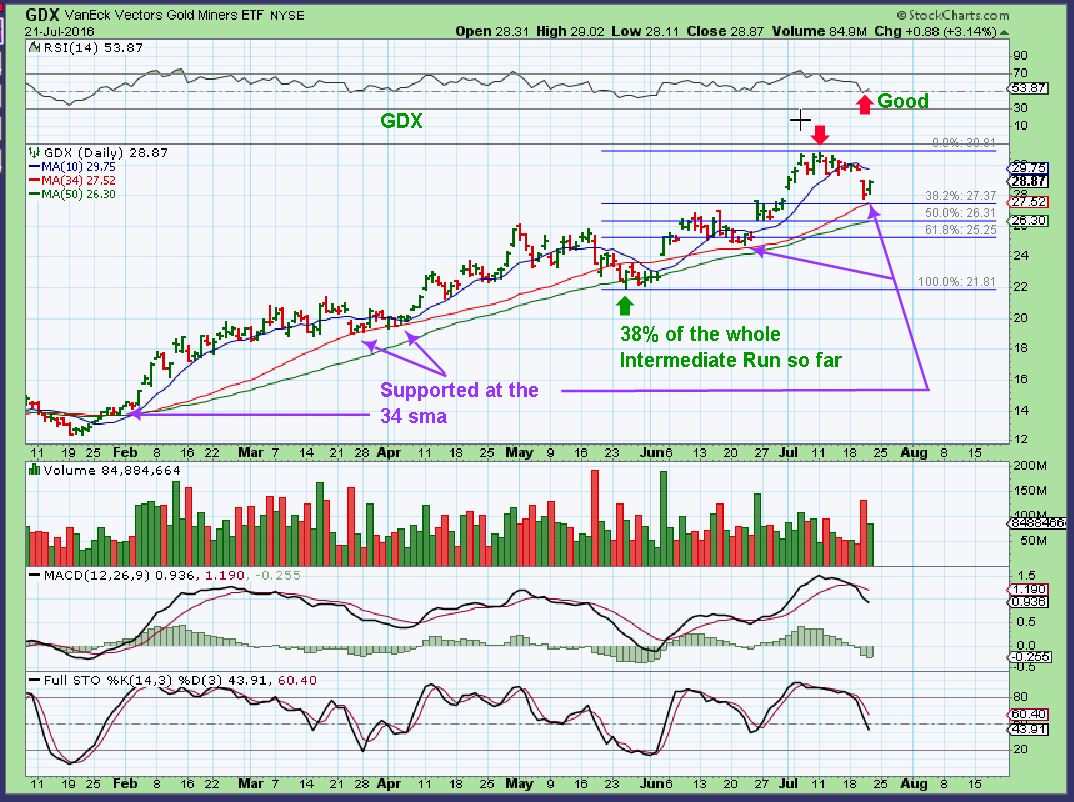
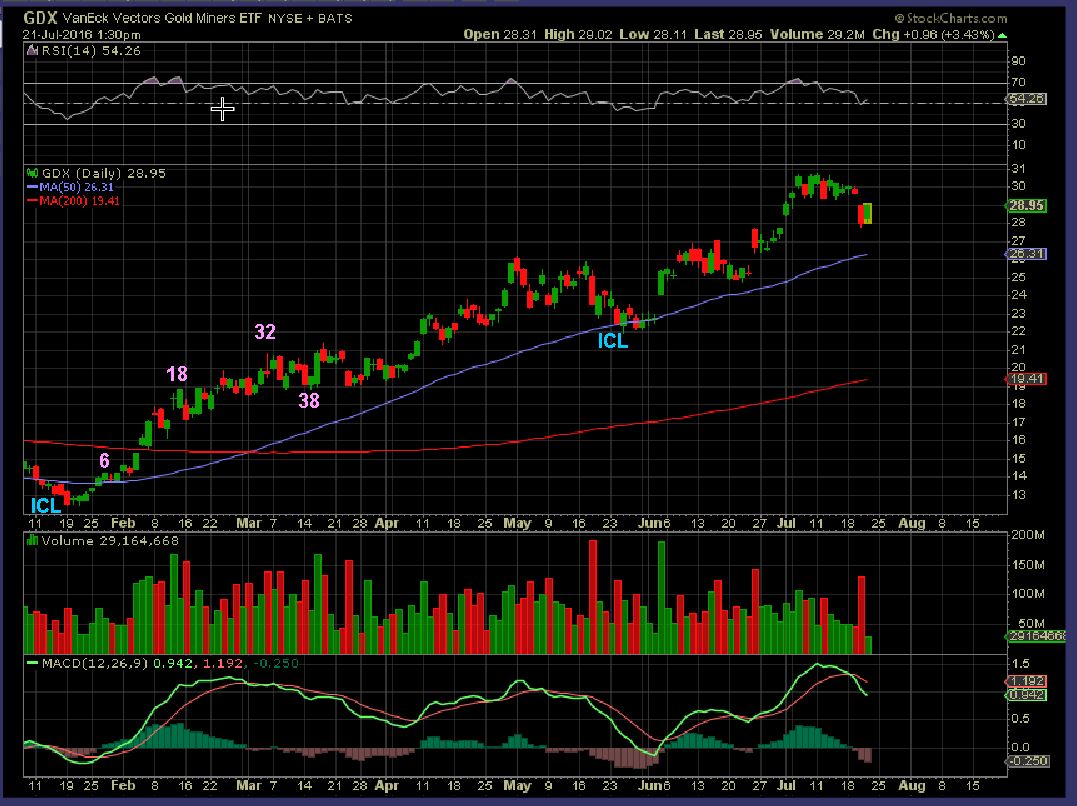
GDX – From the ICL to now, GDX has pulled back 38% and reversed at the 34 sma. It has done that in the past , as shown here. That may be it for a pull back, it may crawl along the 34sma like it did in March & April and then run higher.
GDX – Fred mentioned in the comments today that GDX also reversed at a 50% retrace of the last run higher. We see that GDX also filled a gap and turned upward. it ‘Might’ be done dropping, but we do not have confirmation yet…
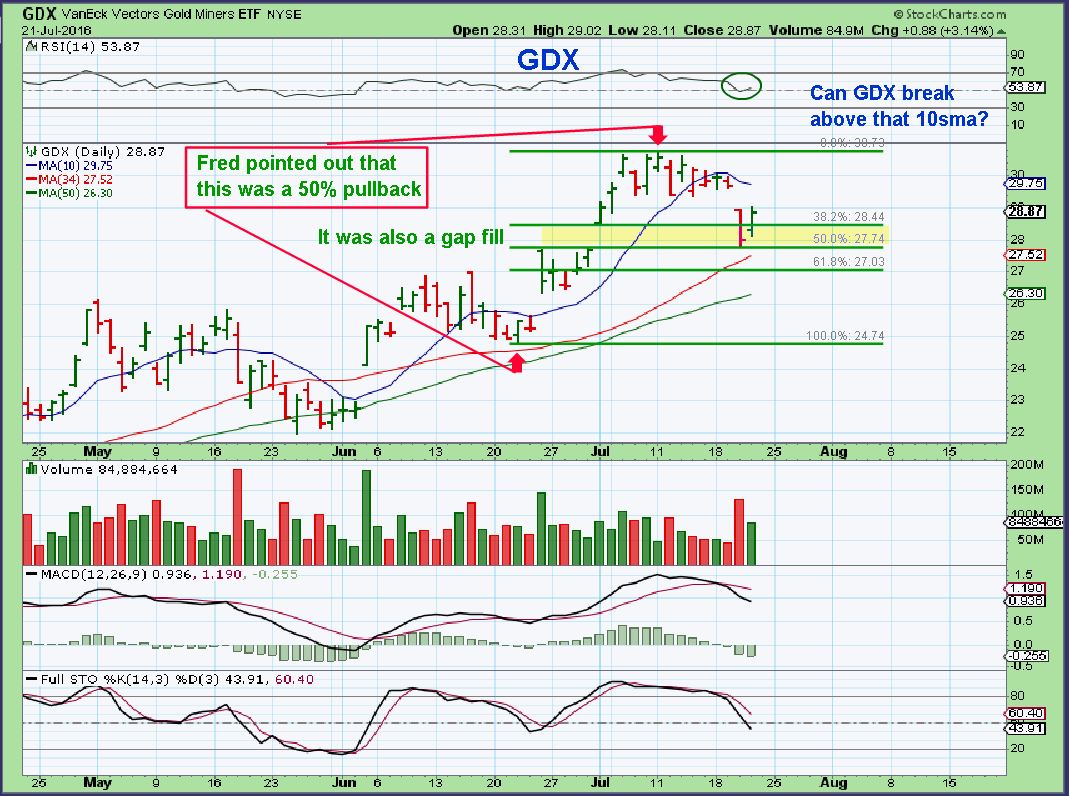
GDX – In the past we had sharp drops, followed by moves higher, but the lows were not in place yet. We would like to see a break back above the 10sma. This “Could’ overhead gap fill and fail. However, Read the bottom of the chart.
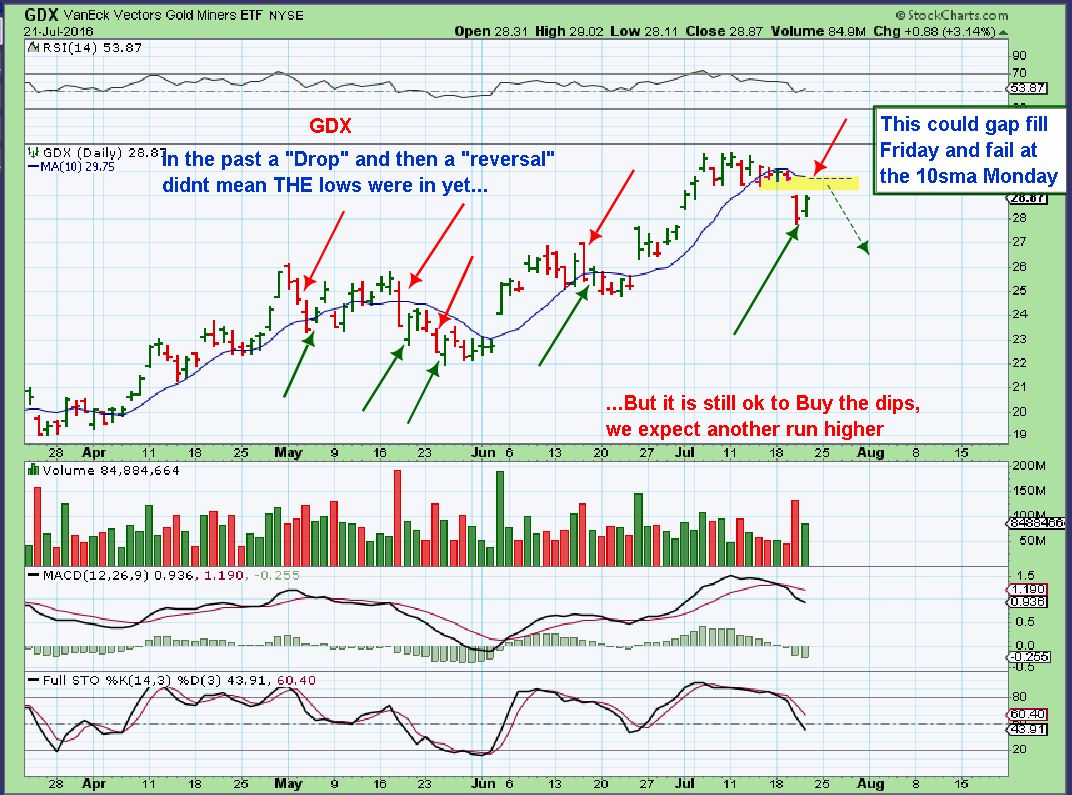
GDX – In a discussion today in the comments, I was saying that even though we are at day 38 of this intermediate cycle, I’m not selling and I’ve added on the dips. I drew this chart to show why. Notice that in the first intermediate cycle, If you sold on day 38 or less, you never got back in lower right up to this day. That DOESN’T mean that this Cycle will just run higher and higher. I do expect it will eventually lose some steam as we run out of buyers and people take profits, people will stop shorting it and no longer will we see short covering, etc. I am just saying that for now, on day 38 of this cycle, I am buying the dips, and will be selling the rips.
SO I mentioned in the comments that I bought AUMN & TGD at the open. IF I am saying that we dont have confirmation of a low, why did I buy?
1. My cost average is very low, since we were buying Miners in late May and early June.
2. Adding on the dips wont hurt if we are expecting another run higher.
3. Low risk set ups offer a place to put a stop if the trade goes against me. Lets take a look at those 2 trades and the possibilities there.
AUMN – Notice prior support at the 10sma. I may be early. This is 1 idea of what could happen now that AUMN pulled back to around the break out area. It ‘back tested’ the April 11 highs…
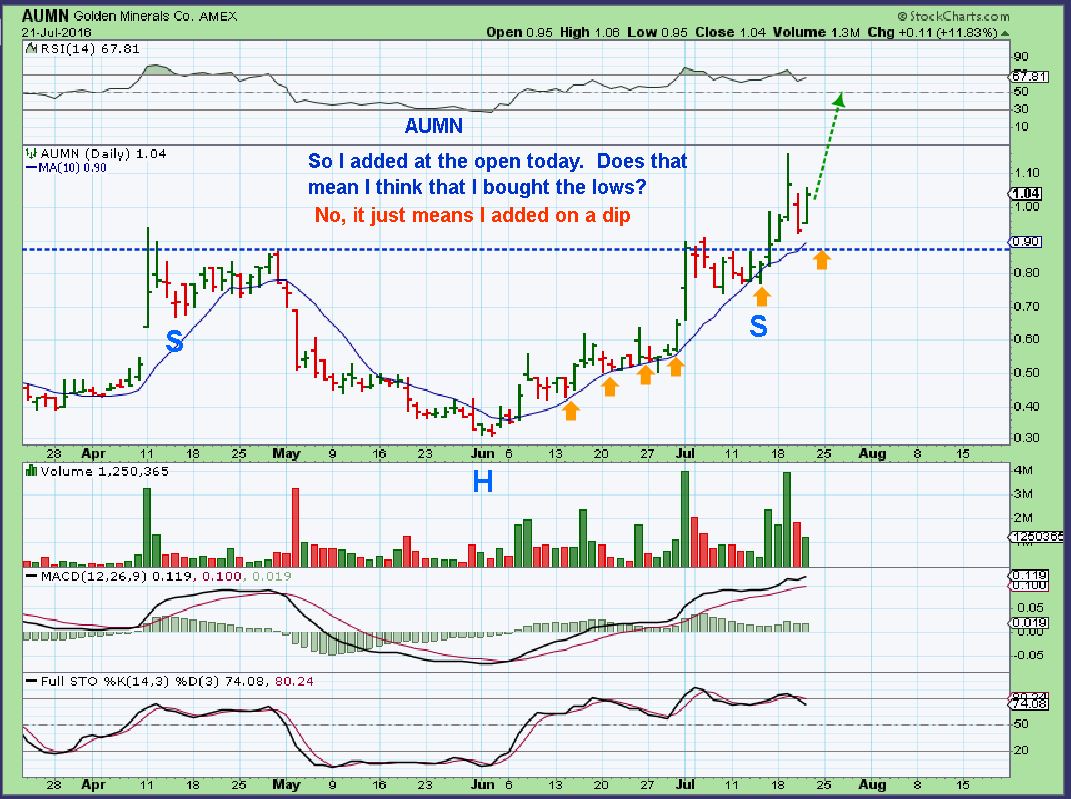
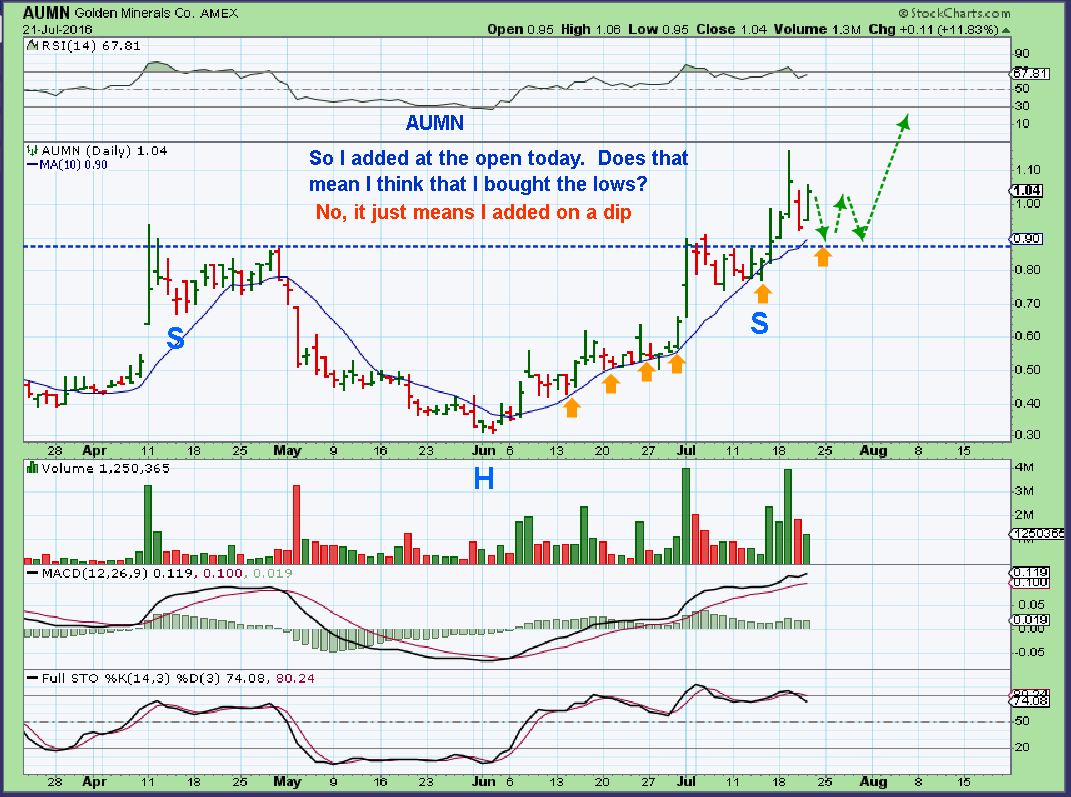
AUMN – This shows that we may NOT be at the lows, but over time, I think this will still work out as a good trade. I can stop out if it fails near the blue line.
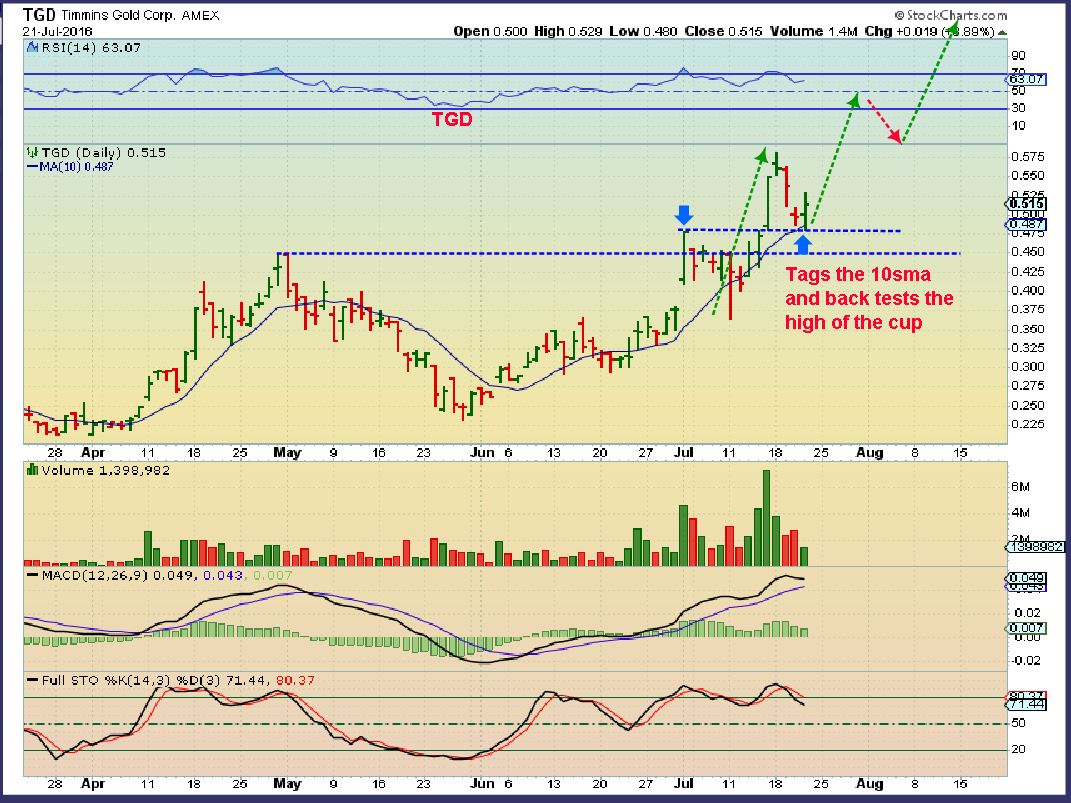
TGD – I bought TGD as it is back testing the cup & Handle break out. It tagged the 10sma as my BUY. NOTICE that I know that it could drop further, so I may add again if it does, as long as the cup hold up.
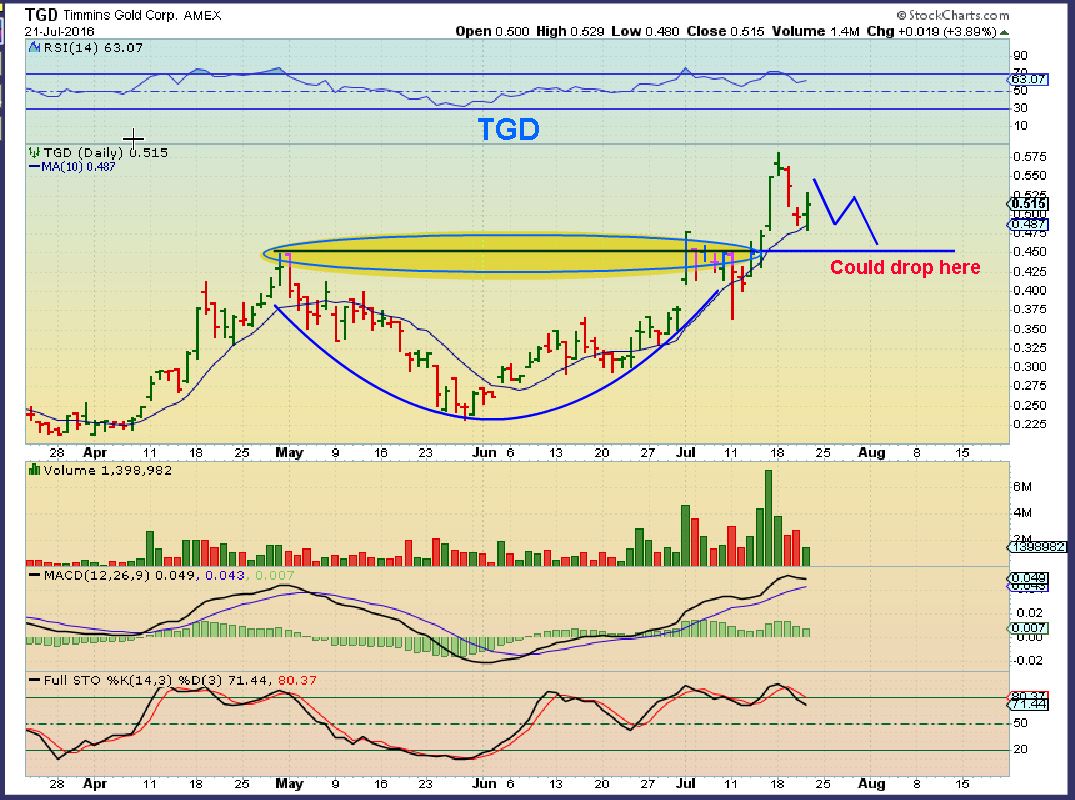
TGD – Of course, I am hoping that it just takes off from this level, and that is a possibility too. It back tested the Jul 1 highs today.
.
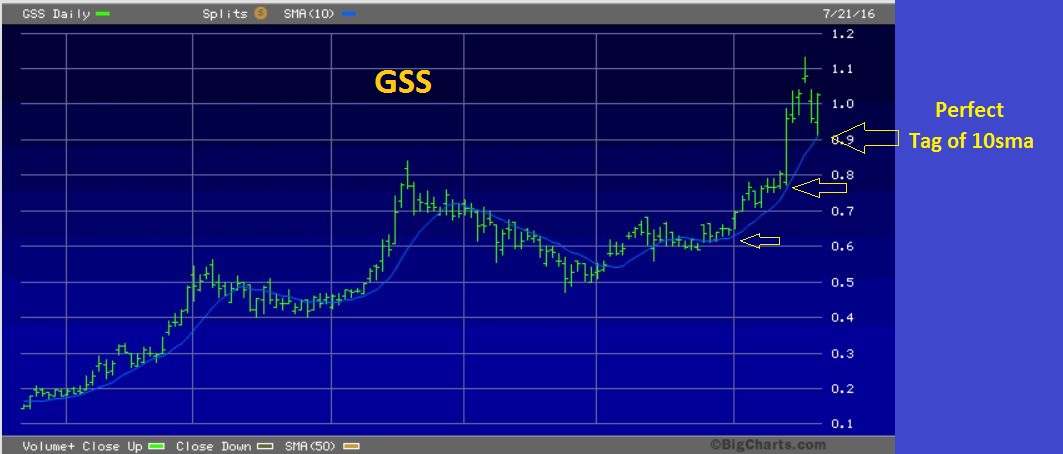
GSS – I sold my GSS yesterday due to the topping candle. All of a sudden, surprises come to the upside in a bull market, so it tags the 10sma and rips higher. I got in near $0.60 avg cost basis, so it was a good trade, but I think I got ‘shook out’ and this wants to go higher.  If it dips again, I may re-enter, however…
.
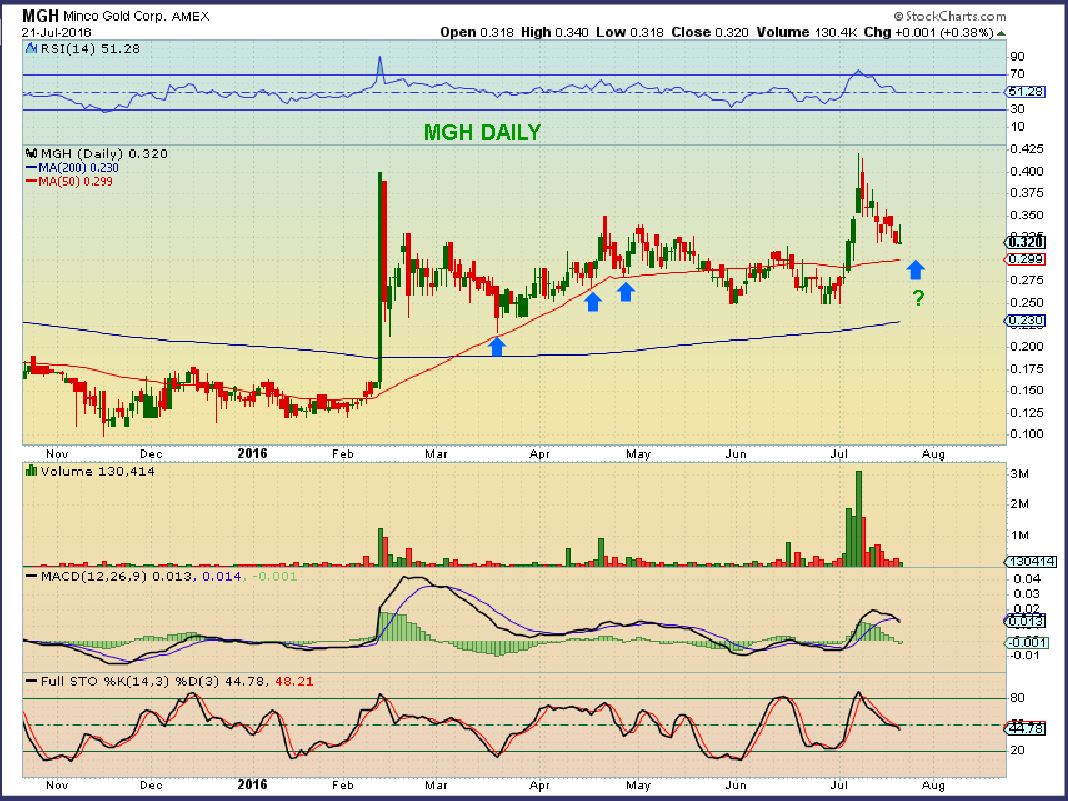
MGH – By request for John, Thanks for the reminder! This actually looks rather special. This may be where my GSS funds go, or at least some of them. Good consolidation, A few “signs of Strength” and MGH is possibly dropping to the 50sma, it is not over extended by any means. And…
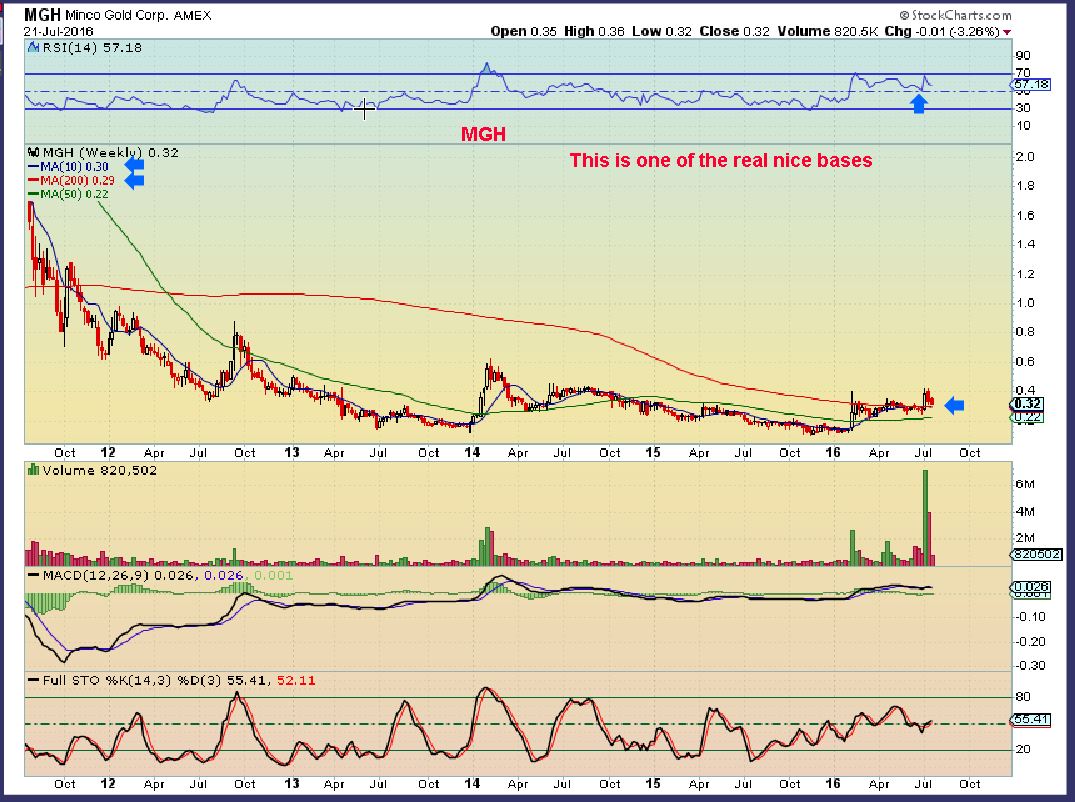
MGH WKLY – THIS is where it looks rather special. A few good signs of strength and now it has popped over the 10weekly MA and the 200MA. Look at the relative strength on this weekly chart.  Is it ready to go right now? I cant tell, but it does look very good. This could be an easy double, maybe a triple if it giraffe necks out of this base ( No promises! I haven’t checked their fundamentals or when their earnings come out. DO DUE DILIGENCE).
YES – Please do ‘due diligence’ on your positions. Check when their earnings come out and right it down on a post it note, or set an alarm on your phone, or computer, etc. decide whether you will hold through, or sell some, or bail out and re-enter after. Share that info in the comments section for others, they will greatly appreciate it. We have a great community in the comments/chat section. In time, If Gold stays up near $1300 to $1400 or $1500, the Miners will make larger profits than they did when Gold was selling at $1040-$1100. $200-$00 more per oz adds up. The surprises may be to the upside with earnings too, but recognize and reduce risk as necessary.
.
SO that is where we stand. We should be near the lows, but we can see further selling. We may not, the lows could be in, it is hard to tell until we get further upside confirmation.  I feel that we can look at various individual stocks and find areas near support as shown on AUMN, TGD, even MGH, and take a small position or add a little to what you have. We can always stop out if things get reckless and then wait for things to re-group and stabilize. Right now the charts have been very trade able. They have been acting correctly all along, and they usually do in a Bull Market.
.
Have a great Friday, have a great weekend, and thanks for being a chartfreak!
.
~ALEX


First again!!.. My 5 hr drink consist of gin & tonic. It doesn’t give me energy, but I get 5 hrs of solid sleep after it. 🙂
… yeah. Same….
My favorite Summer drink actually…..
Hubba Hubba.
The BIG question…Beefeaters or Tanqueray ??
Tanqueray
Ditto : )
old school.. T&T 😉
I like that pine needle taste – lol
ALEX I made a lot of money on GSV before i joined this group. How do you think it looks now? Several of the big gold companies have invested in it
Hi Robert,
I’m going to be honest, Excellent chart, until recently. It actually does not look so good right now, but that can change.
It broke below the 50sma and broke the uptrend channel. I dont see any strength ( yet).
This can all change in time, but right now it is weakening. What I do see that could be bullish is a falling wedge pattern forming. If it breaks above the downtrend line, that would be a bullish move.
If I was looking to buy this, I would use only an 8 EMA and wait for a break above it. When you see that, that will be a bullish signal.
Hope that helps.
Thx C F… U think that losing the 59day is worrisome at this point… or more inclined to be a shakeout.?… I’m in the HT right now..giggle.. but pretty sure AKG lost it….
Also nibbled on some natty….. I do have a chart I’ll post later.
PS. U said doo doo … Twice 😉
Ha- My friend calls me out on saying that ‘Do do’ too.
AKG lost the 50sma, but didn’t it reverse and regain the 50 EMA ( or maybe tomorrow?). That could be a shake out.
Just a little more time will clarify a few things like that, see if AKG can move a bit higher tomorrow .
guess i shoulda takn a bigger bite of natty.. lol
Tnx for the repley and the chart!
Thx for the reminder, I was watching that one and kind of lost track the past few days.
I want to keep my eye on it now. 🙂
Thank you for the Friday report, Alex.
Thanks Johnny, Have good wkend
Call me crazy….but I mentioned Coal last week. Would you mind looking at BTUUQ? Am I delusional … Or can this possibly be on the move back up?
It’s moving ,but on MINIMAL volume. If it drops from some surprise bad news, you’ll have a hard time exiting, even with a stop.
I would move up the food chain to CLD and ARLP but coal will have it’s day, especially if Trump wins
I was wondering if Peabody was getting a “Good Samaritan” boost since it is paying property taxes that will help school districts http://www.denverpost.com/2016/07/21/peabody-energy-property-taxes/
I traded coal once on a good set up. Once! I got my face ripped off. There is just no reason to own it. There isn’t. There is just better out there.
SWC? Why does that look good to you? I don’t see it, what am I missing. Granted it doesn’t look weak, its been moving higher, etc. No huge volume, RSI overbought? Teach me! FYI, earnings on 7-29-16
Earnings;GSS on 7-27, AUY on 7-28, TRQ on 8-3, TGD on 8-4, BTG on 8-4, RIC on 8-8, AUMN 8-4, MGH on 8-11
Hey Bill, where did you find these? I have TGD as Aug 11, TRQ as Aug 4.
Those are the dates that Tradingview is listing. I did a search for TGD and it came up 8-4 as well
Thanks. I got my dates from Merril trading platform…their data comes from Standard and Poors. I used Zachs last time and they were wrong often. I will check out Ray’s suggestion above too, I guess if you really want it correct, you go to each stock’s own websites where the company posts the date/time.
Exactly Nancy.
http://hosting.briefing.com/cschwab/Calendars/EarningsCalendar5Weeks.htm
hi guyz
a website where you can check earnings
No Follow through Today from Yesterday’s bounce.
labu truckn on.. woop 😉
LABU you go girl
..
Thanks! #HB
exactly…giggle
ABX, NEM, GG all green, GDX red. I dont see that often.
really chartfreak? lol .. both writing him at the same time.. dooo dooo dooo dooo )cue twilight zone..
really Maria? lol…both writing him at the same time …
Thank you! GSS and EXK up, everything else I follow down. AUMN is bouncing like a yo-yo. Up 12% Yesterday down6% Today.
Yes, as soon as I sold GSS, I believe it decided to stay green from then on : )
LOL, you usually do pretty good with your timing, the rest of us struggle.
Check out AUMN using a 9 sma on a 3month.
I love the way it clings to it, breaks it only on rare occasion.
AUMN looks to be flagging right now, not a bad pennant. Think I’ll put a limit order at $0.90 to back test the breakout.
drd up today, spiking up out of a wedge
Gold actually touched the lower trend line Yesterday and is now above it. refresh for blue line
silvercrest metals Canadian mine ( SIL ) is breaking out as well
was 0.14 in februari and now 1.5
uh oh – oil tripped down another stair. It has hit almost exactly 44.30 – 5 times since July ll and now it broke that support level and was down to under 44. So now does support become resistance at a new level?
Good call on having patience Alex!
This is all I can see for USOIL. Tempting to short……ERY, DRIP, DWTI
https://www.tradingview.com/chart/USOIL/JrUtRTqX-USOIL/
I’ve been short for a week (SCO), selling calls against any longer held energy has been advisable for at least 2 weeks now, pretty much since we failed.
ERX hanging in there despite a tough day for oil. Could the smart money be buying oil stocks in anticipation of an imminent oil bottom? TSI and Stochastics have a way to go but the 5 day RSI is turning upward. Just a feeling….
Only XLE and ERX, man. Other than CWEI, small caps continue to get PUMMELED!!
Not that this means anything, but a few months ago there was this interview with Kyle Bass where he said that’s what they (Hayman) were buying up. His new thesis has to do with actual oil reserves. https://youtu.be/dY-F-aGFyt4
I have always liked listening to Kyle
He is so relaxed and at ease as a speaker. He made a few great called in the past ( but I think his last was not good). I still like watching his interviews
Go to 20 mins on this interview.
hi Alex, what’s your thought on WEAT etf would that be the bottom ?
Nice double bottom with divergence.
I’d start with a trade and add if you;re right. And I think that will be the right trade
Alex,
Looks like you were right on, heads up yesterday historical several down days post bounce PM’s. Now with gold mini- double bottom test on the day. We’ll see if that means anything.
Yeah, nice work, kept me from adding late Thurs which would have been a bad move. Overall, not a bad miner day considering gold was down $10!
Added to my AUMN position just now.
I was thinking of doing that as well. Why did you decide to do so? Low volume and long tail? I’ve got a few minutes… ugh.
Erik, I got out of AUMN at $1.12 Now buying back at $0.96. With Gold reaching 38.2% retrace I expect the next move higher soon. If AUMN drops lower this week, I’ll buy more. Timing wise, it seems right.
I just bought a starter position in MGH for .32, and put an immediate stop at .28. If it moves above .34 I’ll move the stop to break even. I’m risking about 1.3% of my admittedly small trading account, which I can painlessly top of with my next paycheck if this trade goes against me. Bort!
GL. I’ve got all the penny stocks I can stomach at the moment.
do any of you all short very much?
I rarely out-right short individual stocks. That takes tons of research, especially since we’ve been in a bull market for 7 years. I trade inverse ETFs all of the time, however. I’m short crude right now and likely to take a long volatility (essentially short market) Mon.
Who’s in miners?? BOO-YAH!!