
July 20 – Focus
I want to FOCUS on a few things in this report
.
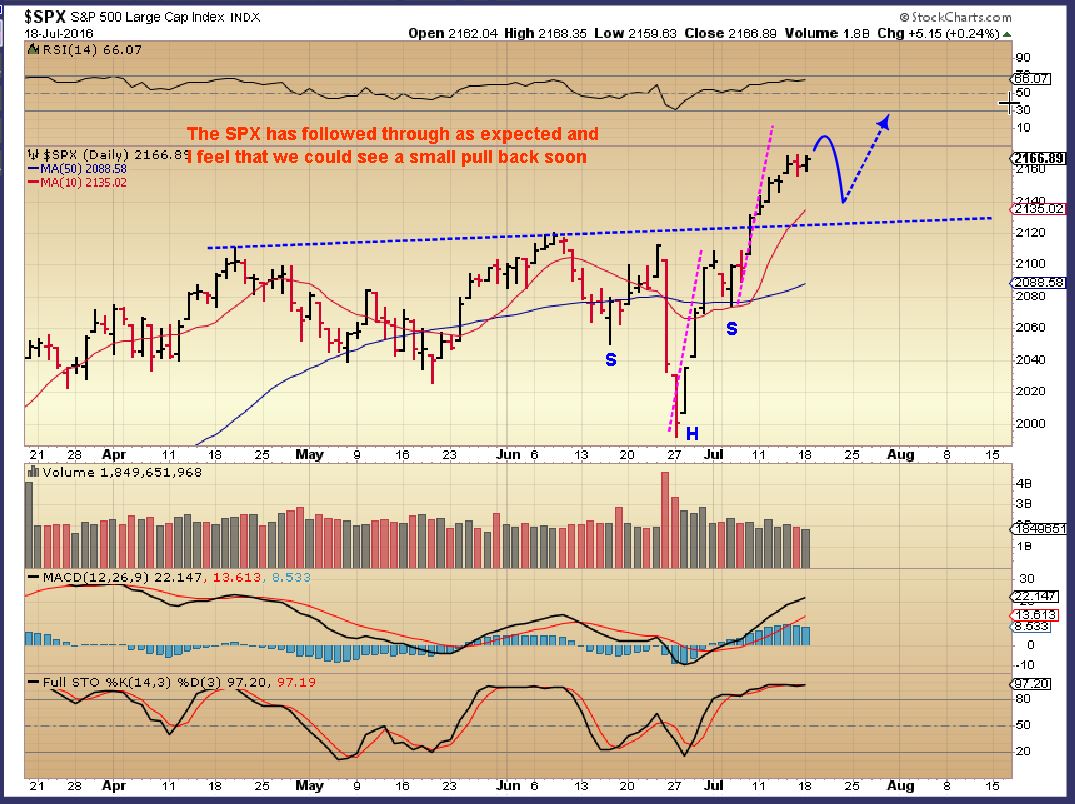
SPX – This was Mondays chart. Nothing changed Tuesday, so this isn’t my Focus .
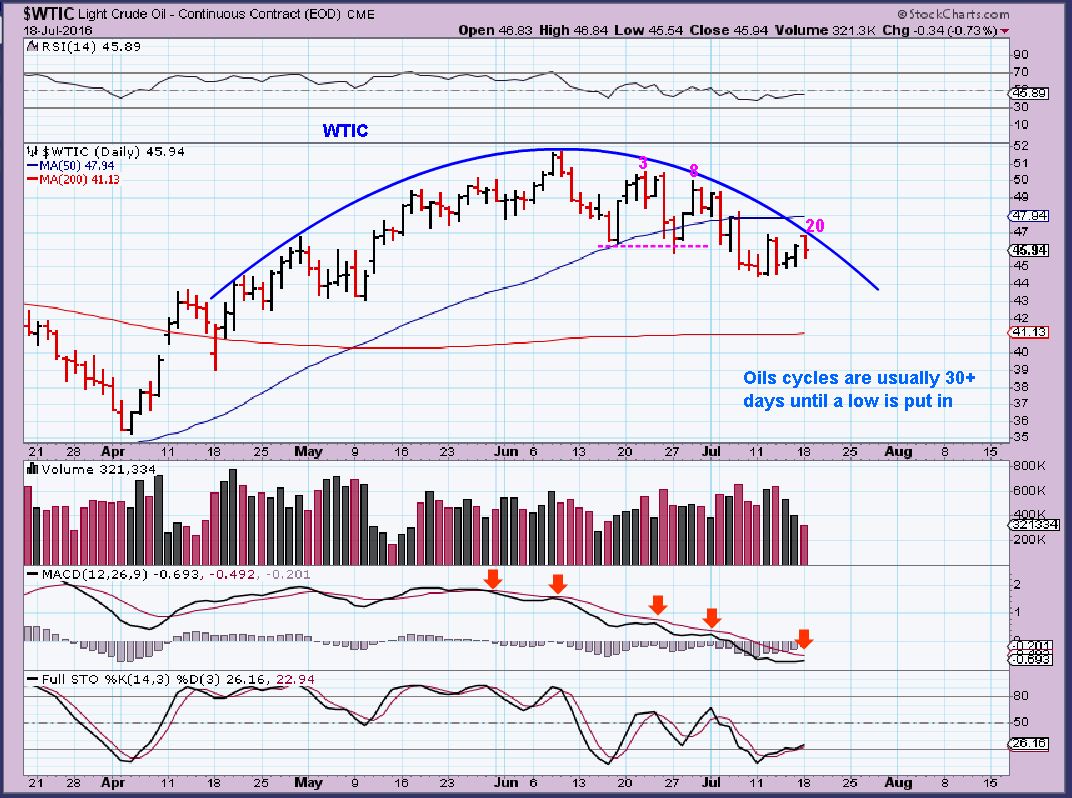
WTIC – This was Mondays chart, nothing changed here either, this isn’t my Focus.
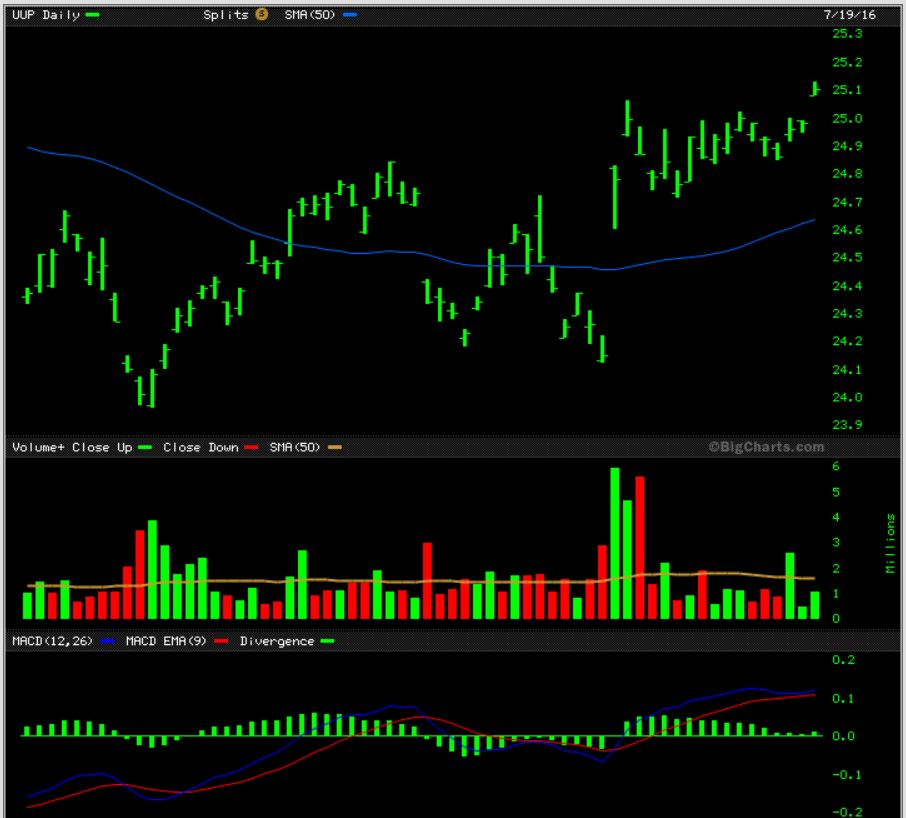
UUP – I’m using this to represent the USD. This is a temporary POP, and not a sign of strength. I think the USD will roll over into a DCL soon ( maybe that will boost Gold), and then it should move higher again.
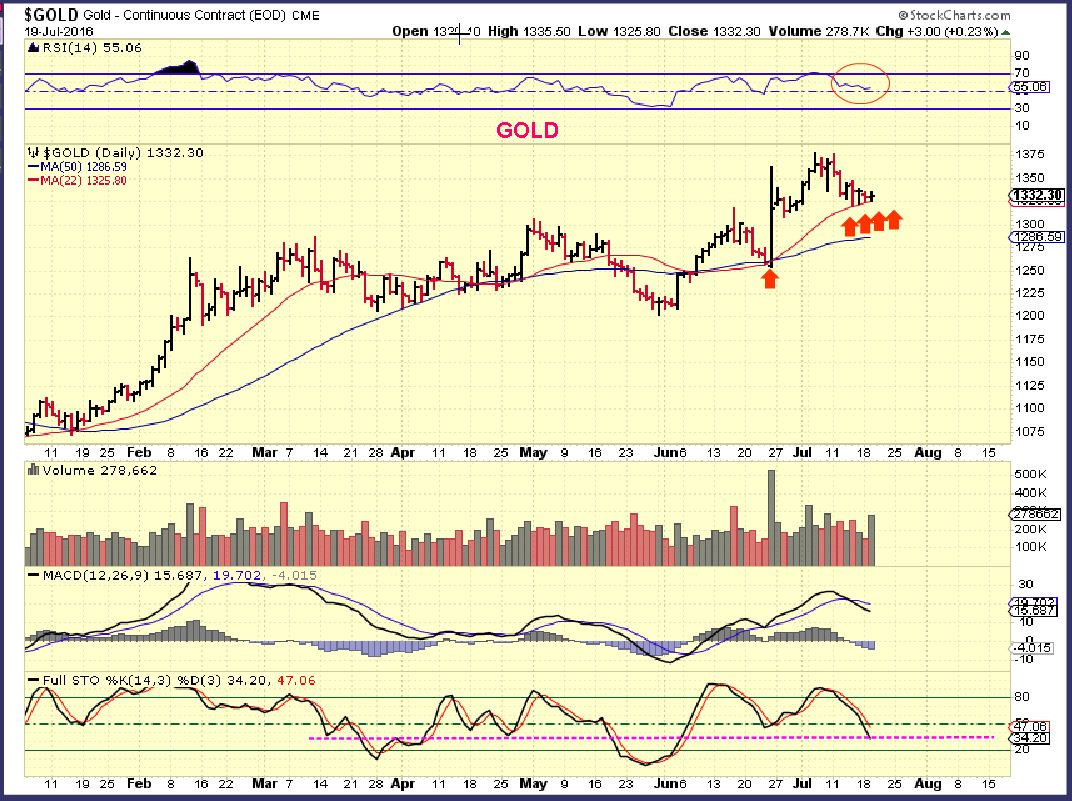
GOLD – I want to Focus on this area, since certain Miners still remain the best game in town at this point. When the intermediate cycle tops, possibly early in the 3rd daily cycle, I’ll focus on something else.
.
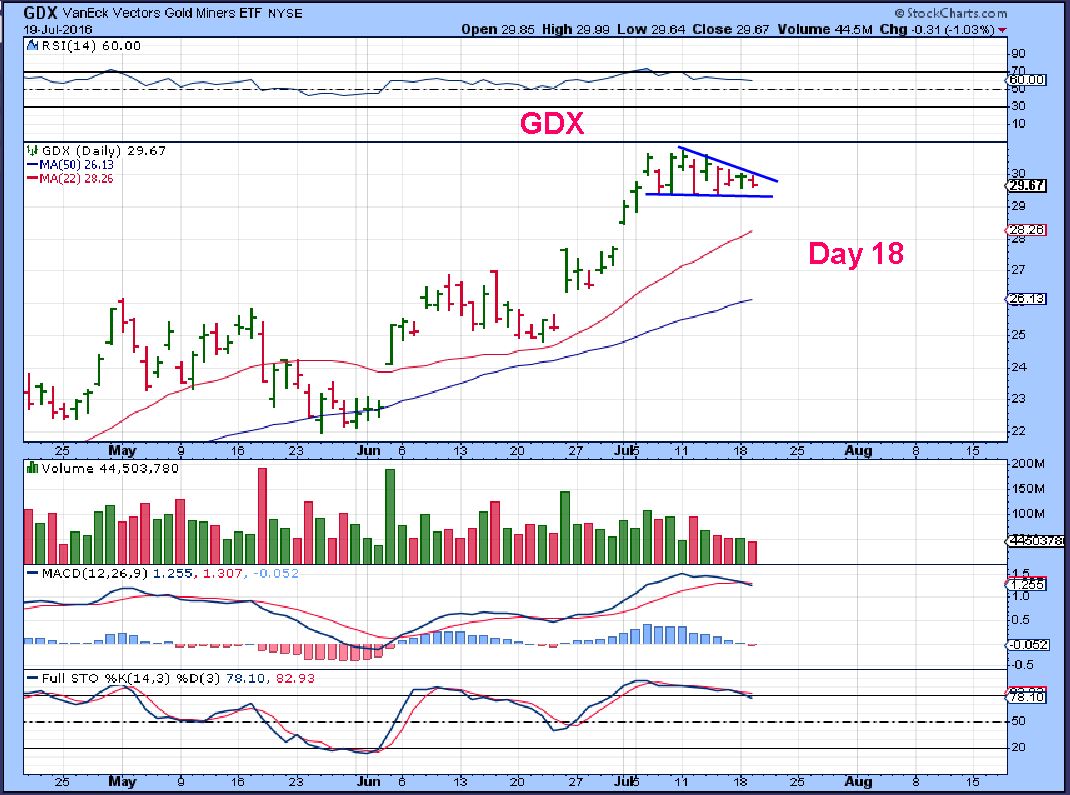
GOLD – Honestly not a lot changed here Tuesday, but I point out that it is holding the 22 sma and remains bullish. Can the recent lows of $1320’s hold on Wednesday? If not, I’d be watching the 50sma near $1285 as a possibility. I do expect a push higher soon for Gold using cycles. Notice that the POP in the $USD did NOT drop Gold. I would actually LOVE a drop to the 50sma to get cheaper prices in Miners, but so far GOLD is showing resilience.
GDX – Day 18 and it remains in a bull flag / Wedge.
.
SO we’ll focus some of our time on our Miner trades. This was AUMN intraday. After running straight up in the morning, it started to sell off quickly. I viewed it as a buying opportunity for several reasons. In the comments section I posted real time that I had a buy order in ( it triggered at $1.02) . I was looking for this back test using a 5 & 15 minute chart as shown. We can bounce around here, but I do expect higher AUMN prices. This can tag $0.99 and be a normal back test too.
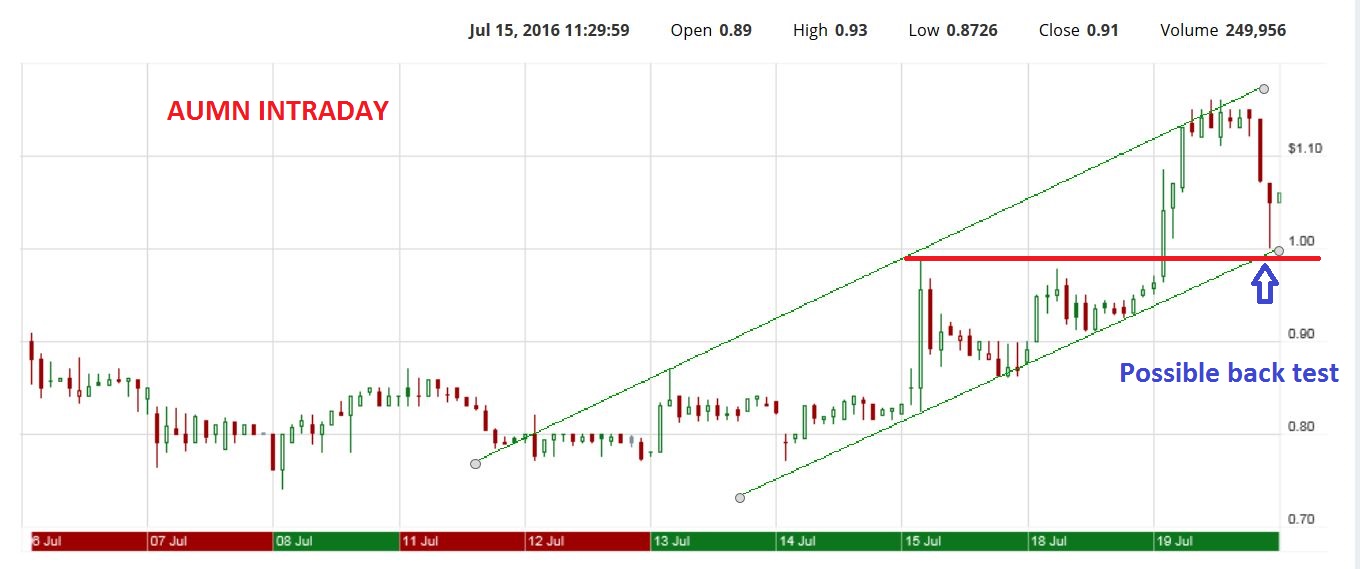
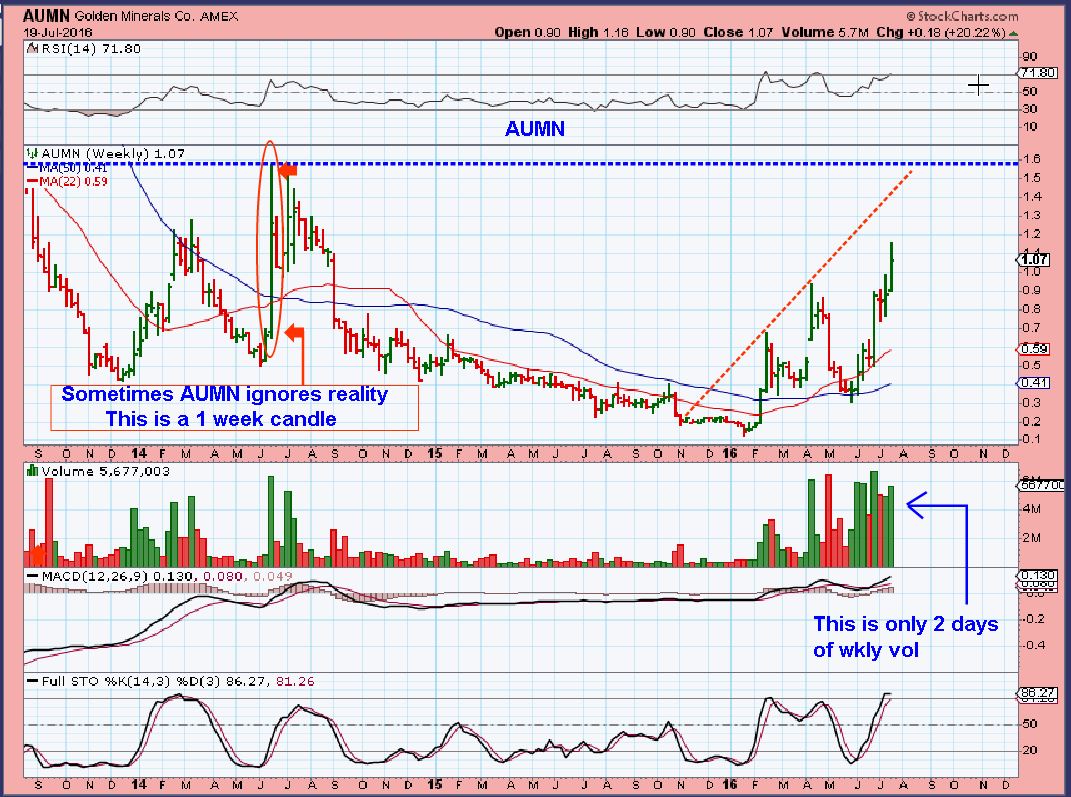
AUMN – So I see this as the potential to run to $1.50, as mentioned in prior reports. There is also potential to run much higher.
TRX – This set up I also have been mentioning in the reports as a possible bull flag. Many still own this from our ‘Buy’ at $050, since I wrote the report about not selling the extended move so early in an intermediate Cycle. This set up would be bought in the flag ( or a break out) and a break down would stop us out, a run higher would be validation.
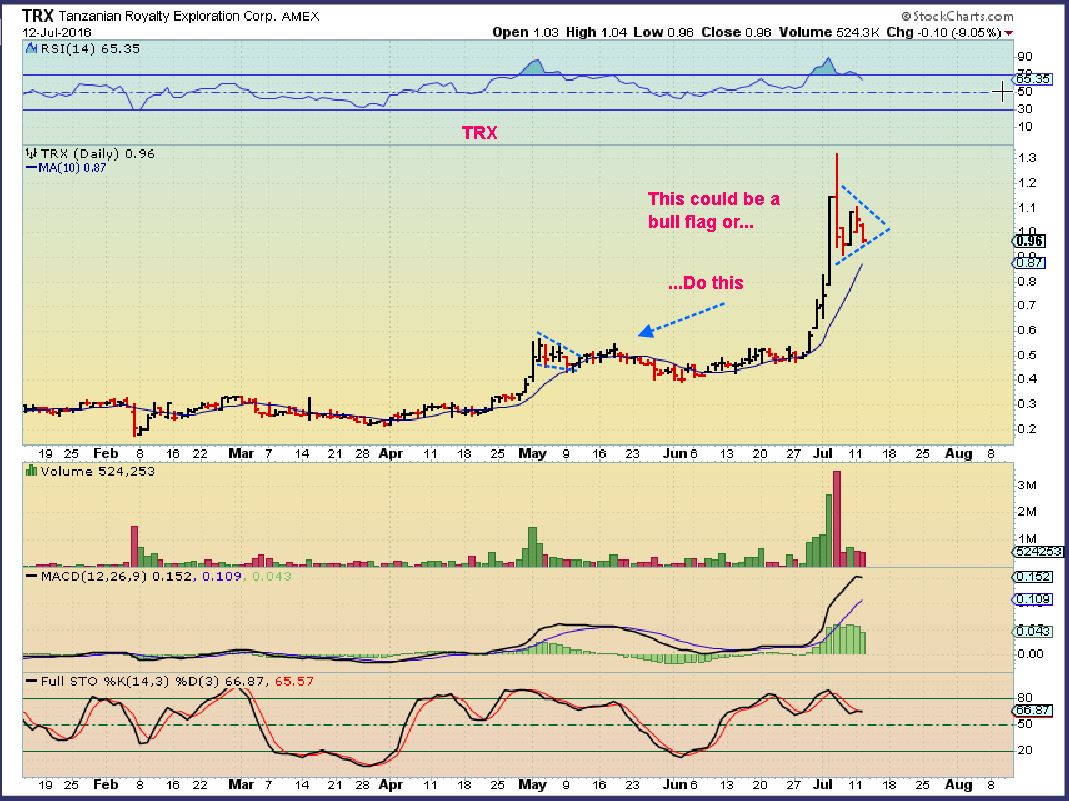
The flag broke out 2 days ago and follow through showed up Monday. This was mid day.
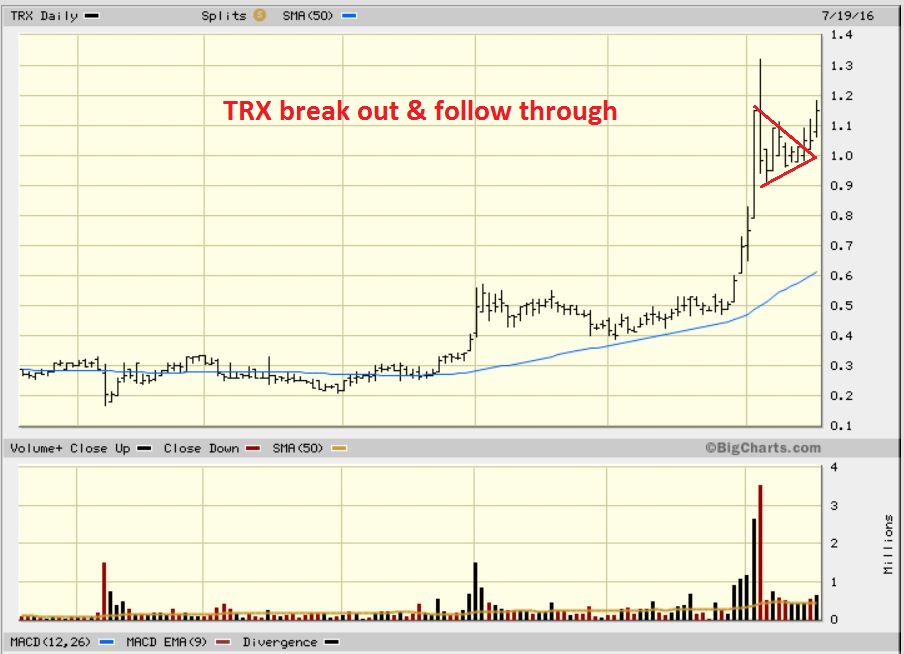
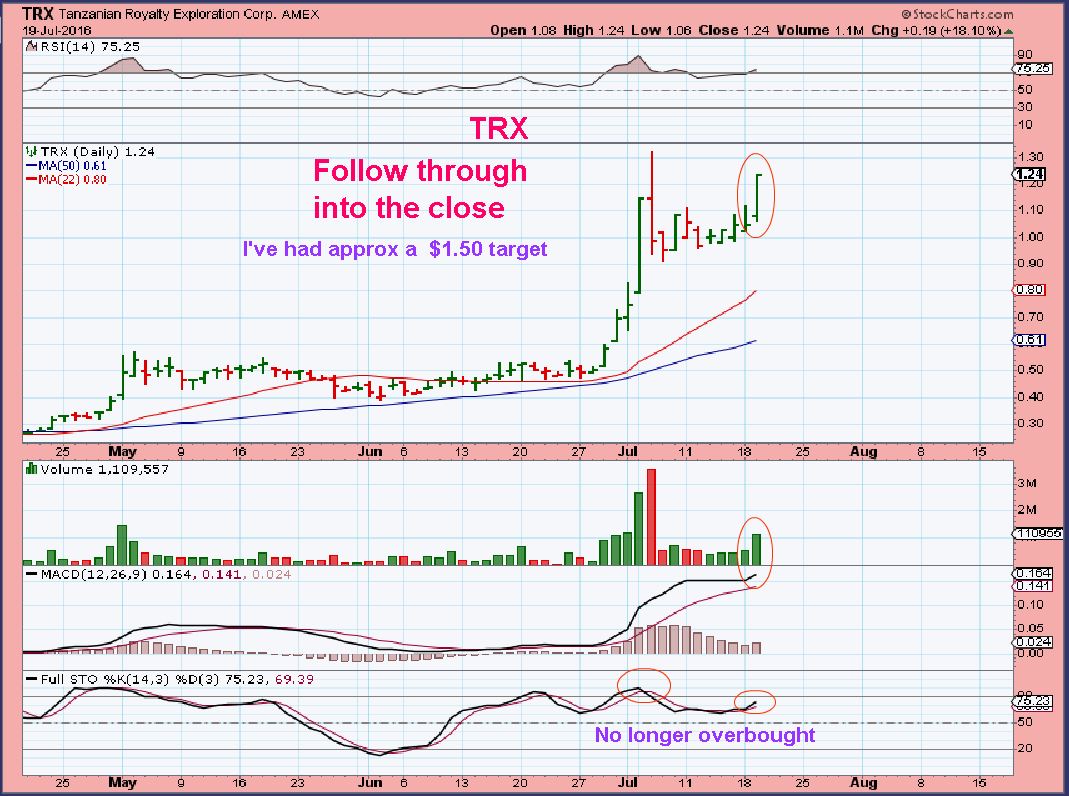
By the end of Tuesday TRX shot up almost 20% heading towards a possible $1.50 target.
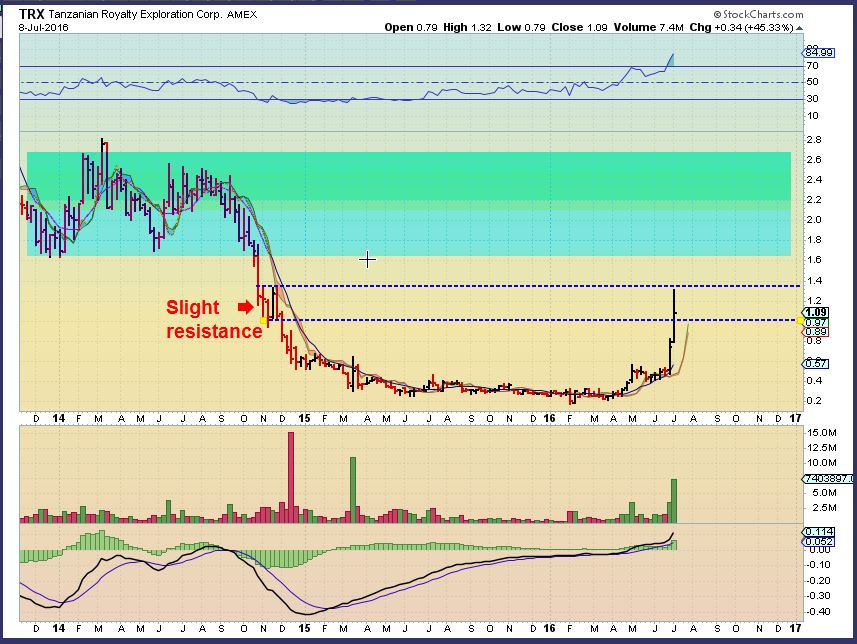
TRX – Slight resistance to the left , as shown in this area back on July 8th. This is where the flag formed.
TGD – We see TGD pulling back. This is not concerning. Back-test of the break out?
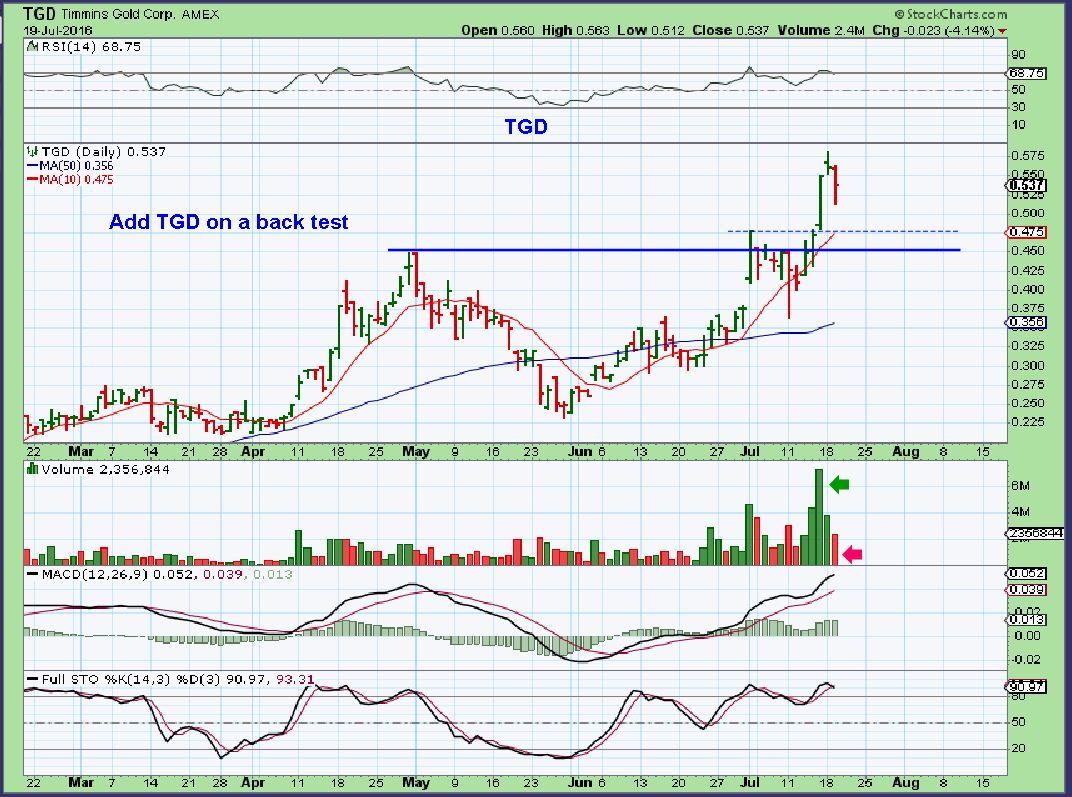
TGD- You may see something like this. it could be a buying opportunity if so.
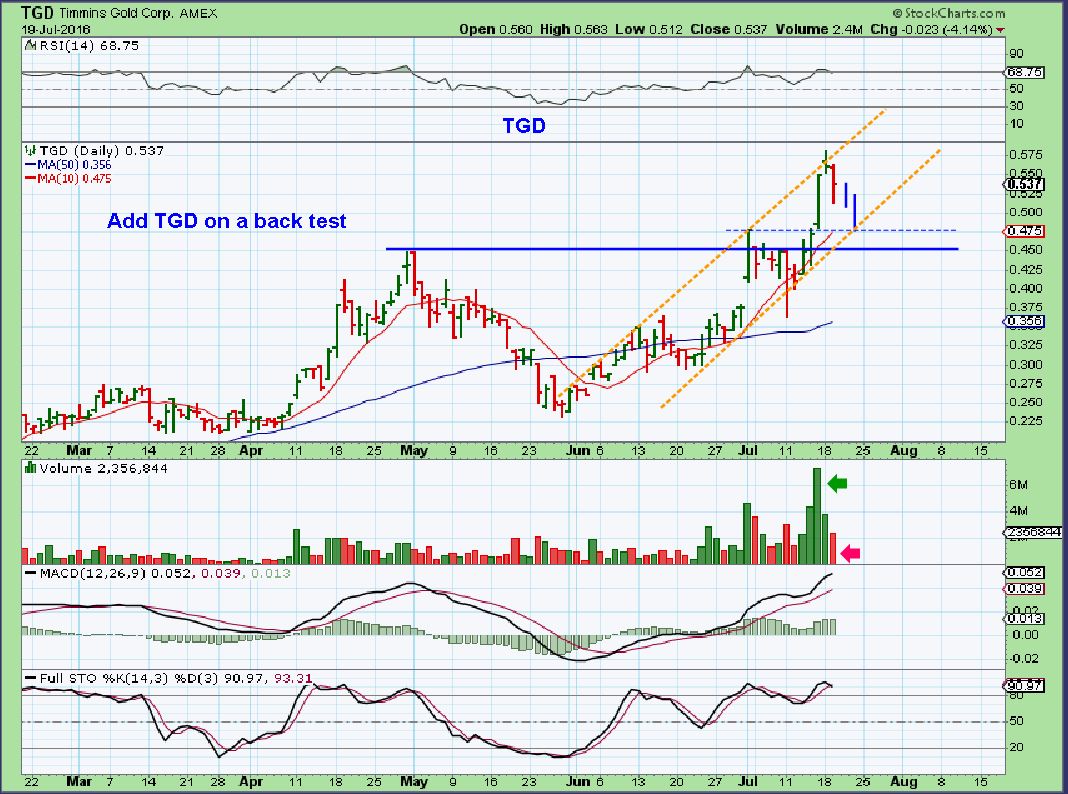
TGD – Resistance has been shown in this area. Patience.
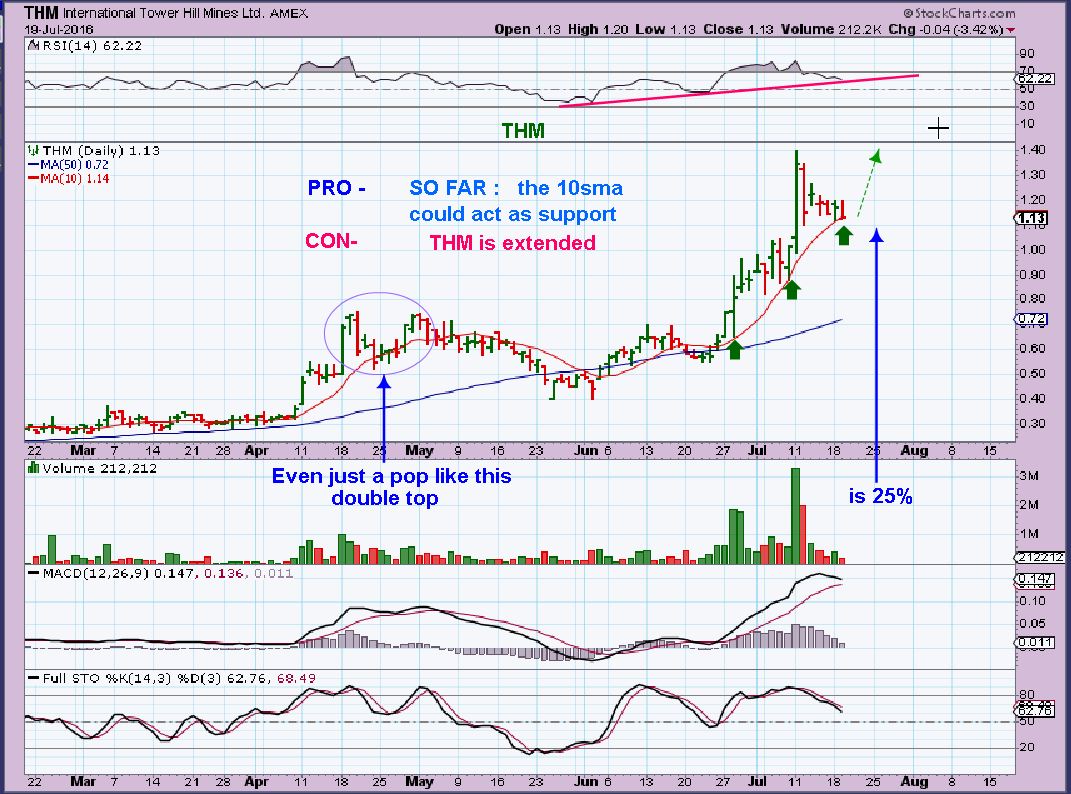
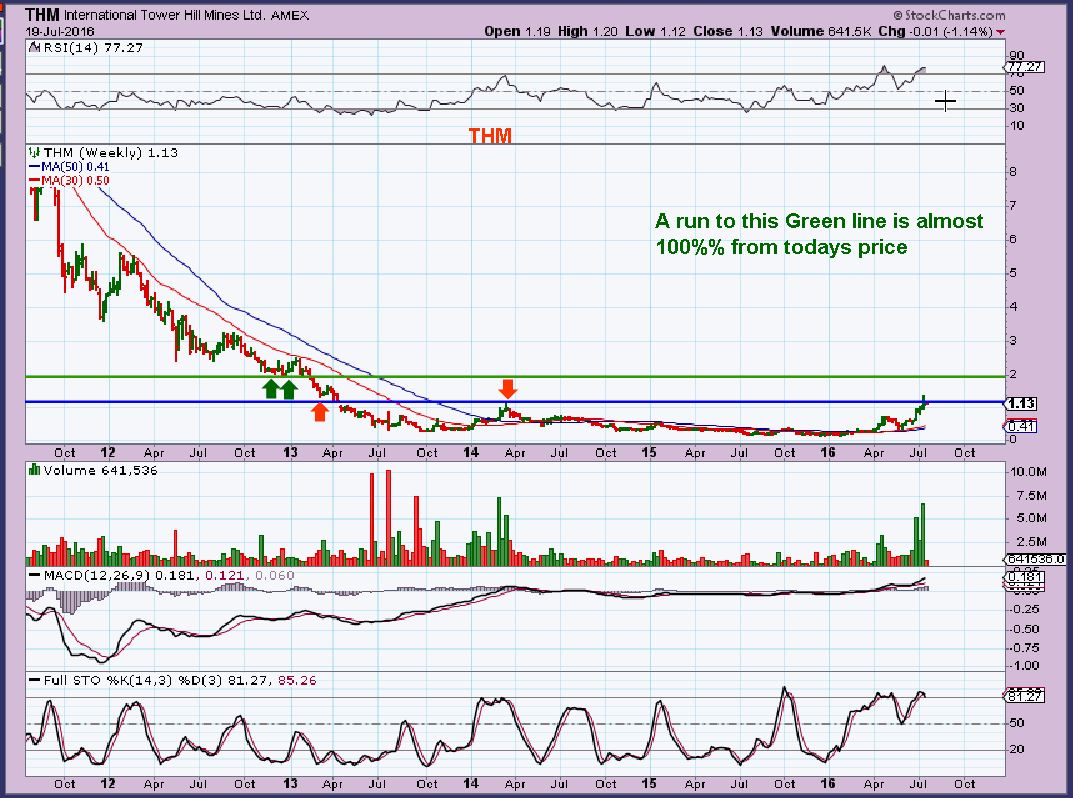
THM – This could be support, and a buy here would be low risk with a stop slightly below. The 10sma is holding so far.
GPL – At least it saw a price reversal Tuesday on support, and closed slightly green on the daily chart.
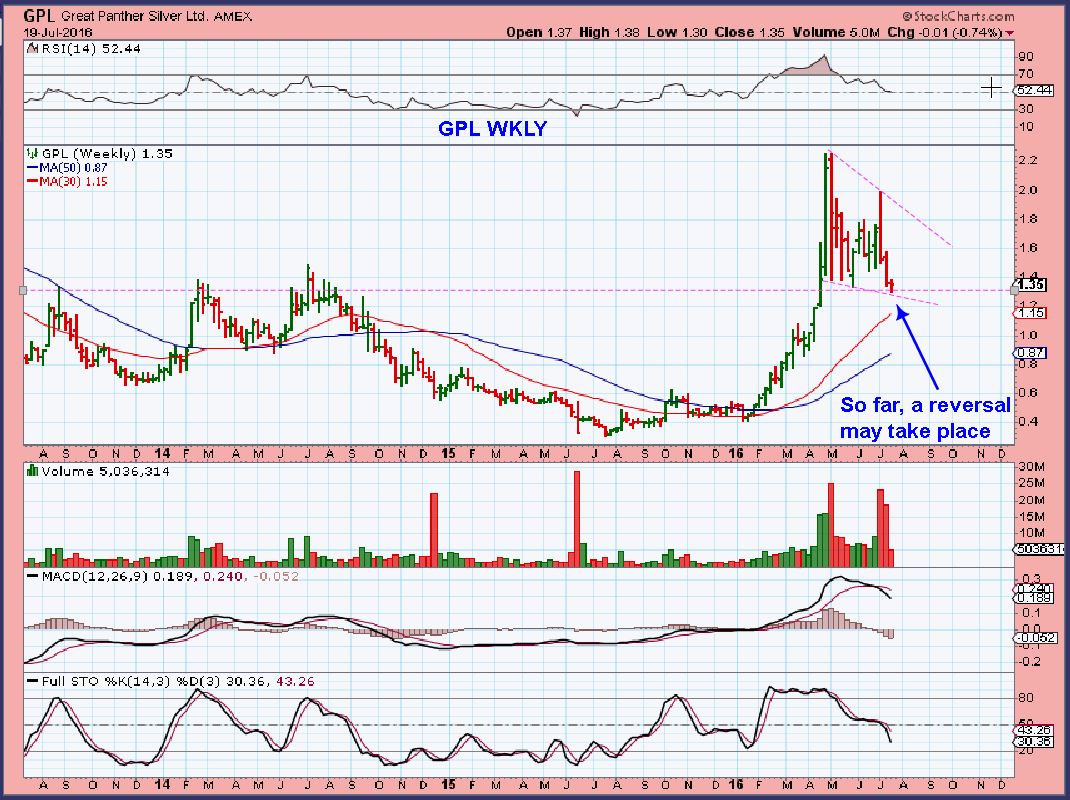
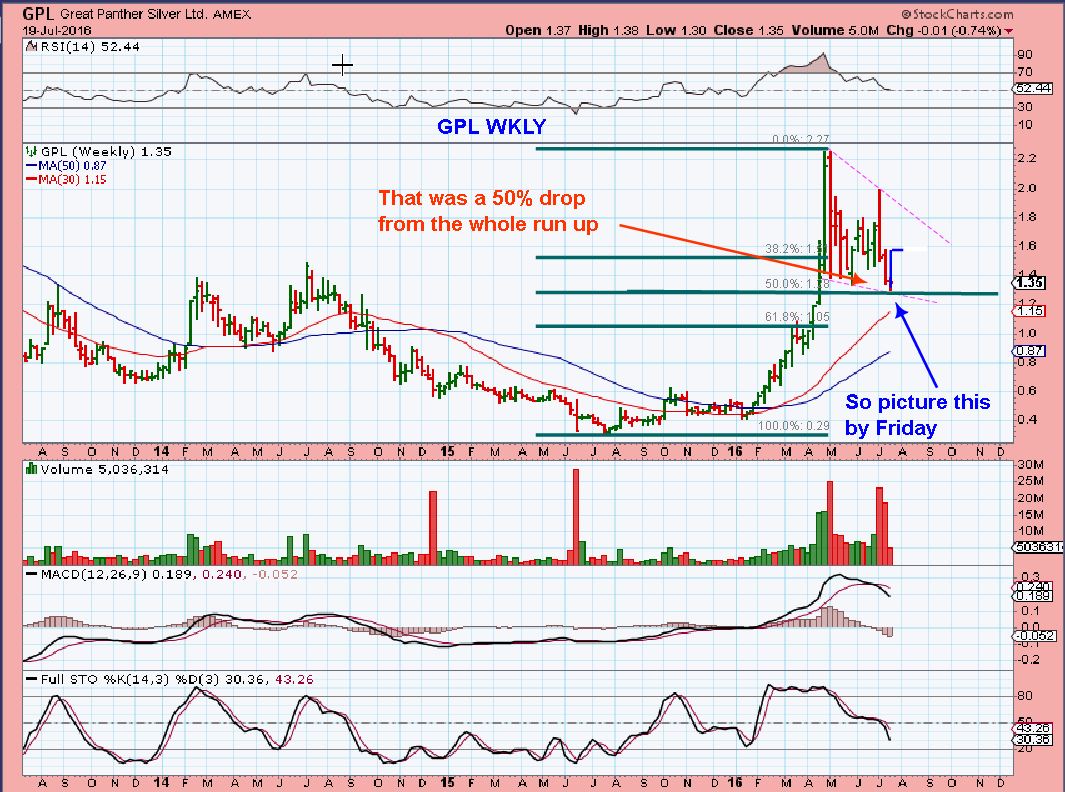
A weekly reversal shows that GPL just did a 50% pullback. This could be the end of the dip.
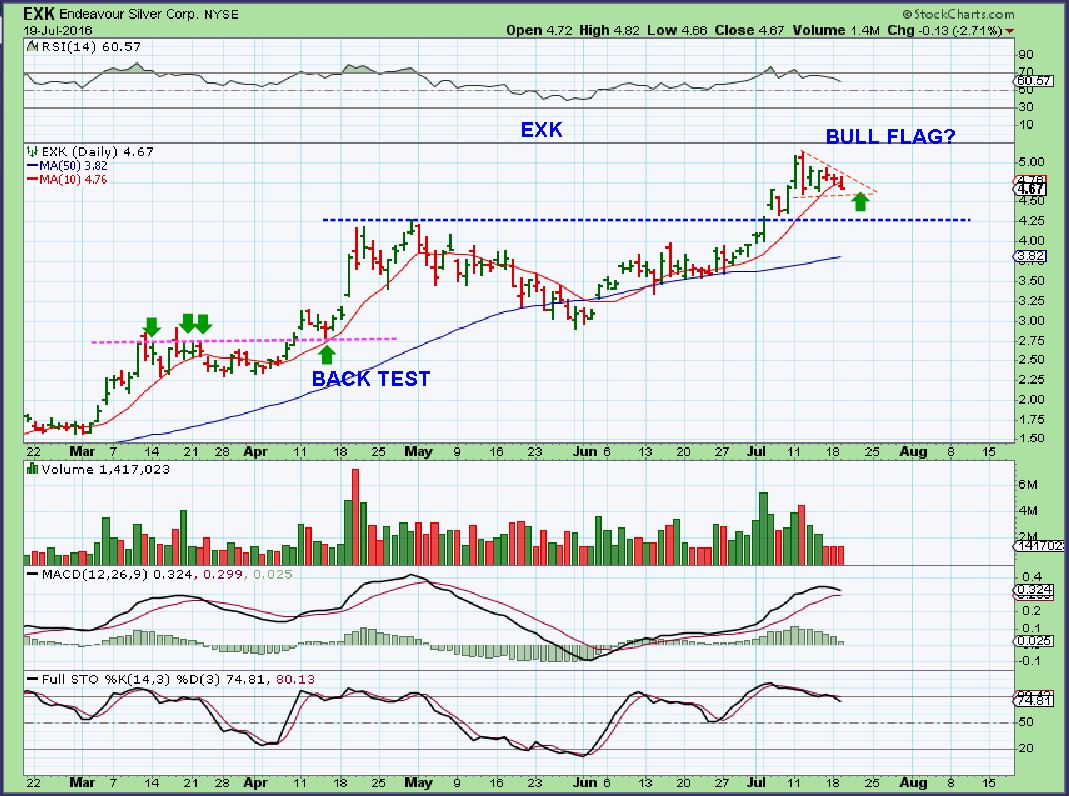
EXK – This could drop to test the break out and be fine, but…
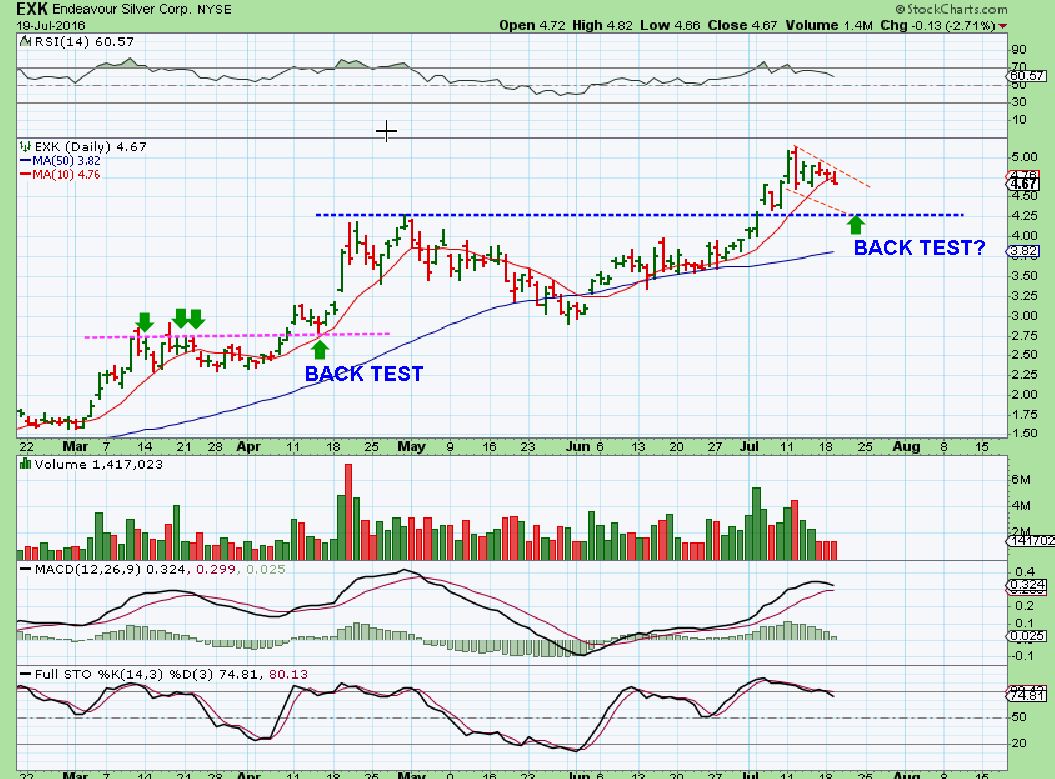
EXK– This is the same chart and also could just break out higher. A break above the upper line could be bought too.
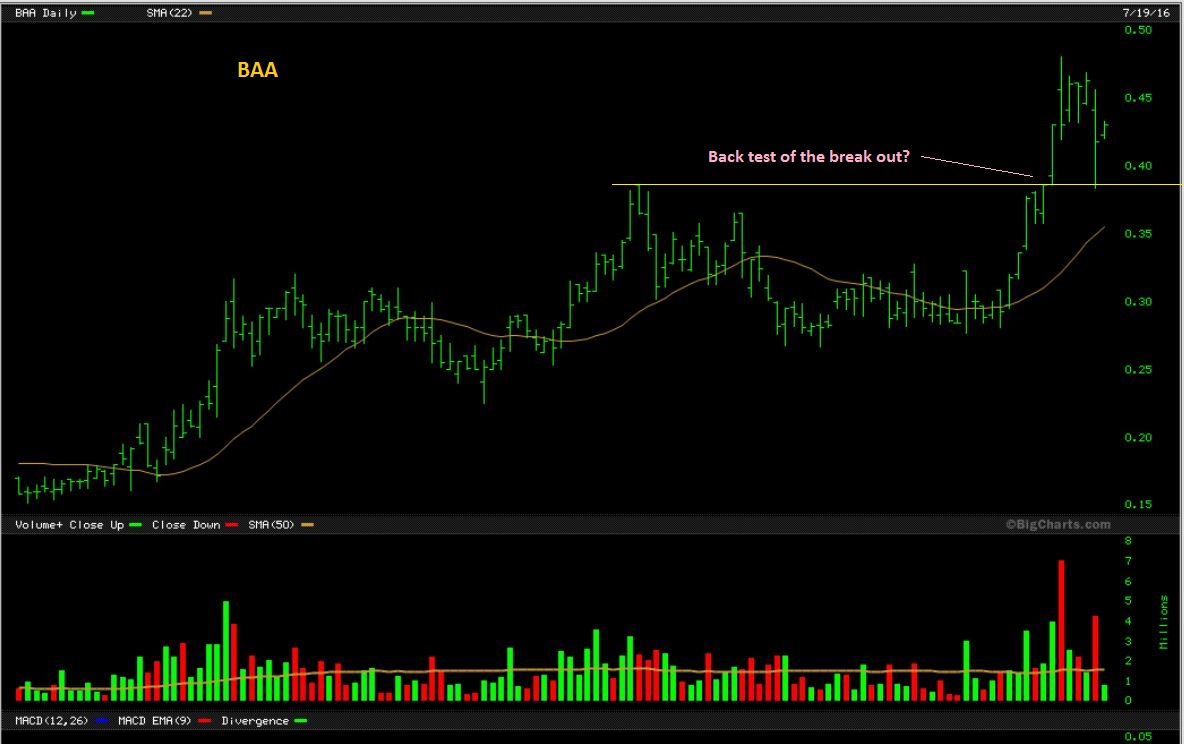
BAA – was that drop just a back test? It is possible, I have been seeing this happen a lot lately. Anyone holding BAA should be fine.
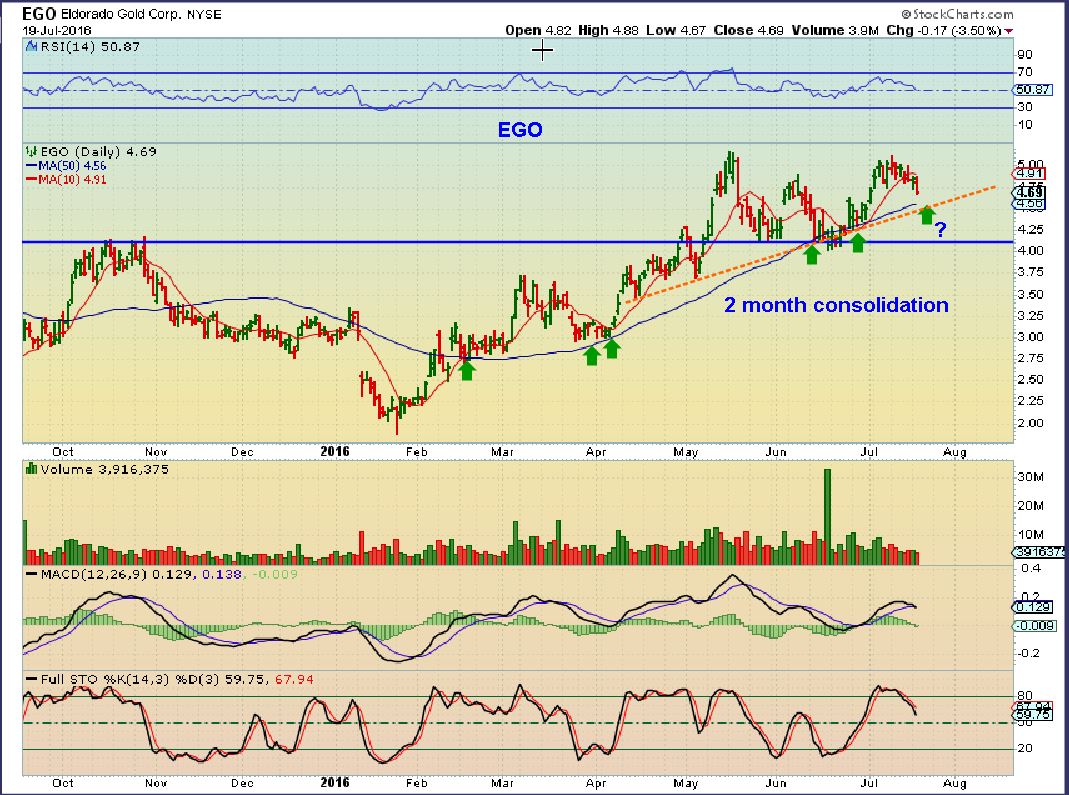
EGO – This could be presenting a buying opportunity soon.
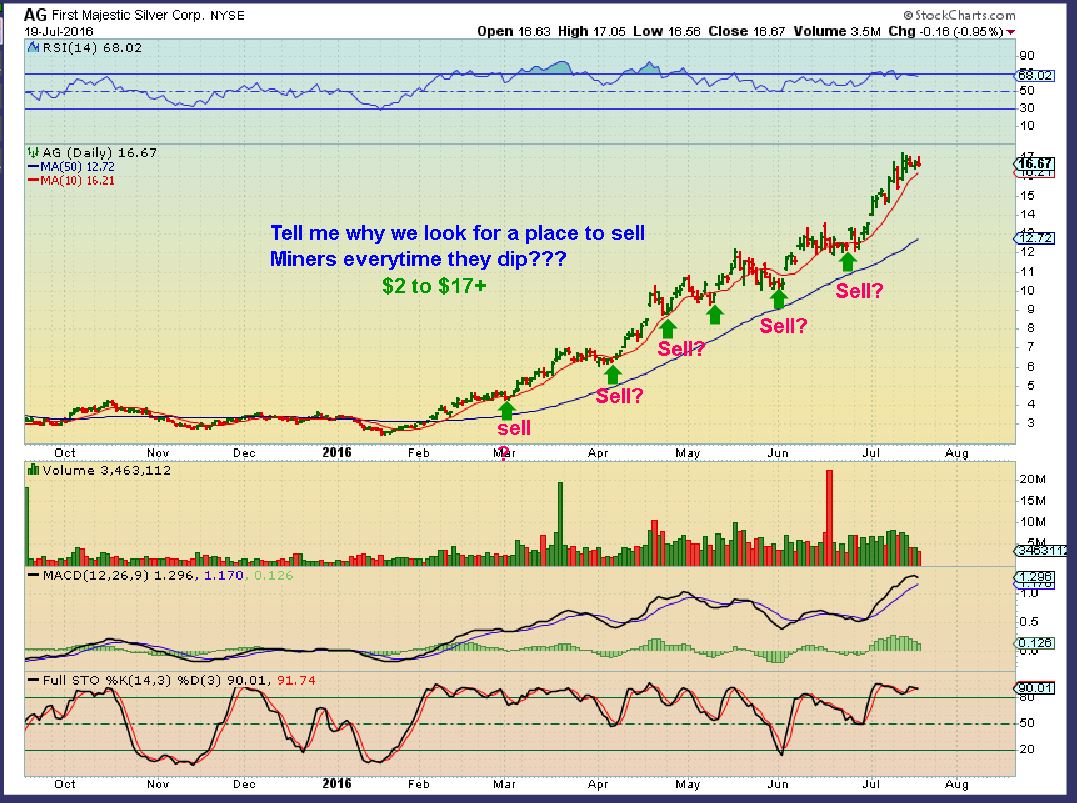
AG – I look at AG, PAAS, CDE, SSRI, etc and I wonder, ” Is Selling because we expect the dips a good thing?” Buy & Hold has been great for those that can ignore all of the wiggles and multi-day dips. At the next ICL this may tag that 50sma, but the 50sma has been climbing nicely.
.
Why dont you recommend ENERGY stocks at this point?
.
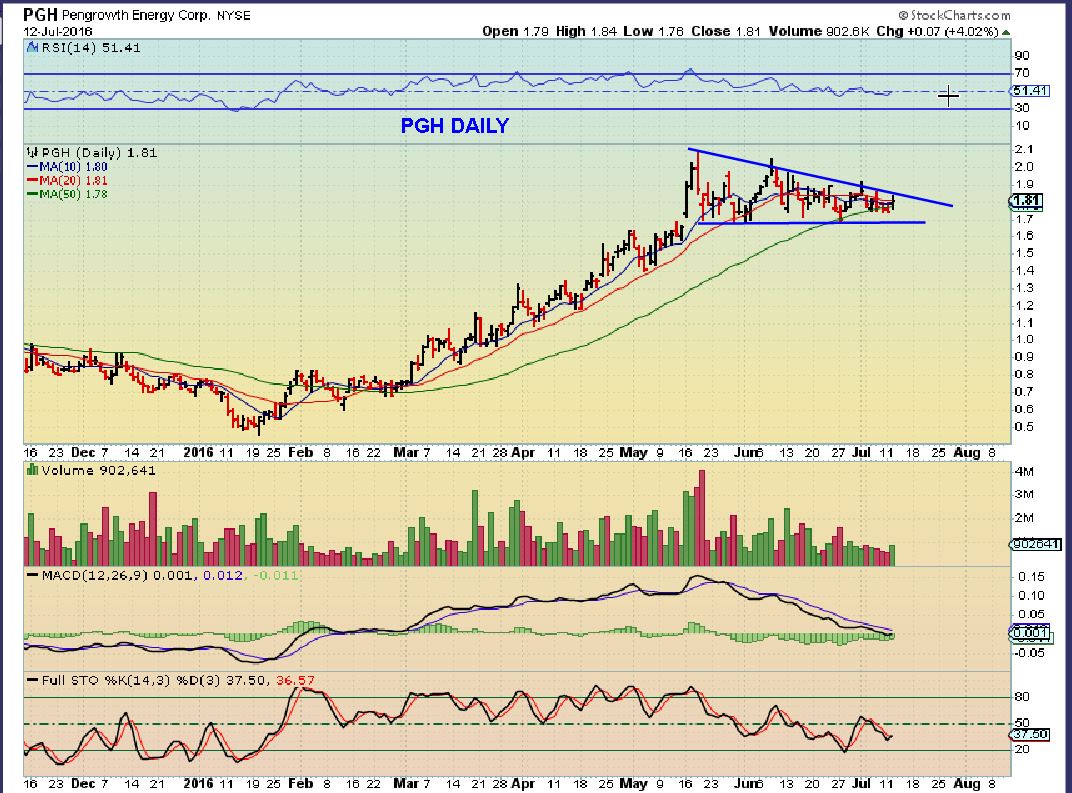
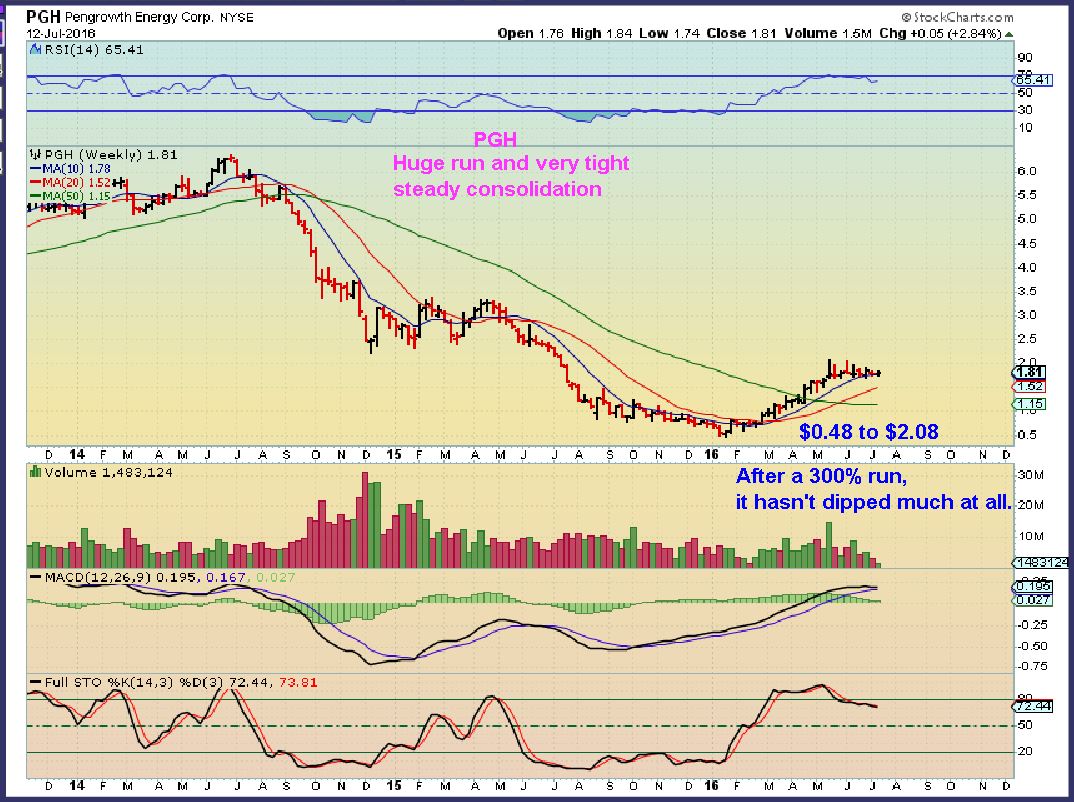
I saw many decent set ups, but then they fall apart as OIL remains weak. I am expecting more sideways or downward action in Oil, so I cant recommend any energy stocks now. FOR EXAMPLE: I WAS going to point out CWEI, OAS,and PGH recently. I actually did mention set ups in CWEI and OAS, but I wanted to watch PGH. It was a perfect set up at that point. These are the 2 charts that I collected from PGH. SO BULLISH looking.
.
PGH – Bullish wedge / consolidation


Alex- all these flags/wedges in gold/miners appear to be breaking down hard.. That would invalidate the upside case no?
Hi RM
That would not invalidate ‘the upside case’, but it may invalidate the flag or wedge. The markets aren’t open yet, so we cant say what the miners are doing , since pre-market trading doesn’t add to the GDX chart. I have seen Gold & Miners RED in Premarket in the past, and suddenly they turn green after 8:30 A.M.
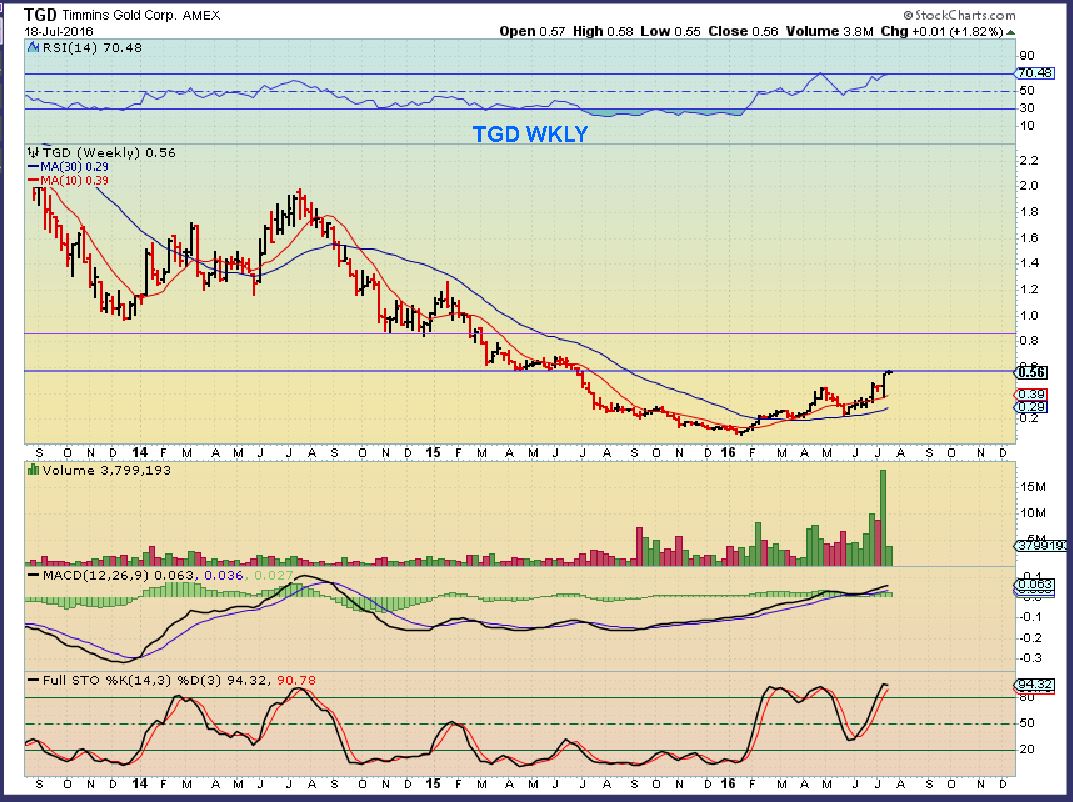
In the weekend report, I pointed out that a back test of the break out on Gold would be normal, and also we saw the 200 MA on a weekly basis near $1306 also could get tagged (I will attach a chart or two below from the wkend report, refresh). SO this is all also normal bullish behavior, along with Cycles that favor the upside in Gold. The ICL in Gold was the last week of May, so its too early to expect a continuation of a drop.
So the patterns may become invalid or break down, but they are only 1 of several upside case indications.
2 charts below from prior reports.
.
Alex, thank you for calming the “nervous Nellie” in me.
Ouch! Painful open! RED!
Alex, why do you think stocks like AUMN and TRX get so much volume, while most of the sector moves down? I don’t see any news, and these aren’t lagging.
It could be a number of things. Depends on what you believe.
Could be ALGOs trading at pivots, could be fund managers entering, at time when shorts are covering, etc etc
I see it a lot ot critical technical areas like pivot points, out of lows Short covering) etc,
Alex, are you holding any of the other commodities like CENX, AA, X, VALE, CLF,etc? I see CENX roll over more than the others. Would you hold here or sell and try to buy back later?
I bought CENX, AA, OAS, and AUMN about a week ago on the good setups. Already stopped out of OAS and CENX, AA in red but not stopped yet. AUMN was awesome through yesterday, but now worth about half of what it was yesterday. I have/had price targets for sells, too… we’ll see if I can get any:)
I saw XRA two days ago just didn’t look right while everything else in the sector was going up. Then TGD started rolling Yesterday. But AUMN and TRX were so strong and most others looked to be flagging I just held. I did sell XRA and TGD Yesterday. So, now I do have some cash to buy some lower sale prices.
Lucky you! Bad day for me. Just clenching my teeth and waiting for relief. I think I will turn of the computer and go out for lunch and hope to come home to improvement!
Lucky me? No, I had my finger on the sell button for AUMN when it was up 18%, didn’t do it. That would have been lucky me.
Yes, for me too….I failed to listen to my sign on the wall “take profit and walk away”……again….I guess I am realizing I am not the buy and hold kind of person…..now that I am facing that truth maybe I can start acting on it better in the future….
Its so hard to get back to the buy and hold mentality after the last 3 years of a BEAR market in PM.
Looking back at my trades for the year – all of the bad trades are from selling. If I just would have sat on my hands………. (is there a gif for that?).
Anyhow, I am trying to keep my stops well out of the way, so they are there to protect from disasters, but so that I don’t get taken out on the dips
Right…..I held on to some gold stocks from that time – big losses – but I have gained them back …so now it’s really really really hard for me to hold anything if it starts going south…..because that’s what I did before when I should have sold….
my strategy now is to just hedge with DUST as soon as things start to head south… then sell that when it looks to be bull-running again.
having said that, i’m $1500 worse off now than i was at this time yesterday 🙁
That’s good or bad depending on how large your account is.;-)
i certainly wouldnt classify it as good!
SOG, I assure you I am down much more than that. Misery loves company.
🙂
its all relative.
dont think Warren Buffett would be crying over $1500 either
Funny , but you’re right. Thats a matter of perspective for ya.
For a $5,000 acct, that would be a killer, for a $100,000 acct, that wold be a normal day. Just a 1% loss.
I’m down pretty big today too SOG, but from May ICL to now I am also up pretty big, so hopefully that is the case with you and others too.
In fact, that is despite my 2 bad trades since may GPL and NAK. ( Nak I added to my original purchase, so its now down cost basis wise).
I did that too…big time! I have one account that is filled with metals stocks….some have turned green, but many have a long way to go to break even. Dismal. But I also had one other experience. I inherited a small portfolio of “sensible” stocks when my folks died…..in 2000…and I held it all through the big crash. I recall feeling sick everyday. But, over years they ALL came back and surpassed where they had been. So I learned the hard way to step back and see the bigger picture. If our country implodes, the market will be destroyed…but so will EVERYTHING. For now, it is a big game. Just make sure you step back and observe that. Makes the immediate things easier to get through. The sun comes up again.
Nancy, this resonates with me. Though, I still have some catching up to do to get back to “even”. Thank you for posting.
It is so strange for me to have bought newly, since with Alex, stocks I viewed as dogs in my old account! In my new account, some of them have been good trades [in/out] and some I am holding as a core….but the counterpart in my other account is still in the RED! Many. And many, VERY red. I have hopes that someday they will all be green again [if they don’t go bankrupt!] Good luck.
Just a reminder to look back at Alex’s chart above on AG. The pullbacks are painful, but if you truly believe we are in a gold bull again, buy/hold is a good idea. To try to time all those in/outs is really hard for me…I always seem to get in a little too late and out a little too late!
I’m going to put this in a report in the future…when something POPS 20% like we’ve seen, I’m just going to say,
“I am going to hold my position, but if you have a sign on the wall saying “take profit and walk away”, you may want to do that 🙂
Hahaha! 🙂 🙂 I think if I could hold some of these long term it would be a good thing – I’m just so gun shy on that since the recent memory of having so much red from long ago still lingers in my mind…I’ve gotten most of that red from long ago back but still have a couple of laggers…..in time I’m confident they’ll also be break even or green. Maybe my sign on the wall should say “take profit and walk away – or if not then be prepared for anything – a great gain, a bankruptcy, a break even” – if I can prepare my mind then I’m ok – if I can say “I knew keeping it always had the possibility of dropping, so this drop here is ok, in time it will be just fine so don’t worry about it right now” …rather than “oh my gosh why didn’t I sell? why didn’t I think about it more? what if this does what the others did long ago? gosh why was I so stupid again?”…………mind games 🙂 🙂 But yes, do put in your report and that will make me stop and think! 😛 😛
Happen to ALL of us. You are in good company.
My question as I look at the chart actually is do I add to AUMN today or wait for a tag of key support. After getting hosed in the bear, I haven’t really traded (did buy some AG in February) and these trades last week. I don’t really know how to trade–that’s my main problem:) What I’m trying now is to enter good setups with smaller positions, and immediately place stops in an affordable recovery range (for me, that’s about $100 per trade max loss). If the stop gets hit, I just top off my account with my next paycheck. If it runs, like AUMN, I move the stop up to break even. I’ll try to add on this dip–soon?–and then let it run for a while. This way, I can feel “empowered” to easily top off my losses and if I get one winner out of four trades, it easily offsets the other stuff without too much of a cortisol dump. Maybe it will work. Time will tell.
IF we are truely in a Bull market then you don’t have to worry about stops. All stops will do is get you to sell low. IF we are in a bull market then the market will correct your trade timing. IF this is a bull market you shouldn’t see much more than a 38 to 50% correction on the FIBO. Look at the major MA’s for support, lay in the FIBO numbers. That should give you some expectations. AUMN is very explosive in both directions and you will see more movement. AUMN currently hasn’t even pulled back 38.2%, it doesn’t have to. It may get support at the 10SMA which is probably going to end up around $0.89. I’m holding my AUMN for now. Probably better to track GDX instead of AUMN because of the volatility. Look for GDX 38.2% for the turn in AUMN.
True that some of these stocks swing so big that it is tough to find a stop that wont get triggered in a 1 day drop. I still try to have a mental stop just in case something goes hay wire.
5 yrs from now? These miners could be many hundreds of % higher : )
This is a good post. It’s a good idea of how to plan ahead and execute. I do think that the bull market is going to be very good to miners longer term, but with these public offerings and other things that can short term drop a price, it is definitely a little tricky and having a plan that fits your tolerance is a good idea. If this happens, I’ll ….., then if my stops get hit, I’ll……, Then I’ll….. Good post Eric.
I should have sold XRA, I got in too late and she just isn’t performing for me right now.
Hi Bill, I only own Miners right now.
I think that CENX looks fine – it appears to be right on that trend line from June and above the 50sma. It is tagging the 20sma. I wouldnt have sold yet, but I’d be watching those things
Thanks Alex, good report. Appreciate your thoughts on BAA and TGD as I own both and am planning to hold them long-term.
Alex thoughts on cycles? If this is 2nd dc it appears that this will be left translated. Wondering how valid you think the counts are at this time?
Hi Deshy, Good question.
2 things. MAYBE this could be a very stretched first daily cycle, but boy is that getting stretched if it is. Almost 2 months long at this point? I’ve seen that in the bear market, but I hadn’t seen that in the bull market so didnt expect that to be the case. And it would be great if it was because then we’d only be starting the 2nd dcycle soon.
I saw Miners as having put in a first dcl already near Brexit, so I counted Gold that way with the Gold freak candle too. IF that is correct…If this were a dip down into a dcl, it would be L.T., but if it rallied to a new highs this week and then dropped into a dcl, it would be r.t. since it is day 18, we could rally to a high say day 25, then dip to a dcl by day 32 for example, if you can picture that mentally.
We have seen that before, and also it is what the USD just did. It looked very L.T. going sideways under the 200sma, and then the pop to new highs later in the cycle, becoming r.t.
I’ll put that in tonight’s report with a chart in case you cannot picture it
I posted last week I thought we might see NUGT at $139! If you remember I was asking about EW and how I thought we were on 4? Its now at $131. Wow, how quick these 3x move. $129.68 will be a 50% retrace of the last move up. I suspect that will support prices. Gap fill at $127.22 maybe
That NUGT is unreal when I look at the moves in that chart. I’ve said this before, I sold mine at $49ish, but even if I had held on, I definitely would have sold it again on the way higher with that kind of price action. Wow.
Still dropping like a brick. Wow
Here’s a possible happy story: I stopped out of EXK on July 11 at 4.96 for a $1.03 profit. This morning after reading Alex’s post I put in a stink order for $4.25 and if filled, and already moving back up.
I grind my teeth when stops get hit, but this was one time it might work out to my advantage
Hey R.B.
I see EXK above your buy, so thats good, but what I dont like is the gap down on very big volume with no news at all. They had what I thought was a good earnings release on July 12th, I dont know why it would gap down like that on such strong volume. Just keep an eye on it, it may fall to the 50sma .
I’m not saying that it is a sell, overall it is still fine, but I just cant figure out the reason that it suddenly dropped like that, when it was holding up well other days that gold / silver were down.
Nice trade on the taking profit a lot higher too.
interesting – this was on my “do not trade list” because of the financing they are doing, but my stink bid filled. By having a broker sell $40mil into the market they will put constant pressure on the stock until they are done. And then they have the balance of the $170Mill shelf they can use to dilute when they want. So, call me skittish, or you can even label me as a day trader, but I just bailed on it and now I can easily afford to go to go out for a burrito tonight. Thanks for the heads up.
I had the exact same bid already in from days and days ago!
not so smart on AUMN though – bought it at 1.01 and its already down 7%
IMHO:
This is an HCL for Gold. Gold is at a major TL, which is support, with a 38% Fib just below that.
This is why I took 50% profits off the table last week in my PM Jrs……”Gold looks and feels heavy here at these levels”.
I am now adding back that 50% starting today in tranches. Stay the course…….
Added: GDX 1/18 Calls…..in case the TL holds.
I started a few calls today, clearly was a bit early. As long as we only have a few big down days, can recover ok.
Good job Ken
Thank you LABU
WOW , lots of really good conversation here today. Really good stuff from everyone. discussions about learning lessons, talking about the sell off as good or bad, etc
I think things still look really good. If you own everything you want in Miners, it doesn’t FEEL very good at all ( especially depending on when you got in) , but honestly, I own TRX & AUMN near 50 cents, and the drop still feels bad. Is it bad?
I look at the AUMN daily chart and doesn’t it look very normal? ( I attached it here – F5 🙂
I’ll go back now and try to answer questions addressed to me specifically.
Looking at UCO and seeing a pretty interesting reversal there. With OIL drifting lower the way it has, you have to admit that CWEI is really hanging in there. BTE is also just going sideways.
SOme Energy stocks may be good buying opportunities when OIL finally puts a low in . I’ll be waiting for OIL to break above the 10sma and the overhead trend line for confirmation
watching SGY
pretty light volume on some of the energy stocks and oil has a nice reversal candle hanging there, but I have to wait for confirmation
SGY did a gap fill and hanging around the 10sma. I really like the look of BTE & CWEI too
The previous support level of about $46 seems to now be the resistance level Yesterday oil came within a penny or two of it’s July 11 low and so the $44.40 level seems to be support for now.
I don’t see any news out there that is at all positive for the price of oil firming up at the moment, in fact if you believe the news we are still awash in oil as well as refined products.
So until the trend changes I am going to sit.
EIA report came in bullish this morning.
MUX got rather ugly today. I dont see any news, but it had a fairly good looking sideways move a few days ago.
Thanks again for your guidance and teaching Alex. FWIW im almost 100% in and have been for a while. Been swapping in and out of stuff but almost at 100% none the less with some VERY nice gains thanks to you sir.
I’ve been running so well for the last 6 months or so (Hello TRX etc…) I almost forgot what a down day feels like. Been trying to prepare for this but man its tough but I believe in my positions and am holding everything bar my leverage right here.
DCL1 on metals imminent IMO.
Thanks again and good Trading all.
Luckly ( or not), im in transit to China right now so i will hopefully miss any carnage till Tuesday (fingers and toes crossed).
Thats a good summary of me : )
Been trading a lot, moving into low risk and riding some great gains. Adding to some on pull backs.
Also forgot what a good down day feels like, but today is a knock in the acct . I expect higher prices so I am hanging on to most, but I just sold GSS. Going to post details in a minute
Dumped. Boarding now. Just in time, thanks 🙂
MUX got rather ugly today. I dont see any news, but it had a fairly good looking sideways move a few days ago.
I JUST SOLD GSS, I JUST NOTICED THIS TOPPING CANDLE.
It is just a temporary top, this will be fine in the long run.
So GSS still looks great longer term, but it is showing me a short term sell. That is a top
,
refresh
TGD looks similar – do you have any worries with it?
No, it’s not the same. That GSS candle is a gap open to the top, and then a gap down m abandoning the candle floating by itself. THAT is the sell signal.
I think TGD looks good, back testing the break out, but it’s not a big drop to do that.
Alex, If such a pattern occurred at the bottom of a large drop, would it be a screaming buy signal?
Yes, That is called an abandoned baby, and I ALWAYS BUY THAT, no questions asked. If it happens at the bottom of a steep sell off, even better, it is an exhaustion of sellers, a capitulation.
LOOK AT GOOG 3 weeks ago. I saw it too late, or I would have jumped on that low 🙂
I liked the pattern in TGD, added there, didn’t see the sell in GSS in time. I’m near breakeven so may still have time to abandon tomorrow.
Thanks for the warning…glad I got back from lunch…I dumped. Took nice profit. Maybe I will pick it up if it drops to .80 again. This helps offset it in my other account which never got out of the red for years! It made a very slight dent in the losses there.
Thats what I am thinking, it still looks good, so maybe look at it when it gets to 80 cents and see if it still looks healthy 🙂 If not, we locked in gains.
I wanted to pick up some GSS but didnt want to get in the way when it was screaming higher. Thanks for the heads-up, Alex.
Looking at AG, CDE, EXK, PAAS, SSRI, etc –
Looks like all of the screaming higher Silver stocks are gapped down and we could be dropping into a dcl .
This could provide a nice buying opportunity if so (NOT today, when the dust settles).
I just started looking at charts of those on my lists.
PZG did a nice move today. SA looks to be breaking down ( that was a promising cup or inverse H&S forming)
Can anyone here recommend a good trading spreadsheet that I can purchase or find online? Preferably one that is tied into a financial service (i.e. google docs). Thanks!!
Some brokerages will track your positions and you can view them on a spread sheet , see gains / losses over a time frame of your choice,
Anyone else?
Interesting that we are getting this big distribution so close to the last base. I don’t know anything about EW, but I can see the megaphone that GDXJ put in between $31 and $41, and now a very short time and distance later we are undergoing another major distribution. GDXJ had a big gap down today too. Could this be the start of the Stage 3 topping process that Weinstein describes?
No. Those are very large, long term cycles. I would think we are late in stage 1 actually. IF this is really a return to a cyclical bull inside a larger secular bull we have a lot of UP still left, would last years. EW-wise, end of major 3 in Primary 1 possible? Idk, I’d have to look at longer-term charts later.
Alex – Vale, CLF, CENX….all seem to be reversing their fall somewhat – do you think cycle wise it could be that an ICL is in (or nearly in) – both in oil and commodities – so now would be a good time to start dipping back into those? I’m not sure timing wise where we are on cycles…..I try to mark my calendar to keep up but for some reason can’t seem to find anything on oil…
doji shaping up for TGD
Could you please explain?
It’s the art of Japanese Candlestick charting that helps put meaning to some of these patterns. A doji is hard to describe without a picture, but you could google it to see. Here are a few quotes from my book on it by Nison.
“A doji represents indecision, uncertainty or vacillation between buyers and sellers.”
“with a doji during a price descent, the market may continue its fall. Because of this, doji need more confirmation to signal a bottom than they do a top.”
This is a fascinating study that I have only scratched the surface on. But if you are interested in a little voodoo and have the time it is definitely interesting!!
Thanks…I forgot what they looked like but remembered the name. Saw a pic. Read what you wrote earlier about EXK and how price could be under pressure because of the financing issues and also looked at Alex’s comment on not liking the big volume down this morning and I dumped with some profit. Now I will have some $ to pick something I might like better. Thanks.
Uh-oh, I added! Let’s go 2nd daily cycle, whoo!!
Hope it does ok for you!
I use candle stick patterns and I have found in my experience that even though a Doji can be a bottom ( Buyers and sellers equalizing , causing an indecision of the selling, and buyers can step in and overwhelm sellers)
DOJI is often a 1/2 way move on a move down if the move just started and there is no support in that area.
I should add to this that I also often see a bounce from the doji the next day, and THEN it drops further if Buyers do not follow through. This leads to a mini a-b-c down.
not funny….
hhahhahaha
oops .. lol .. that was for chartfreak.. sorry? giggle
Watching the VIX……when it gets a daily swing buy signal I will be in via Calls.
I was watching the vix to , if UVXY know what I mean : )
I’m thinking 1/2 cycle low in markets is possible.
Ja Mon……I do. 🙂
… just thought I’d play too..
*All that kissyfacin’s makn me gag
Ut Oh…I think Tonto is jealous Alex. 😉
……………………….
so much I want to say : )
#Talk2TheHand
Yeah.. I’m jelly every single day I can’t play….;-)
..in due time… I know…
Man, you are really going all out on the Maria .gifs I gotta get me one now, too!
Wow, look at the recovery in OAS and ECA today…..I was wanting to buy more of each to do some dollar cost averaging…..and it got away from me – I wonder if it’s a recovery that is going to stick?
…. Whew..
No S, right? Probably haven’t gotten beaten up like this in 1 day since CLF shat itself back in APR.
It’s just burns my butt to see those hard earned profits shrink …. But, sooner than later they will expand again exponentially 😉
Todays drop looks like more than the 1/2 cycle low type dip, and isnt likely to be a drop to the DCL from a 2nd daily cycle.
So the Good news is that if that means this was all one long stretched out first daily cycle from Mays ICL to peak , then this is the dip into a DCL, and the 2nd daily cycle is ahead of us. That is actually GREAT news when you remember that the 2nd daily cycle usually is better than the first
That discussion will be in the report that I write tonight.
do not forget great earnings report from NEM, after hours up 1 dollar
I didn’t see that, thanks Marinho … (insert thumbs up)
Yeah, GDX volume nearly double of avg over last 10 days, it just felt ‘wrong’ all day to me for 1/2 cycle, but I have my long bull glasses on so I’m chillin’ waiting to buy me some more!
Lots of really good discussion today as Alex said. I felt gold was heavy a few days ago as well but I didn’t sell. Why not? I was late on the ICL. I didn’t want to get ahead and jobs and BREXIT. I know the evidence was in the chart but anyone says that you can predict the US jobs numbers just isn’t tell the truth. BUT, Alex found so many great set-up that I had to have at least some skin in the game.
So, I bought 1/2 positions across the board knowing that I could add on dips. Then I reserved about 35-40% cash for DCL to go in heavy. Of course that is predicated on getting one AND correctly identifying it!!! So, yeah, I was really starting to string together some good gains and they got CHOPPED UP today, BUT if I get another chance to add lower and this BULL keep bucking, overall I’ll end up with more gains that I would have IF we kept shooting straight up.
Top of 2nd or 3rd ICL, I’ll sell half of those going into core and try (and probably not succeed) in being patient again!
Absolutely Cason !!! I’m with ya………
Thanks, Ken. I was following you guys in chat today!
Kennnnny.. do have an updated Gold chart I could see pretty please?
Or OIL – Because if OIL drops below $42.50 ish, that ends the count ,right? It would be a dip below ‘1’ by ‘4’.
Then what happens?
Right..that means..back to the drawing board.. count wrong. I wanted to ask for both.. but.. I thought that might be too much.
*I’m shy.. 😉 lol
Oh. Ps. It was nice running into u 2nite.. I snapped a pic fyi..,
Oh my goodness, it’s my brother!!
Thats a tad eeerie 🙂
Giggle..well.. all I had to go on was that inch square white shirt from Stocktwits.
*Sorry I couldn’t add that earring in your left ear
Hmmm, I can see where this is going and I dont think I’m liking it .
There is a picture on this website too ya know
BY -THE-WAY – That is a flash from the flash, I never had an ear ring in my left ear ( Not that there’s anything wrong with that).
Totally thought that was an earring as well…
As I look at this a bit longer, the only thing noticeably off is the nose. My nose is more of a north American Indian nose, with a small bump in the middle.
Lol.. well different angles look different…
*U getting ur pout on cuz I wouldn’t …. Awww, nevermind.
*bump as in broken nose from being clocked a time or two… ?
No, I have a bit of American Indian and Samoan/ Polynesian smart alec
Reports done!! Time to go to sleep and proof read it ‘fresh’ at 6 a.m.
Lol… Gnite
oh no…I have a salmon colored shirt with 3 buttons just like that.
Now I’m getting freaked out, how close do you live to me?
😉 I know things….
i was having some laffs dressing u tho…
HILARIOUS… actually
*im freakn out how much her *bod looks like mine too… lol
damn…
Ok, you know we have a new report, right? aw you lingering over here, thought maybe you didn’t get the email alert?
Maybe oil just goes sideways here for a bit
USO already did…….
June 9 high is top of wave 1, in a wave 2 correction now, most likely touching atleast the 50% fib……if not 62% – 78% from the Feb. low.
Feb. low should hold imo.
I didn’t even notice USO , but you’re right.
SO I watching a 1-2-3-4-5 count, but now that takes it away, right? where do you go from there?
This has happened to me before with Miners ( A dip too low erased my E.W. count ) and from there, I couldnt find a 1-2-3-4-5 wave move.
Actually I not comfortable with the count on Gold Tonto.
Relying more on Alex’s cycles, TA and Sentiment.
OK.. thanks… I was/ still thinking this is just 2 of 3….
With big 3 of 3 on deck….
Wouldn’t 3 (up) of 5 also have 5 sub-waves or is that not a rule and can have 3?
Funny, I’m not comfortable with the E.W. count either, but now I am not as comfortable with the Cycles count as I was before.
I AM CERTAIN that the ICL was late May, after that it gets a bit tricky, but remains bullish, so that is the main thing. .
It’s in the report that I am putting together now. I’ll try to explain it better there.
Counting on that ICL !!!!!!!!!
Me too – for the sake of TIME !!
LOL !!!!
I’m in bed on cell… I’ll try tomorrow …,;-)
Possible hint: currently in a minor wave 4 of 3.
On GDX…….Tonto.