
July 17 – Weekend Report
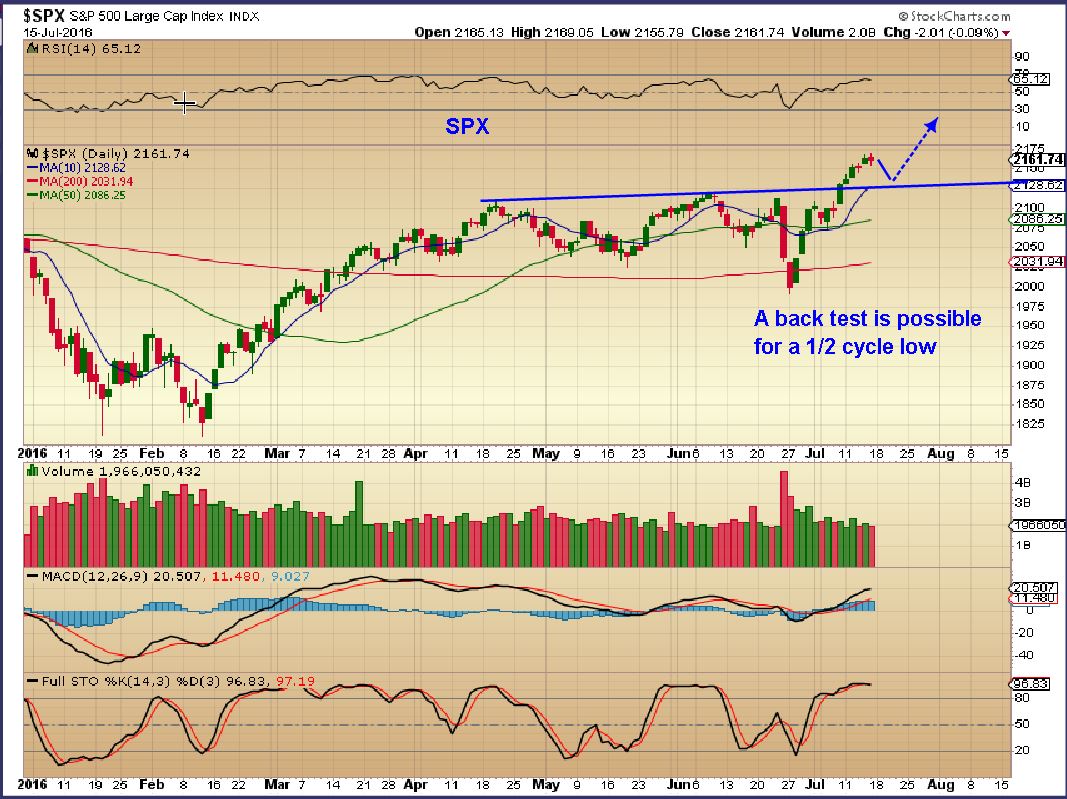
Last week the SPX broke to new all time highs.
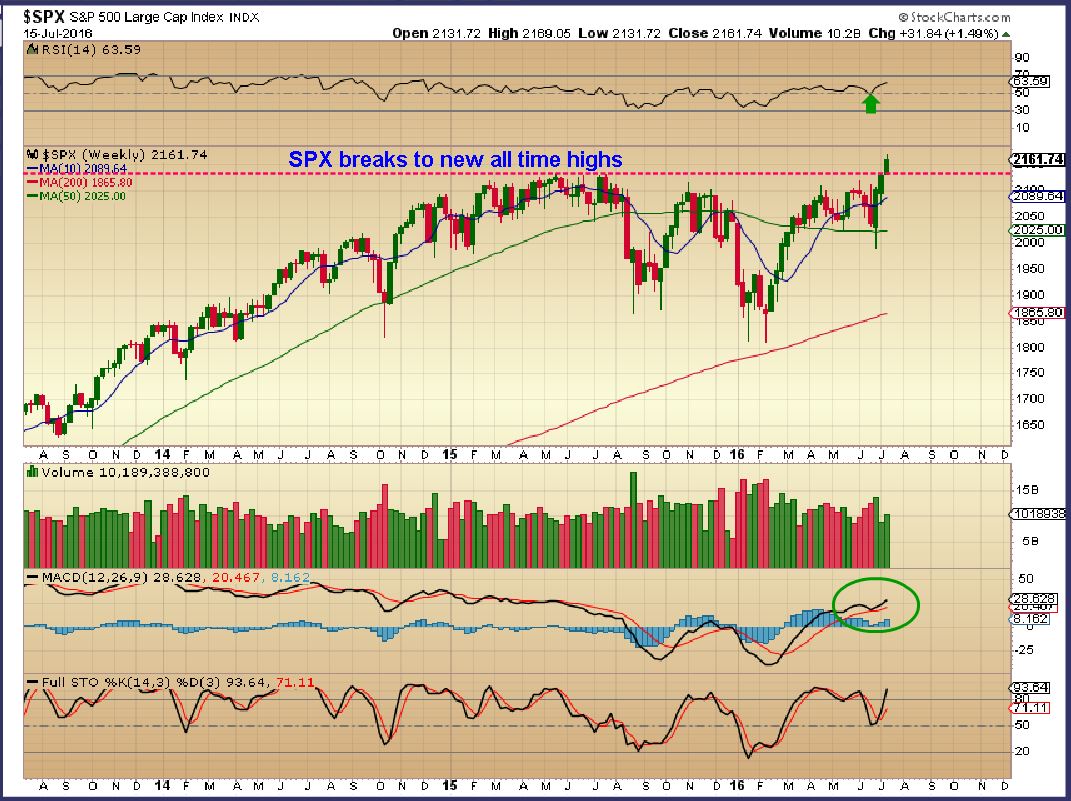
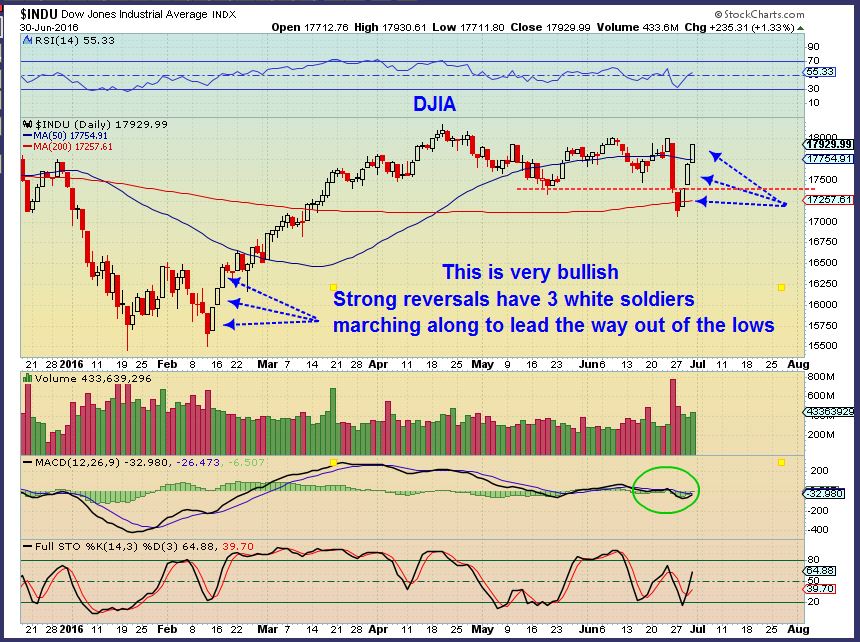
We expected that, since it was just coming out of a new ICL, and I pointed out on the DOW and SPX that we had a bullish 3 white soldiers pattern in play. This is a bullish reversal pattern after a sell off.
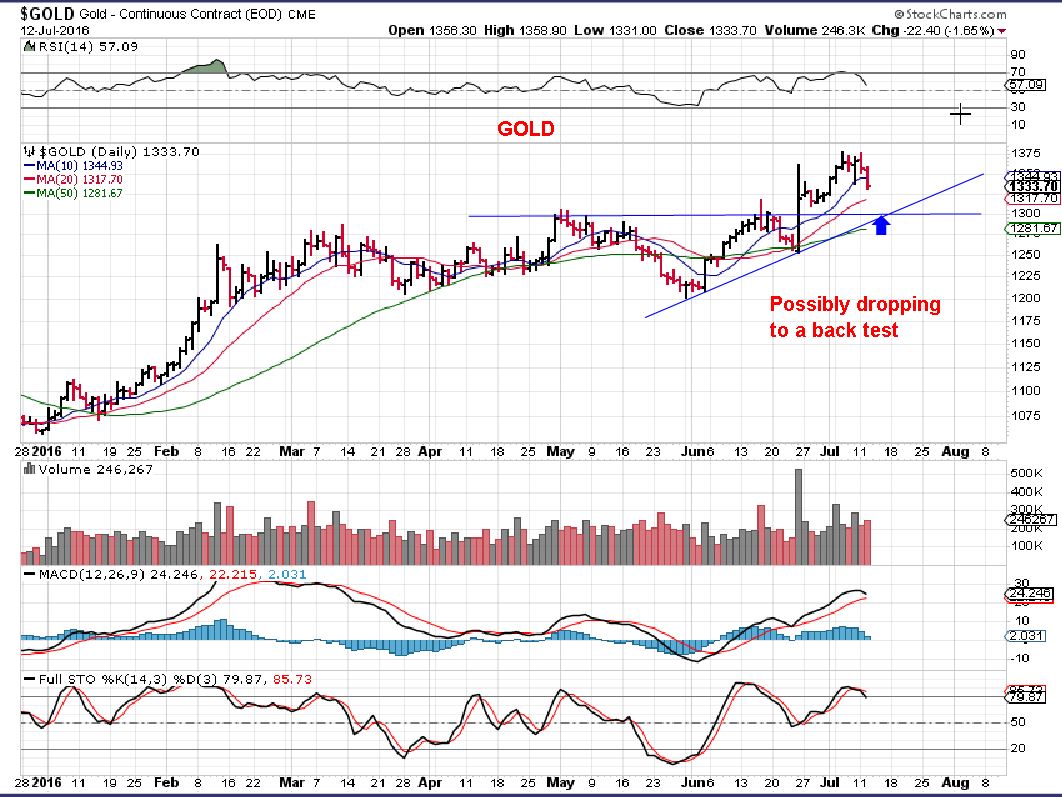
SPX DAILY – Since there is no overhead resistance, it can just continue higher, but a 1/2 cycle low would provide a back test.
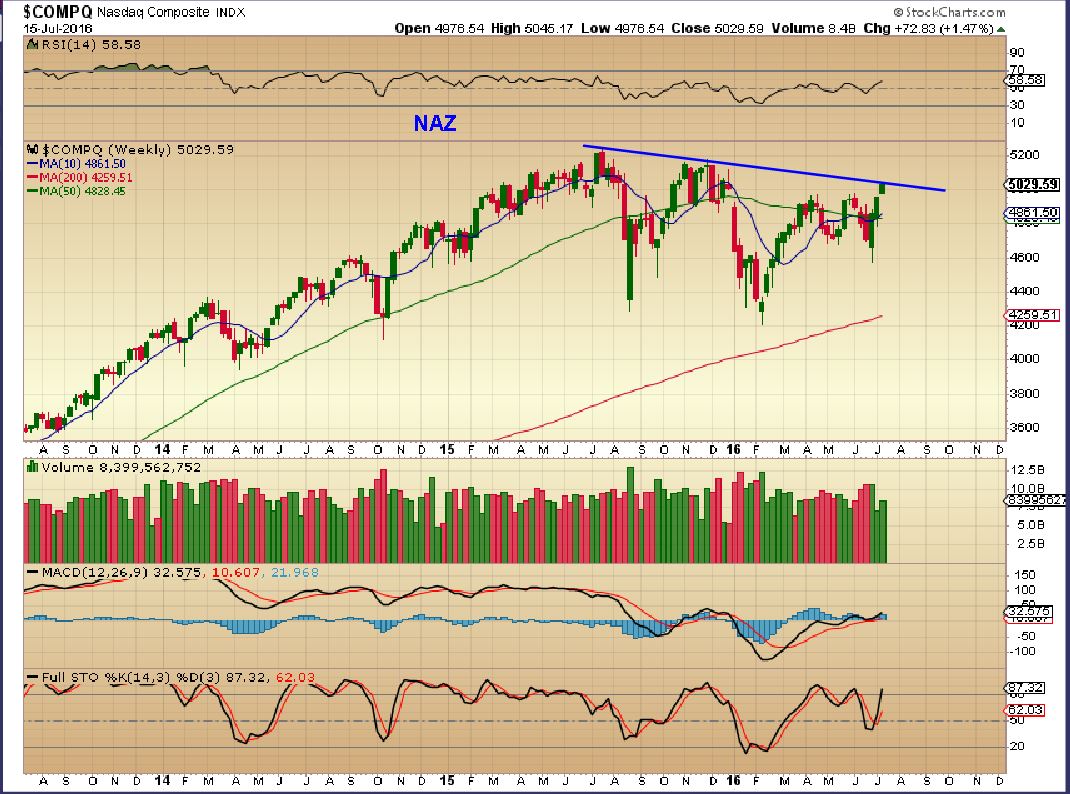
The NASDAQ is a little behind, but it may break out from this lower highs pattern this week.
BKS – They looked horrible. Still not overly bullish, but they are now improving too.
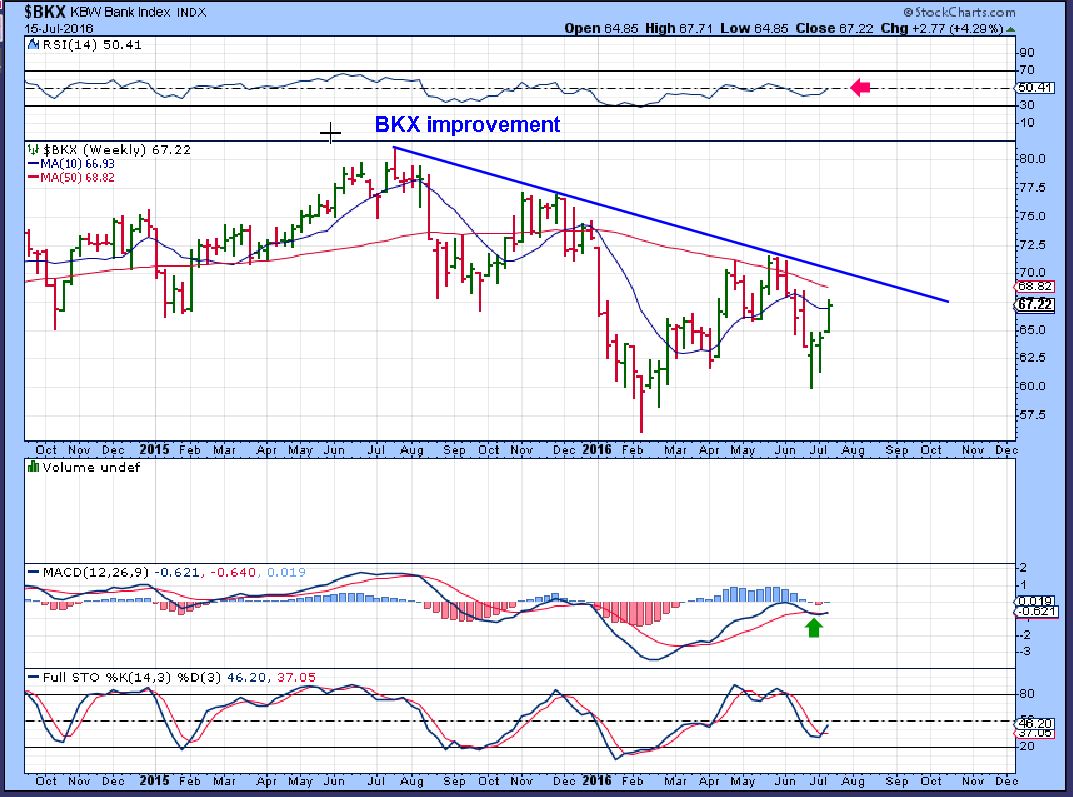
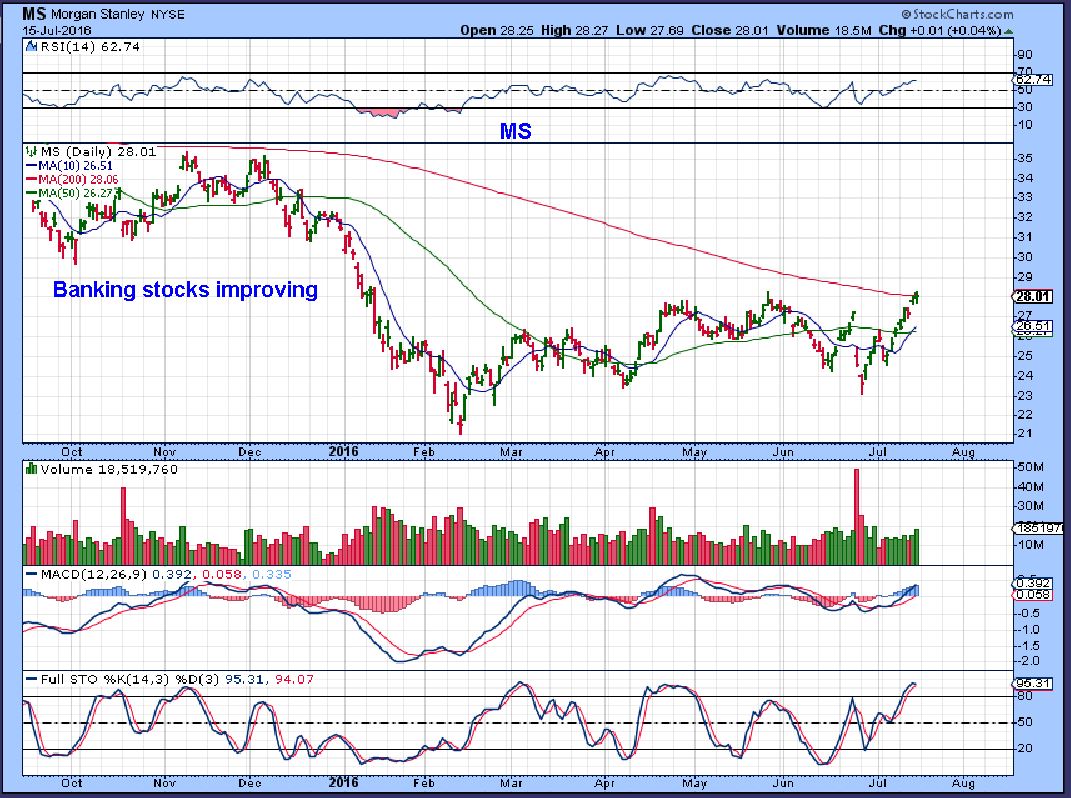
You can look up MS, JPM, BAC, and some of the other bank stocks and see them slowly improving. Morgan Stanley looks like it may have put in a base in 2016.
SO the general markets look good, but I looked at some of the stocks and I dont see tons of very bullish stocks at new highs with the markets at new highs. Former flyers like AAPL is still under $100. WMT and AMZN do look good, but it’s a mixed bag at this point. I’m scanning for leaders, but again, it’s a mixed bag. You can check out charts of WMT, AMZN, AAPL, KNDI, TASR, MU, CY, MOBI, DDD, for ideas.
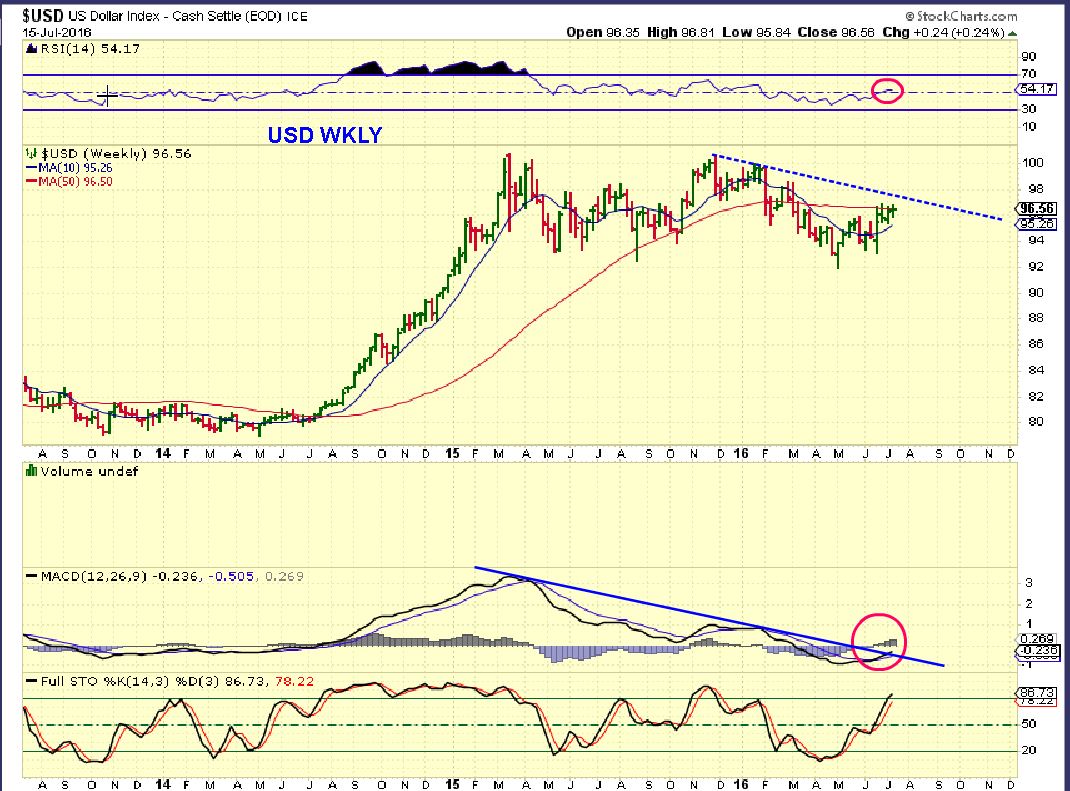
USD WKLY – Personally I think that this weekly chart is also improving ever since the Brexit vote tookplace. This was an ugly chart rolling over, but this kind of shows progress. Lets see the daily.
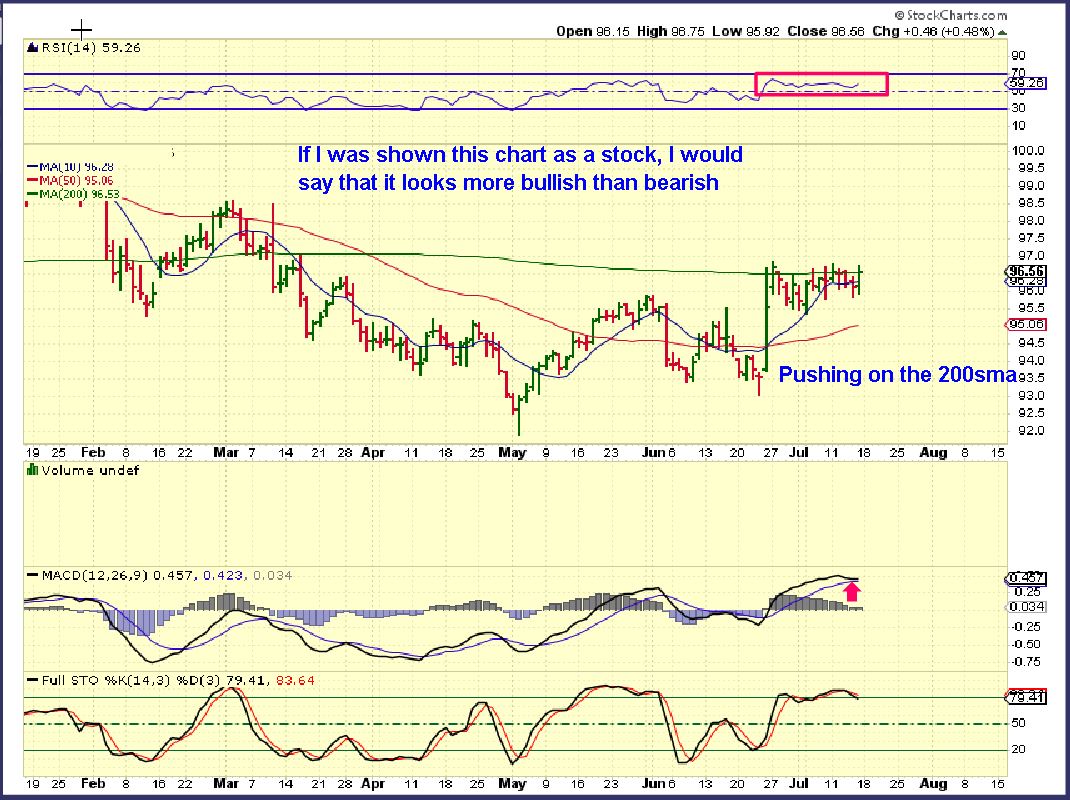
USD DAILY – I took away the name to look at this in an unbiased manner. If his was a mining company, I would say that it it looks like it wants to push above the 200sma. So the USD needs watching, but recently the USD goes up & Gold goes up. The USD drops and It is not affecting Gold as closely as it used to. For now, it will be watched.
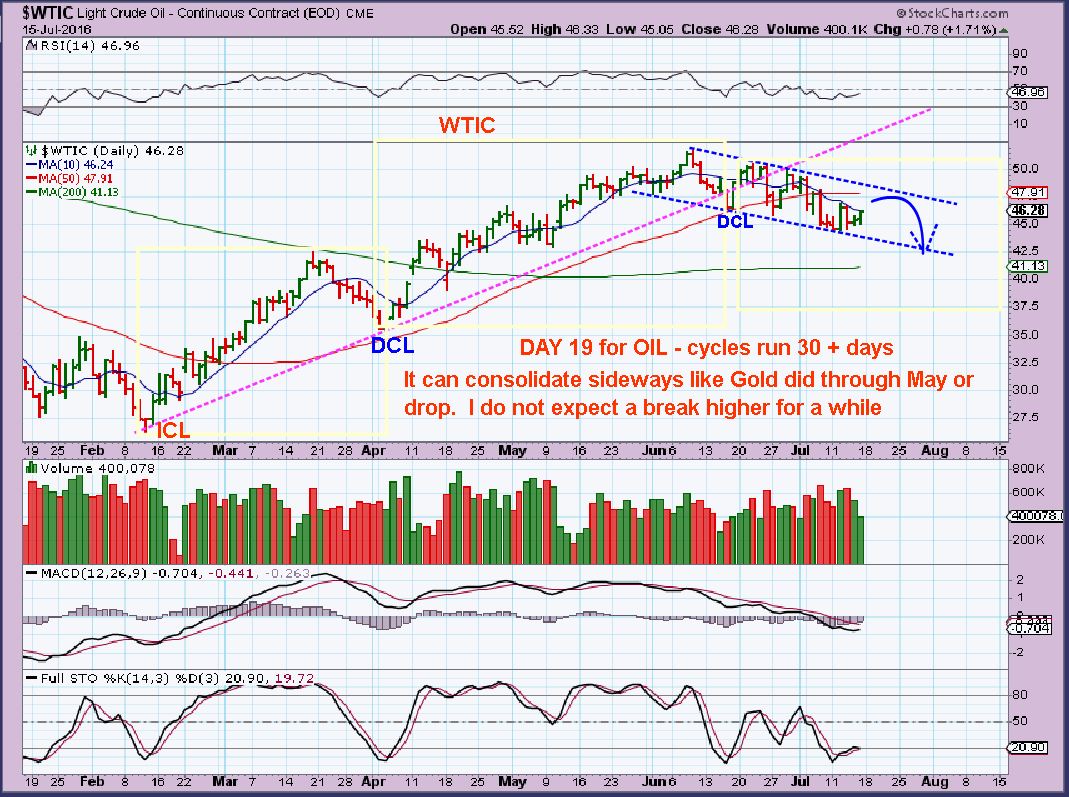
WTIC WKLY – This could be 1-2-3-4 of 5, but I will not recommend viewing oil that way.
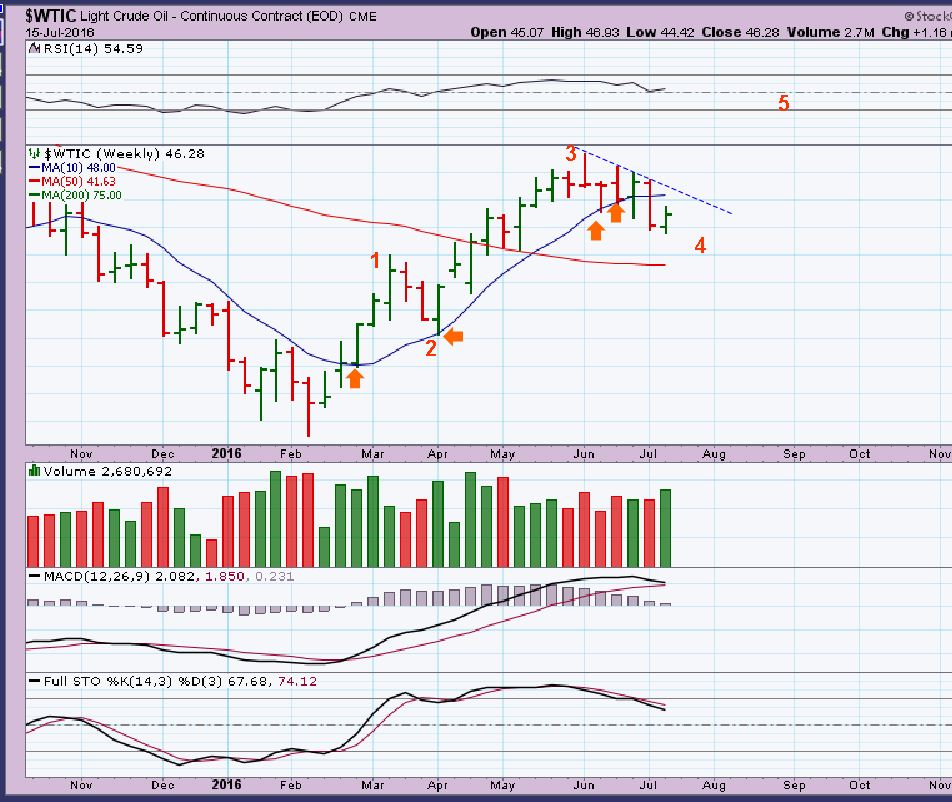
WTIC – Using cycles, Oil looks to be in a failed 3rd daily cycle, and it could go lower or sideways for weeks. Daily cycles can last 30+ days, and this is only day 19. The 50sma will likely hold oil down.
.
PRECIOUS METALS
.
GOLD – I am told that other cycle guys believe that Gold is in the first daily cycle and on day 32. That would be great, we’d be due for a DCL and then a 2nd daily cycle higher.
.
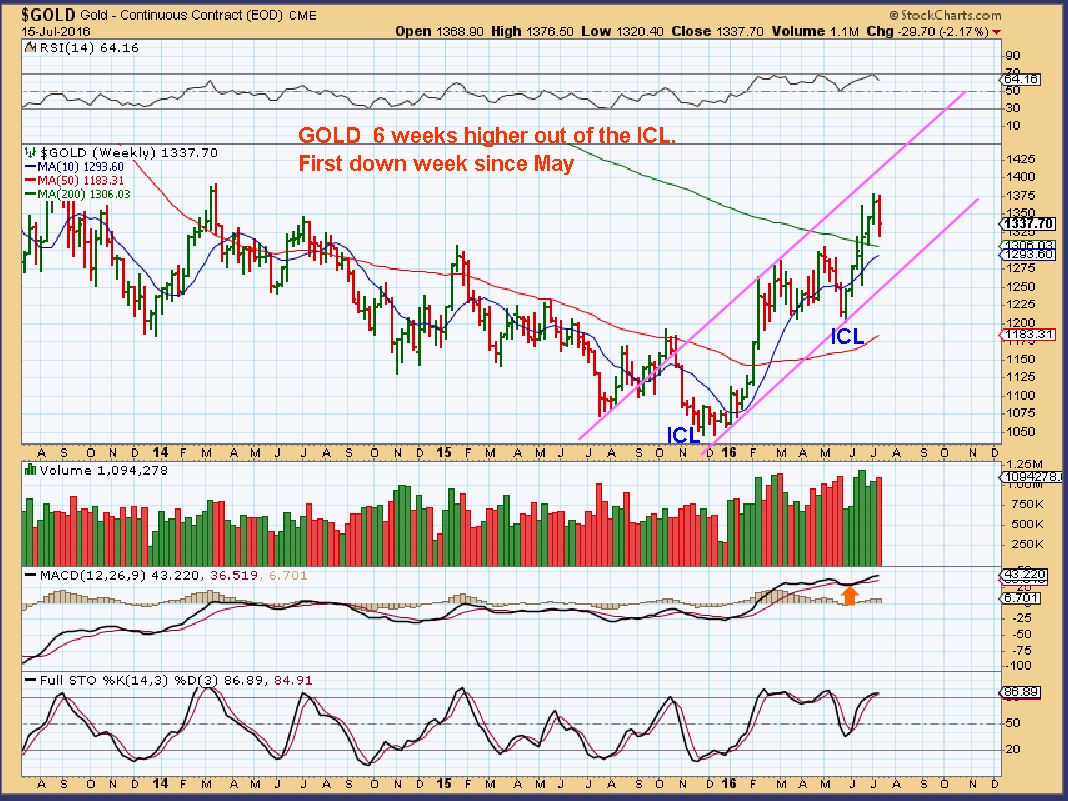
Below is my Gold chart from THURSDAY JULY 14, and I called a DCL on Brexit, because Miners definitely put one in there. Even with this count, it is bullish with a 1/2 cycle low and another move higher. SO Gold is still bullish to me, even with this dip now. This $1320 tag of the MA ‘MIGHT’ be all it dips.
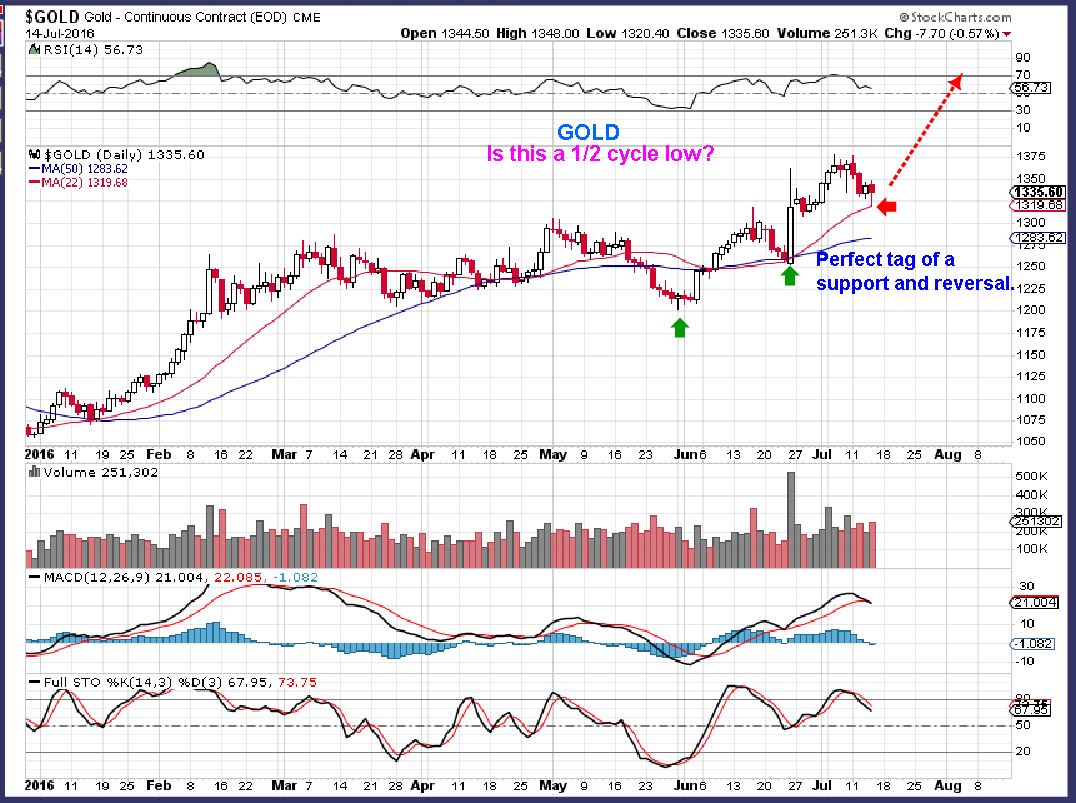
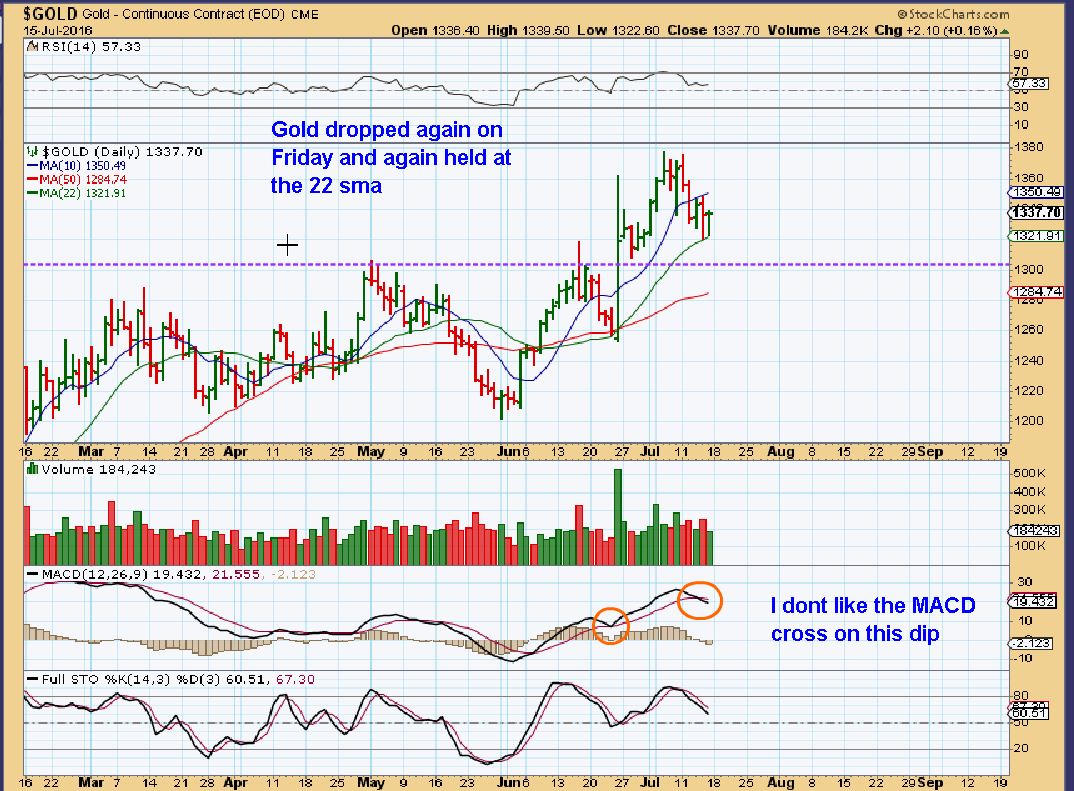
Friday JUNE 15 – Nothing changed. A drop to the purple line was mentioned as a possible back test. $1320 ‘MIGHT’ be all we get for a dip. I’ll watch that if Gold sells off Monday. It can go lower for a back test, but doesn’t have to.
GOLD WKLY – drop to 1300 still looks very normal with the 10 & the 200 ma converging there soon. I’ll watch that too.
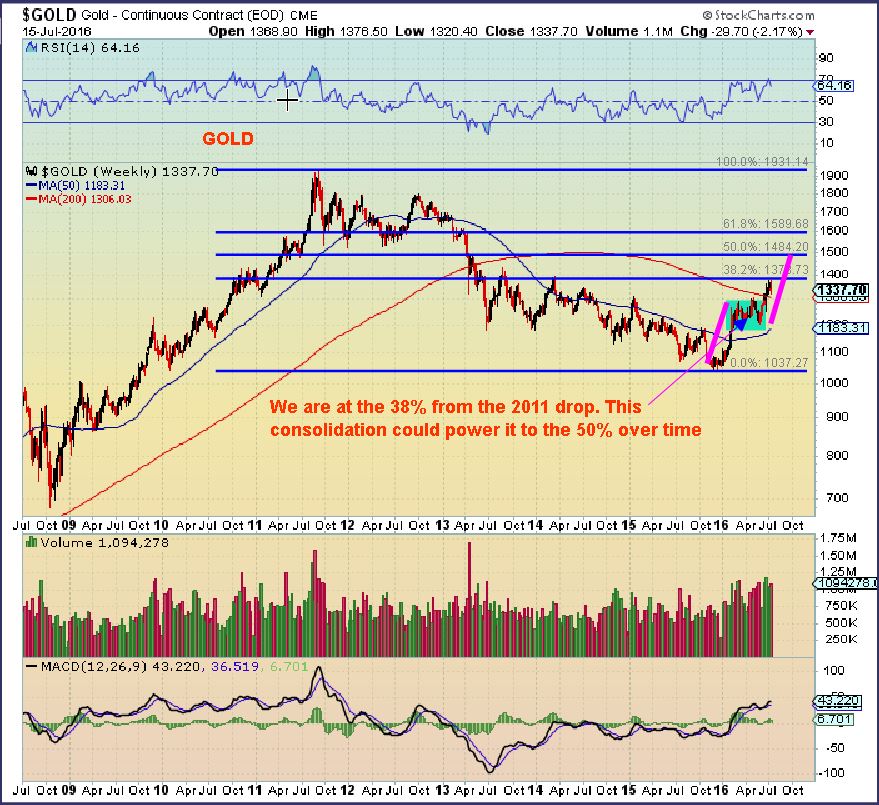
Golds Big Picture – Gold just tagged the 38.2% fib retrace and has stalled. If it breaks through and goes to the 50% Fib #, we’ll see GOLD $1480 ish. This looks very possible.
Once again – Just in case you see Gold dropping, a back test of the break out and rising trend line are easily seen as possible.
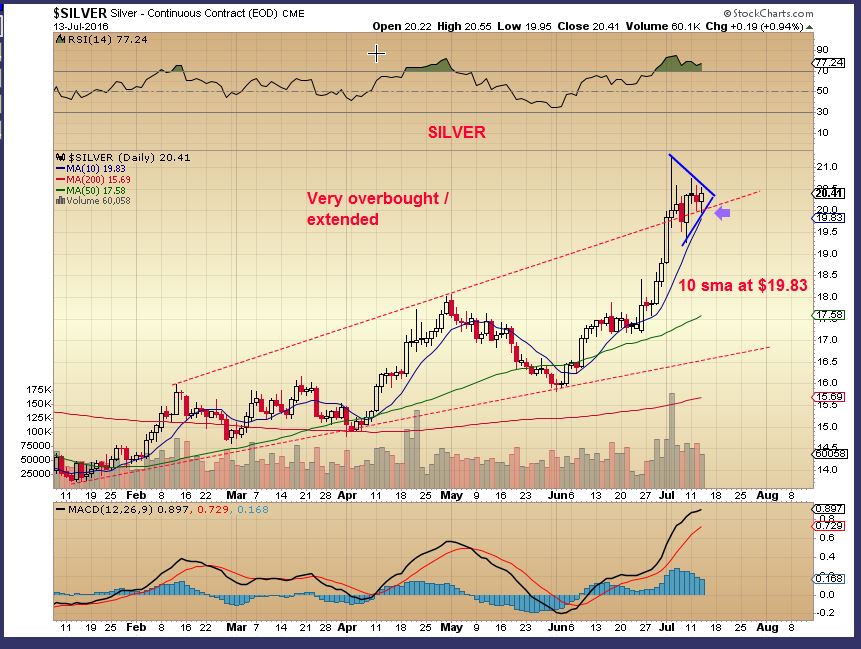
Silver closed the week at $20.30. This was Thursdays chart, but it hardly changed. Extended but in a Bull run, it can keep running under current conditions. For cautiousness sake – we want to realize that it is very extended, but coming out of that base these can just keep running.
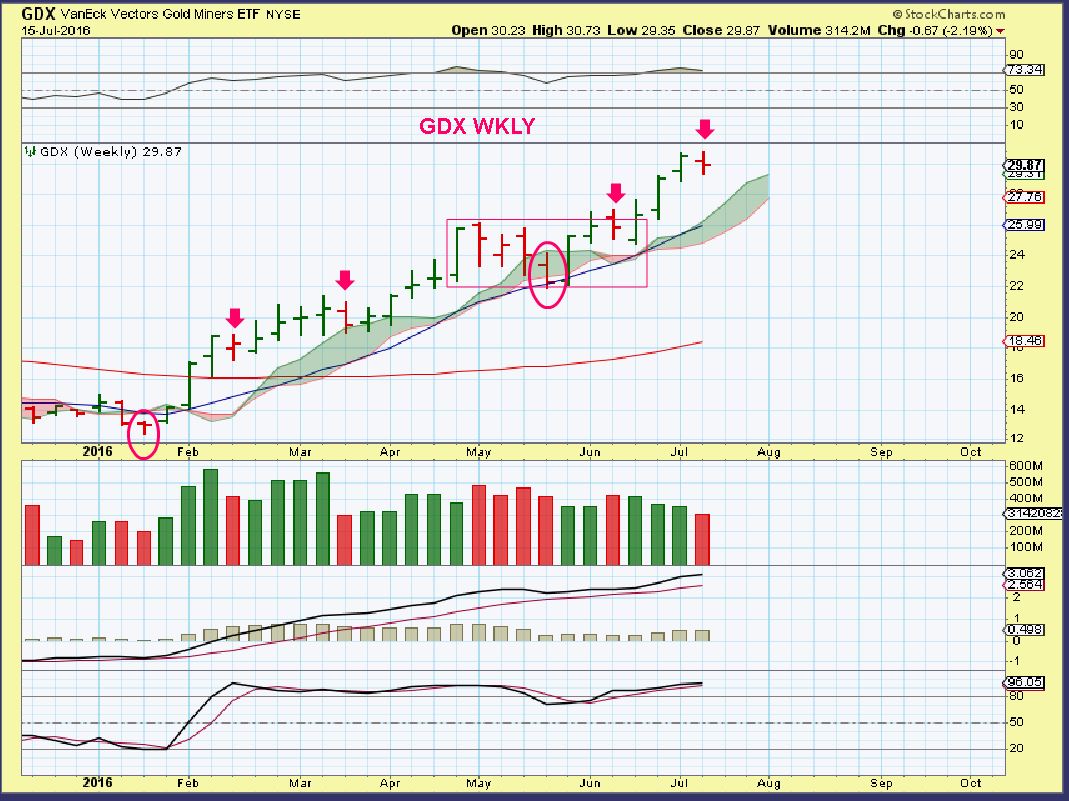
GDX WKLY – We see a doji candle, but on this run up, we have seen a few ‘1 week red candles’ and then a continuation higher. What a bull run this has been.
Note : That first run from the ICL ( circled in red) ran and didn’t peak until week 15. I dont expect that this time, but it is only week 7 right now.
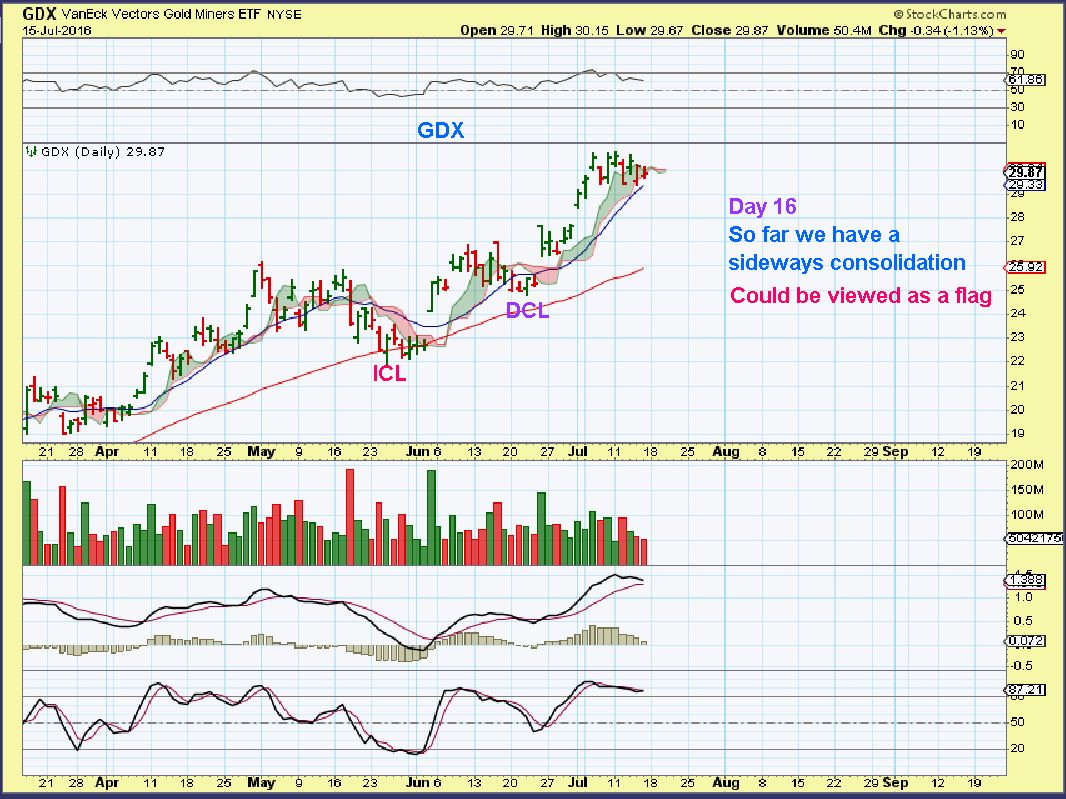
GDX DAILY – THAT is definitely a DCL in June. THAT is why I say GOLD also put one in on Brexit. We are on Day 16 of the second daily cycle. The 1st daily cycle was short, this one could be long to balance things off. It could peak in a week or even 2 weeks.
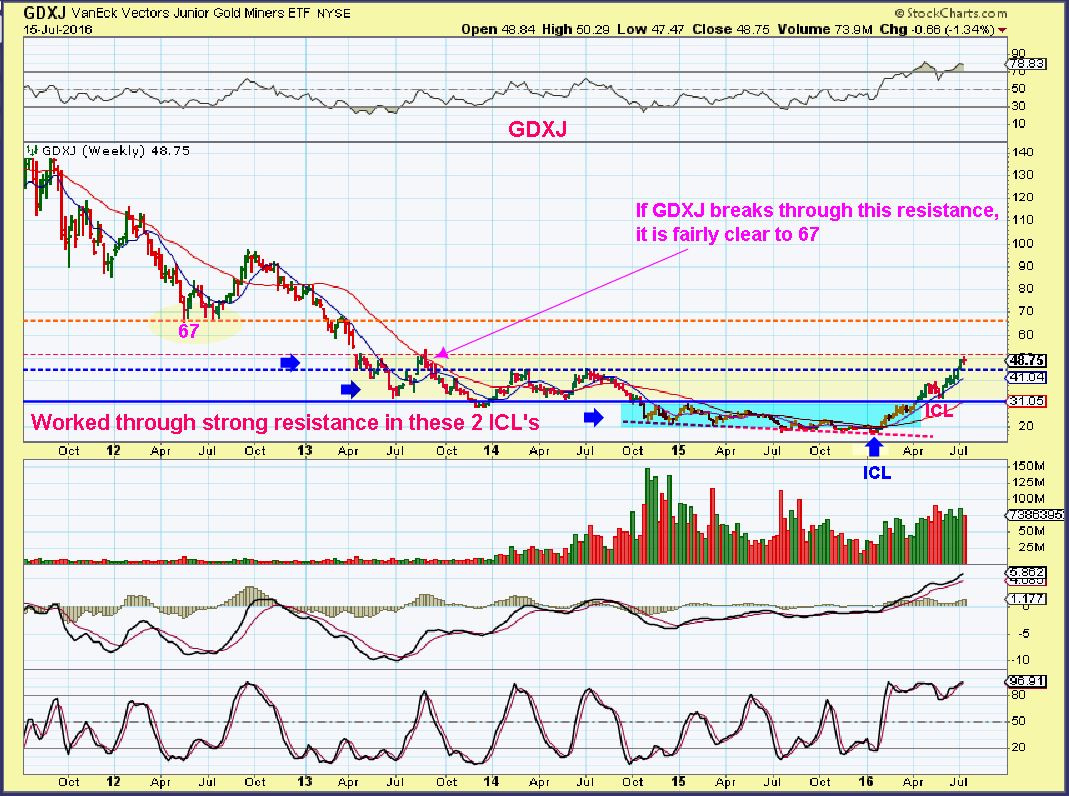
GDXJ WKLY– GDXJ has powered through resistance in 2016. read the chart.
SO I remain Bullish on Metals and Miners until I see a reason to back off. I dont want to sound reckless,and I know that Miners are basically pretty extended using certain indicators, but using cycles I still expect a run higher. They have also been popping and running higher even when Gold is down $20. Since the ICL at the end of May, %-Gains have been nothing short of excellent in many of them, so we have to make hay while the sun shines. Last week was a bright sun shiny week.
.
So lets just quickly review a few things, and you can always go back to last weeks reports and look up some of the Miners mentioned. Some are on the move, others are still set up nicely.
.
TGD – This was my pick for Thursday and Fridays trading. This chart shows a set up of sort of a cup & loose handle, but I liked the ‘gap fill and recovery’ all in 1 day. Nice buying came in
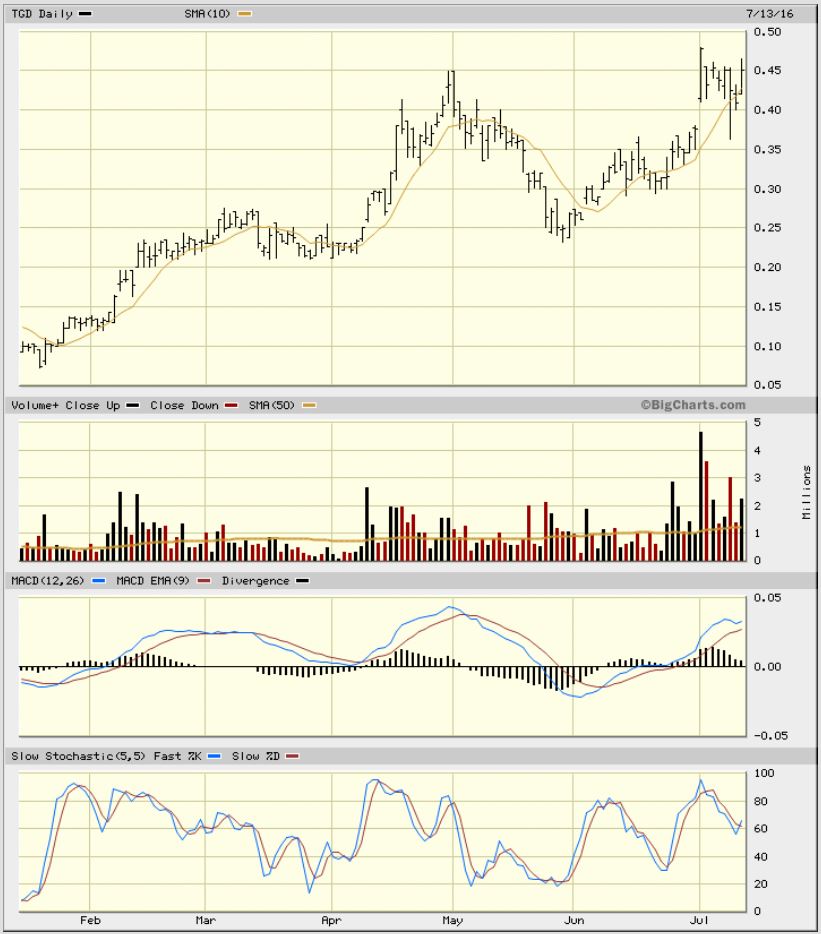
TGD DAILY – It did POP as expected. Congrats that bought it and got at least the 16% move Friday. Some wrote that they bought it when I recommended it weeks ago. I bought it as it bounced off of the 200sma and reported that here. Buying down there, you now have a 100% move. I think that you will see follow through , but…
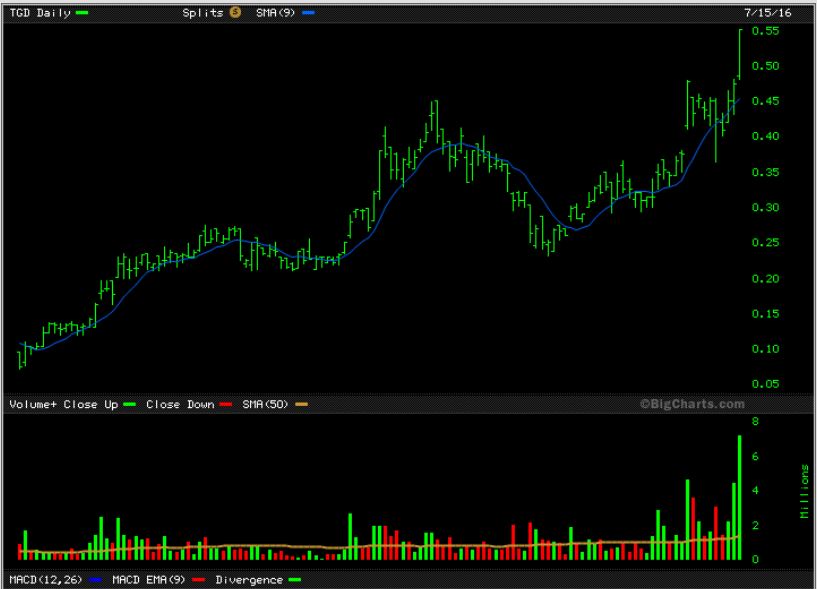
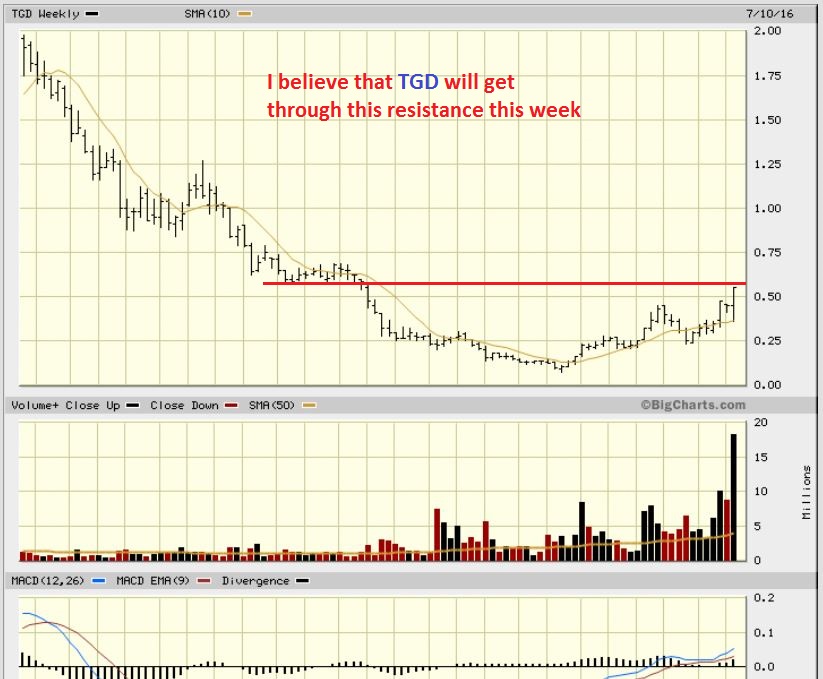
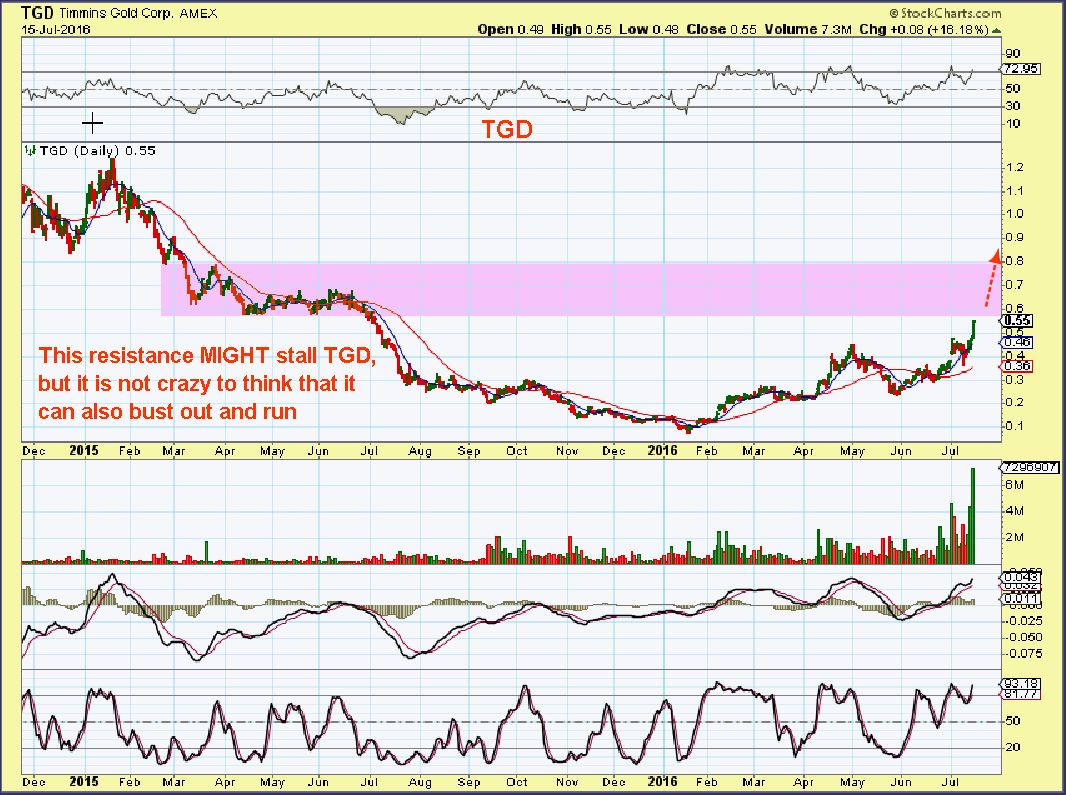
TGD WKLY – TGD is at resistance. THAT kind of volume can push this right through it. We’ll see what this week has to offer.
TGD DAILY- We’ve seen the real long giraffe necks, and this is a baby.
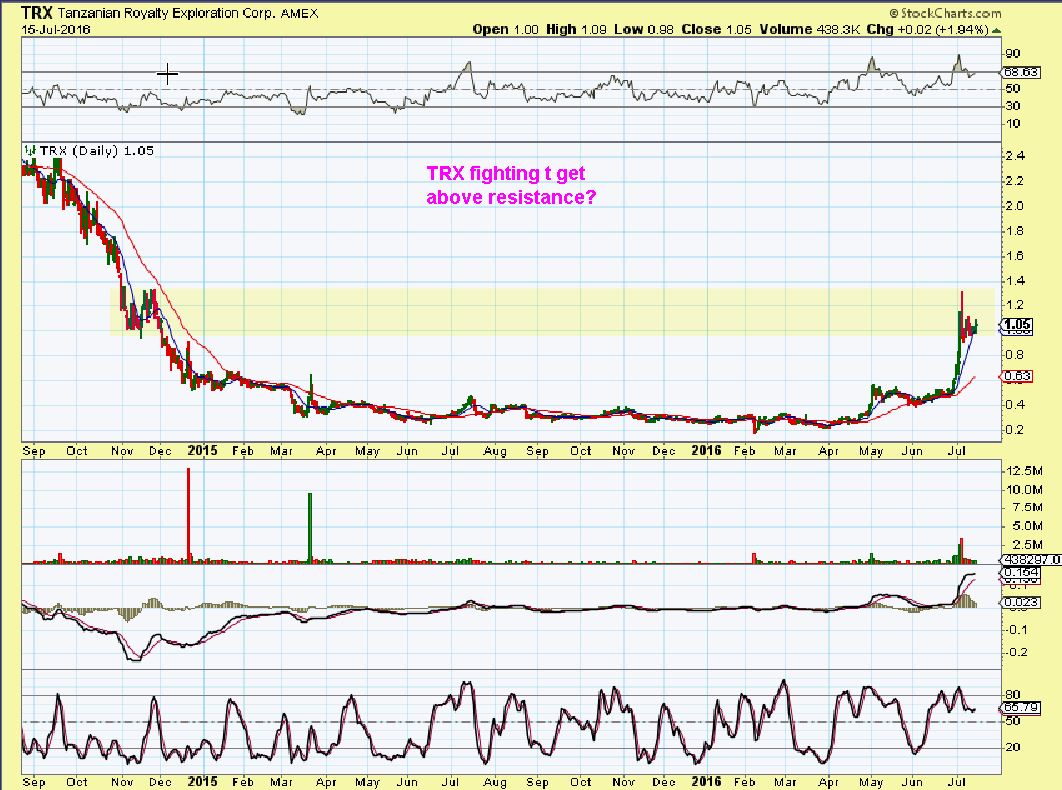
TRX – On July 12th I pointed out a possible bull flag. It could be bought with the idea that they usually break out higher, but knowing that it also may turn into a consolidation as shown.
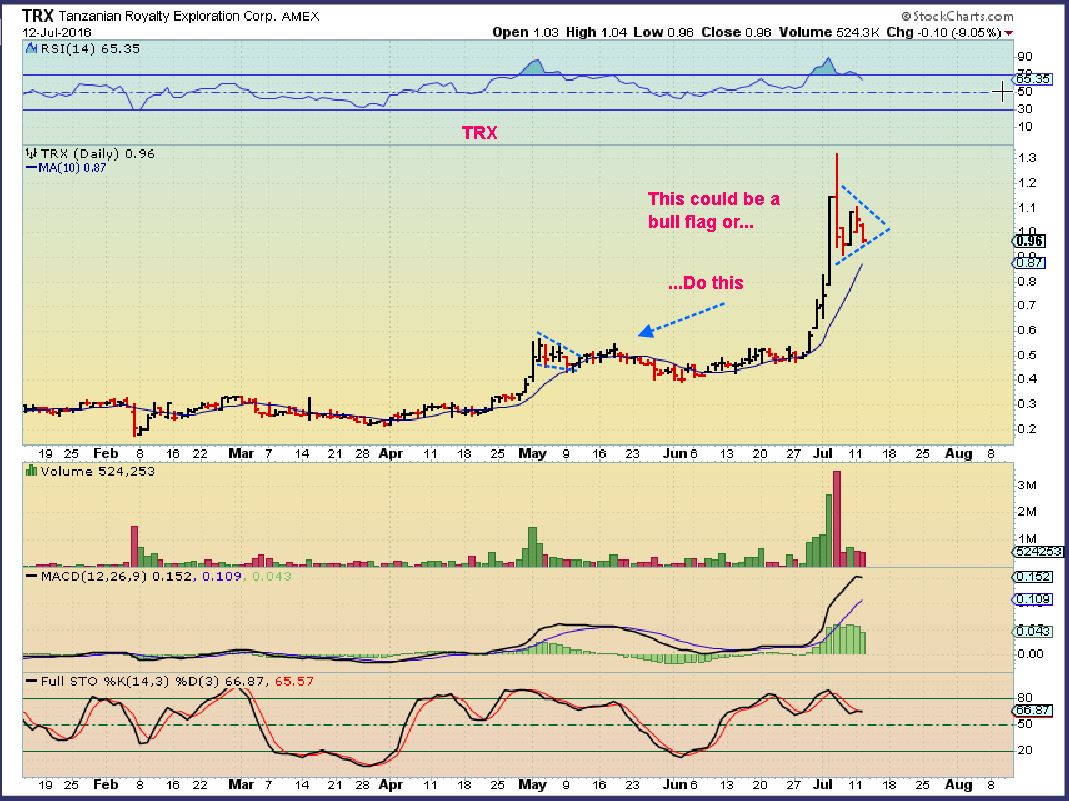
TRX July 16 – It is currently setting up like it wants to make a run higher. Read the charts foot note.
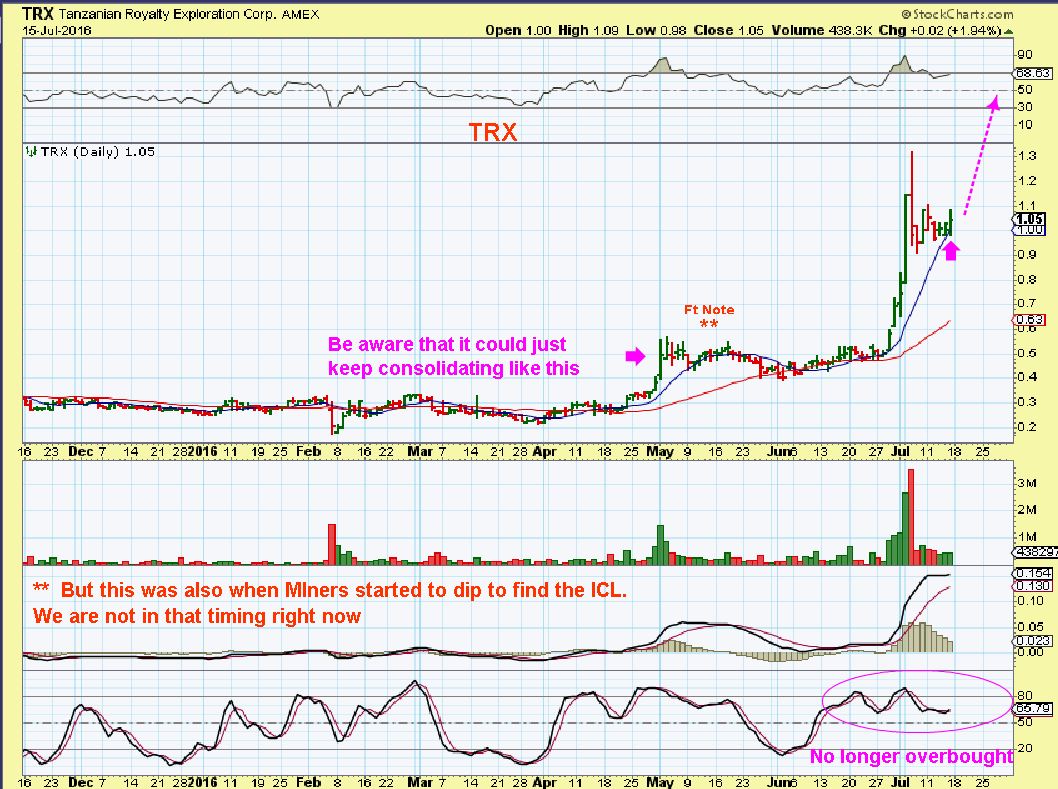
If this resistance breaks, TRX can fly again.
.
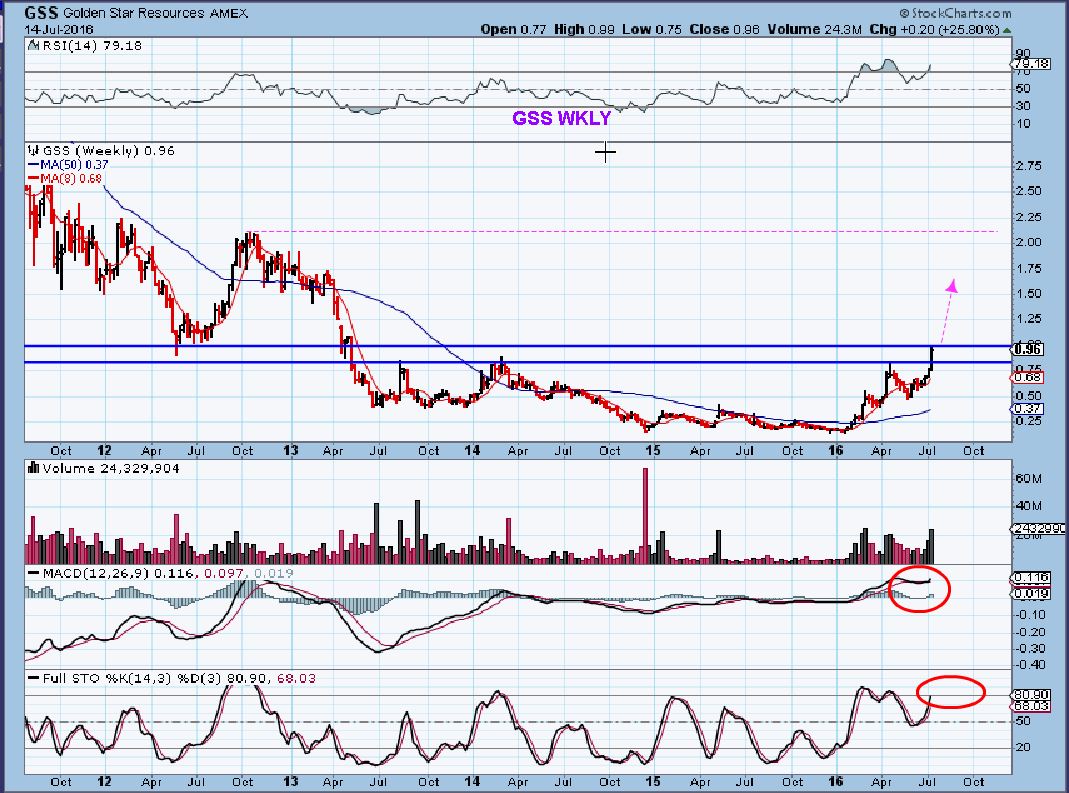
GSS – I also called for GSS to break out last week before it really took off. Friday I expected follow through, but it ran up & sold off. Is the move all done? I do not think so, but I could picture it putting in a handle.
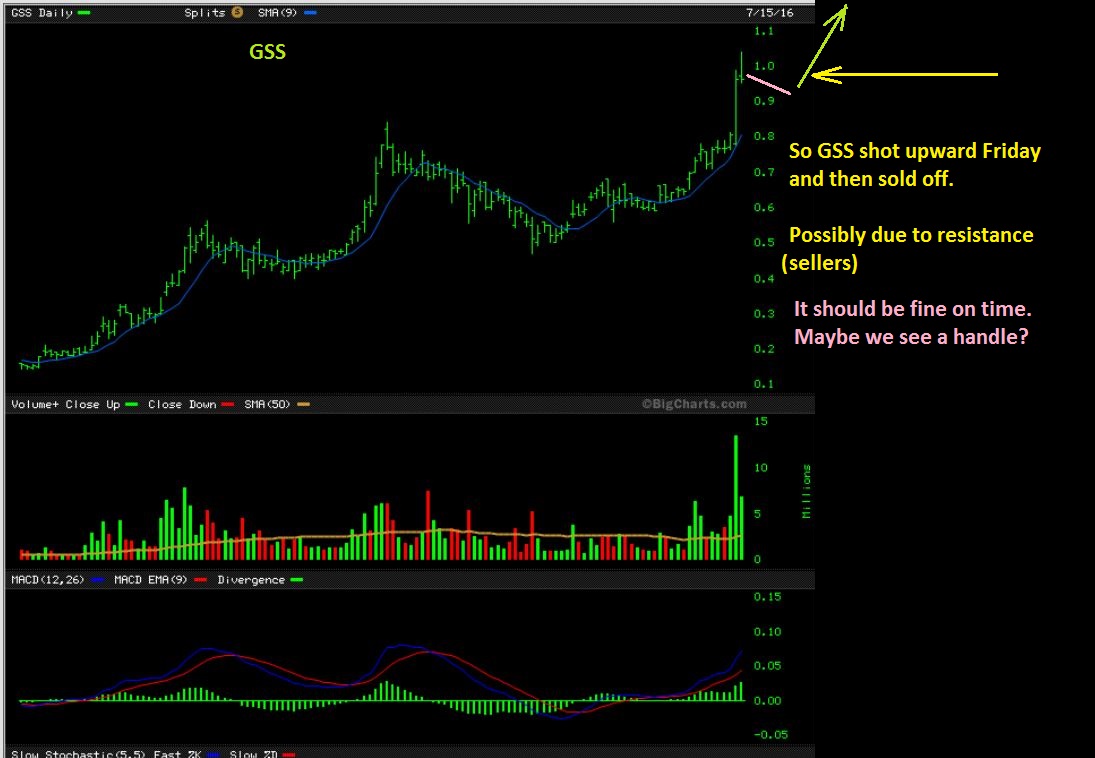
GSS WKLY – This is why GSS may be rising and selling off on Friday. IT has reached resistance. It might just bust right through next week, we can’t know for sure , but it remains a bullish set up.
I want to show how ( or why) resistance works. I will use AUMN. When AUMN got up to former highs, you can imagine that the ones that bought that consolidation in April are selling to get their money back. The selling started drying up as it dropped to the 10sma, so I pointed that out July 7th on this chart.
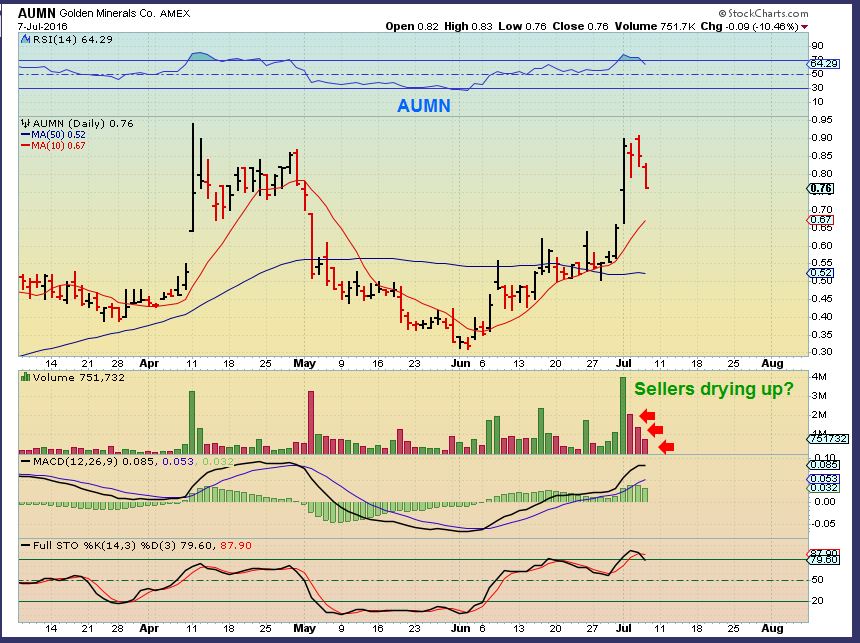
AUMN – Support at the 10 sma may mean that the sellers are gone. Look how light that volume is. This may be running out of sellers. This was Thursday, I recommended it at the end of Friday morning report.
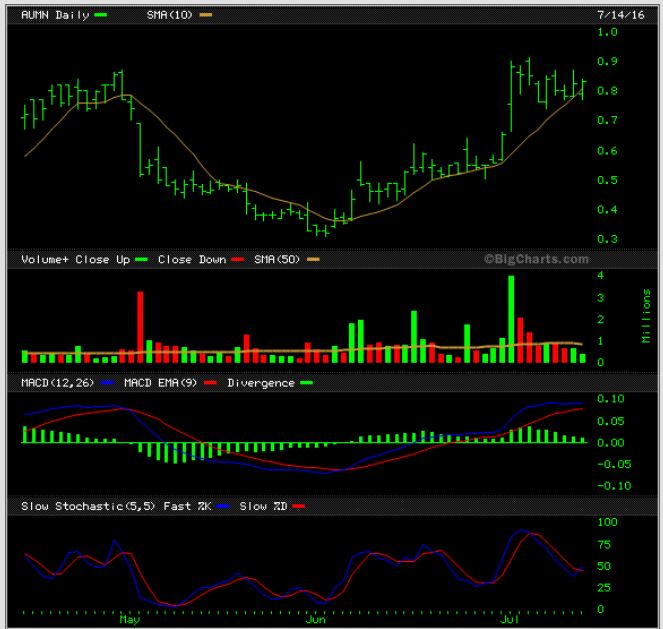
SO – Now we see AUMN trying to break out and Volume basically quadrupled . Could AUMN break out this week? Read this chart…
.
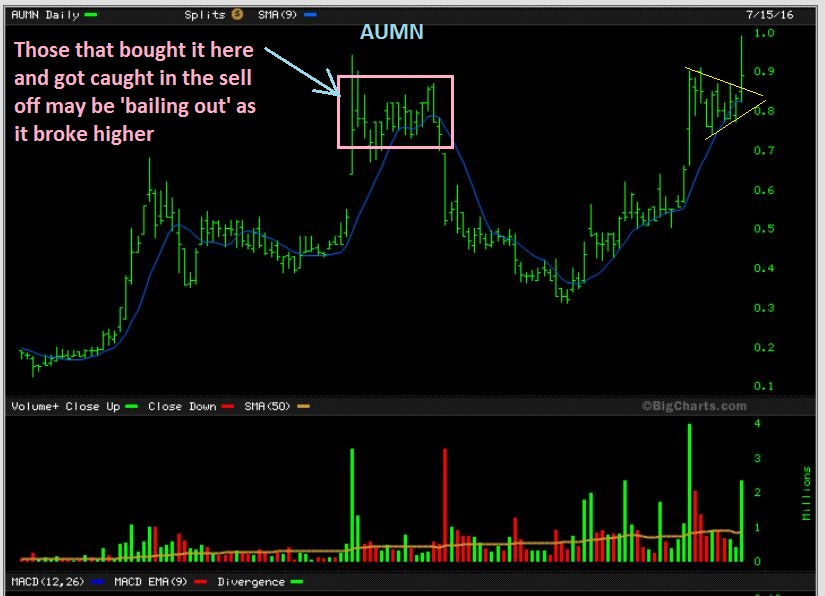
During the multi year bear market just experienced in Precious metals and miners, many bear market rallies get sold off again, and those that held on last year and did not honor stops get trapped with losses. Many dont want to sell with such big losses on the books, so they hang on and wait for price to come back to roughly where they bought it. When price returns to around their buying area, they then just want to bail out at small losses, break even, or even small gains. It is a relief for them just to get this out of their portfolio.
.
PLEASE READ THIS CHART
NOW READ THIS CHART – It is the same as AUMN above, but shows the period after sellers are gone and only buyers remain. 🙂
So barring any bad news, ugly earnings report with no future hopes, etc., many of these bases become spring boards for much higher prices when the Bull returns.Please do your own Due Diligence on these companies. Many are improving dramatically with GOLD & SILVER prices rising. Last January when I was recommending Miners, I heard many analysts saying that all these Juniors need to go bankrupt before the Bull rally could begin. We were called crazy for buying CDE or MUX. Now they are up 100’s of %. GOLD was selling at $1040 back then, but now that it is selling at $1340, and could go to $1440. I would expect earnings are going to improve greatly quarter over quarter when they are selling their gold for $300 -$400 /oz more.
.
That is your weekly wrap up. Though Gold could dip down further this week, I still see many set ups in Miners that look bullish, and I am holding my miners at this point. Lets see what Monday throws our way, have a great week and thanks for being a chartfreak!
.


First! 🙂 Thanks for the report, Alex.
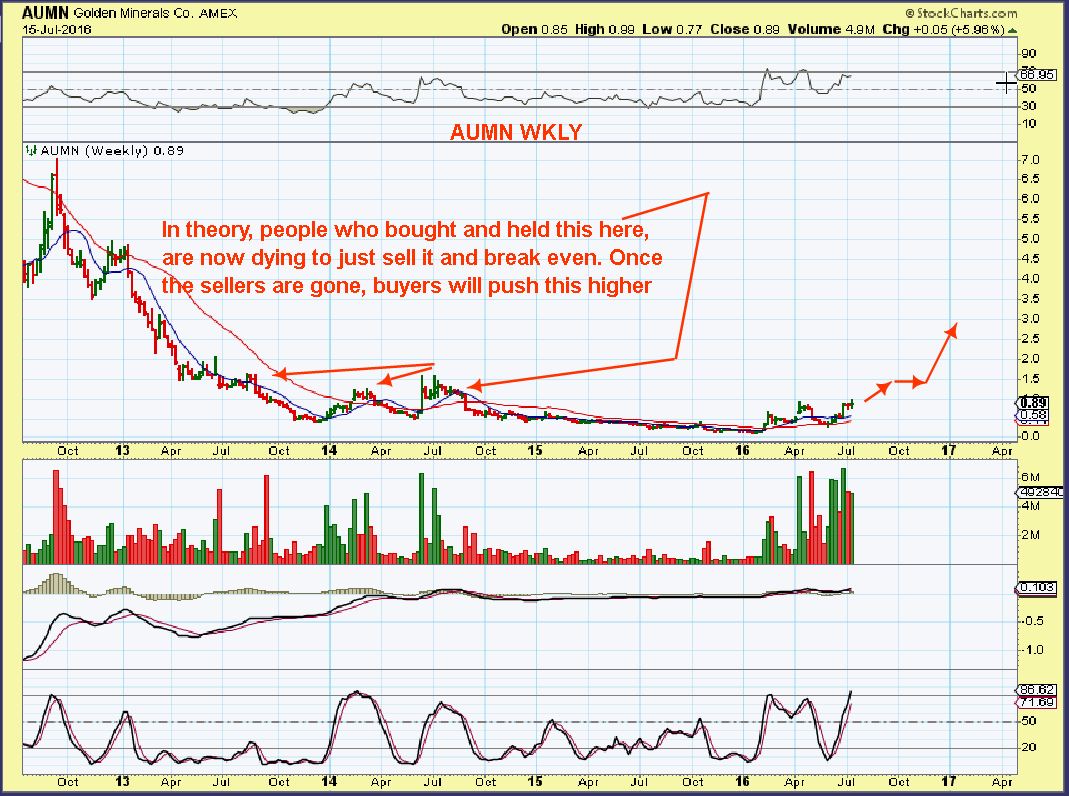
p.s. I do love that long-term chart of AUMN. Let’s hope that not many obstacles get in the way.
SECOND!! Ur welcome : )
Great report Alex. My hands are full watching 5 miners. I am out of energy for a while. Happy trading everyone!
Silver tagging the 10 sma.
Hi Sameer,
I would love to see Silver do what is known as a running correction here. It’s a bit of a sideways higher move for few days when something is overbought, and then it just breaks higher a little more.
So far, Silver is tagging the 10 area as you mentioned and moving higher. Thats a beautiful thing : )
Alex, last week you were high on KGC, hasn’t done much in the right direction. The chart doesn’t look as good as some of the others MUX, EXK, XRA, AUMN etc. Do you still like the set up?
Yes,
I see a cup & handle
GPL and TGD both up about 3% in pre-market. I like mentioning their names in the same breath.
pattern in HBM is interesting. It put in a cup and handle, and is now going sideways. Maybe building energy for a move higher? Target of $7, if it plays out.
CLF is now on “the most shorted stocks list” at 42%. Wonder why?
idk, but ask BAS how being on there went for it. *GULP*
BAS? I take it that BAS didn’t go higher?
Hey Alex – what do you think of CENX chart today? Thanks!
What do you think of it , Tammy?
Well, I think it looks good even though it’s dropped today – I have some at a gain and don’t want to watch profit disappear…but…..I think it looks like it’s still within a basing area from about September til now and has potential to pop up to $10 and higher once aluminum prices continue on their upward trend – so….it’s probably really a long term keeper…..and it’s still above 50 and 200 day averages….how’d I do? Always hard trying to decide if should take profit and run or let it be a core holding that I just let ride…
You did excellent 🙂
When I look at it , I would say that it roughly just ran from $5.50 to $8.50, so that was a rather large run ( 55%). Sometimes when a run finishes, it can pull back 50% of those gains, so you would say that MAYBE, it MIGHT drop $1.50 ( That was a $3 move low to high).
The 10sma is at $7.50, so it might dip down to $7.50. It also looks strong and may just bull flag or go sideways like many of them have, down 1 day, up the next, down 1 day, up the next. so there are many things that can happen, and it remains bullish looking.
ALSO – Who says that the run finished, this may be a 1 or 2 day pause, and the run may be $5.50 to $10 by the time it is finished. IF we look at the last month from $5.50 to $8.50…it looks like 1-2-3-4 and still could go to 5 ( if that makes sense)
REFRESH TAMMY – This is just 1 of several guesses : )
click to enlarge https://uploads.disquscdn.com/images/b6db4c21c6c096094e0532e12a3e1a402a90dec0f2d6c15327a80e9d3f9ae9ba.jpg
strange lately.. since last week when your charts weren’t appearing at all..
now i don’t even have to refresh…. they’re showing straight away
Really, Maybe Disqus did some home improvement
hope so.
much as i like typing F5, and debating Cason about its more efficient qualities, it would be totally better to see charts immediately … and also.. not have to wonder what Maria’s threads are going on about, when you hadnt realised she’d posted a another frikken gif 🙂
I can hear u….
well now i (seemingly) wont miss a single one of your gifs,…. so knock yourself out :b
Right? When you refresh constantly to see Maria’s new chart that you know has the best trade on it and then all you get is …
Great, thanks for the analysis and chart below! I love that you actually teach us things and what to look for – have learned from you and still much more to learn! 🙂 🙂 I’ll be holding my CENX for a bit….:)
go professor …. 😉
Thx Gilligan : )
I sold X and CLF and really, really regret it (although both were winners) so… if you can be patient and hold at least part longer, it will likely be rewarding!
Looking at LABU. I see a LABU coming out of a 1/2 cycle low here. Pushing higher with the stock market to $42. A possible AB=CD target of $45. I am looking at a 2 hour chart. (refresh). Stochastics turning up, giving me a buy signal as well.
Alex, any thoughts?
https://uploads.disquscdn.com/images/ea1aa6f681406b56ff0eda78a1b753bb2d847bb505d8f7ca7992d27082a64fe4.jpg
Labu and XBI haven’t been on my radar for a while.
They look locked in a trading range, and it is big enough to make some good LABU trades, but it doesn’t look ready to break out to me ( YET, so far).
We’ll see in time if it can, maybe it will gain some strength.
Did you grab it, Bill? I sold Friday – not b/c chart looked bad but just to lock in before the weekend. I haven’t been fortunate enough to get a breakout but I’ve been able to play this range successfully.
I’m still holding. I look at the chart of MOS and expect a similar move higher in LABU. MOS was in a trading channel and then busted higher. As long as the markets move higher, LABU will too. 🙂
Have a significant pos. In TGD, AUMN,
GSS — and waiting for take off — in the meantime, enjoy this pic of a
Hike I took this weekend! Wild River Basin https://uploads.disquscdn.com/images/b2b3a2fe59512ed8a9292b1b61cbbe281db866db35df5523a4227f235e768f01.jpg
w .. o .. w … how invigorating for the soul …
LuckyDuck 😉
I wanna do a round off backflip on that log… 😉
Actually it’s the sound and the smell that I wish I could share!
awesome.. just awesome….
takes me back – we used to take our horses to a ‘camp’ and would pack our saddlebags and head out ..many many creeks, ponds, etc we crossed (and walked & swam in) .. ahhhh… what a great memory.
thanks for sharing.. 😉
Yes, but yours ( like mine) had mosquitoes , right? I dont think they have those in Colo, do they? I know they dont have the ticks that are plaguing us in new England right now.
actually Horseflys and deerfllys..uggh – the WORST … we used to break off a tree branch and wave it back and forth over our heads.. they loved the Head region…
still awesome tho… pretty sure i have pics somewhere.. hmmmm …
Yeah, we get those for about a month. They actually chase you down and fell like they’re taking a chunk out of you when they bite. No good.
Can you turn it 90 degrees? My neck hurts from leaning over!
https://uploads.disquscdn.com/images/c9ef9e7109b462b4e63a7ebd835c4ae4af156740bb03f7fb705e6d2b8e5b7af6.png
When u click in it..it expands and is upright…. Fyi
And then when you click it again, it feels like you are RIGHT THERE.
Nice Pic Crystal
Stays sideways for me…but still gorgeous Crystal! Makes me miss Colorado.
Im guessing OREGON??
CO – Rocky Mountain Nat’l Park. Hiked the soles off my old boots!
SILVER, just moving sideways. Check out the 2 hr chart. Seems to be letting the 200sma catch up for another move higher. Just a guess, but I think bullish. https://uploads.disquscdn.com/images/80e8843cd410006c64d824c4af8ecd329a9606fc3b0d51730d74359a2717583a.jpg
Agree, just looks like a consolidation to work off overbought and allow support to catch up. Gold has been doing that all along so wouldn’t surprise if gold did that as well.
GOLD has actually moved lower, SILVER just sideways. If we get to the 200sma I suspect we will move sharply higher. BULL RUN
Buying opportunity in BAA setting up after its most recent nice run. Not today but soon.
They had some news but it wasn’t particularly bad. This looks similar to the dive that TGD had last week.If that’s the case it may recover quickly.
There we go. Recovering as I wrote the last note.
It does, I dont know if it is, but it does look similar.
I read the news too and did not think that looked bad at all. Go BAA.
Take a look at GLUU breaking out. Does it look bullish to you guys. Also eyeing NTDOY to add on a pullback
It looks bullish to me, but I cant tell if it wants to pull back first or just keep going. It makes it tricky for an entry, but I’d put it on a watchlist and if it does ease back down, I’d take a position.
NTDOY is way extended and gappy., but you said on a pull back and that might work.
We are having HUGE thunderstorms and wind. I may have to shut down into the close .
I see the same ole diehards, with Gold down trying to push higher. I would think that they’ll fly if Gold can get that push higher.
AUMN, TGD, GSS, THM, TRX …oh, and KGC flipped to green. Maybe it’ll start a run higher.
Can I ask what positions you have on currently, Alex?
AUMN, TGD, TRX, XRA, THM , GSS, NAK,
I bought many well below todays price, so be careful about jumping in any just because I own them. Some may be a tad extended, I’m just holding for the expected bump up in Gold. AUMN looks to be possibly just breaking out, NAK is kind of stuck in the mud, TRX is a good bull flag, but it is also extended, so its tricky adding here unless you can watch it and use a stop.
Then the dreaded public offering may kill some.
Thanks, I’m in GSS and TGD from last week and Taho, Goro from back in Jan. Would love if you would post when you exit GSS and TGD. Thanks!
Ok- I am thinking at this point that it will ither be the peak of the 2nd daily cycle , or maybe even wait for the 3rd daily cycle.
OR hold in core because they were bought quite a bit lower. I can still mention what looks like the end of a move higher if I notice anything that stands out,
Thanks, I’m still sorting out cycle counts. haven’t grasped it yet so I wouldn’t know when we were there myself!
By the way, Nice run on Goro. Good catch.
just BAA been a disappointment for me today.. currently down 9%.
but as Carlnetscouts mentioned …. maybe recovering.
Yeah, Big drop and its fought back about 1/2 way up. Kind of does look like the TGD flash smash
my stops caught the BAA flash crash and took me out with a decent profit. I’m very happy to not be in a stock after it does that. Lots of other places to invest. I can re-visit later – or not
AUMN leading the way, if its any indicator the next move for miners is up!
AUMN and TRX seem to be pushing higher, XRA and MUX seem to want to roll over. Especially XRA.
Looked at POT, MOS, MON, AGI, IPI…they seem to be about done consolidating and moving up too.
The chart of MOS is what I am expecting from LABU.
Adding 1/18 SLV Calls before the close….if interested. 🙂
Pretty light volume on the selling lately, that’s a good sign.
Just a thought …. If you had bought a significant amount of HMY at .53 last November and held, look where you would be today. So I’m thinking if TGD can hold .54, can we hope for the same?
Also noticed crazy volume on CAMT today (not a metal stock – but the volume is out of the ordinary)
wow Frenchie…
i was just looking thru some old charts… wow.. BAA – show me the $$
*Too bad I didnt hold.. lol
(old chart .. (gif) and the current chart Live & untouched.. https://www.tradingview.com/x/jiTkAHGj/
Anyone in AXU…? They filed preliminary shelf prospectus statement today….news just out late this afternoon……which will allow them to make offerings of shares in the future – I happened to sell mine earlier in the day for a tiny loss of about $50 or so….it just wasn’t moving fast enough for me and I didn’t want to get stuck like I am in GPL……
Whew, I almost bought that one. I don’t know if it’s late in the day for some of these stocks, but it does seem to be a good time for them to raise a bunch of cash. I follow / invest with another group as well and they will not touch a stock if it has a shelf offering in place.
Good thing you passed on this one! I’ve been watching it a few days and it just didn’t seem to be acting right even when some others were going up……so I unloaded mine just on a hunch and so glad I did! Of course now that I did, it will likely go through the roof tomorrow…:P I’m still stuck in GPL…..should have sold right at the first news…..
ALEX or other informed member…. What is this BITCOIN craze? Is it something to invest in or a scam? anyone know?
Hi Robert,
To be honest, I haven’t followed it enough to know. I was interested in it when it first came out and it just sh-ot up to the moon right away and then dropped back down. I then lost track of it after a while.
Hopefully someone else here can help you. You also may want to re-ask in the morning if possible, because some people here log off after the markets close and may not check back in at night ( Often I dont check n=back in after 6 or so).
Sorry I couldn’t be more helpful