
It Has Been A Good Ride
And I dont think that the ride is over in certain areas, so let me discuss that after a market review.
.
SPX– Looking for a break to new highs, early in this daily cycle.
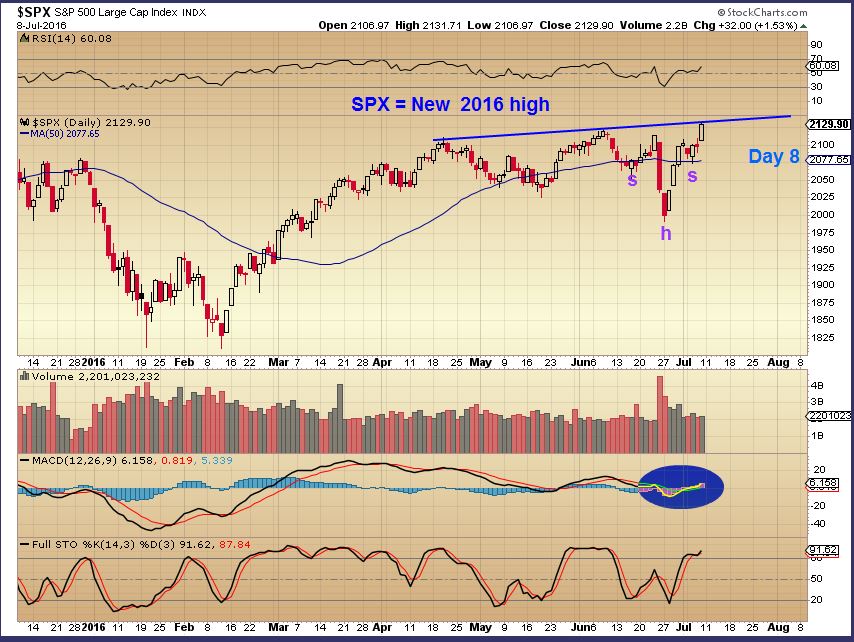
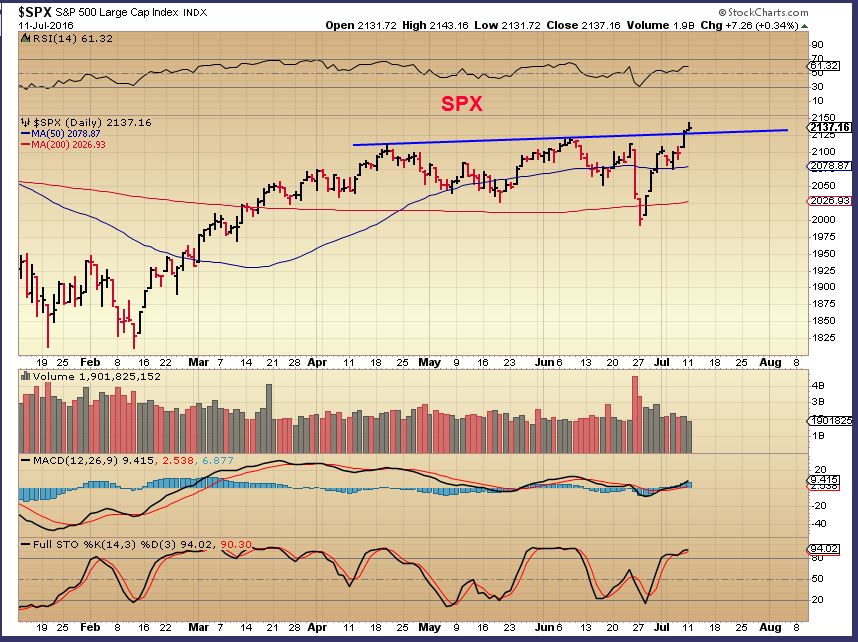
SPX – We got the break to new all time highs.
.
SIDENOTE: I want to release this at 7:30, please excuse typos, since I havent had time to proof read and correct.
.
IWM – The IWM also broke to new highs and I had a target at 120. I dont love this break out yet…

The break outs honestly looked a little weak. Why? Light volume and divergences, etc. I expected people to be shorting this tag at the highs. I have seen so many “Bears” saying that we would tag highs and roll over, that I expected a LOT of shorting. With a break out, I would expect a little short covering and that would lead to a better pop. SO far the pop is tame, but closing at new highs can lead to a run higher with no resistance.
,
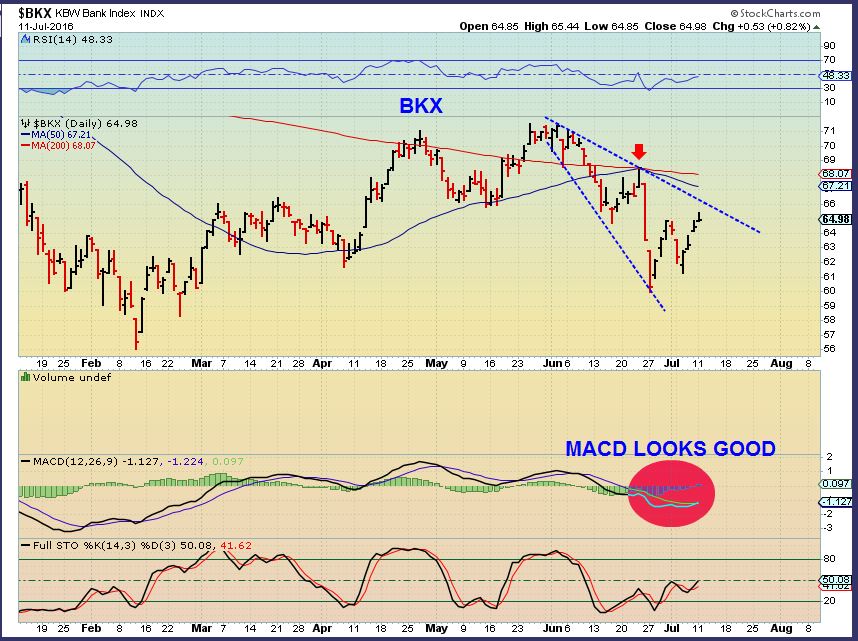
BKX – Banks improved, but have a lot of work to do.
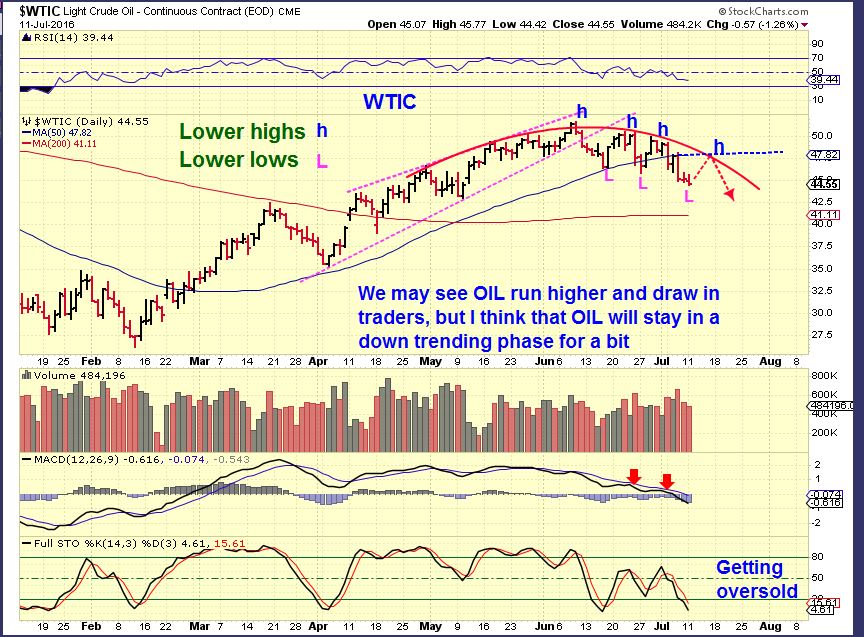
WTIC – I expect a bounce soon, but I’m watching it this way.
CRB – A pop in Oil would also help the CRB. Metals stocks actually look good to me again.

AA- Alcoa released earnings after the bell and price was higher in after hrs. This chart looks good.This should run to $11.50 and break out or form a handle and then break out. It has formed a nice base above the 200sma.

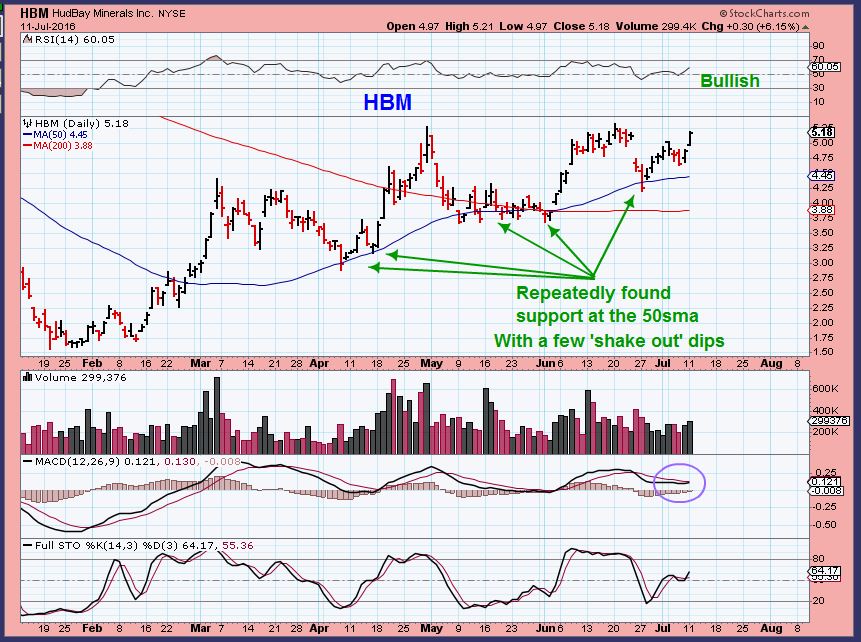
HBM – I like this set up too. Many of the commoditiy stocks (metals) look like they want higher prices again.
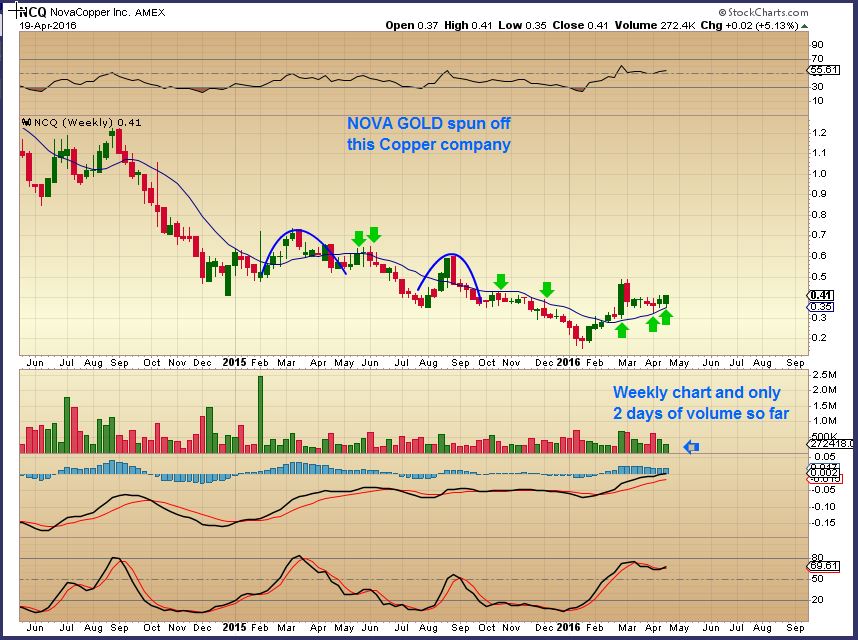
NCQ – This is Nova Golds Copper company. ON April 17th I posted this chart of a bullish base forming, it was a buy on support. Some have told me that they put this in their ‘core’ position.
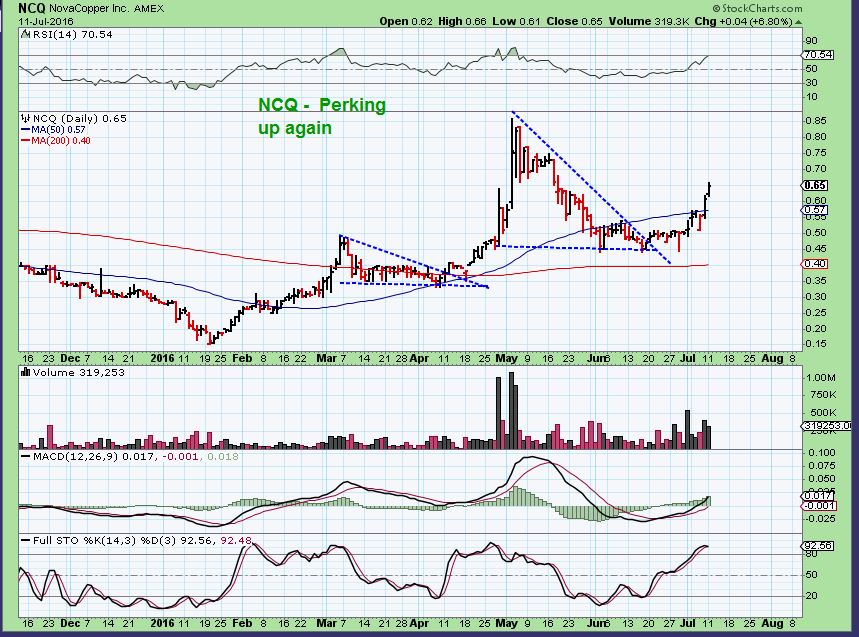
NCQ – It ran very strongly for them in April and broke to new highs. It has since pulled back to another base. It looks to be starting another strong run and will likely break to new highs again.
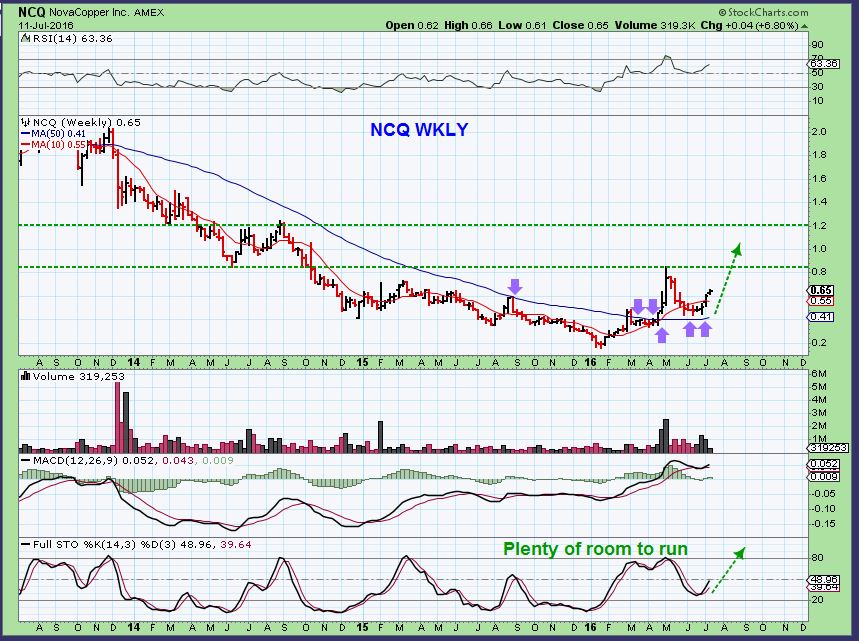
NCQ WKLY– This stock has good potential in a recovery.
X– US STEEL is back up near recent highs and will also probably break out soon. IT just ran from $13 to $20 while most worried about the ‘wiggles’ in commodities lately.

SO I think that many of the metals stocks look good again. Look at a chart of CLF. Things are bullish in this recovery, especially if you can just ride the wiggles in Metals and Miners.
.
GOLD, SILVER, and MINERS
.
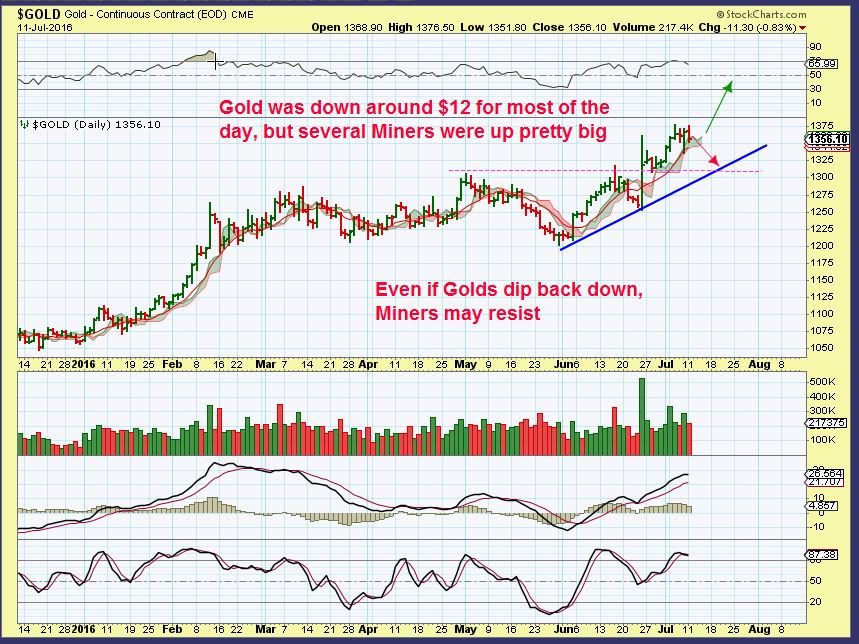
GOLD – Riding this Bull is tough ‘real time’, but Gold , SIlver, and especially Miners have put in a very profitable recovery so far. Gold was down Monday, Miners were green.
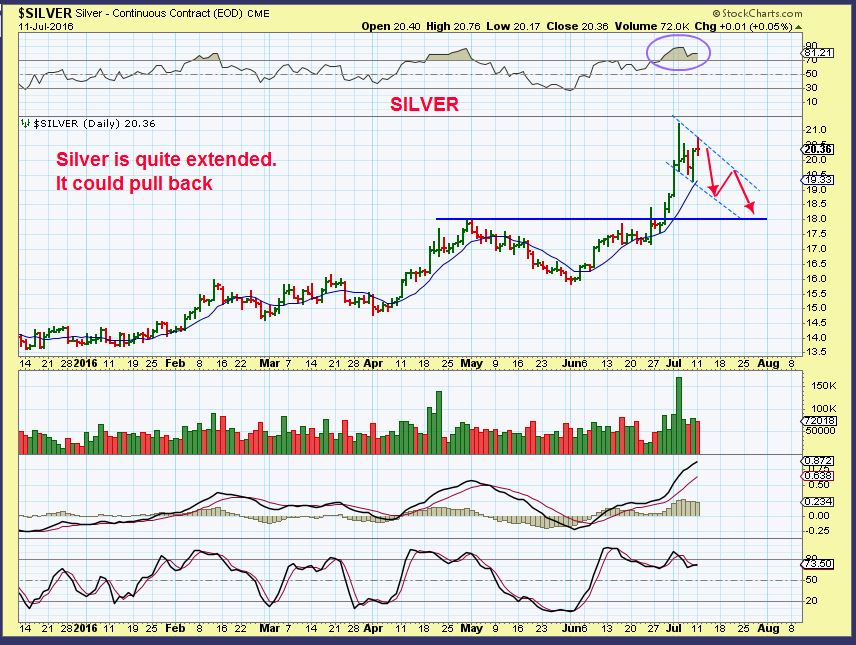
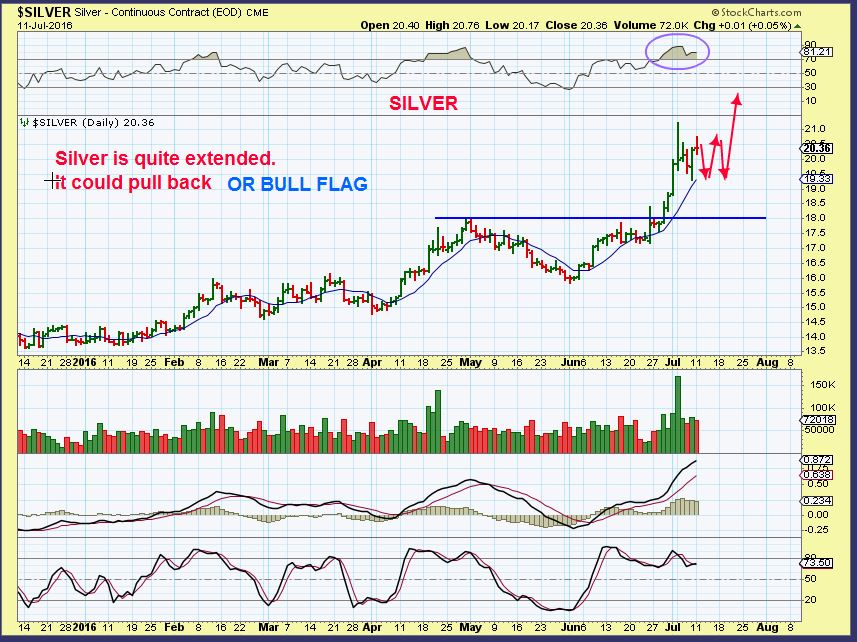
SILVER – Silver is extended, so it could drop and remain bullish. Maybe a tag of the break out, or…
SILVER – These extended precious Metals can just remain that way, and we have seen that in Many Miners. A sideways consolidation and another run higher…
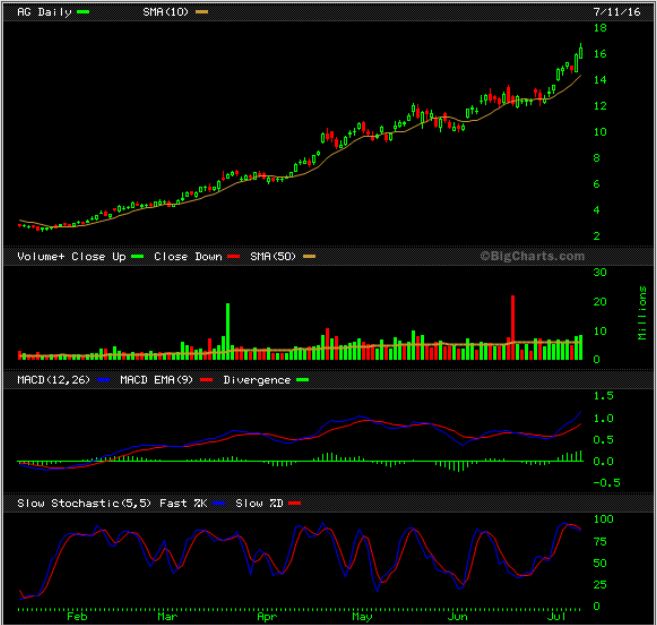
AG, CDE, PAAS, etc all at highs for 6 months and some up 600%- 700%+. Notice all of the sideways moves during drops for Gold into dcl’s and an ICL. I have a large core position in Miners now that I may not trade at all in 2016, even though I expect dips along the way.
.
AG – $2 to almost back above $20. I LOVE this stock. Plenty of “wiggles’ and sideways moves, but this trend was your friend!
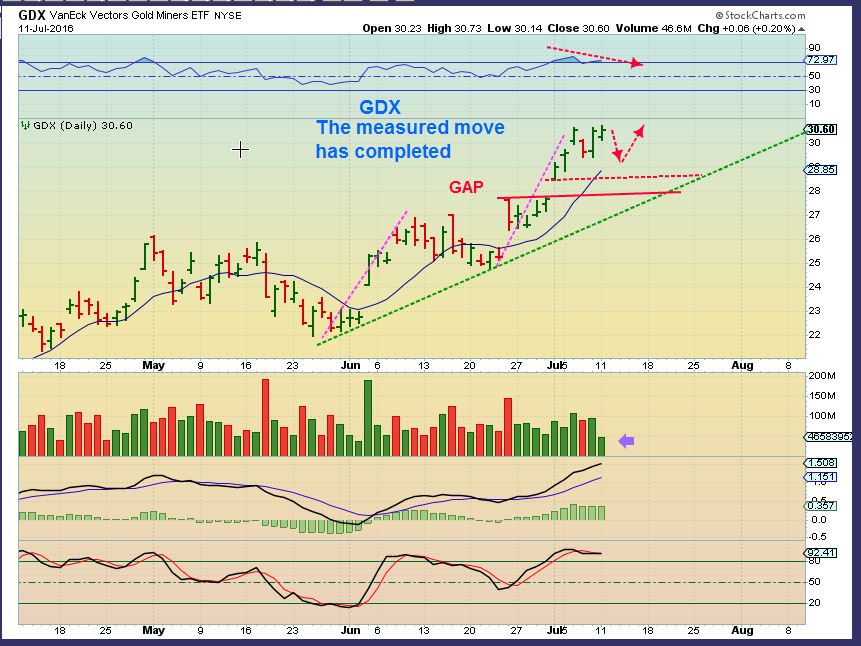
GDX – Plenty of ‘wiggles’ and plenty of profits. Yesterdays push higher was weak volume-wise. This could surge higher with better volume or dip down and re-group.
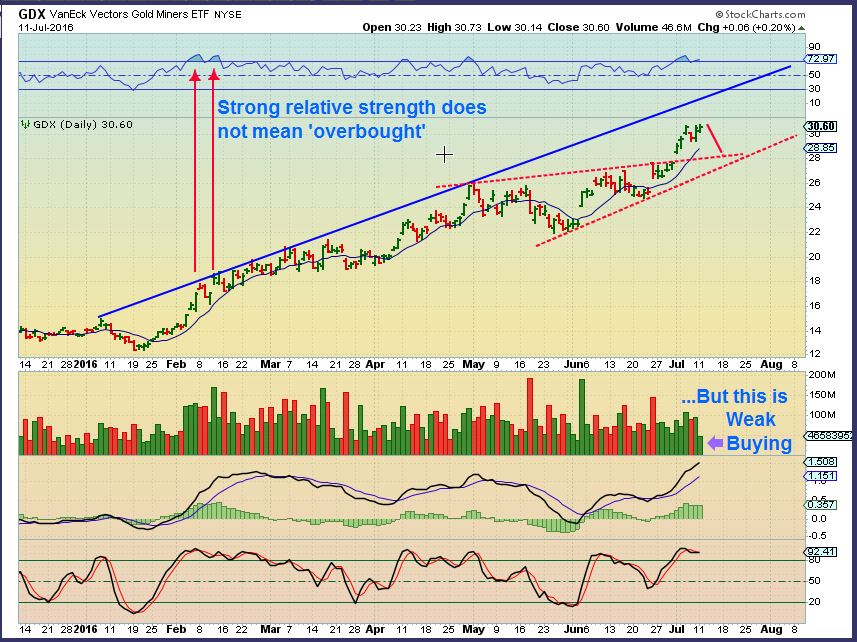
GDX CLOSE UP –
TRADING and INVESTING in Miners
.
With all of the wiggles going on in this bull ride higher, Many Junior Miners are just doing their own thing. I see many many nice set ups, and as you know, Giraffes are popping up everywhere. Lets look at a few Miners and how they act under current conditions. It will benefit many.
.
KGC– Recommended here, it was breaking out. I’d expect a run to May highs and then another break out. This was the buy, however…
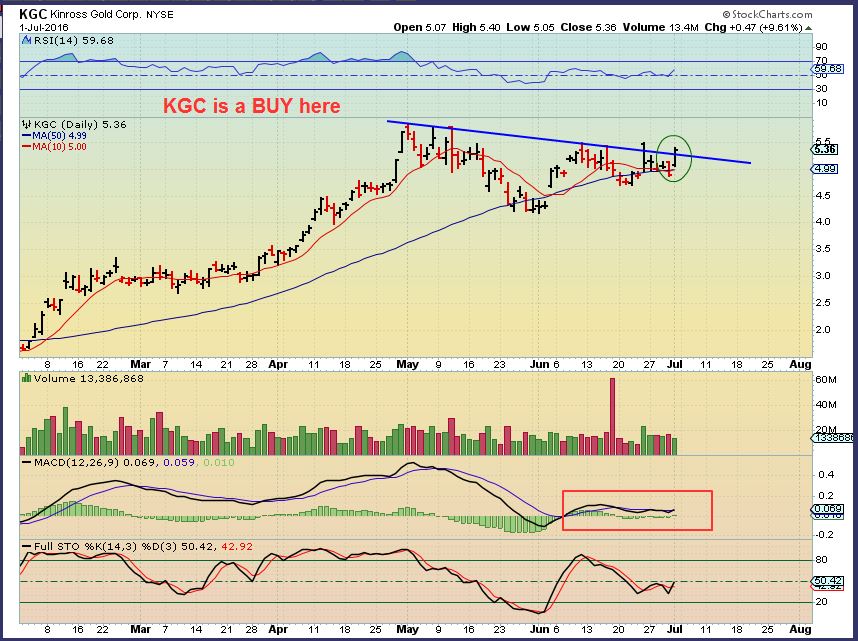
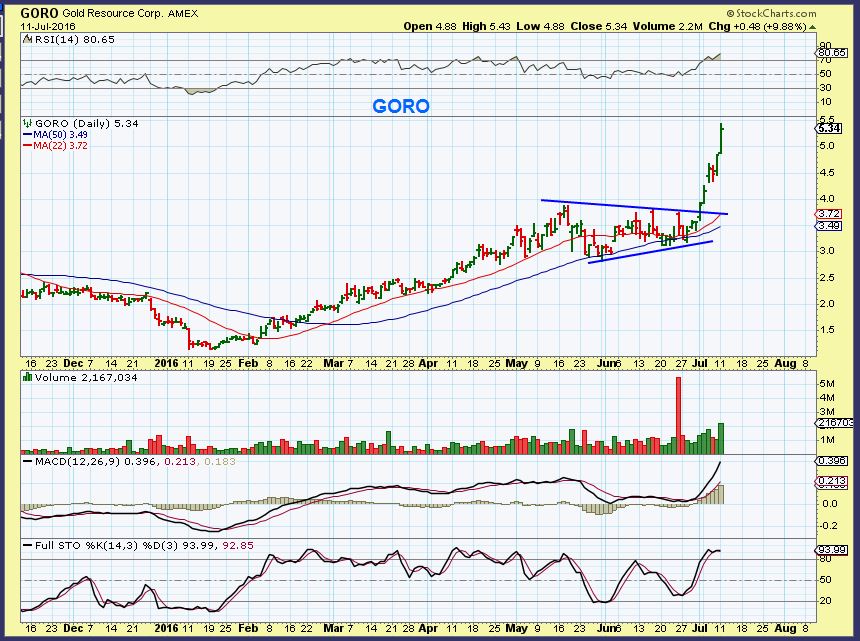
KGC – It remains a buy. It has NOT broken out above May highs yet. When these break out they can run swiftly again. Look at GORO for example.
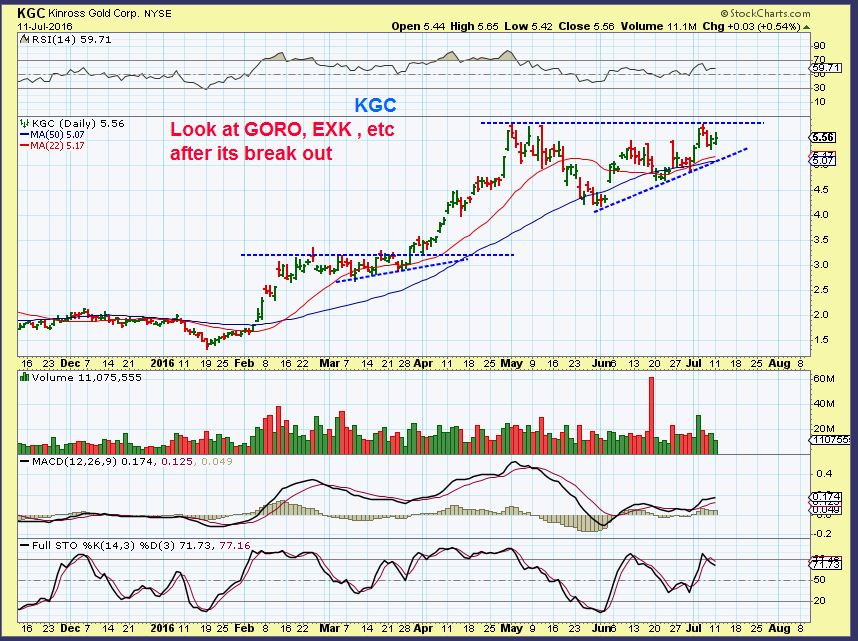
GORO – See how they can run after they break the May highs. Remember when I kept pushing BTG as it approached former highs? It broke out and so far ran from $2.25 to above $3.00. Good gains.
EXK – I kept hearing that EXK is lagging and weak. It was consolidating, and the set up was bullish, so I recommended it with this chart as a strengthening lagger, not weak. $3.89 and about to break out.
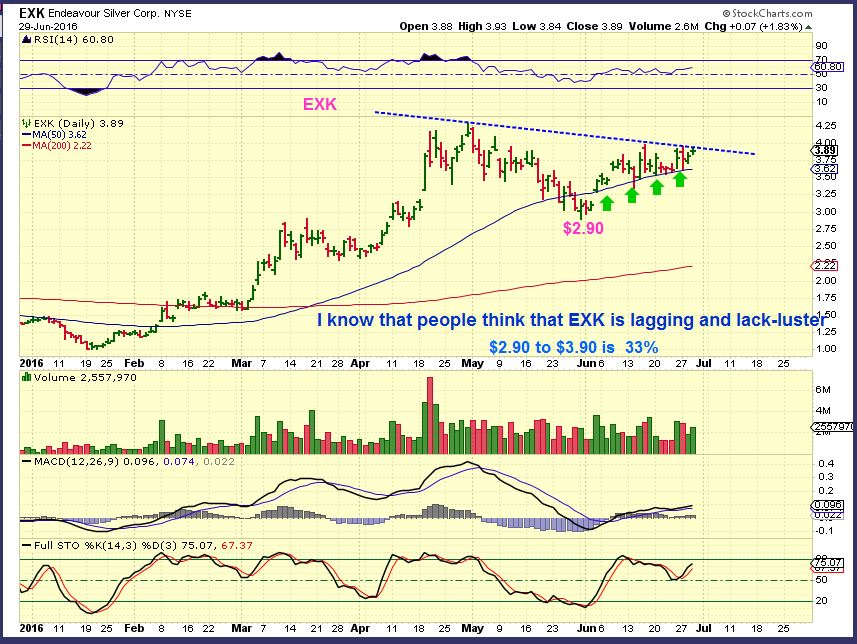
EXK last Friday. This broke out, back-tested , and looks ready to run ( Again see Goro).

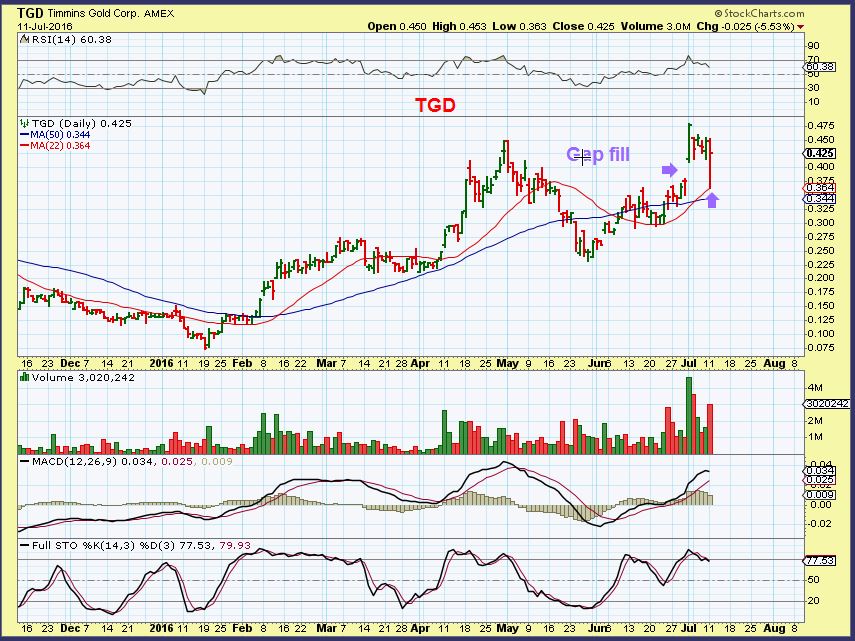
TGD – This was an amazing move. It was actually down 20% , and all it seems to have done is closed a gap & tagged the 20 sma ( 22 shown). I expect this to run higher.
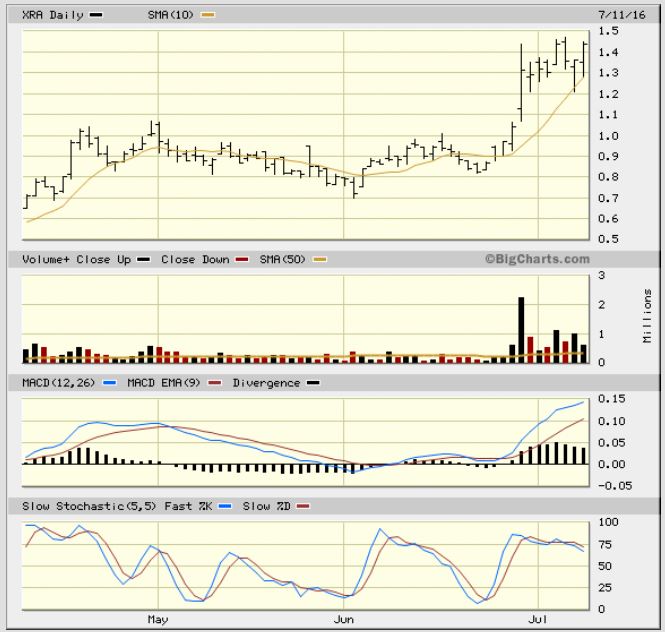
XRA July 5th – XRA has run up quite a bit, but I showed a possible bull flag could form, and this base is HUGE! You know how I feel about the potential of coming out of a nice long bear market base. I point them out all the time, but they do need to have proper formation and set up. XRA has it.
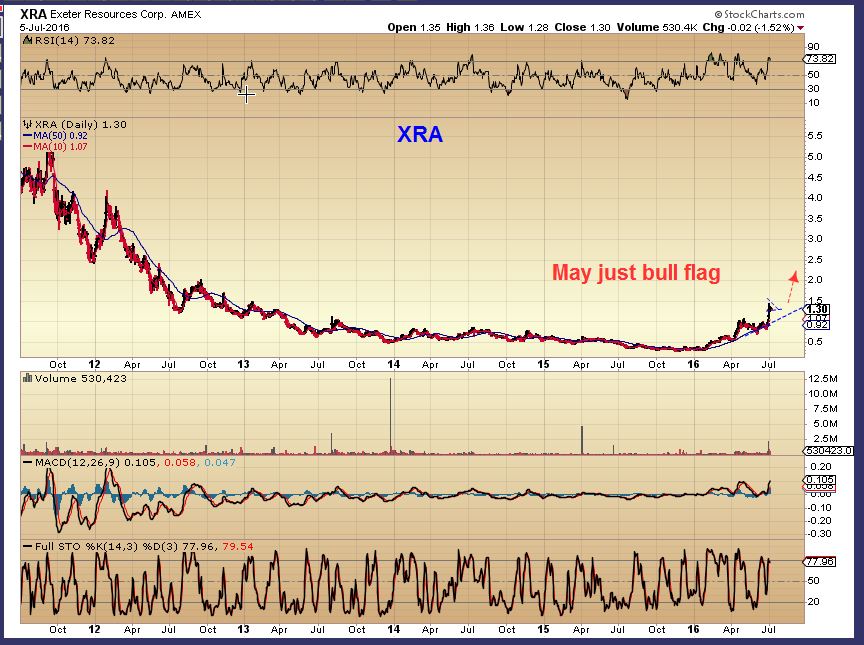
This is the XRA bull flag as of yesterday. It could just go higher from here. It is extended , so it is tough to buy, but the way it is riding that 10sma, you could place a mental stop there.
.
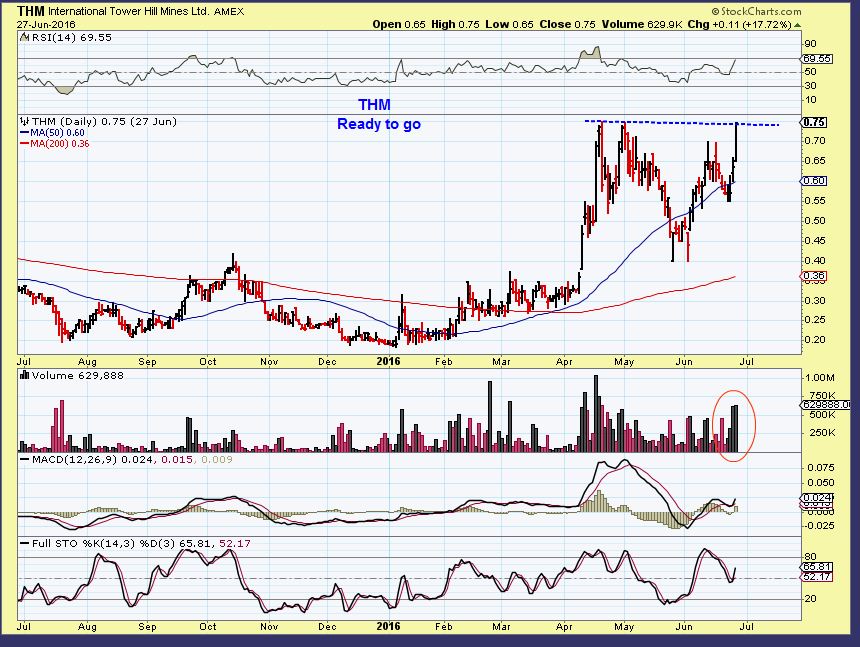
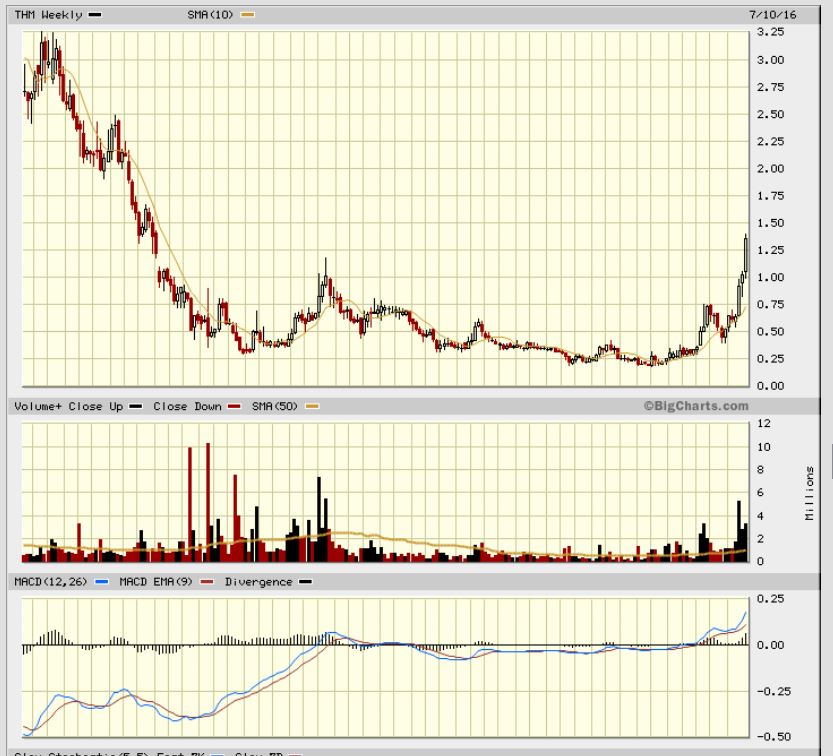
NOTE : THM looked extended. I was told that when I pointed it out at $0.60 and $0.75 cents. at the end of June.
.
THM– The situation was the same with THM. It was pushing April highs with a proper set up. I said to buy it, it was ‘ready to go’ at 75cents, though it looked extended.
It popped to almost $1, and I had a report that discussed how the first pop would drop and lead to another move higher
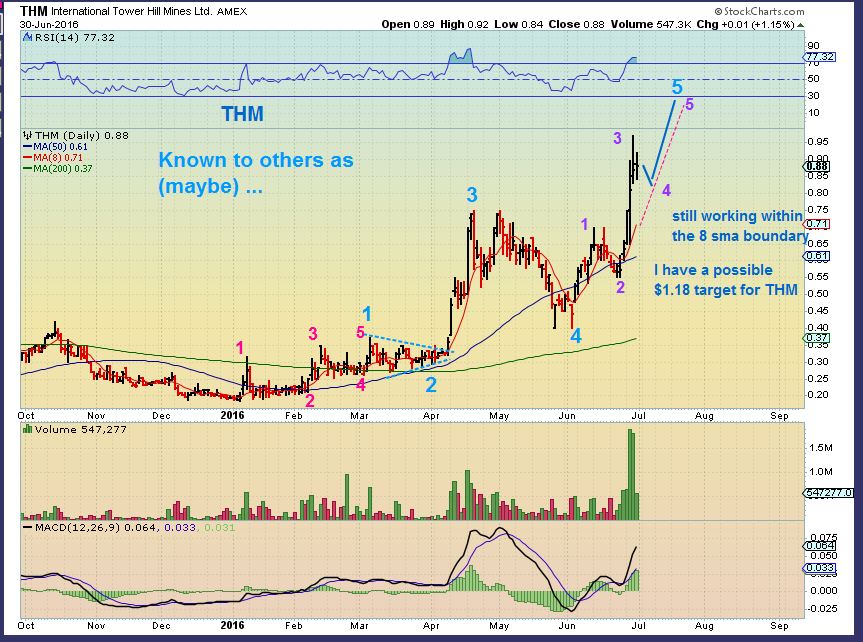
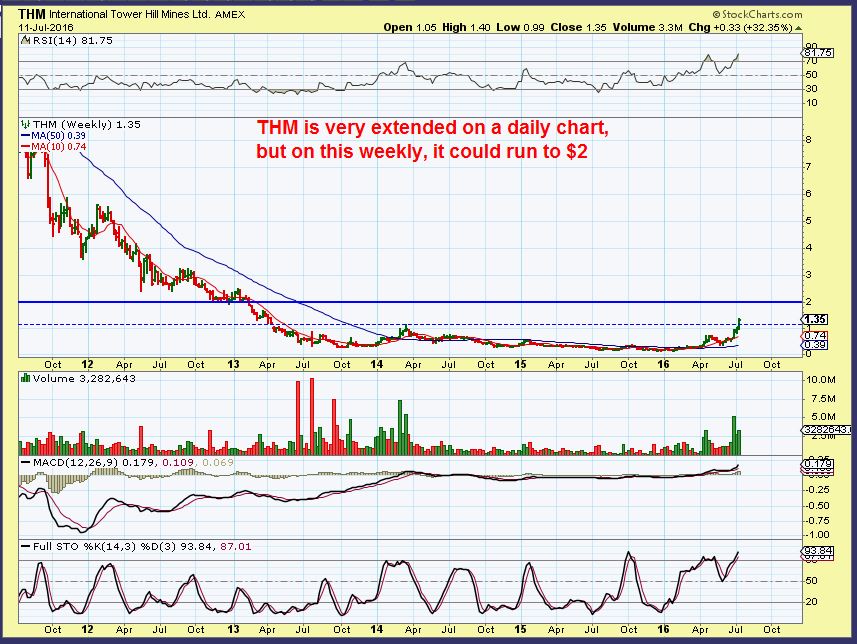
THM CURRENTLY– Though very extended, it has a long way to go in the big picture. Monday it POPPED another 32% and is now at $1.35! From our original 65 cents, that is 100%.
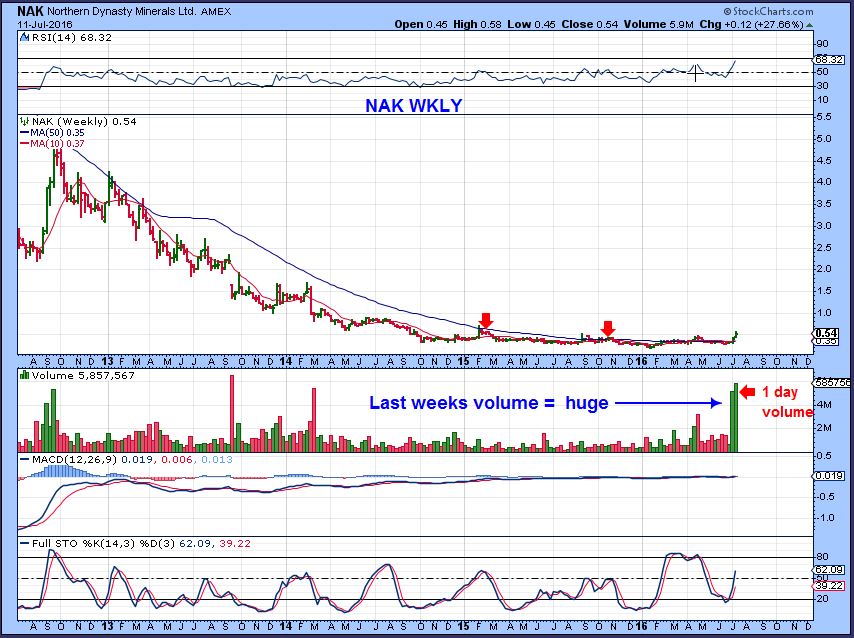
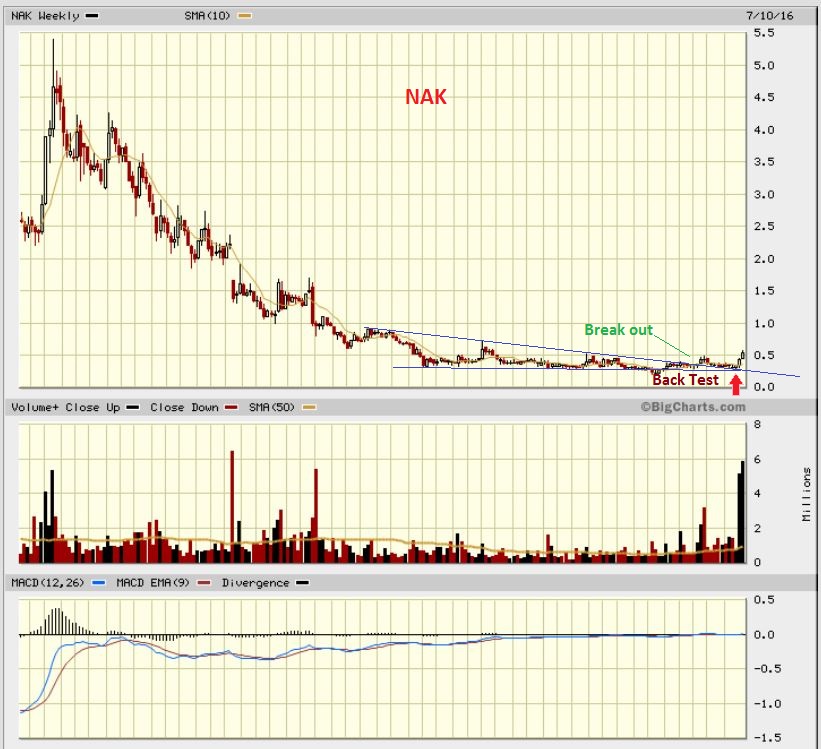
NAK – SO, I think NAK may just be getting going too. Mentioned it at the end of yesterdays report and bought it at the open. It ran up 27%, but is it over extended? Not on this chart. Any pull back and I will add.
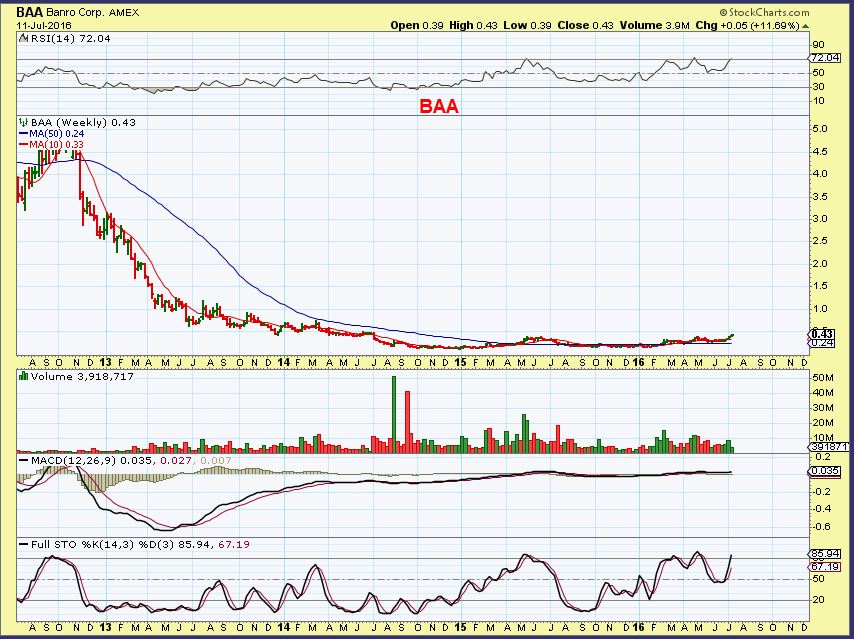
BAA – This is also a monster base. BAA has been moving higher daily and was up 12% Monday. Over time gains could get exceptional.
SO we have our general markets pushing higher and the SPX is at all time highs. It is early in the cycle, so gains could be good if one goes long the UPRO or calls, etc. I honestly didn’t LOVE that their wasnt a lot of short covering to POP it over prior highs, but that may still occur going forward. The BANKING sector needs some work. OIL isnt ugly, but it has weakened considerably. Interestingly, Some OIL/ ENERGY STOCKS look like normal consolidations. The Metal stocks look good and commodities in that area look healthy and like they want higher prices. Precious Metals are still acting very well. They can be getting a bit extended, and so I trade them individually. Some are playing catch up & may be safer to enter for some short term gains. The charts also show great potential if you just want to buy & Hold. Stocks like EXK ( yes, GPL in time) SAND, BTG, etc may end up looking like AG, CDE, ETC by the end of the year.
Traders and Investors alike are benefiting from the BULL RUN out of the precious metals bear market lows.
.


ALEX…. you are an excellent teacher, not to flatter….. but this helps me a lot.
Thanks for all you do for us.
Thanks Geurt
We’re all learning together 🙂
That’s right…. this we saw on SAND (SLL) when we sold “too early” half of our shares. Nobody knows exact when to sell or be patient.
But…. you do really good ALEX !!!!
Hey Alex – I agree with Geurt – I’m learning a lot from you! Thanks!! What do you think of TGB? Thanks in advance!
Thans Tammy
So when I look at TGB, it overall looked good, but that was an odd sell off/ recovery type day yesterday.
If I was looking to buy I’d give it another day to see if it goes higher with other metals stocks.
If I owned it, it is ok, but I’d keep an eye on it and see what it wants to do..
That was a funky candle yesterday
as the day went forward, TGB looks fine now
Alex – where are we in the oil cycle? Looking at the chart it just looks like downtrend….is it going down into an ICL..? Just wondering if the pop up today will last or if it’s just a pop and drop like it looks like the chart has been doing the last few times…..Thanks!
It looks like a failed daily cycle, breaking to new lows after each bounce.
If oil remains the way it has been for the past 2 weeks as shown on my chart, making lower highs and lower lows, then each bounce doesn’t really amount to much more than a consolidation,
Cycle-wise it has plenty of time to be weak ( plenty of time in this daily cycle in my opinion).
Does that mean that the next DC will likely be weak also? Same as this one, trying to go higher but failing each time?
It depends on whether or not this one drops into an ICL or just a DCL
Hey Alex, I followed
Peter Brandt’s (fellow Coloradoan) work before he signed on to be your competitor/collegue. I don’t buy his service – just yours – but I do read his free posts.
The fact he is short oil and like you, sees 41 or so as a potential target makes me think this is just a dead cat bounce.
Yes, Peter is not really a trader, he looks for long term set ups and goes with that.
So far- Nothing changed with OIL yet, but the energy stocks have some really nice set ups.
It’s a bit confusing, but I do like some of these energy stocks
FWIW.. i have oil looking jusssst like Gold did at this junction… was the correction abc and done (yes it was ;o)) or was it going to be a more complex 5 wave correction.. who knows…..
#Morph
MEOW
IMO…….. 🙂
Oil may have bottomed yesterday, which is wave 4 starting a wave 5 up today.
Verified by a short term 38% Fib. Longer term 50% Fib.
It may be time to nibble or add again IMHO.
I was just thinking that LGCY finally looks to be ready. ( just Ignore fundamentals 🙂
Many energy stocks are bouncing nicely.
Yes Ignoring Debt ! 🙂 At your own risk. 🙂
BAS,DNR,FMSA,GNE,GST,PDS,PKD,PQ,TGA,LGCY,LPI,NADL,OAS,PACD.
UH- OH
You just put DNR in that group. You’re going to invoke the wrath of the Gif Lady 😉
Yea I know……..couldnt resist the 2% dividend. 🙂
..
Did you just “Like” your own gif Maria? lol
Lmao..that is entirely possible.. I’m on my cell visiting colleges… and yesterday I accidentally uploaded… well.. nevermind…
have you had these gifs specially made?
It does actually kind of look like her, or at least her kinder ,friendlier twin : )
its like a Maria guest appearance in Josie & the Pussycats
So you’re noticing a cat theme here too?
more of a kitschy Hanna-Barbara cartoon theme.
LOL
yeah.. im good like that ;o)
Lol.. yes I own it (again)
ULuvIT:-)
Dear Alex
Yesterday i get in LGCY 500 shares @1.68 (Last Friday report you mentioned you may initiate LGCY on monday). Yesterday it was down. Also, i just bought PACD @6.45, EMES @10.99.
🙂 yup
Nice.. me too.
Alex, is VGZ getting ready for another go? Also a question from yesterday :
nancytheartist • 16 hours ago
Alex ,anyone else,….where do diamonds fit in? Are they included in basic materials? I like them as sparklies..but I think they have many industrial uses but I don’t know much about them. I was looking for something different…how does DDC look Alex? It is a Canadian diamond producer of rough diamonds [they say 3rd largest]. Dividend too.
I never looked into Diamonds and their movements.
VGZ isnt clear, it is in an area where it could go either way
Just bought some BAA. .good press release last night ..”record gold production results in Q 2″ ramping up production.
Alex. how about a comment on my scary AUMN?
I own it. Possible bull flag at the 10sma. Could break out on the ext push higher.
Thanks
Hi Alex, is TRX bull flagging? Time to add? Thanks
Hey Ryan,
I am watching it and the selling is light volume, it is basically going sideways, heading toward the 10sma, and I like that.
Is it extended a bit? yes. Does that make it a bit riskier? yes.
Are the ones that have been coming out of those long bases just blasting higher ? Yes ( VGZ, MUX, ETC).
Knowing the risks, it could be a buy. Resistance looks to be above $1.60 using a monthly chart
Thanks so much, Alex. I’ll hold off a little longer and wait for a deeper dip if it comes. No problem if it doesn’t.
CLF …. I need to name something after this stock 🙂
You could get a little hamster in one of those running wheels, call him Cliff 🙂
Or a lemming 😉
CLF Claven
SOME OF THESE ENERGY SET UPS DO LOOK VERY GOOD USING VARIOUS TECHNICAL ANALYSIS METHODS.
.
refresh for an example. This ran about 400% last April when it broke upward 🙂
.
Do we dare buy BCEI after an 18% up day?
What I do is look at the chart. BCEI was selling off inside a rather tight falling wedge.
Has it broken out & popped off of the bottom like that in the past, and if so , what followed? So look at Mar 1st area, and the start of April area. They both popped up about the same as today, breaking out of a wedge. If I bought that day, they doubled and tripled.
No guarantee that this will run like that, but the risk seems reasonable / low
Or do we look for another in the sector with the same chart pattern getting ready to make a similar move? I do understand your thinking above. I bought THM, XRA, etc. after big moves and they still paid me well.
Yes, you could do either. I do that too. ( I dont want to mention LGCY to you, it is dead to you, but I was watching that in that way).
I have been looking for those types of falling wedge patterns .
The hardest part for me is that OIL isnt ready cycle wise, unless something just changed the rules . These energy stocks do look ready to go..
I know OIL should be the catalyst for the energy sector, but does it always line up? Just like the miners sometimes bottom before gold, etc. XLU, Utilities are rolling over. I seem to remember them inverse to energy.
True ‘dat!
Volume picking up on some of these energy stocks. GUSH is huge today (services sector) EMES, SDLP, ORIG, WLL, CLD all looking good. I might have to start a position tomorrow. I did sell some of my miner holdings today.
Sake issue here. Was that a 1 day wonder or did we get the end of the most recent cycle wrong? Should know by the end of the week, right? I’m unloading energy here, not buying.
looks to be on a mini pullback.. for how long , who can say
holy crapoly. that didn’t last long!
Some like LGCY, PKD, SXE, NOG , BTE, etc etc etc are not up that much, but seem to be shaping up IF IF IF This sector is preparing to move higher. And it does look like the whole sector is setting up
What the he’ll was CWEI doing up 17%??? Where did this oil pop come from? That was crazy!!
AWESOME
The XLE is attempting to break out to new highs. MACD is about to cross up higher.
Go Figure
Alex.. you buying dips on miners, or switching to some of the break-out energy stocks?
Tough one. I really like the look & set up on many of these Energy.
Commodity metals sticks actually look excellent.
I’m leaning toward buying dips on Miners, because IF we are in a long first daily cycle , the second daily cycle should be very strong too.
If we are in a 2nd daily cycle, it is day 13 for GDX and a dip to say day 15, then a burst higher could also do very well. Especially if we get those bursts in the lagger juniors.
Energy stocks look very good, but Oil is looking like a downtrend started short term.
CLF, AKS, CLD, FCX, X,etc all looking very nice
SOG,
FWIW……I am doing both.
Aren’t u chatty Cathy 2day…. 😉
Ok I will shut up……. 🙂
Timing is every thing I have been told ! 🙂
Have you seen an entry yet on metal stocks, though? CLF and X have been straight up. I sold X too soon to lock in profit, all I did was lock myself out. Well, at least it was a win. Let us know if you see a setup, again, not chasing at this point.
Has anyone seen any news on SGY?! It is flying up and it was almost bankrupt! I can’t find any news! Up $7.50. Could they be getting bought? I’m afraid to sell, but it has been awful holding it.
$2.50 to $25 from May to now. WHats so great about that? : )
you forgot the reverse split to stay listed!
No – I remember most of those that were in the 20- 40 cent range and suddenly they are trading well again : )
so the $2.50 – $25 is 25 cents to $2.50.
NADL is another that has performed like that.
interesting viewpoint
%-Wise it is still the same , so the gains are great on a run like that, but like you said, they announced possible Bankruptcy and had serious financial troubles, so you have to wonder what someone else may know.
Alex, thoughts on the $gold timing here? We’ve crossed the 10dma and have a bearish engulfing (so far) on the weekly…Wonder if this is the end of 1st (long) DC and entering a half cycle low for IC? If so should be a quick $30 down day or 2 to end the cycle. All roads seem to point to $1300 but we’ll see.
Pretty much.
Alex – any thoughts on GTE? Does anyone know how to explain the “subscription receipts” deal they just had announcement on…? I understand issuing more shares..but…this seems slightly different and not sure how it all adds up to affect the company in the long term….any ideas?
so tempting to get back into oils, but it looks like a lower high forming now for the past month. not so good for anyone jumping the gun if that happens.
Defenseable if it does.
Energy Sector heating up? GUSH +16%., ERX+7%, UWTI +15%, USOIL +5%
Yes, we’ve been talking about it while you were away
Anyone see REN the past 3 days? ( After a split also)
they just reported stellar, record results from a couple of 10,000 foot horizontal wells in the Permian Basin. A huge game changer for this almost bankrupt company.
That was a huge 3 day move
FCX broke from that consolidation this morning with conviction.
Finally looks like it wants to take out the highs and run for a bit.
Looks like it may run to $20, and that is a double from the end of June
What the heck is that last candle!? That really looks “highly suspicious!”. I have a trust issue….oh, they must have heard me. LOL
What time frame?
The very last of the day! Price went from 12.91 down to 12.30 the very last minute! Now it is back up to 12.87 as a closing price.
I don’t have it on my platform?
I checked and I didnt see it either, and I tried 1 minute, 5 minute and 15 minute. No trace of that dip.
The daily chart looks great 🙂
I use charts from my Options Xpress act. I don’t know how to copy them. I had up a 10 day/ 10 min chart. If I put the cursor on that candle it is labeled 16:00 o’clock and lists open:12.90 high: 12.91, low: 12.30 close: 12.89 . The next candle is labeled 16:10 and opens at 12.89
HOLY COW! As I was looking at the chart a new after hours candle flew up to 14.78!!! And now back down to 12.89!! Huh!?
Hmmm…how long does gold pullback and when do we time next purchase? And was oil’s move today fake or did we incorrectly ID the last cycle low? Will be looking to answer these in the charts this week!
Most of the charts I’m pulling up are sitting on the 8 EMA, if this heads up tomorrow, likely your buy there, if it pulls back more, watching as it approaches 20day along with RSI(5) and stochastics for clearing o/b conditions.
SOG .. check out FCX with the ‘flip’ for this move… u cant make this stuff up… unReal
https://www.tradingview.com/x/XSAz5nGg/‘