June 28 – Continuations
Friday we saw the initial reaction to the Brexit vote, and Monday we saw some follow through. Lets look at the charts…
.
From the weekend report…
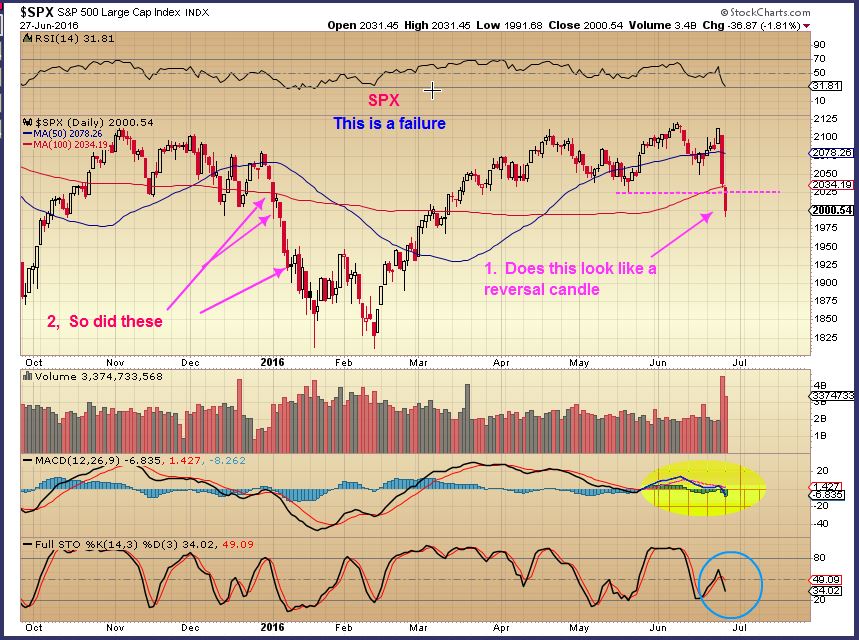
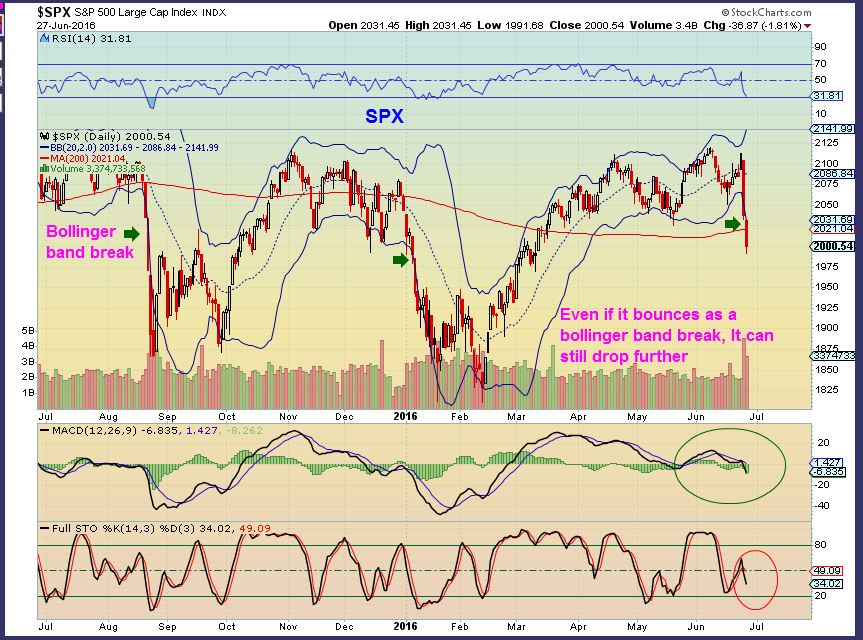
We see a reversal type candle, so we could get a bounce, but this is a failed cycle and now we are heading lower going forward until the SPX finds an ICL. If that ICL holds above Feb ICL, we have a higher low and can still break out higher later. For now, we will probably make a series of bounces down with lower highs and lower lows above 1825.
I want to add one outside the box though. GOLD fell into its ICL by dropping and mostly only going sideways From Feb through May. If the SPX did that, it would remain a super bullish consolidation, so I am watching to see if the Feb ICL holds, but also how it holds. Golds drop fooled almost everyone.
.
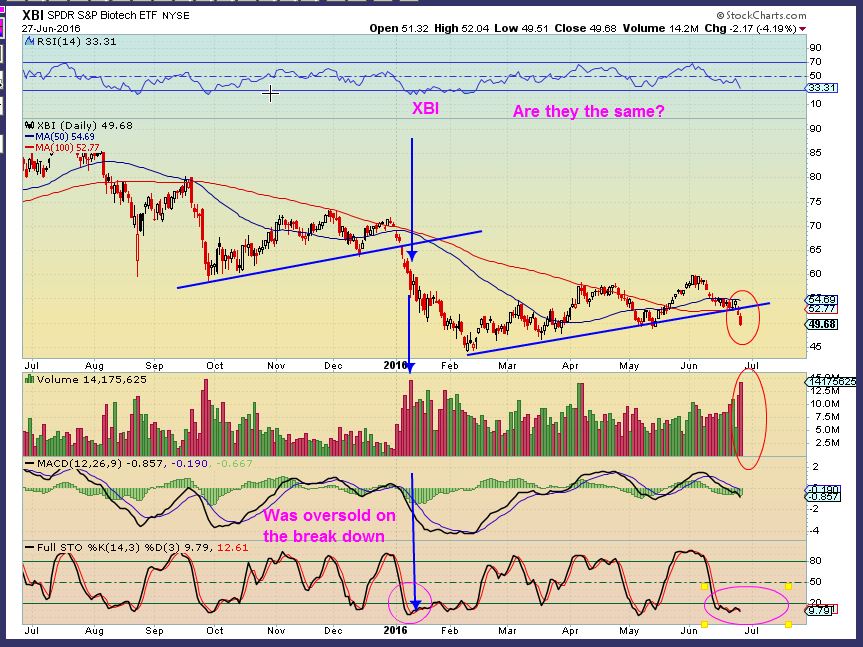
XBI – I have not been covering Biotechs since Aril May when I liked the base. It broke out in May and fell back inside of the trading range, a lack of buying. This looks a bit cautionary, so I will still stay away for now. The last time it looked like this and was oversold- it still gave way to the downside. Watch Feb Lows.
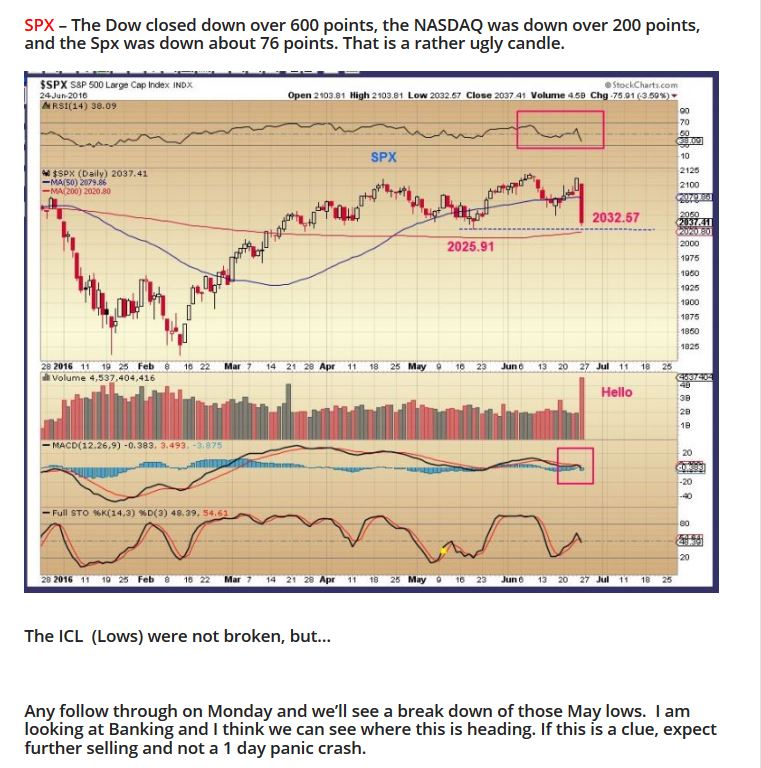
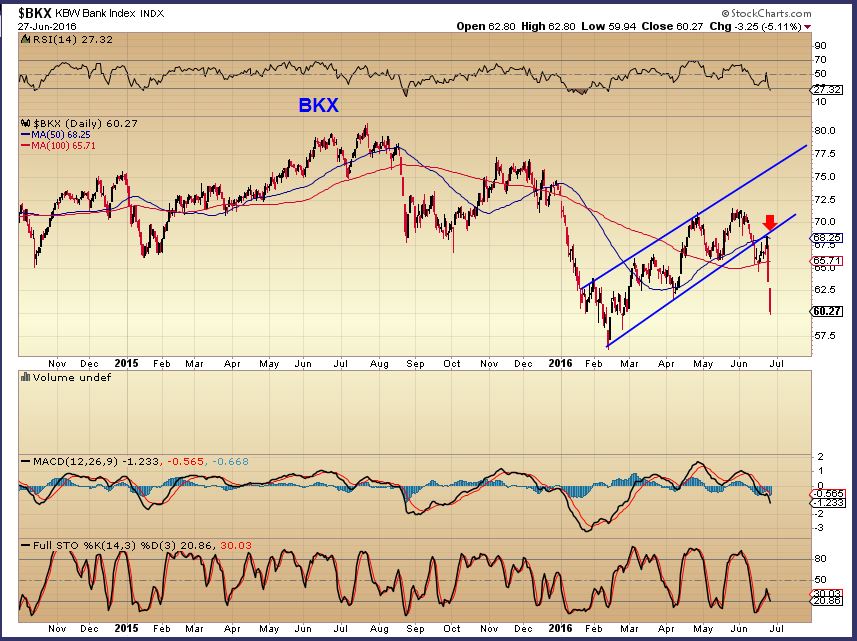
BKX – I pointed out the break down and back test in the wkend report. It continued Breaking down.
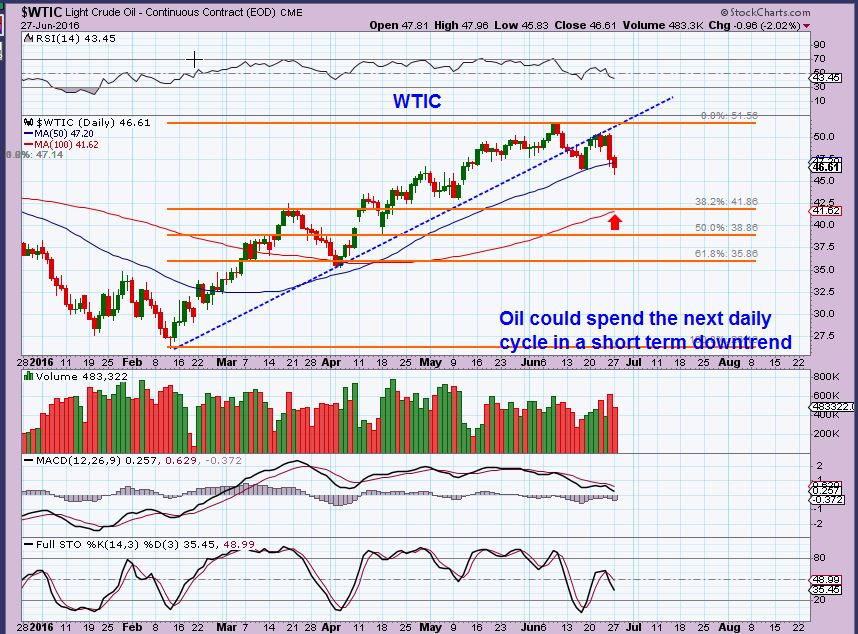
WTIC – There was a slight break of the June 16 lows yesterday, but I thought that those June 16th lows were the DCL. Is this the dcl? We need time to see if this can bounce & move higher. THIS MAY BE AN OPPORTUNITY TO LIGHTEN UP ON ENERGY. WE HAVE A BREAK OF THE INTERMEDIATE TRENDLINE, and this likely means that we start finding the next ICL sooner than later. See that mini stairway up in May? You may see that in reverse on the way down to support.
GOLD SILVER & MINERS
GOLD added on $8 Monday. After the huge burst higher Friday, I could picture it doing a bull flag? A back test? I cant tell if that was a 1/2 cycle low and we run a bit higher and then back test as the next dcl, or was that a short daily cycle. I guess the first theory. So…
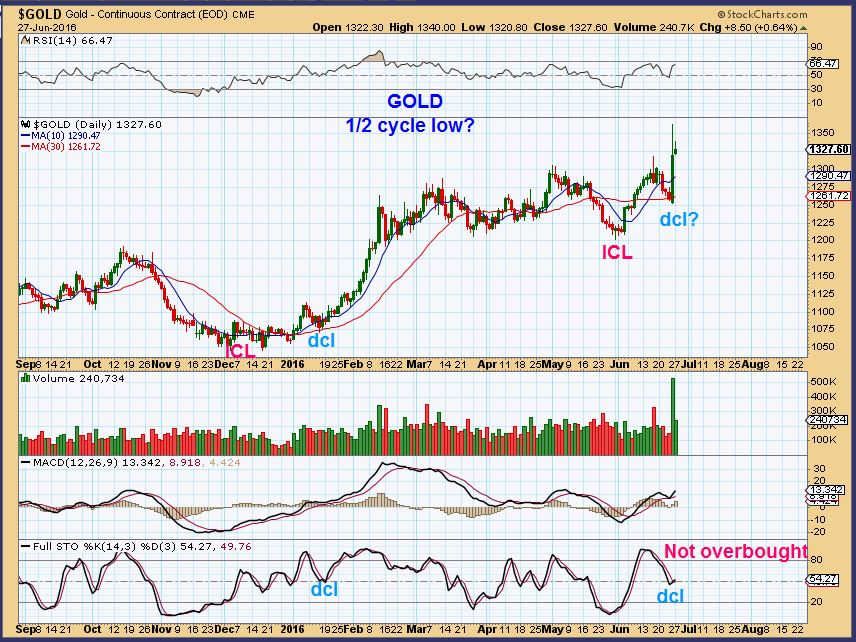
A Bull flag or slight move higher and then a drop into out first dcl would be a great buying opportunity. Then Gold heads higher, but time will make this picture clearer.
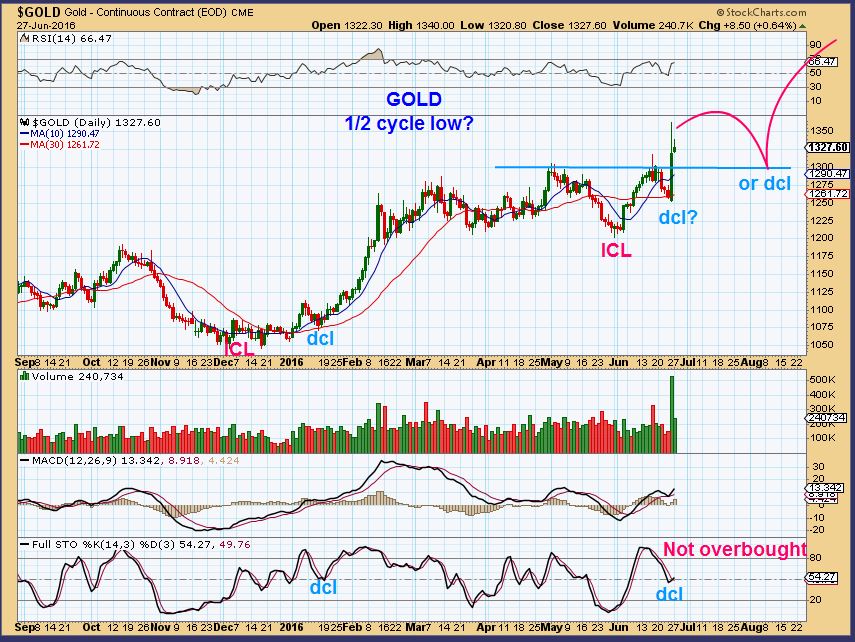
EDIT: Gold at $1308 could be ‘bull flag back testing the break out’ this morning.
.
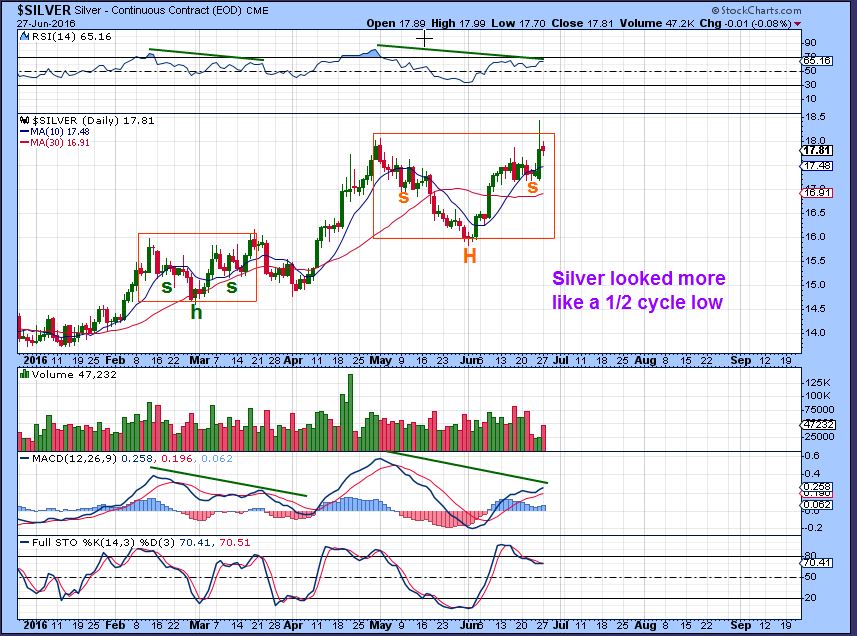
Silver – I looked at this bullish set up, but then I noticed that we saw something similar and the divergence “Might” mean that silver needs a handle or sideways move before breaking out. The end of March was a drop to a DCL, so if we get one soon, silver could pull back.
IMPORTANT NOTE : As I discuss the Gold & Silver charts and point out that we had an ICL 4 weeks ago and now may be due for a DCL, please note that individual Miners did not react down in the past run this spring. GDX went sideways in MARCH when Gold & Silver put in a DCL. I’m not selling anything Miners just because I feel there could be a pull back in Metals. A bull flag here on Gold or Silver would allow Miners to remain bullish, and we’ve seen how Miners are acting lately.
.
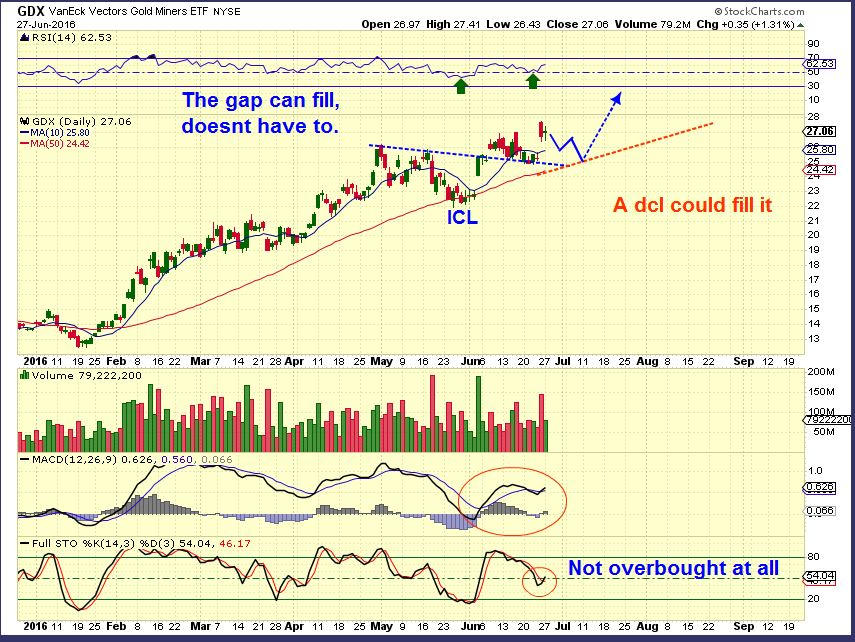
GDX – Was that a DL on day 19? Or a 1/2 cycle low and Miners run higher into (guess) day 25, then drop into a dcl for day 32? Either case is Bullish, it remains right translated in both cases, so I am still Bullish Miners. I’m adding on dips and will continue to show some set ups here.
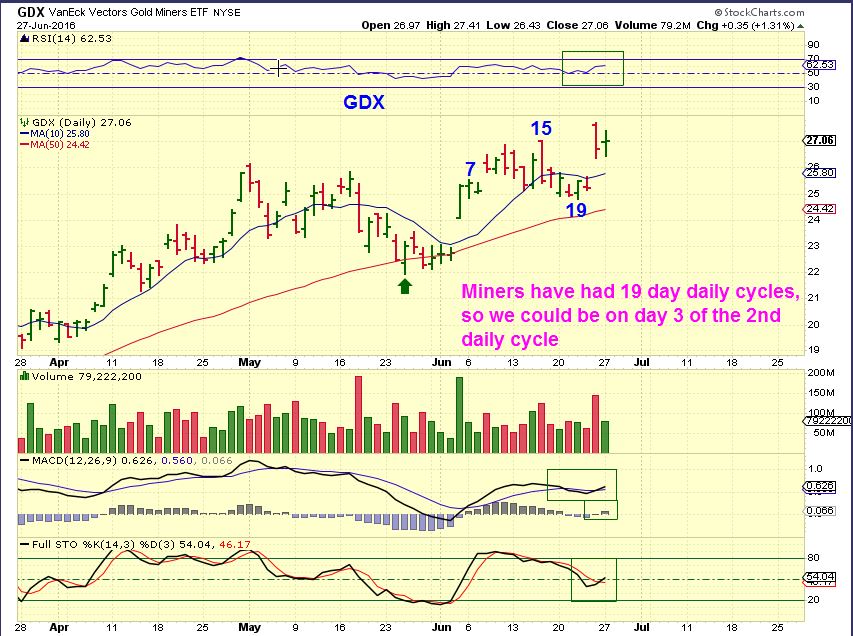
A dip in Miners like this is still bullish.
So I feel that everything except for the Precious Metals is in question for the short term. In my weekend report, I tried to convey that there was no short term clarity after Fridays Brexit thrashing and I’d have to wait and see what Monday & Tuesday brings. Monday did add another piece to the puzzle as lows were taken out, and things are still a bit more ugly than beautiful in the short term at least. Now we watch for ICL’s to hold as the final lows in Oil, SPX, etc
Then I’ve pointed out that in charts of BTG, SAND, MUX, VGZ, TRX, TGD, ( I’ll add IAG, TAHO, RIC, DRD, and other miners) you see established uptrends, and some set ups that have decent entry points. This really is the best place to focus. YOU may have your style and want to short a bounce, buy ETFs long & short like LABU, LABD, UWTI, DWTI, UCO, USO, as a trader, I applaud that. Use your style as you see fit, but I want to focus on Miners.
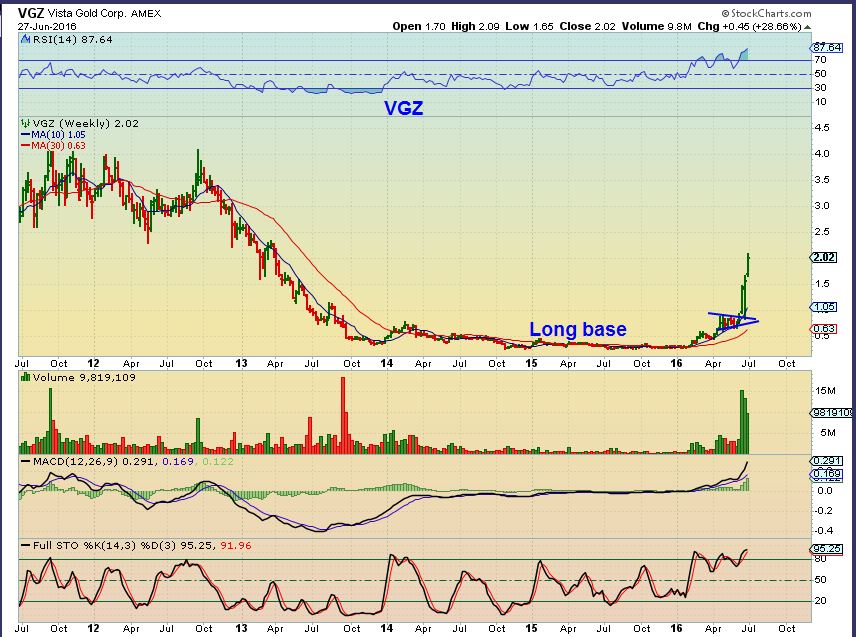
I currently own 1 energy stock and IPI, all the rest are Miners. I may sell my energy stock on a bounce in Oil, and try to re-enter later. When I sold MUX and VGZ move out of the ICL, the money went into BTG and SAND. I sold the last portion of my VGZ yesterday and bought another Miner that I will point out here.
.
I have been ‘focused’ mainly on Miners the past few weeks, because they are the most bullish set up at this time. Oil looked good, and I expected a run to $60, but I sold my positions to get in lower on the DCL, and now the set ups do not look as good. We’ll see if they mend and go higher or is Oil driopping down into its next ICL already?
XRA – This is where I put some of my VGZ sale yesterday. I view this as low risk holding the 50sma like a bullish move. I actually bought XRA 3 weeks ago a few days after it recovered the 50sma, and then I sold it ( Stopped out) for a loss. Now I am buying it higher, not ideal, but it happens. I like this consolidation and set up, with the MACD crossing higher.
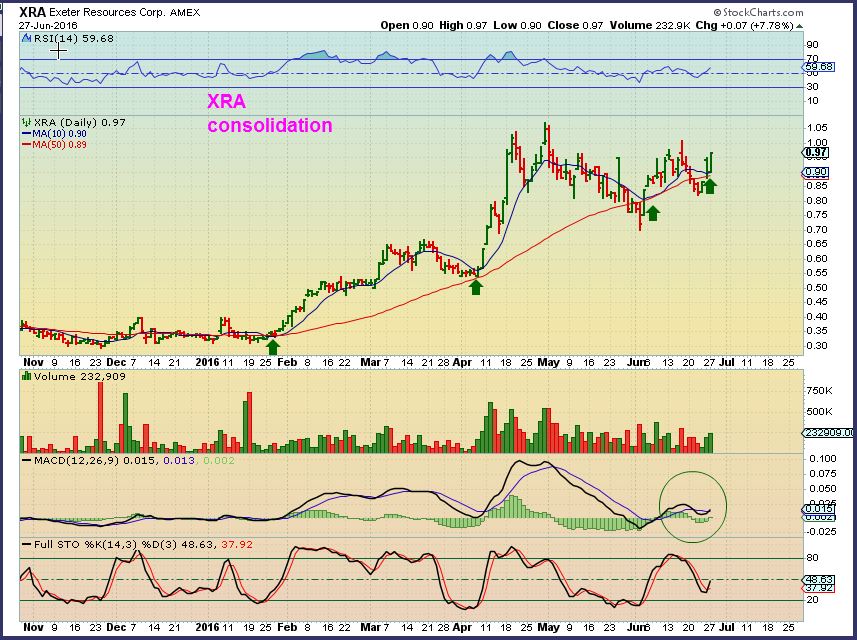
Then when I step back, you can see that I have now decided to make this a buy & hold part of my core, unless bad news or something ruins this chart. I love these long tight bases with a bull flag type consolidation coming out of lows.
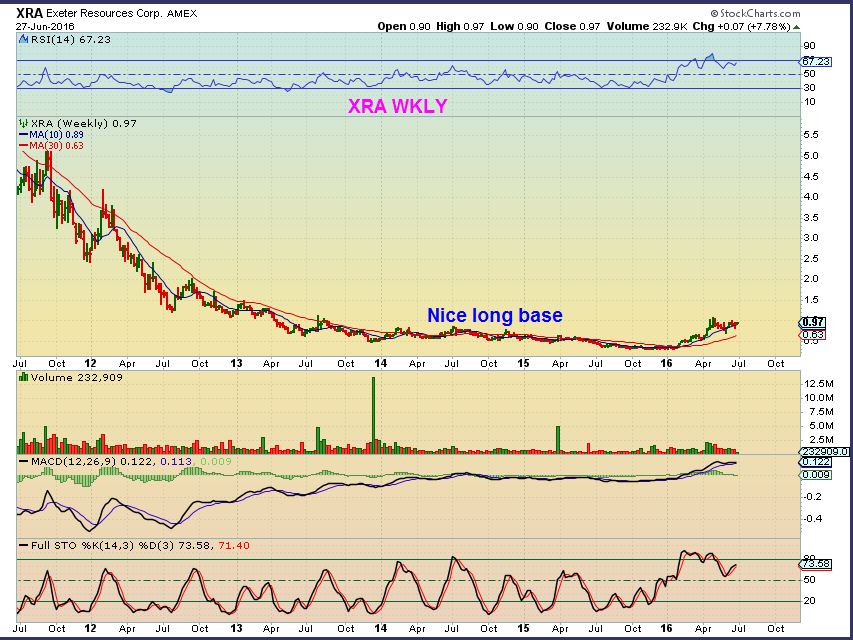
As mentioned in the past, no guarantees, but Long tight bases with bull flag type consolidations can get explosive. Does the XRA chart look familiar here 🙂
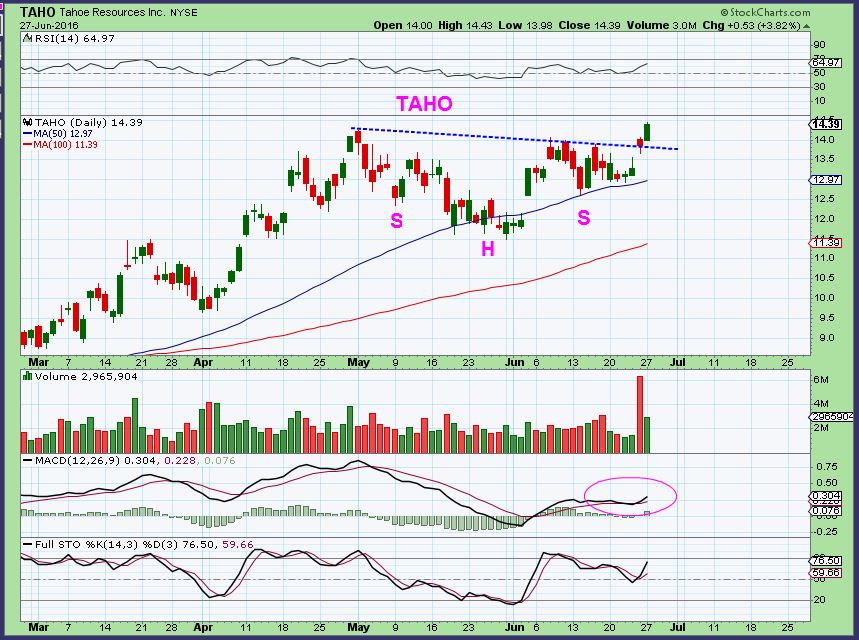
TAHO – This is a bullish set up too. Taho hasn’t moved with huge %-gain personality, but slow and steady wins the race too. This also has good fundamentals. You may recall that I rode this for a bit this spring and sold near $10ish to get in lower. Here it is at $14 without me. It’s a tough ride in May, but Miners are acting like they are in a Bull market, and Buy & Hold if you can take the wiggles, is back to beneficial.
THM – I do not know this company, so maybe you’ll want to do some research and see how their operations are going, but this is another HUGE base with solid Pops. In a recovery , this could be MUCH higher a year or two from now.
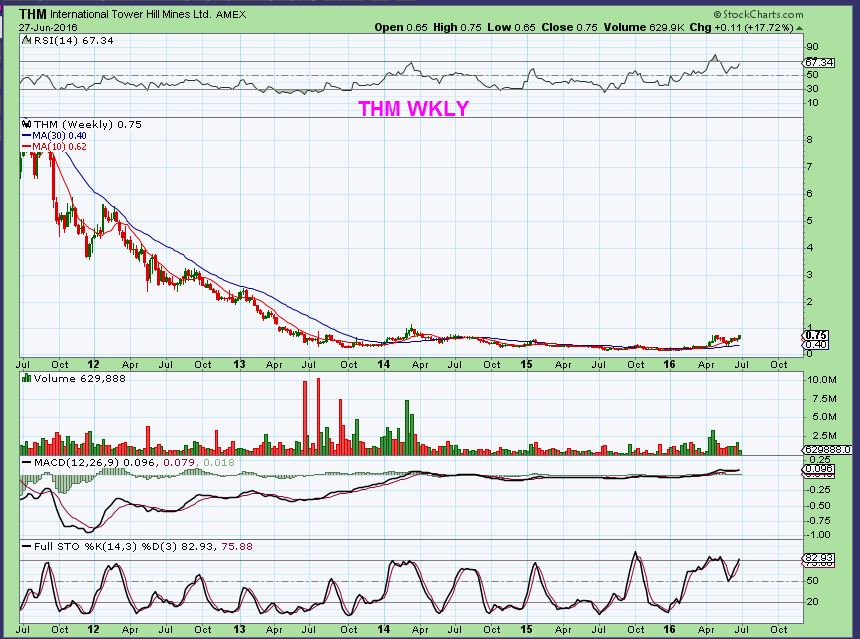
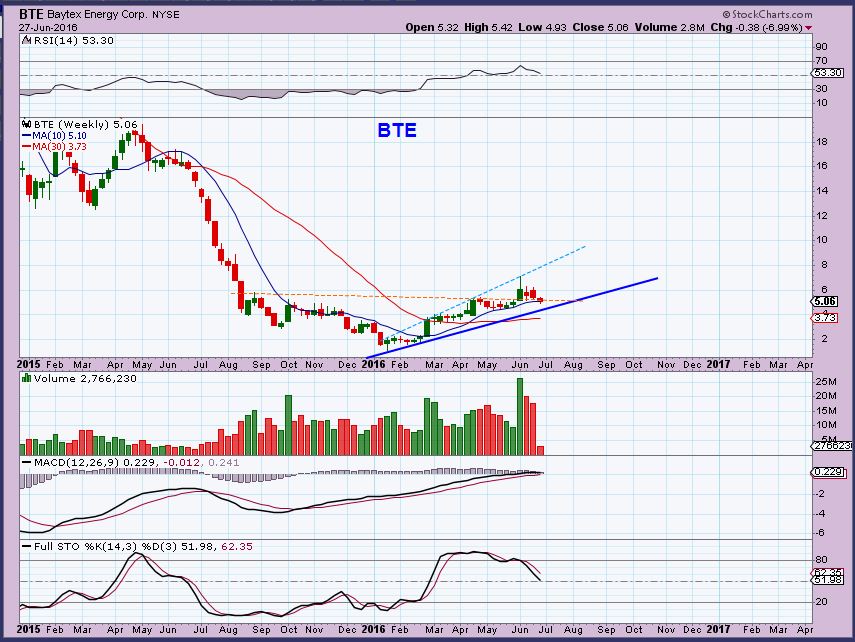
By request: Is this long term still healthy. Long term it is, and could go much higher, but if Oil pulls back, you may get a dip here too. Go back up & look at TAHO. It dipped $14.50 to $11.50 during Golds drop into the ICL 4 weeks ago. NOT AN EASY RIDE real time, but TAHO has recovered in Golds recent run. If Oil gets to $60, I would expect CWEI, BTE, OAS, WRX, etc to do well. Short term? Tough ride.
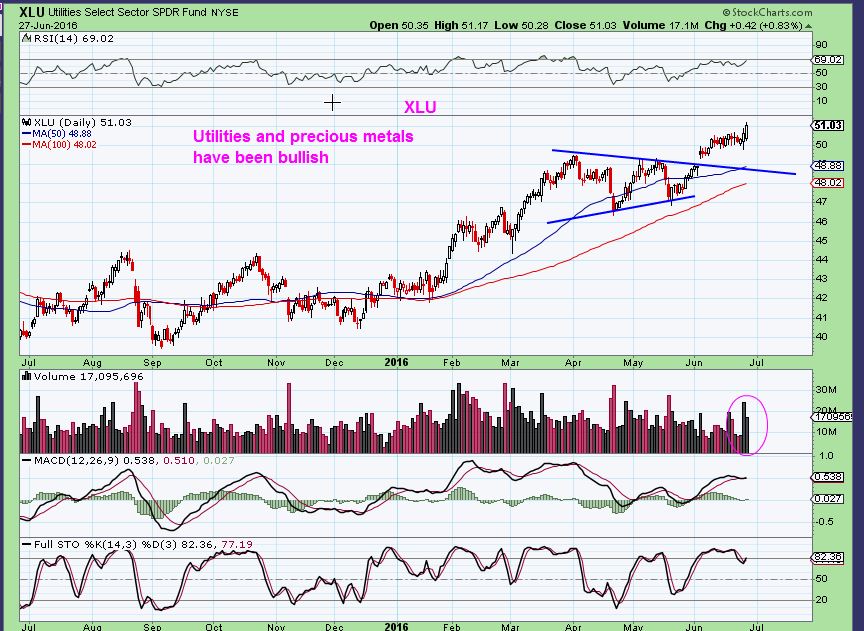
MINERS AND XLU have been the bullish areas
So that is a wrap for Mondays trading. We can get an oversold bounce, but it might be an opportunity to lighten up in areas that you are heavily invested in that may not be acting correctly. With inflation possibly picking up, I still like the longer term picture for Commodities, but they tend to follow the markets at times, and Brexit scared the markets globally. COPPER and STEEL actually still look good to me. Friday and Monday are not enough time to say exactly how things will play out, but the picture gets clearer as explained above.
Thanks for being here, I’m sure that Tuesday will add another piece to the puzzle and help us moving forward, but for now, I really like the Precious metals sector as it comes out of its ICL.
.
~ALEX
.
I actually planned on showing longer term bullish weekly charts of IPI, POT, MOS, MON AGU in the weekend report. They were not affected Friday in the sell off, and I liked the weekly charts. I ran out of time, so I was going to discuss them today too, but Monday they got sucked into the selling a bit. Now I’ll have to see how they move Tuesday and put them in the next report.

Dear Alex,
Have a nice day
I am really a fan of your style of bold predictions and cautious (when required) updates. So my personal experience you never allowed me to burnt my finger. Instead gave clear warnings (esp. for LABU) and emerging trends. Initially i was thinking that missing boat in the miners space. But slowly picked up your jewells (AUMN, TGD, TRX, BTG, SAND, BAA).
I really missed one (VGZ, GSS) till now i am unable to buy from my broker account (Singapore).
i had some position in shipping (SALT, EGLE) if possible please let me know the long term prospects.
In the financials, help to know the prospects of CCCR.
Hi Siva – You’re in Singapore, very nice.
I like the Miners that you have, I have positions in those too ( Except for BAA, I didnt re-buy that one yet, but I like it).
I traded some shippers and started to think that they could break out from their bases. I liked SBLK, TOO, TNK, NM, and SB I figured that stockpiling Oil would give them some business, but I know that many are heavily in debt and business is hurting. Now that Oil is flowing, I dont really like the sector as much. They still look to be in bases, but I dont see the strength at this time.
I hope that helps
Dear Alex
Thanks for your updates. Earlier you provide watch list of all the shippers I did not follow through. Some of the recommended stocks are too extended now like TOO. I will monitor to lighten the position during any bounce.
Yes Siva,
I looked at TOO & SBLK, they were 2 tht I really liked in the spring.. Both broke down through the 50sma, and then bounced and tagged it on the way up, but could NOT get back above again. That can be bearish, and calling for more drop. SO – we can watch to see how it pulls back, and if it is heavy selling, it might show that buyers are lightening up in other shippers too.
to me – I think those 2 charts are saying that no one is buying shippers after the pull back, even the ones that acted strong.
Thanks Alex, I was really getting interested in LABU at these lows, but I can’t argue with your chart analysis above.
I know Bill
It seemed like it ( XBI or IBB too) may be in a base and at the lows, and really it may be, but I looked at that prior time and see similar things. That sector could give way since it is near lows, if the Markets do sell off into an ICL- and I think they have entered that stage of the game.
MAYBE with a stop, but LABU ( or any 3x etfs) losses swing wide , so a tight stop would possibly be tripped at lows.
NUGT is a crazy moving 3x ETF. We saw a 30% day recently. GUSH moved 15% Yesterday. But ERX and LABU don’t seem to make those big moves. ERX for instance, many of the energy stocks move much quicker.
true on a daily basis, but the gains and losses still add up.
For instance, LABU went from $40 to $22 this month. Cut in 1/2. Then again, some Biotech stocks have been doing that in a day.
13% today was pretty good, but usually 5-6% is a maximum. Did you get in? I think with a stop below yesterday’s low, an entry this morning works. Short term only, really but then of course b/c 3x ETF.
I was in GUSH, ERX, NUGT. I sold GUSH and NUGT later in the day. Just had to go to some cash, I dont think anyone has a clear understanding of where things will be next week.
NUGT is gonna gap higher this morning, too. Yeah, I’m with you, I was adding as we moved higher last 2-3 weeks so when BREXIT hit I was over invested. I’d sold all leverage on miners by Monday. Still have energy stock basket.
I guess we all see what we want to see, a personal bias comes into play. I see the XBI chart and the first consolidation trends up, like a bear flag. Now I look at LABU, and the consolidation is horizontal. We are getting a double, triple, quad bottom. Like that flat basing pattern you like. I suppose if LABU keeps hitting that floor, eventually it could break down further? I think its worth the gamble. I see movement higher, but I am bias due to my holding LABU.
Yes, it is rather unclear at this point, I see both bullish & bearish possibilites. I pointed out what I did as a cautionary note, because I know that many here trade LABU. I just wanted to point it out for traders to keep it in mind.
Alex, and we appreciate you giving your input. Its valuable even if its not aligned with mine, makes me reevaluate!
Alex, I’m going with this for now. I’ll watch for a pullback as you pointed out above. Certainly LABU won’t uptrend if the general markets are falling.
https://www.tradingview.com/chart/LABU/JMjFivVm-LABU/
Dear All,
Osisko Gold Royalties expect to trade in NYSE from 6 July using the ticker “OS”.
Alex, please help to cover this miner in subsequent report. Thanks a lot.
Most of my miners are starting down around 1% (so far), except SAND. Sand gapped down 7% & I dont see any news, but it almost looks like it did a public offering or something.
I do see about 10 miners that are green ( GPL, TRQ, EGI, NSU, etc for example).
You are correct on SAND :http://www.reuters.com/article/idUSFWN19J0O5
BRIEF-Sandstorm Gold says underwriters to buy 1.2 mln common shares at $4.45/common share
Diluted again. Bummer when that happens. I believe that’s what killed LGCY’s preformance.
Dirty Dogs.
Thanks Tiger 5, I couldnt find it ( And nice to see you again. been a long time!).
They do it to raise money and should be fine in the long run, but it instantly drops the price down to the offering price.
Actually , chart-wise, it’s still above the 20sma at this point.
I’ve been very busy (isn’t everyone nowadays 🙂 ). Enjoy your reports and all you do for us! You have built a very nice community here.
Thx T-5
I’ve known you in the trading community for years! Nice to hear from you again 🙂
Ya, instantly drops then just consolidates or trends down. Look at LGCY.
agree for the most part. Some do recover quicker than others though, and it probably depends on the size of the offering and the point of a run that it happens in.
With LGCY, that had run up 300%+ , so maybe that is part of the lack of quick recovery.
I owned RBY when they did it at the top of a nice run, and it got slammed and took forever to recover too.
With SAND, it may be different, since it is earlier in an intermediate Gold cycle and SAND was breaking out.
I’m holding my position for now to see if it can still break out. I will POST in my report if I sell and go elsewhere, since I have really been bullish on SND, BTG, ( MUX and VGZ which I have now sold).
I’ve deleted LGCY from my watch list.
Me Too!
Mighty powerful bounce for oils this morning – only sold one off yesterday
You mean ‘bounce’ like GBR? or NADL 🙂
wow, and NADL – I haven’t been able to crack the code of these high beta stocks – and then when they scream higher, issuing a secondary financing seems to be the order of the day.
Yes, to pay off debt or make money to increase production, etc.
I kind of hate that unknown, but thats when basket is better than a position that is way too heavy.
I am kind of heavy in SAND, since I’ve been adding on the way up, and they just did a secondary .
Excellent reports as usual, Alex. Is uranium in the same camp as the rest of the commodities? Holding DNN at b/e but looking to swap it for a gold miner if that’s the best game in town. Thanks!
Hi Ryan,
The uraniums are a tricky read here. They blow up off the lows with great volume ( some could be short covering) , and then drift back down. I think they are trying to break free from their bases though.
DNN is better, making higher lows. So I guess the question is, if the markets continue down after a bounce, and look for an ICL, will Uranium follow? Since Uranium is bottoming and forming bases and actually breaking out of the bases, they may get caught in the selling a bit, but maybe not as much.
Rather vague, I know, but I really cant be sure at this point. They are a tough read.
Thanks Alex. I will be watching to see if this morning’s bounce has follow through for the rest of the day and decide later on this afternoon.
Alex – just looking at TRQ and it seems to have a different character than some of the other miners. It was down 3 out of the last 4 days and then bounced off the 22 ema – interesting take off from yesterdays conversation about which moving average to use. This one will be free of any significant overhead before too long. Is this a decent risk/reward opportunity in your eyes?
Yes,
I actually had this in the reports a couple of weeks ago. It was breaking out from a 2 month consolidation.
Yesterday actually looks like a back test of the break out, and by the end of the week, it may be a back test and reversal.
I do like it
good, back in the game – I still have a big SIL position too so now exactly like I totally lost my way
I own TRQ also, good FA. Its a buy and hold for me.
Sounds good, I’ll add to my watchlist, thanks.
Hey Alex – what do you think of the Vale and SID charts right now? CRB has turned back up and I’m thinking they might look ok but wasn’t sure cycle wise what might be in store – your thoughts? Thanks!
I was just looking at those too.
I didnt like X, AKS, CENX, and AA so much (yet), but SID, VALE, CLF, CLD, do look pretty good for now.
Some , like VALE for example, look like they are going to have good volume as they move higher too.
I’m not jumping in at this point- but I do see signs of improvement
I have just a little of both SID and VALE both slightly green, so have been wondering if I should go ahead and sell to just wait out this BREXIT thing a little longer to see what might come to pass….these both were hit when BREXIT first happened, so wondering how they might fair in the short term – if I sell they will go up – ha!
I think that the markets may just be putting in a light volume weak bounce, but when I look at a chart of SID & VALE
SID – that was a light volume 2 day drop at Brexit that wasnt really a big drop ( on the chart, I know that when you hold it, it always feels like a bummer,but he chart looks kind of good).
VALE – vale dropped a bit more quickly Fri & Mon, but today has made up 1/2 of the losses, and I like the volume today too.
Look at a chart of the SPX and NASDAQ ( $compq in stockcharts) and look at a chart of SID & VALE.
They do not look the same in that sell off. Markets got clocked, VALE & SID dropped a bit.
Silver recovered so far (green).
Some of those Silver stocks are still at highs.
AG, CDE, SSRI,
PAAS, EXK, GPL , PAAS, and more may be consolidating for a run higher
I AM GOING TO GO AHEAD AND SELL 1/2 of my SAND with the recent public offering.
I am just wondering if there is more upside in one that is consolidating and may be ready to go, but I may not buy today, I may wait for the next dcl, if that was a 1/2 cycle low that we just saw.
I own a basket of Miners – SAND, BTG, XRA, GPL, TRX, TGD, AUMN.
I will mention this in the report tonight, in case some do not read the comments section daily.
ALEX….. They bought 1.2 mln common shares at $4.45 while the stock price is already around 4.40. Or do I see this wrong?
THANKS A LOT ALEX>>>>
They made the deal when the stock was higher, so by taking that deal, the price dropped to where they bought it,
It’s not so bad when you look at the chart. It’s not like they wanted it super cheap. The stock made new highs at 44.92, and they were willing to buy a lot for $4.45 – that means that they expect it to still go higher with the Gold run. It means they were willing to pay last weeks price, that is where we are
Alex, I am just now getting around to thanking you. Brenda and I had a 48% profit Monday in VGZ. We couldn’t have done that without you. Now we can’t get back in but that’s a good problem. Thank you !
Great Johhny – Very nice.
I know, I sold and it’ll be a while before I am comfortable buying MUX or VGZ again after a run like that, but hopefully there is always another trade ( XRA?) : )
Alex, did you look at the FA on XRA? Anyone else look at XRA?
Revenue=0
Net Income=(8)
Price/Book=5.4
EPS=(0.09)
Price/Sales=434
Did you look at the chart today 🙂
No Doubt, your record for picking winning picks is excellent (CWEI, VGZ, IPI) ! Just trying to avoid the SAND, LGCY issue where they need to raise more capital.
When I look at that chart, I’m surprised that they didn’t do a secondary after that last run up for maybe 60 cents.
If they do a secondary after the close tonight, I’m blaming you for jinxing it …
By the way LGCY quadrupled in April : )
Ya, I bought LGCY for some of that! Its a FA poor company as well. But I bought it. I think SXE was the other one I owned that tanked on dilution.
yes, SXE did
😉
I knew I should have sold IPI last week, though. She’s been a bit fickle, would be better off taking profits next time they appear!
CF, how does the CWEI chart look to you? Thanks:)
CWEI has been a strong solid chart. It is back up near the highs, near $30 again, but I am a bit concerned about Oil , even after today.
It broke the long term trendline as shown in the report above, and already back tested it without breaking back above it ( That is an intermediate cycles uptrend line) and that indicates that Oil wanted to drop into an ICL over time.
So I do like some of the charts, and long term they should do well, but Oil still concerns me a bit.
Are you thinking this is a dead cat bounce?
It may be for the markets, some of the commodities look ok.
The SPY regained the 200 sma. I want to see how it acts t the 50sma ( back test on light volume is a sell).
QQQ – same thing, but it has the 50 & 200 sma together overhead.
Thanks …. But specifically oil… ? 🙂
OIL – For now, yes, I think so too. It could bounce for a couple of days, so tomorrow may be clearer if volume picked up on the 2nd day of recovery , etc
The reason, That trendline broke, usually that starts a series of bounces with lower highs and lower lows into a DCL.
Here’s my two cents… I think Brexit fears are already calming down, now that the details of how long and complicated that process actually is are coming out. It was those fears that inflated the dollar.
But pre-Brexit the threat of a fed interest rate is what popped the dollar. As the Brexit news fades, and the reality that an interest rate hike is nowhere in the cards sinks in, the dollar may go back to its slide.,,,,
(I know you said not to take “stock” in theory and let the charts speak 🙂 but I can’t resist looking for the “story” behind the charts 🙂
Actually, I agree with that Crystal ( The theory on why Oil dropped on brexit I didnt care about, because I didn’t see anyone call it ahead of time and give a good reason why).
I did mention before the vote that I didn’t think the vote would have a big affect, because even a yes vote would take a while to implement.
I WAS WRONG on the “it shouldn’t affect things much’ part, WAY WRONG on that knee jerk reaction…..but now I think that people are seeing that it is going to take a while, things can still interfere, etc etc .
Now I have to see how it shows up in the charts, because it always does. reality eventually prevails 🙂
This morning oil and gold are moving together againat the dollar- yeah!
Oil will go up with the market!
The converse William.:)
Converse? Like the sneaker? Compare USOIL to SPX same ups and downs
The markets go up with oil….
Conversely Oil goes up with the markets! I get it!
Hey Crystal… I just saw your question from yesterday
I bought nugt in march and sold may 9… 50%
sorry for the late answer
THM from the report burst through for the break out with huge volume today. Was up 20%, but pulling back now. Could have been a good quick trade, but I missed that one.
XRA looks to be setting up it’s break out pattern too.
Note : Due diligence on a stock and decide if you want the trade.
SSRI almost new 2016 highs today
GORO = interesting set up too
IAG – broke out now closing the gap
Pennant forming on the NUGT 15 min chart. Which way will it break? Refresh
I would say ‘surprises to the upside’, but that gap below it makes it a tougher call.
I look at all information I have and say…. it will go up BILL AND ALEX!!!!!!
Hiep… Piep…… Hoerraaaa. !!!!!
LOL
Alex, take a look at URG bouncing off the 50day. What do you think?
Looks pretty good ( I do tend to consider it a higher risk stock right now , only because the entire sector isn’t acting the same bullishness. If all Uraniums were setting up, I get more bullish).
URG has the 200 and 50 sma right below price now, as you mentined, so that could be a good place for a stop if you entered.
the volume is weak, but it can increase on the way up if it is going higher.
Alex,
If you wouldn’t mind, in a future report could you mention any long-term implications, if any, that today’s SAND surprise will have?
Thanks.
Rob
I will tonight. Briefly –
I think it is long term very bullish, they did a secondary, and the buyer was willing to buy it for last weeks price.
usually they try to bargain for a price a lot lower
This means that they expect price of their investment at $4.45 to be higher .
No one invests in a chunk of something that they think will be worth less. : )
This appears to be a 9.34% dilution – and the stock is down 11%.
Alex, I was looking back for big $GOLD daily candles. I found one on 9-17-2008. Gold moved from 781 to 872 that day. Afterwards $GOLD consolidated above (or near) the top of that candle for the next three weeks before it dropped off. I was interested to try and see where this abrupt move will land $GOLD from here.
Hi Johnny, nice to see you doing some homework /research. Good job 🙂
Off of the top of my head, I know that the crash of 2008 bottomed Oct 2008, so that date you gave me was before the crash.
( OK, I just looked it up) I dont think it really applies under current bullish conditions. The 50sma had just crossed below the 200sma and was turning down rapidly then.
We currently have the exact opposite. Time will tell, but i like the research you did