
Pre-Fed Syndrome Again
Monday we saw a little more selling in the general markets as we approach the Fed meeting Wednesday. I have been bullish for a possible break out to new highs, but recent action is less bullish and it may be that we wont know for sure until after Fed Wednesday. Tuesday may also be a little bit boring ahead of the Fed.
.
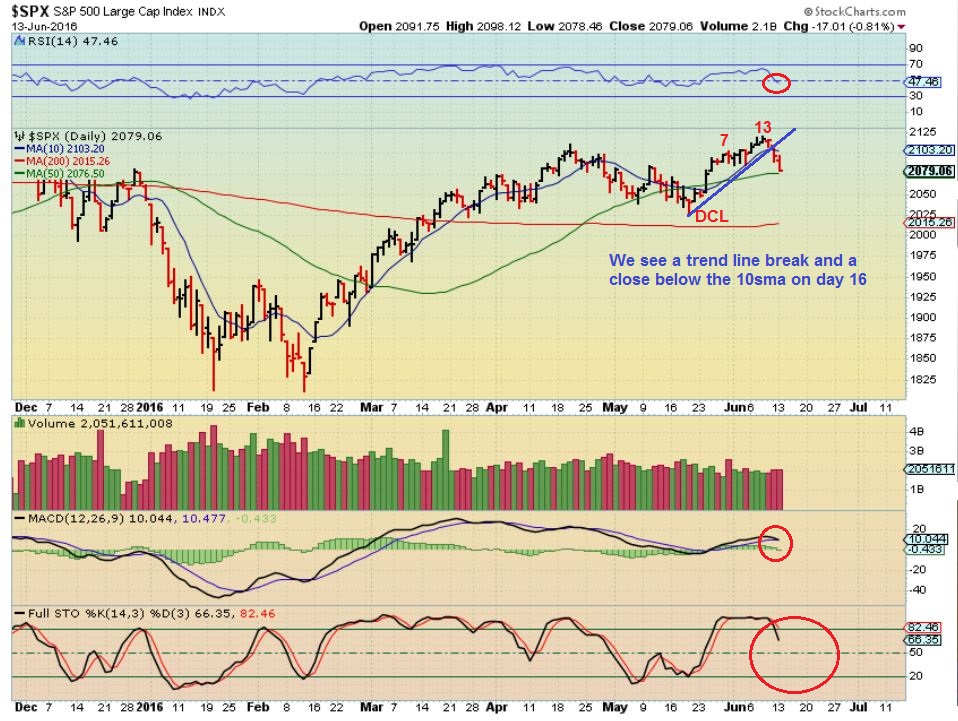
The SPX – This looks a bit better than the DOW, NASDAQ, And BKX at a glance, but notice that it looks to be dipping into a daily cycle low. MAYBE the Fed Wed decision will hold it at the 50sma and set a new trend line, but right now, this warrants caution.
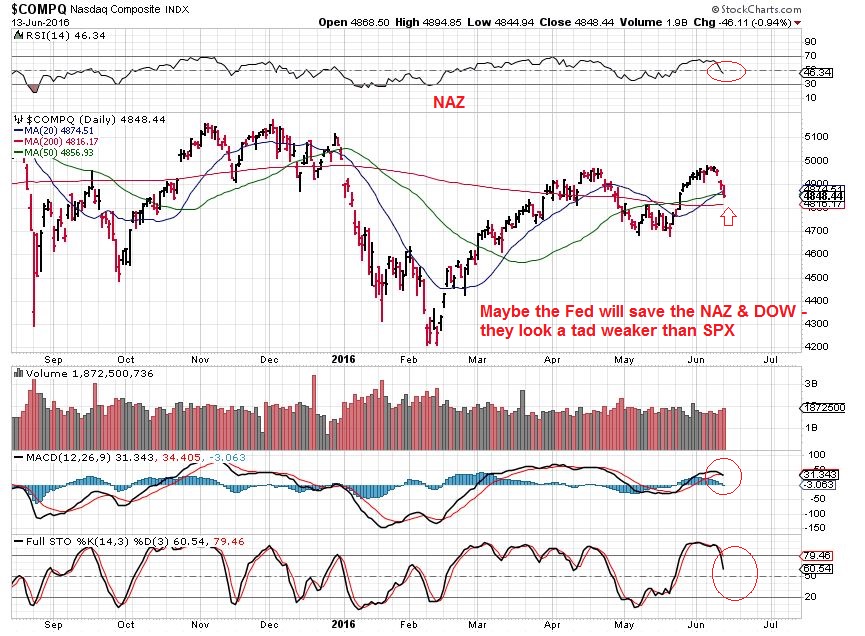
The NASDAQ is a tad weaker
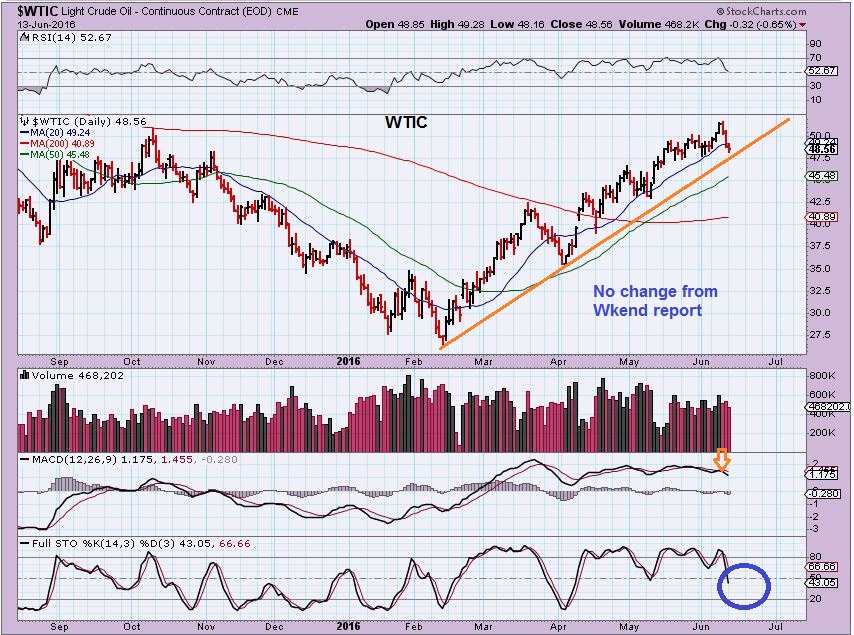
WTIC – As expected
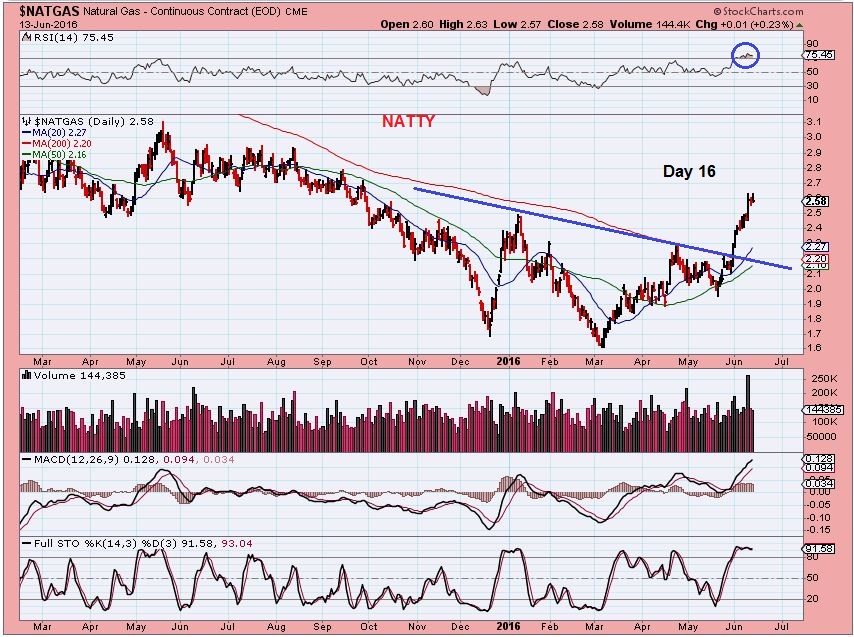
NATGAS – Natgas is strong and had a $2.70 target, but timing calls for a dip soon. Support may land on the 200sma/ trend line.
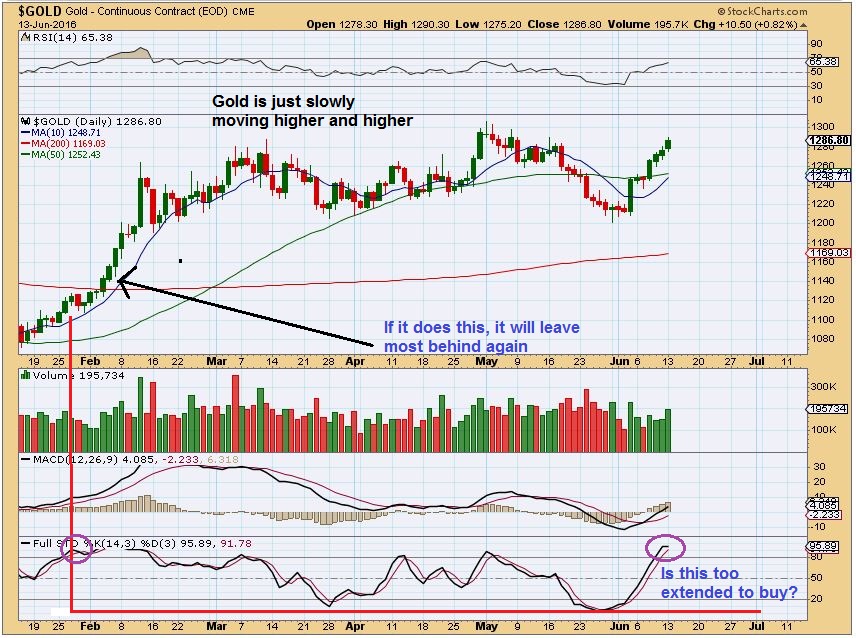
GOLD – Gold is just continuing higher out of what I suspected was the ICL. In the weekend report I mentioned 2 scenarios. A constant drift higher that leaves everyone behind ( The FED MTG would cause a break out to new highs). Or the Fed Mtg drops Gold to the 50sma could give us a an inverse H&S ( Not drawn).
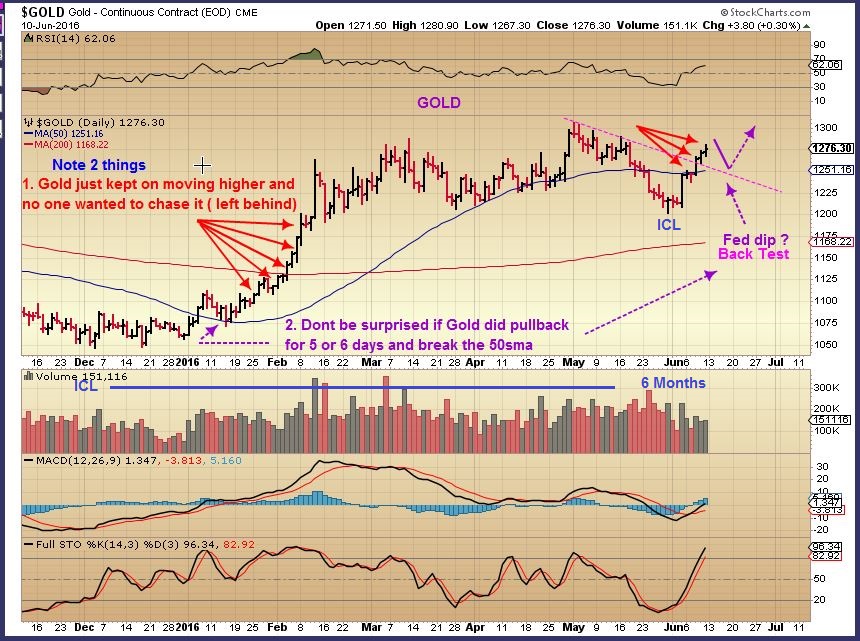
From the wkend report , the 2 scenarios mentioned above
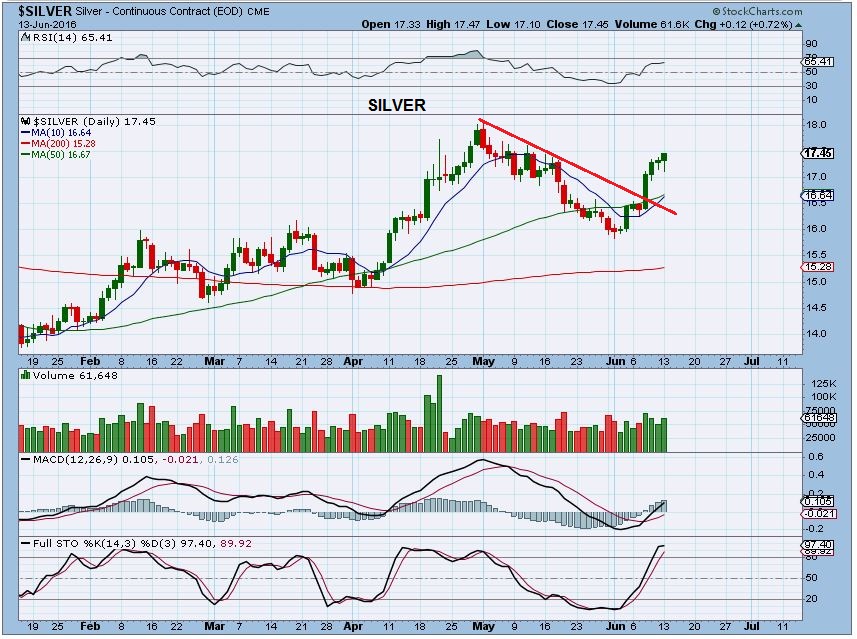
Also drifting higher, but Silver has visible divergence as it nears the highs. I dont worry about this early in an ICL, as I have mentioned before.
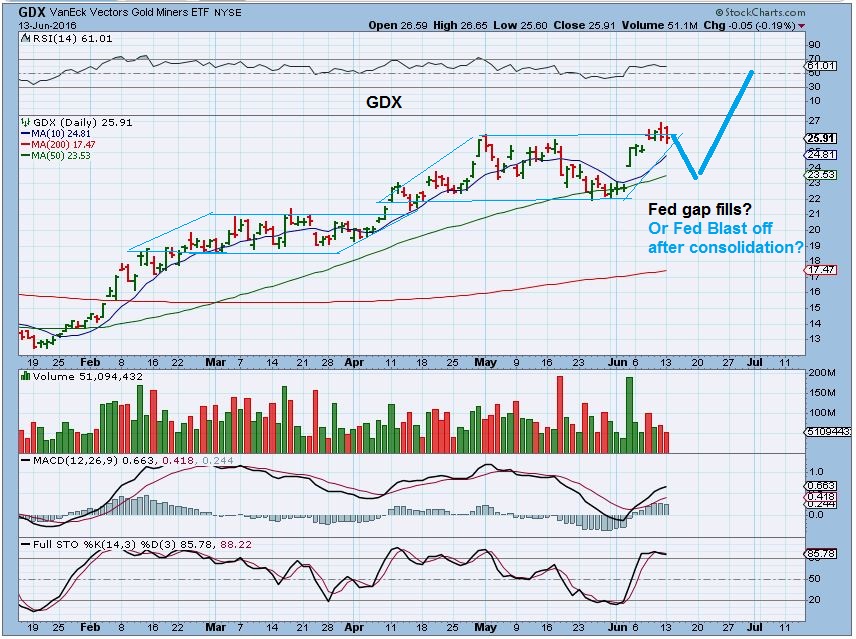
GDX – Miners were so strong in the Jan – May run, that I have a feeling they will be tricky to play at a time when they should be bullish. After such an extended run.,Volatility could very well pop up, with the Fed Mtg and the Brexit vote coming up. Let me say here that I do not think that the 1st gap at $23 has to fill.
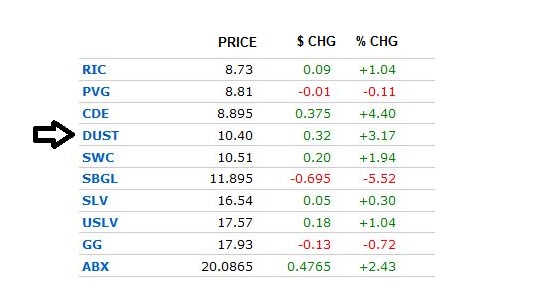
This is what you see in volatile markets. Some Miners were up 8-10% today, some up 3 & 4%, DUST was up 3% at the same time, some were down 5%.
Tricky BULL 
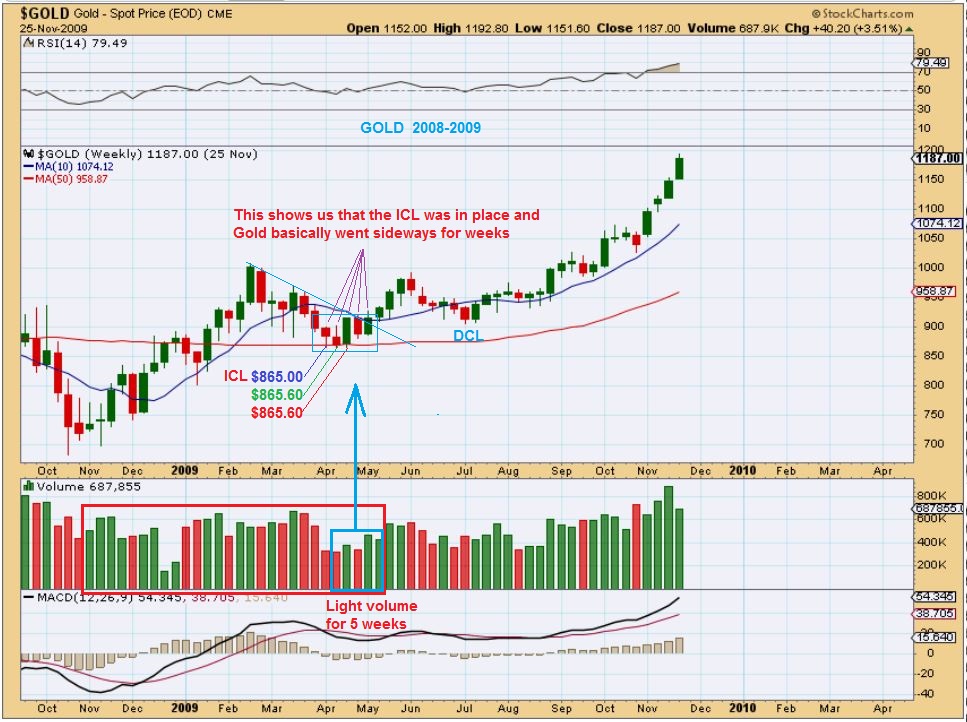
Going back to 2009 is important as we approach the FED MTG & BREXIT. 2009 ICL was also volatile, it was not easy.
.
This is the GOLD WKLY CHART 2009s ICL – 3-5 weeks at or near lows
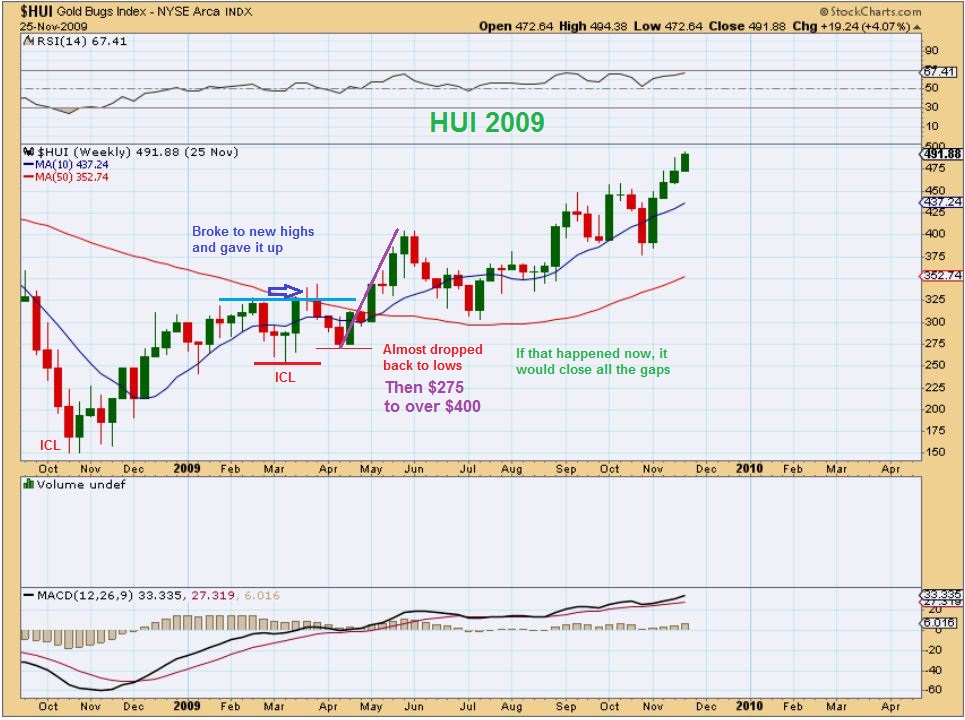
HUI 2009 ICL – 5-6 Months after the first ICL. Notice that Miners took off (like now) in March, and in April almost dropped back to lows but didnt break them. THEN the HUI ran from $275 to $400. A move like that due to BREXIT would fill both of the gaps of the GDX chart above. I personally do NOT think the first gap in GDX will fill.
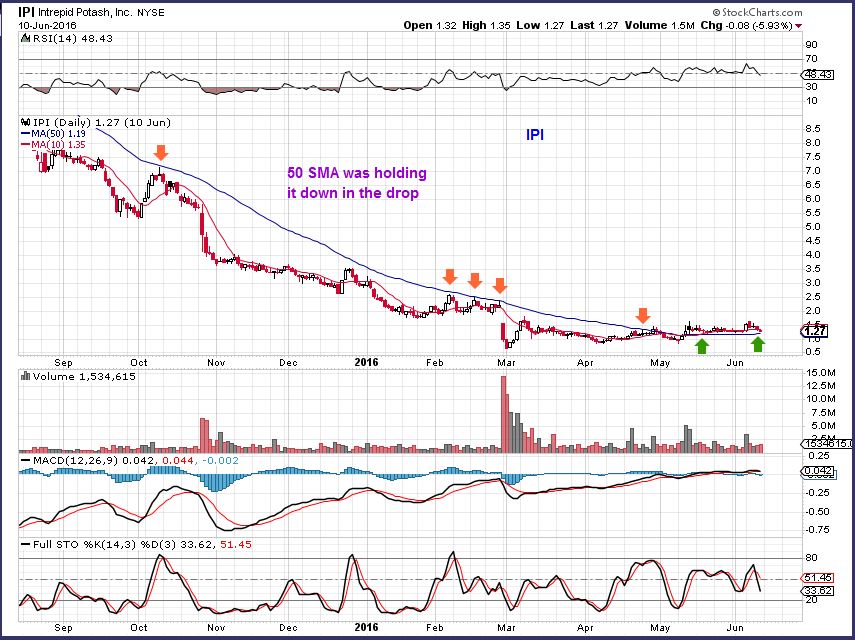
I got some mail for IPI . A few HATED IPI after last week, one person saying it a the worst trade of last week ( you know who you are 🙂 ). Guess what? It was actually basically break even last week. It ran up and back Monday to Friday.
.
So I drew this chart for another reader ( I had just received a kind request from him Monday a.m. to see if it was still ok) , and then it ran up Monday 18% and everyone loves it again. Wait till Friday, it may be back at $1.27!
Miners Ideas and thoughts
I had been mentioning for the past 2 weeks that you may want to add to your Miners if you didn’t have any, and then with the Fed Mtg Wed, we may see a reaction one way or the other. Some may or may not want to buy Miners the day before that meeting, but I wanted to point out some thoughts on Miners here.
Depending on what kind of a trader you are (some just cannot stand to ride the ups & downs of a consolidation), you can decide to add a position or wait. Others have already started buying some miners ( And hold a core).
.
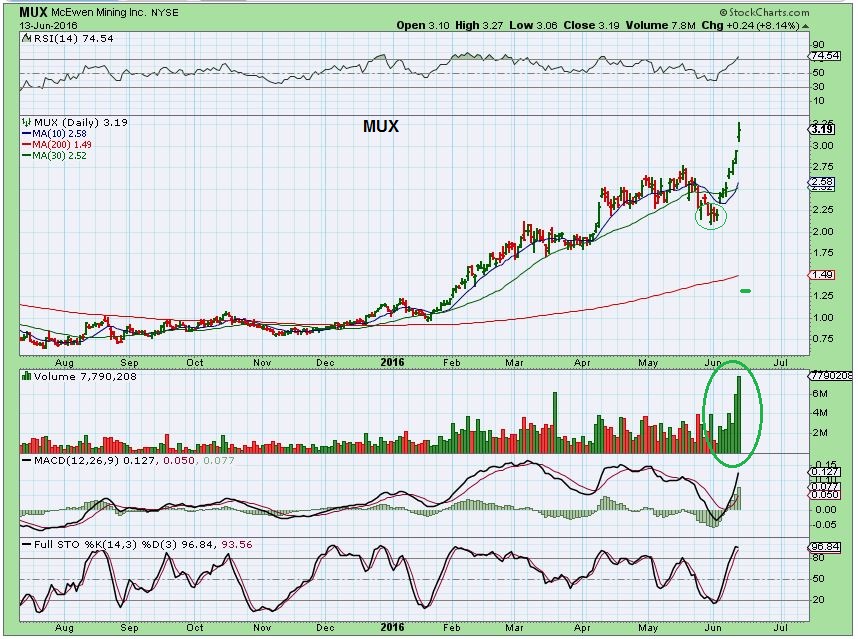
MUX WEEKLY– I’m using this to again show that Long Tight Bases can lead to explosive moves.
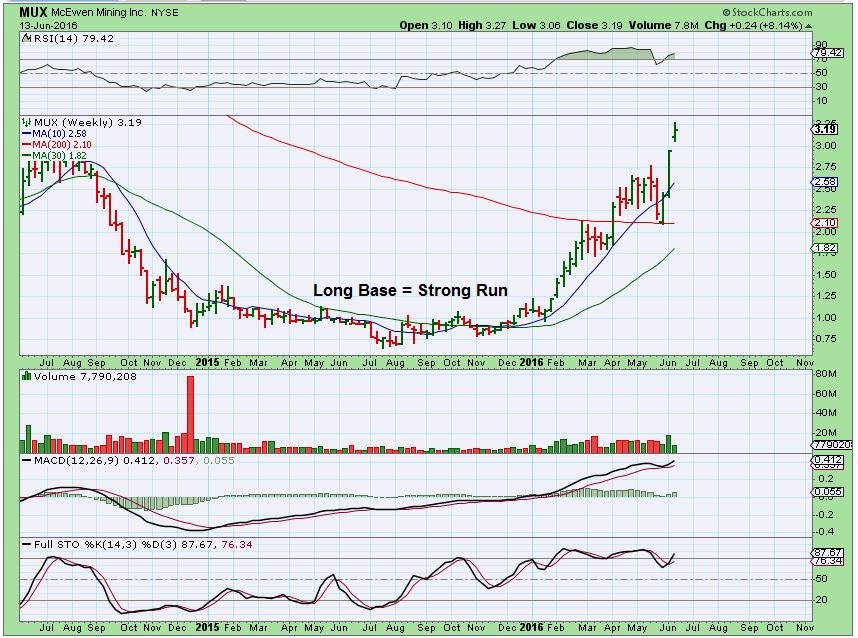
MUX started moving up and I mentioned this one over a week ago as a Miner that looked to be preparing to break out again. This is, of course, is overextended now. If you didn’t buy it yet, You could look to buy a pull back after a possible Fed reaction, and also we could look for similar ideas.
So- VGZ is a long tight Base, and is breaking out again.
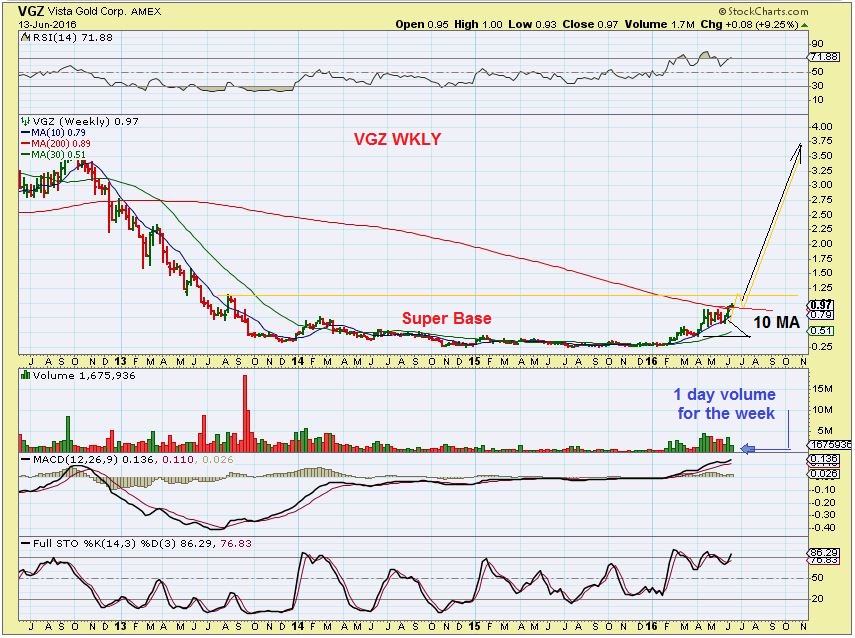
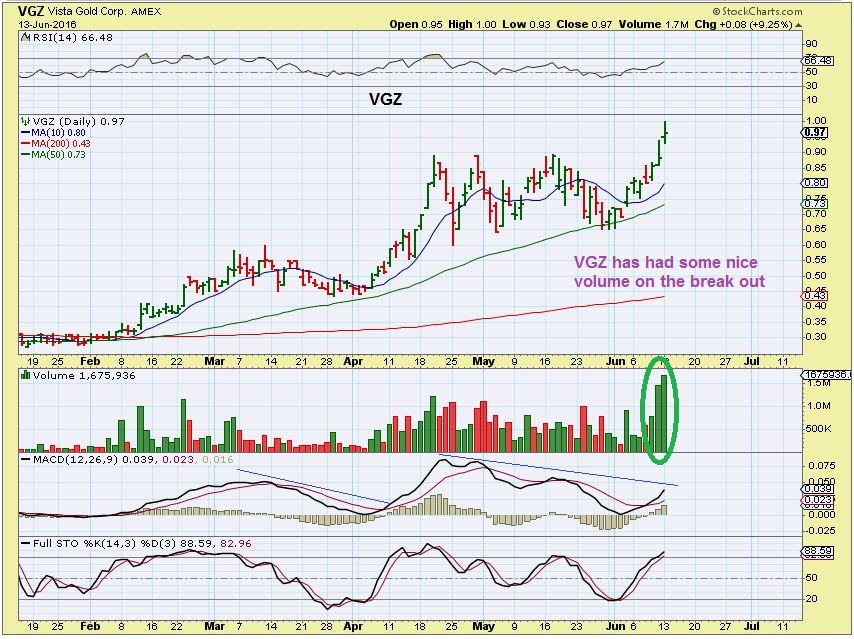
VGZ close up – VGZ is currently attempting to break out, and this is when they often run higher and then drop & test that break out. One idea would be to buy a pullback if we get a Fed Reaction. Again, I love that Base shown above.
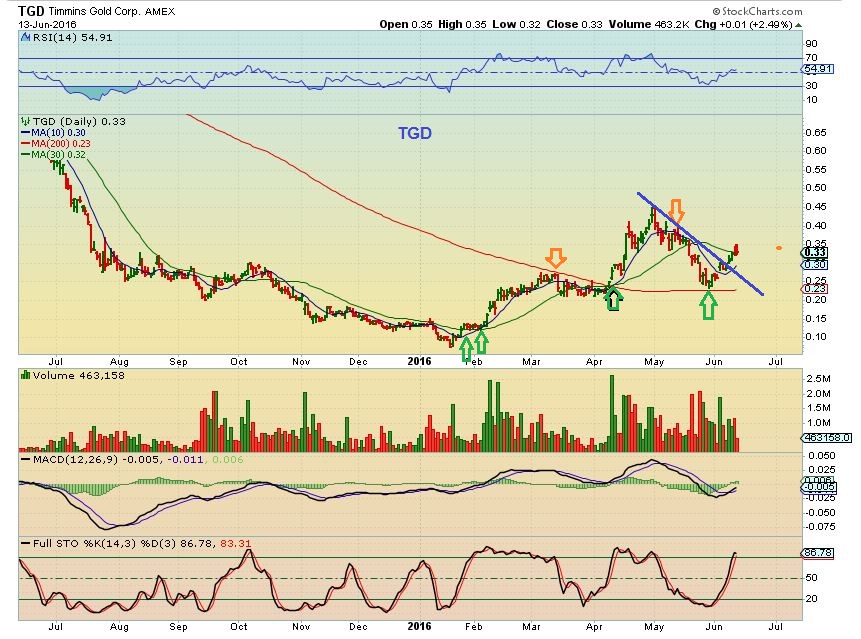
TGD has been mentioned here as a buy on the pull backs because of the base. Lets zoom in.
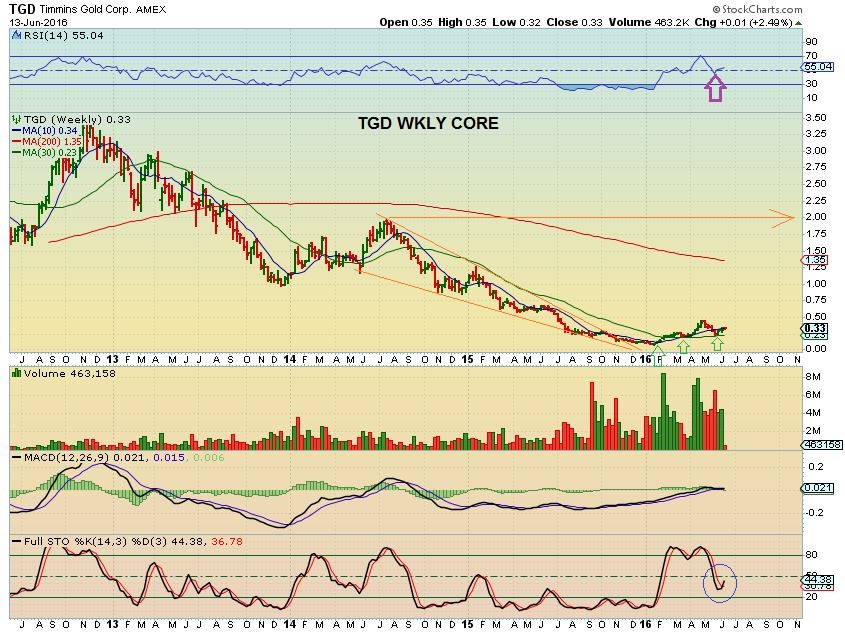
TGD – It also looks like it dropped to the 200sma and is now moving higher, preparing for its next run higher – possible break out again.
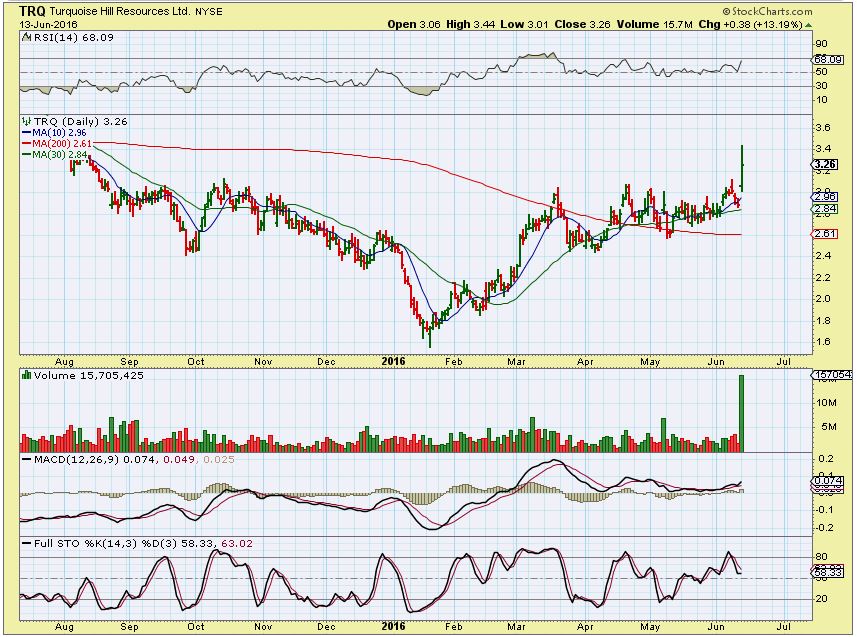
TRQ – This is interesting action and I couldn’t find any news on it. I view it as a high volume break out, even though price didn’t hold the highs. It looks to be a long inverse H&S.
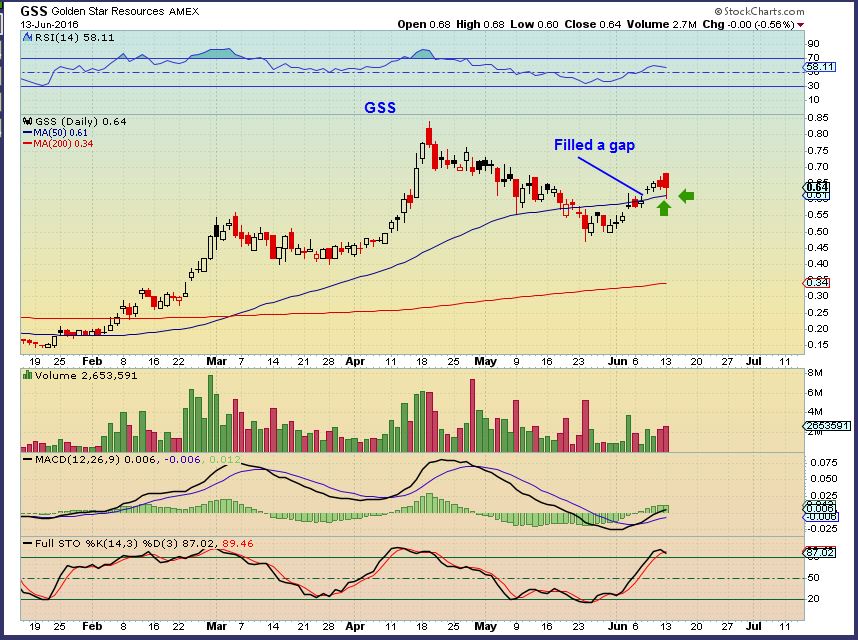
GSS – This one has moved nicely out of the base and could easily move back to $2 over time.
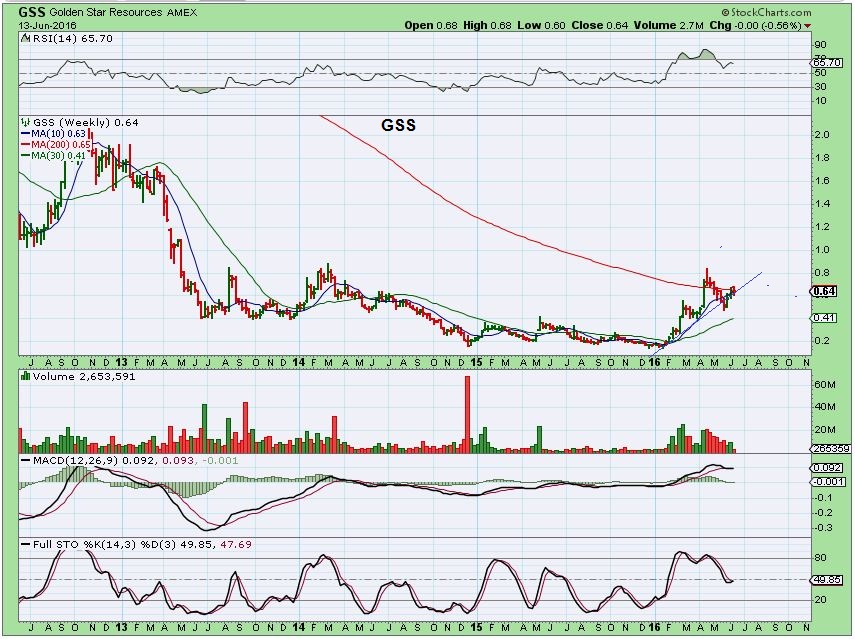
GSS DAILY – It filled a Gap Monday as it bounced off of the 50sma. Low risk entry? It is difficult to recommend buying it the day before the Fed Decision, but I do not expect a rate increase.
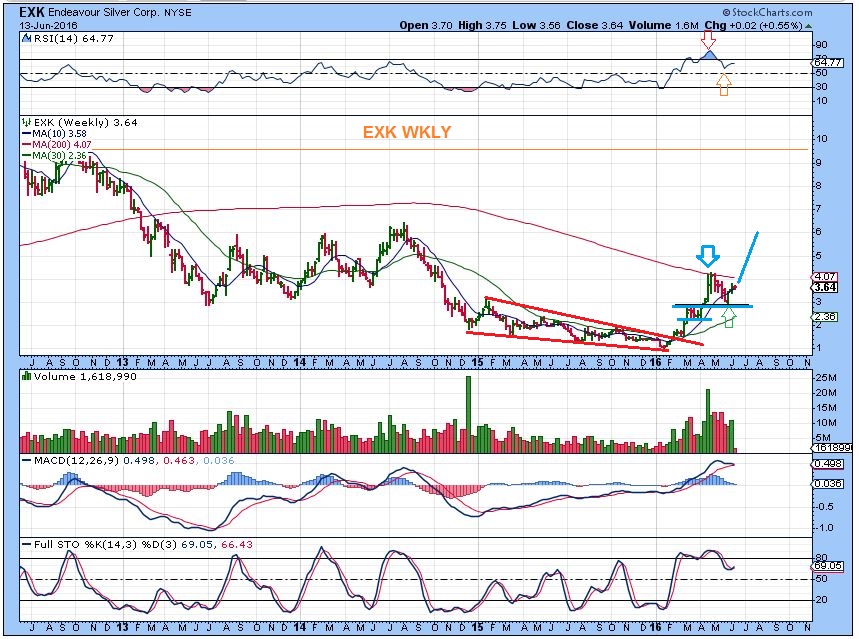
EXK WKLY – When you look at Silver stocks, you can see that they ran very strongly. AG, CDE, PAAS, FSM, etc all near highs. EXK struggled at the 200ma weekly. If it breaks out on this next run, it has great potential.
Back to the BASES.
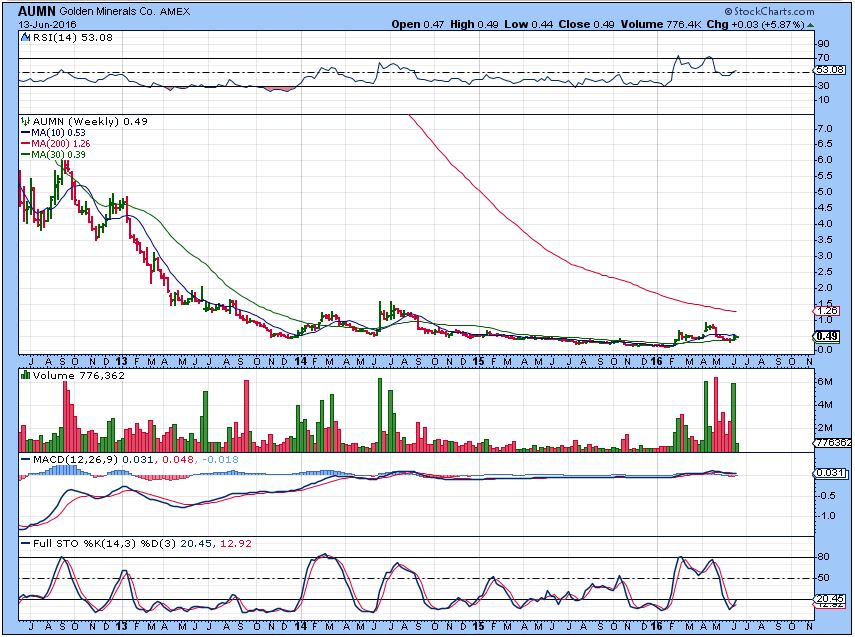
AUMN– I call this the widow-maker for a reason. Trading it can kill you if you are not catching it at the right time. It moves like a 3xETF. It does have a Long base, and it started to break out on the last run, but gave up the gains. It may eventually start to break higher again now that (I believe) The ICL is in place.
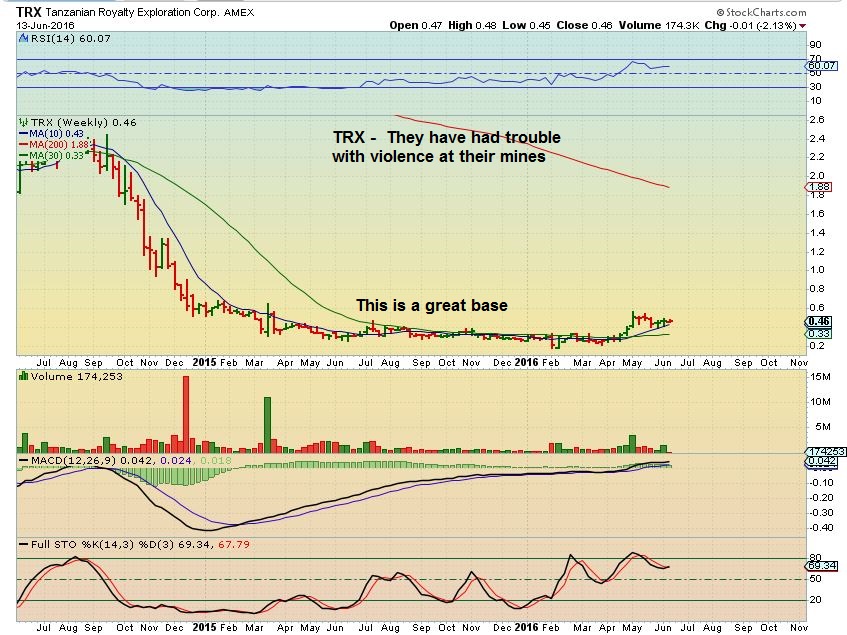
TRX – This is a great looking base. I have been following TRX and they have had some trouble with their Mines that appears to be getting resolved. I am hoping that they resolve those issues, because this set up looks great. Even with the troubles that they had, it tripled and pulled back.
So for now, these are just a few of the ideas out there, but as I mentioned, it is going to be tricky. We have a Fed Mtg that may or may not affect Gold. I have recommended taking positions in past reports, start small if you cannot stand the volatility. The BREXIT vote is next week on the 23rd. I believe the ICL for Gold is in place and Gold has been slowly moving higher day after day. There are many scenarios that could play out, but lets mention 2 possibilities within those 2 events.
-
The Fed Decision release blasts Gold into a break out, and it pulls back late next week after the Brexit vote.
-
Gold has been running out of the recent lows already. That could continue Today and Wednesday and then we could see Gold pull back after the Fed Mtg and form a cup/ handle into Brexit and then take off again after that vote.
Those are only 2 of a few ideas, and who can know really? I have been saying that my research indicates that Golds next ICL is in place and should lead to higher prices over the next few months. So far, that has been right on track, the tricky part is trying to ride the consolidations in Miners without getting too emotional. It is still early in the Move higher, so there will be future trade set ups, there will always be another trade. If you have been waiting until after the Fed Release to do any buying, we are almost there 🙂
.
~ALEX


Thanks for all the interesting gold setups…… Drool 🙂
There are more, I forgot to mention that XRA looks to be starting a move higher, and then when you zoom back on a weekly, you get a nice base that has formed also.
And as a reminder – Some have really doubled, tripled, quadrupled already, and some are lagging a bit more ( TRX, VGZ, AUMN, etc – and there could be a reason for this, so due diligence may be necessary. I did find info on TRX about the locals trying to use force to take over their mining and they have had to try to fight back.
BWEN is breaking out today, or so it seems…:)
Yes, nice gap fill and flag formation so far
IPI may be finally breaking free from that base too ( And VGZ )
Finally the “goat” is getting better. By the way, I was the one who asked for an update on IPI….unless you got a kind request from a “him” as well as me!
Hi Nancy-
Yes, actually I got a few requests when IPI went below $1.30 , the one that I was talking about was by email Sunday night or Monday early and I sent that chart to him. It took off nicely yesterday and is breaking out today. I hope everyone held on, the chart in the report does show that it never went below the 50sma
OK thanks.
Dear Alex,
Have a nice day
I am unable to trade GSS & VGZ. Is it trade under NYSE or AMEX?
Yes, Look up GOLDEN STAR RESOURCES AND VISTA GOLD – they trade on other exchanges too
CA:GSC Canadian CA: VGZ
Dear Alex,
Thanks for your prompt response. Quite strange i am unable to trade it keep prompts invalid stock code. But i can search it shows … since last week i am unable to buy Vista gold … it keeps going up…
Are you using Canadian stock exchange Siva? And yes, VGZ looks similar to MUX
Dear Alex,
Have a nice day
I am from Singapore. For me it is night over here … exactly 12 hr difference.
It is quite funny, my watch list it displays (GSS, VGZ) with latest price. Also, upon search it displays with company name listed under AMEX, but cannot trade. I will follow up with the broker.
Pls help to provide update on NAK, XPL both are junior minors.
Thanks
Both NAK and XPL have not shown strength lately, and since NAK is below the 50 & 200 sma, I would not recommend buying NAK until it improves
XPL is above the 200 and 50sma , so that is good, but it is inside of a long base and it also has really light volume. It may not break out until more buyers become interested in it.
If you own them, just keep an eye on NAK – you dont want it to drop too much more from here or it may go back down to the lows.
Dear Alex
Have a nice day
Noted, thanks for your updates. Sure i will keep watch this positions. I got the positions some time back… but not much of move. Sure, i will follow up cautiously,
And get some sleep too , if you can : ) IT’s late over there
The USD is up .33 and Gold just continues higher despite the rise in the USD.
It will be interesting to see if GOLD is just going to move to former highs of May and then break out with the FED, or just reach former highs and pull back, maybe form a handle.
If we just got a strong break out, many that did not want to chase the move are in danger of being locked out.
Glad u r ok CF i seriously turned on the worry button last nite… :-/
… tx 4 another great update &watchlist..this look familiar? Lol last yr at this time it was ‘thinking outside the box’
…hard to lv this balcony for conference …. lets see.. lake,beach,mountains…???
hmmmmm
That was a year ago already? Yes, I remember you took that pic of chartfreak at the lake : ) I’d love to be there right now.
…yea..can u believe it?
#LoyalCFette
Get down there in a kayak!
Hi Alex, good report. I’m thinking there’s an interesting entry point sometime soon for the biotech sector, charts for XBI, IBB and LABU look interesting. Maybe buy a breakout above the 50 SMA? Any thoughts you may like to share are appreciated.
Yeah, I cant tell at this point, until the selling stops. The regaining the 50 would offer a sign of strength anyway
LOOK AT GSS TODAY.
That was a pretty big drop and it filled both gaps all the way down to 56 cents and returned higher regaining the 50sma. and currently back at 63 cents. Very big drop & recovery.
That might be a nice buy if price holds above that 50sma- since it was bought back up after filling both gaps.
silver… very cool https://www.tradingview.com/x/iPYcozQd/
*still on balcony..lol
Certainly has gotten more interesting quickly. I don’t know about you but I’m anything but bored! Lunchtime smack-down. The market/manipulators know how to get the most bang out of their shorts.
True True Edward.
Volumes ( SPY for example) are not exactly light for only 2 hrs of trading. SPX Breaking down below the 50sma.
I noticed it in the charts and mentioned it today. The General markets look a tad weaker than expected, we’ll see what the Fed decision does, but Europes markets aren’t sitting pretty either.
I bought EXK in early June and had to dump it today. Certainly not acting like my MUX & VGZ, it broke below the 50sma and may be heading down to fill the next gap.
Still think this is a ICL?
Nothing has changed
Gold yes, miners disagree? ;-o
Scroll up to the report and look at my GDX chart
Alex, I use the Pring macd setting for the 1 hr (65,90,12), and the standard 12,26,9 for the 2 hour. Both have crossed negative. Nothing might have changed as far as an ICL, but anyone looking to start positions here, miners *could* have more downside still. A-b-c like your gdx chart maybe. One thing i do see though, acc/dist is not moving down with price in lower frames, even EXK. I’ll add when those macd i said above cross positive again. Meanwhile, just holding my shares and sitting still.
That was the question, ‘Still think it’s an ICL?’ . Answer was “nothing has changed”, because within the context of an ICL and its parameters and the ways it can play out, this still looks like a move out of an ICL and will even if Gold sells off during the Fed release. I have mentioned in various ways that GDX pulling back is likely. Cup & Handle, fill the upper gap, etc…all acceptable.
With that said, I started AUY, which i had sold near the top. Macd is getting o/sold in the 1 hr, although it could keep falling to the 50. I’ll add there if we keep going down. Basically, the only speculative plays I have on right now are LABU and ERX, and even Erx I could keep longer term, as long as it stays above the major ma’s. But won’t sell miner positions as long as we’re above the 100 sma. Gold is above its 20 month sma and pushing bbands up. Thats a bull until proven otherwise.
I was watching the AUY and hoping for another tag of that 50sma , gap fill not necessarily important , but that would be a bonus if it filled the gap & snapped back above the 50sma during the fed release.
If that doesnt happen, at least one of us is in it : )
Trust me, I’m hoping for that tag of the 50 as much as you!!!
Hi Alex,
FWIW, I’ve had some poorly timed entries on miners (buying a false breakout in August, 2015; buying before a pullback finished last month), but if you think the bear market is over in Gold & Miners, these less-than-perfect entries become a good memory.
Don’t know if that helps anyone, but I want to support your big-picture theme as I think this is one of the most important investing times of my life.
I agree Cal. I made some ‘early’ entries like that from 2001 to 2008 and it didn’t matter at all over time, they dipped down more, and that is the only time that I can say adding to a losing position really paid off.
When a stock like “AG” just ran from $2 to $13, it doesn’t matter if you bought it at $5 and it pulled back to $4.50 – it hits $13 and you dont even remember it 🙂
If we fill the 2nd gap and hit support on the 20sma without continuing to break down, I’ll go long. Pretty much in line with Alex’s theory on the 1st gap (from crap Jobs Report) not filling. That’s just about $88 on NUGT.
Buying ERX here near the 50 sma. The daily looks like it wants to keep going down, but it has found support before at the 50 so giving it a shot. Lower tframes also getting very o/sold. Added to LABU, although the 100 sma should be my stop, and it sliced through that like a knife through butter!! But, it is also getting way o/sold in lower frames. These are small positions. The bad thig about these is that macd in daily has turned negative, thats one of the reasons these positions are small. Their inverse etf’s are also looking like they want higher. EXK is sitting right on 20 and 50 day sma, but not adding so far. MACD in lower frames for miners *could* still come down more.
Looks like like Labu’s getting ready to go judging by that volume spike on the minute chart just now
Fingers are crossed Crystal!!
Broke the downtrend on the 5 minute chart too, so it should at least be a good short term play, then hold if it ‘sticks the landing ‘
That’s the plan. Although I never look at anything less than a 30 minute. And even then I’m only trying to see *where* macd has bottomed before. It should get moving once we get a macd cross in the 1 and 2 hour charts. Bounce or rally though?? Thats the question.
I know that so far IPI isnt holding the highs of the day, but the volume is great for an attempted break out.
If it can power higher after lunch, she might run : )
went to work finally in the green….came home to find IPI is back to being the goat. Darn.
Its a love / hate relationship when it is in a trading range : )
The moves are huge. $1.30 to $1.70 in 2 days is a big move !
The break out on the weekly of BTE was nice. ( See a 1 year wkly chart)
The pullback on the daily has my attention too. I just need to decide if I want that trade
Im staying away fro Energy for a while. I see USOIL going to $45.27. Then I’ll buy energy for another nice ride. Playing ERY DWTI currently.
https://www.tradingview.com/chart/USOIL/YRuKk4EW-USOIL/
Oil down big on API stats tonight, looks like you are on the right side of this one/
Looking at EGO on the the bid ask and it’s getting some serious action on the bid side…
alex are you expecting the trend line you have draw for oil to hold. if so seems a good place to go long oil and oil stocks?
Hi Manny,
I am actually thinking that it could get a false break down and Oil could tag the 50sma below it. That is based on the idea with cycles that when they dip into a daily cycle low, they usually do break the trend line and then recover it.
So I am expecting it to break, but it may be just slightly.
Oh these devious markets. I sold my EXK in case it was heading down to the first gap ….and it is recovering. : )
It was cutting into my VGZ gains – so I figured I’d cut it and grab it at the first gap. oops – unless we get some selling on Fed Wednesday
+1 for acc/dist again. So far, at least…
Added a little more ERX. Getting closer to the 50 sma. Stop would be below there, on an end of day close.
Lol..moe.. is that u??
who – me? Where?
just refreshed. Yes, that’s the company but I’m not there. Where’s the trade show? Lot’s of purple everywhere.
we are the official wifi vendor of the NFL. We have most of the stadiums connected. Get some free stuff while there. You will enjoy the purple tee shirts.
I wanted to mention another miner that should be on your radar TRQ — Rio Tinto owns 50% of it and there is rumor they may take it private. Even without that as incentive, the chart looks good and their fundamentals are great – total debt to capital is only .15%. EPS growth last quarter vs prior quarter last year was 100%: Profit Margin is 28%: P/E TTM is 15: Reported short interest is .11%
Thanks for the stats. It was in the report above, the chart is signaling bullishness. I bought it for the volume break out and inverse H&S
Oops :/ sorry … (Solid evidence we miss some of your points)
LGCY lost the 50-day today. So for that reason, I’m out. API numbers smoked oil overnight ahead of both gov’t numbers and Fed tomorrow. No energy currently, not a good time. 40 cent pullback on nat gas would be a lot, would like to see if pullback but not quite 15%. 15% plus contract roll and leverage would be 50%+ loss for UGAZ
Ok, so I did make a few disparaging remarks about IPI but all were on the public blog here so no hiding that! At the time it was mathematically my worst performing new trade. But no longer. Others fared much worse! 🙂
Some of us bought while it was too overbought. :O I’m in the green (slightly) on IPI currently. None of my other recent trades are nearly that good! :O