
June 8 – Coming Together
The trading has been good for the past few weeks and as time goes by, we are seeing many things coming together as expected. By the time we get to the weekend report, pieces should fall into place and give us a clearer big picture too. Lets review some of the recent action and how it has been playing out.
.
DJUSST WKLY – I posted charts of STEEL in May and June and expected another run higher. Steel stocks should benefit.
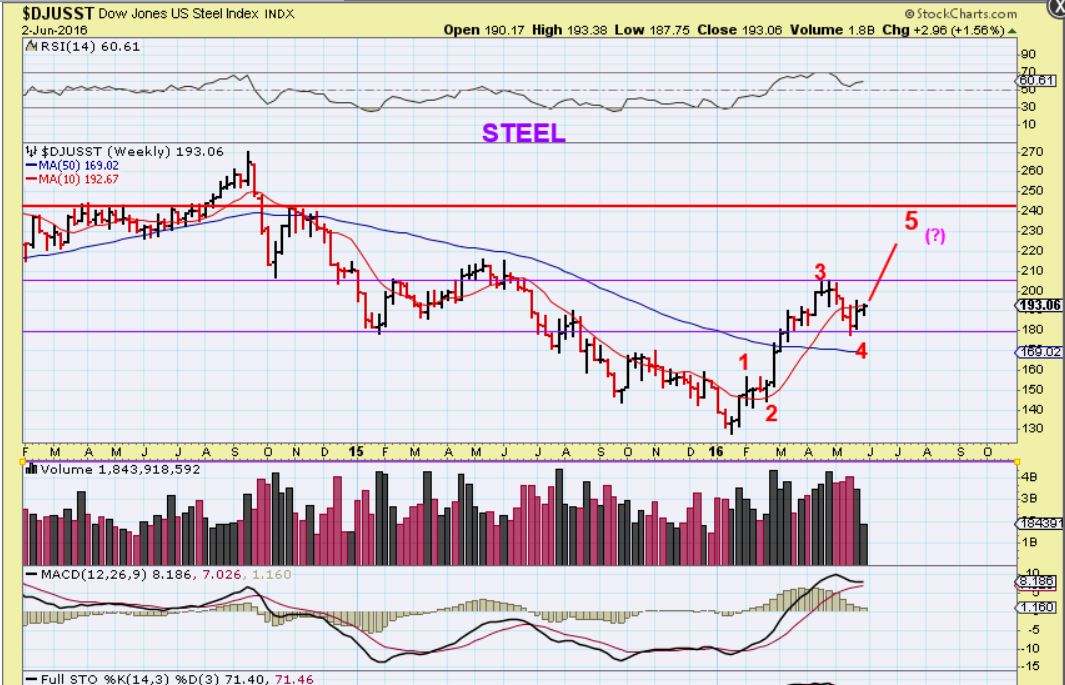
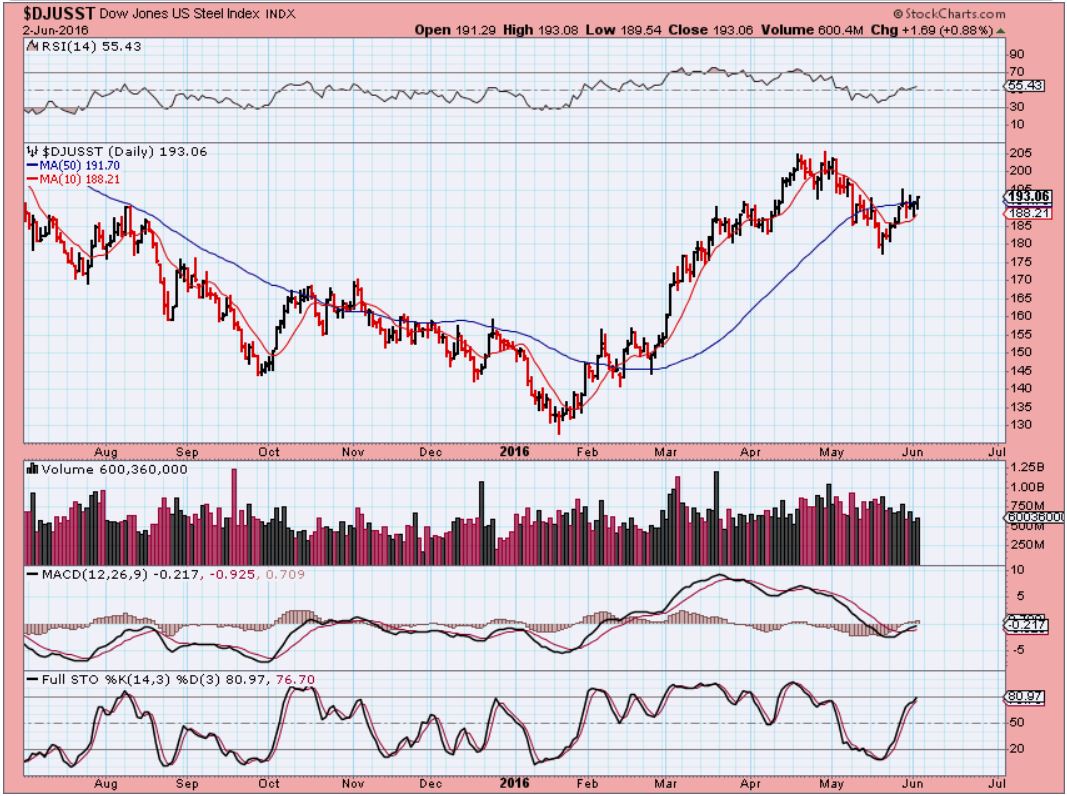
STEEL – This is the daily. Lets look at steel 1 week later. Steels daily 1 week later.
STEEL JUNE 8th – One week later and Steel is breaking out. Steel stocks like STLD, AKS, X, etc have started running again too.
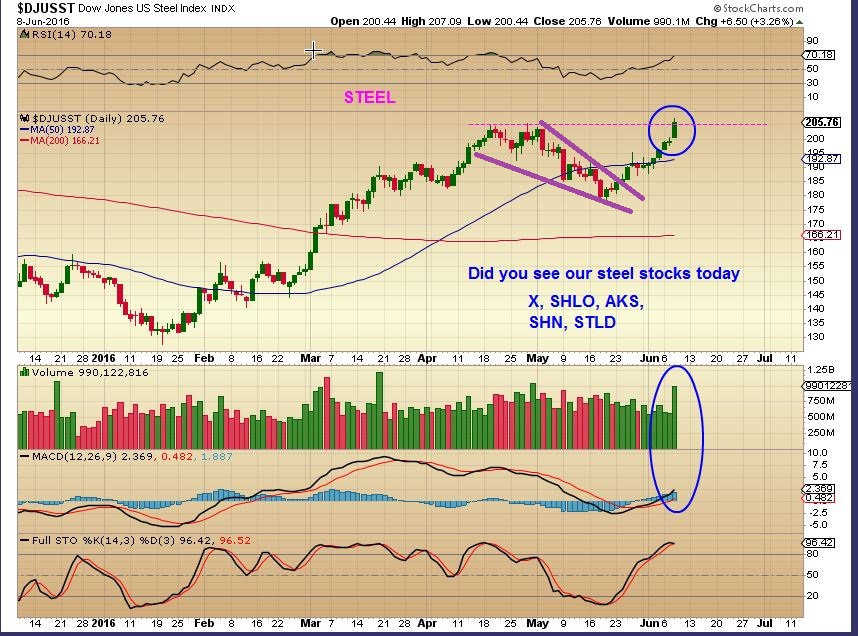
Notice how Steel broke above the 50sma, stalled and then took off higher? Then take a look at this…
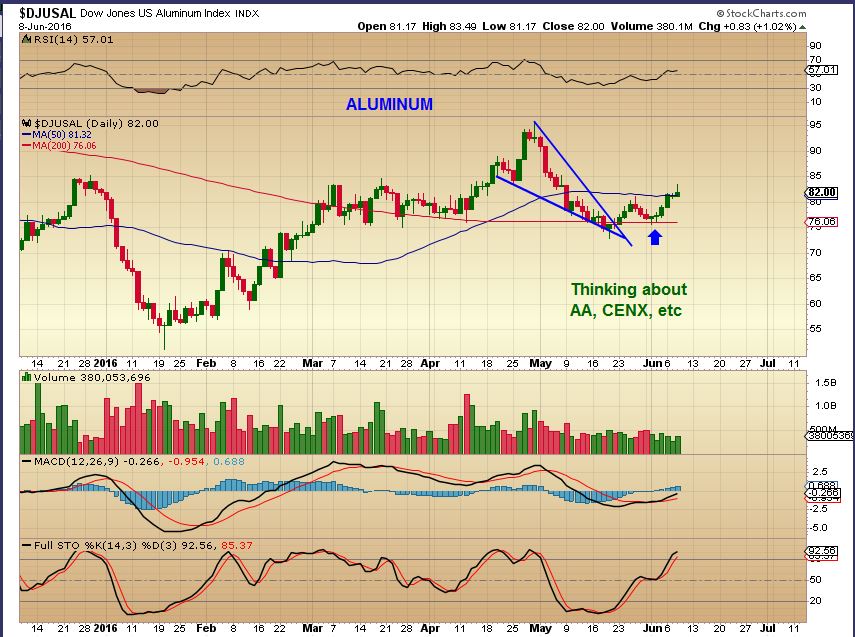
Aluminum also broke above the 50sma and stalled a bit. I think that Aluminum could be next. ( AA, CENX, etc).
.
Lets jump to a quick market review and then discuss trades in the Metals area a bit more.
.
SPX – The General markets are continuing higher, taking out all prior highs except for the May 2015 highs. This weekly chart shows that the first daily cycle in 2016 ran higher for 10 weeks, and we are only on week 3.
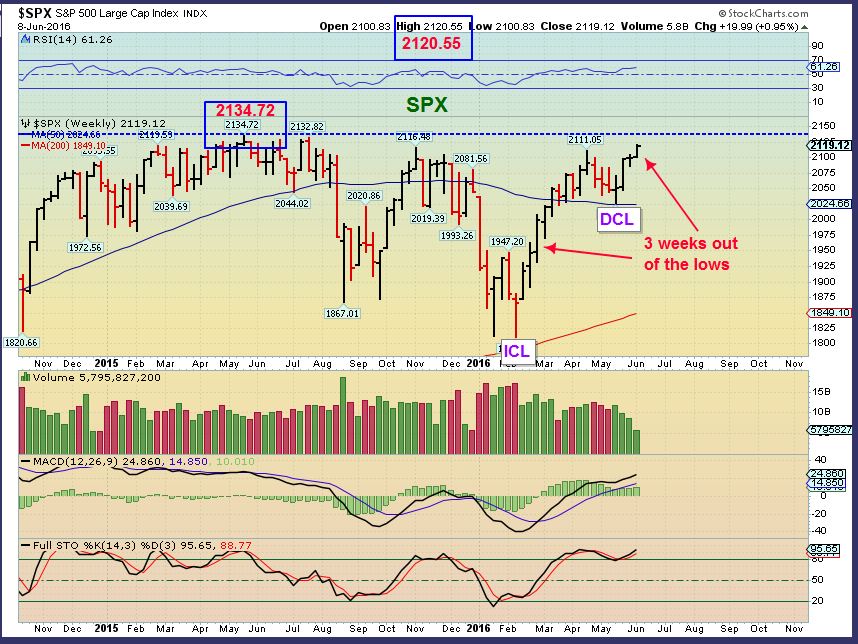
The Markets are DEFINITELY “climbing a wall of worry” as they say. Turn on CNBC and you’ll find that with markets back at new highs, the conversations are constantly worrisome. Wednesday was filled with discussions about Interest Rates and The FED, BREXIT, WEAK EVALUATIONS, WEAK JOBS, ELECTION CANDIDATES, ETC. At this point, the markets just keep climbing.
.
WTIC – I Mentioned in the Wednesday report that Energy stocks are breaking out and seemed to be leading the way higher. When I draw OIL now, it looks like it does want to keep rising. My original target was $51.60, I then expected a pullback, and then another push higher toward $60ish. As mentioned in the Wednesday report, Energy stocks look like higher Oil prices are coming.
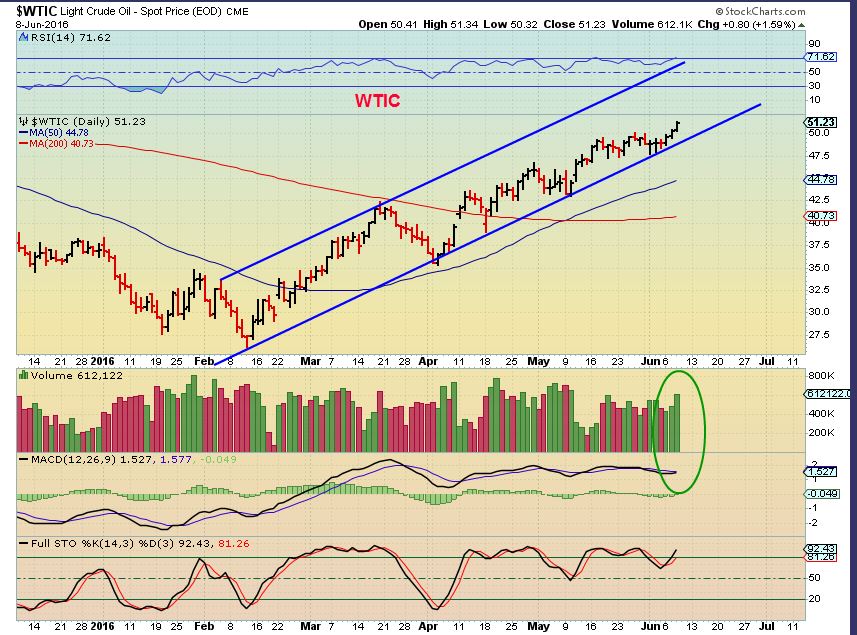
I listed some stocks in Wednesdays report, and most have had follow through. I was asked specifically about 2 Energy charts, so I will add them here.
.
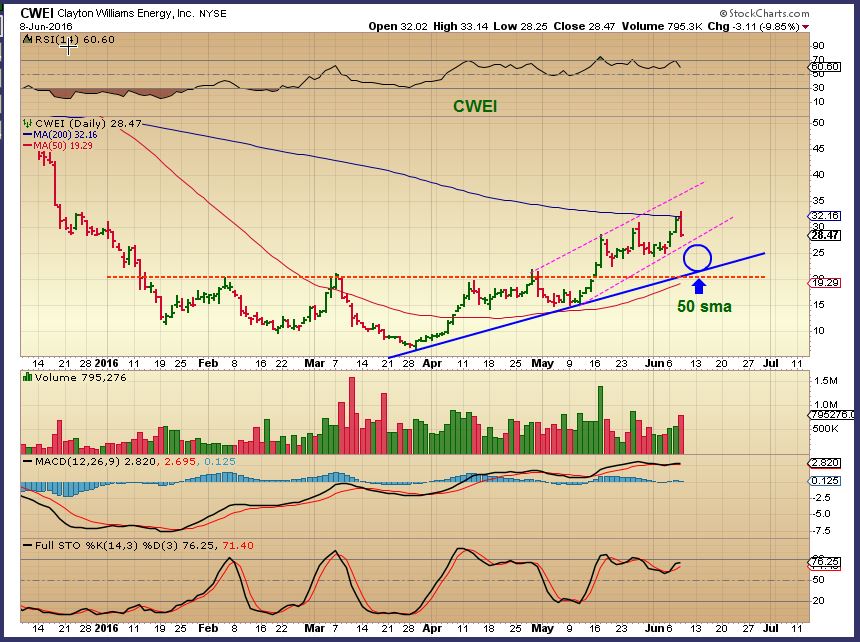
CWEI – It found resistance at the 200sma. That is not unexpected and I see 2 areas that it could drop to. It is almost at the first one near $28 (Pink Line). The second target could be the Blue trend line – which is also the 50 sma, and a back test of the base at $20.00.
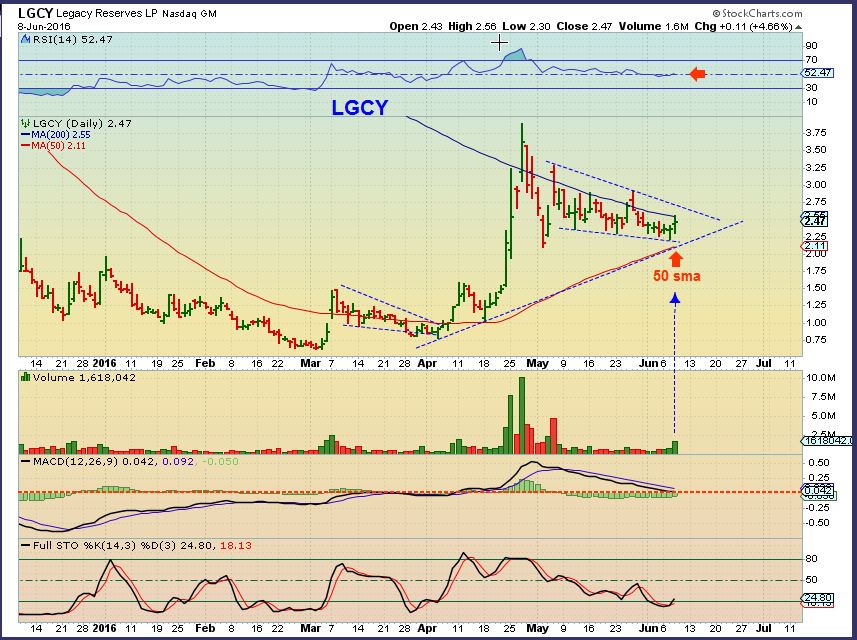
LGCY UPDATE – It is pushing on the 200sma, becoming oversold, yet the RSI is bullish. It is pinched between the 50 & 200 sma. One could wait for a close above the 200sma to avoid the recent volatility. It is as volatile as a 3x ETF, so it is not for the squeamish and yes, this or any other pattern can fail.
.
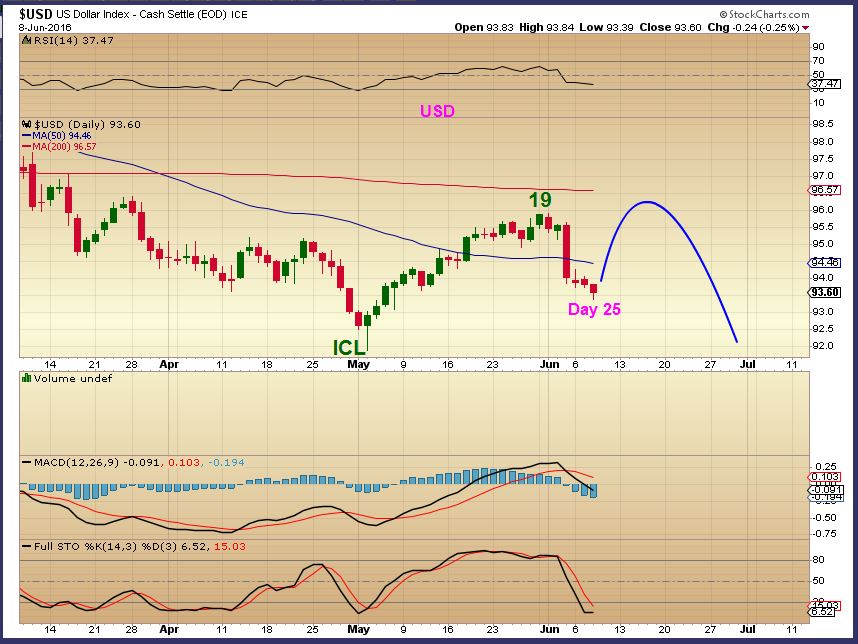
USD – The USD is due for a daily cycle low (DCL) and a bounce. It may or may not be a strong bounce, and that could put pressure on Precious Metals. I will explain more in the weekend report. A bounce in the USD could start a small pullback in precious metals.
.
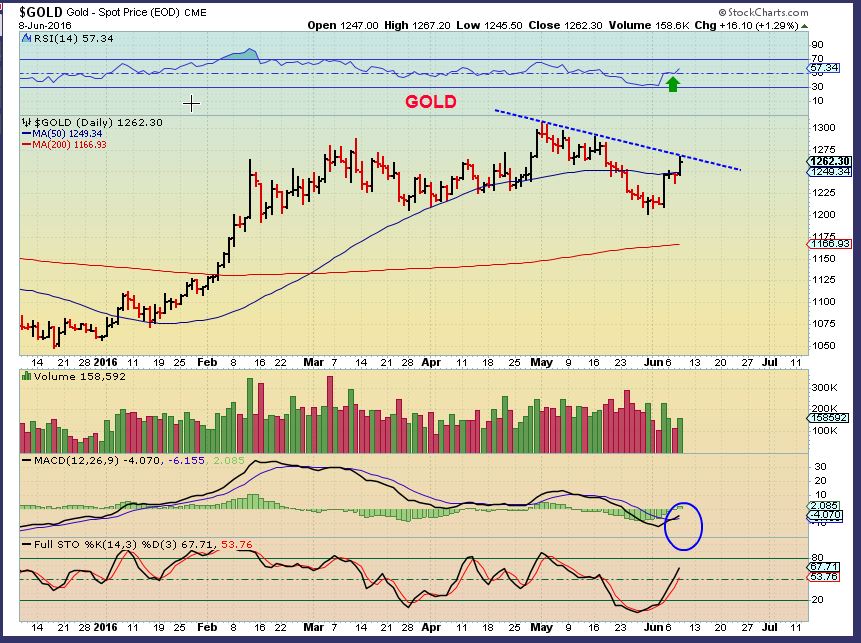
GOLD – I said in prior reports that I believed an ICL was in place. A break above the overhead trend line would add confidence. We did not get that Wednesday. I’ll be Watching this and the USD Thursday & Friday. So far, this is a Bullish chart in Technical Analysis.
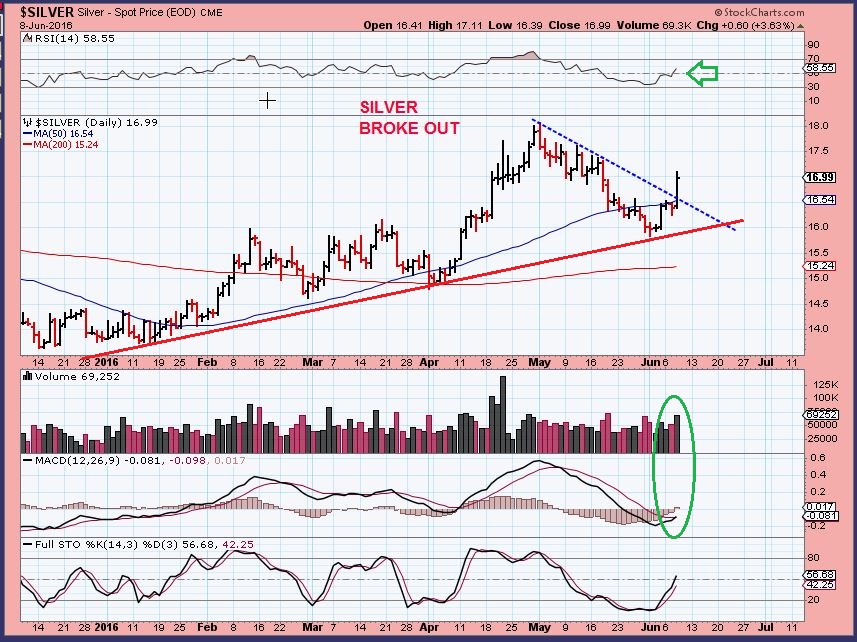
SILVER – Silver DID break its overhead trend line. This is a normal bullish uptrend. Silver was up almost 4% at one point Wednesday. SSRI, AG, PAAS, HL, etc. are at New highs, but they did have reversal candles Wednesday.
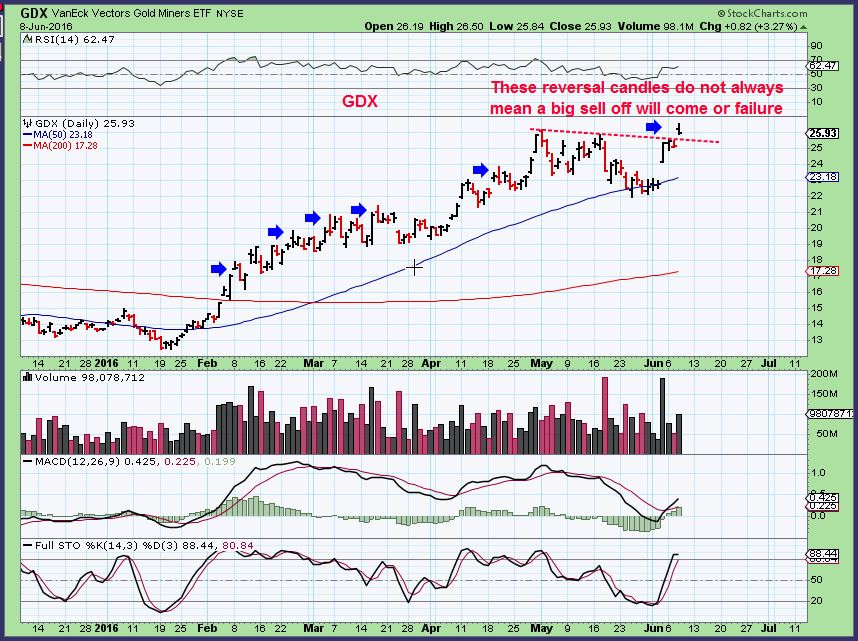
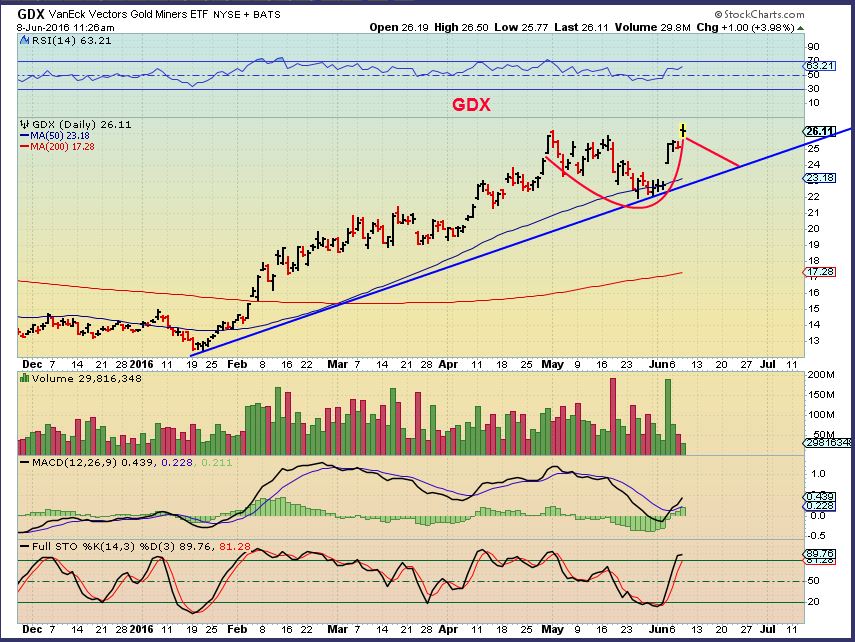
GDX – Miners actually made new highs too. That is also a reversal candle, so the USD may bounce and Miners could drop back. How much? I think by the time we get to the weekend report, the reaction will be more predictable.
GDX possibility – If the USD just puts in a weak dead cat bounce, we could see this, and still have the ICL in place.
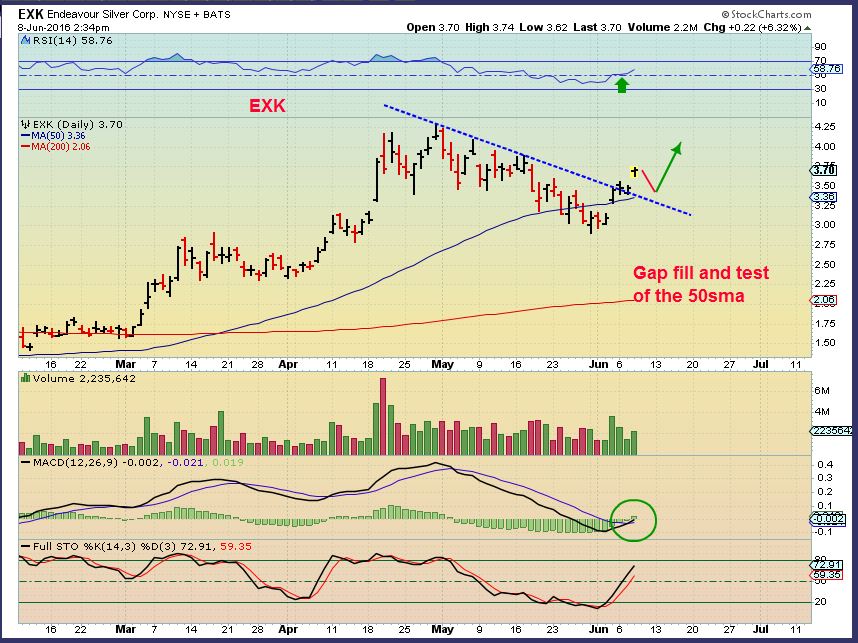
EXK – Under those circumstances, EXK could do something like this, but it doesn’t have to. I am just explaining this so that if we start pulling back in Miners, readers can see the bullish side. This would be very normal, back testing the 50sma.
.
Finally I just wanted to go back to the Metals Stocks. Steel is running, Aluminum could be next, as mentioned.
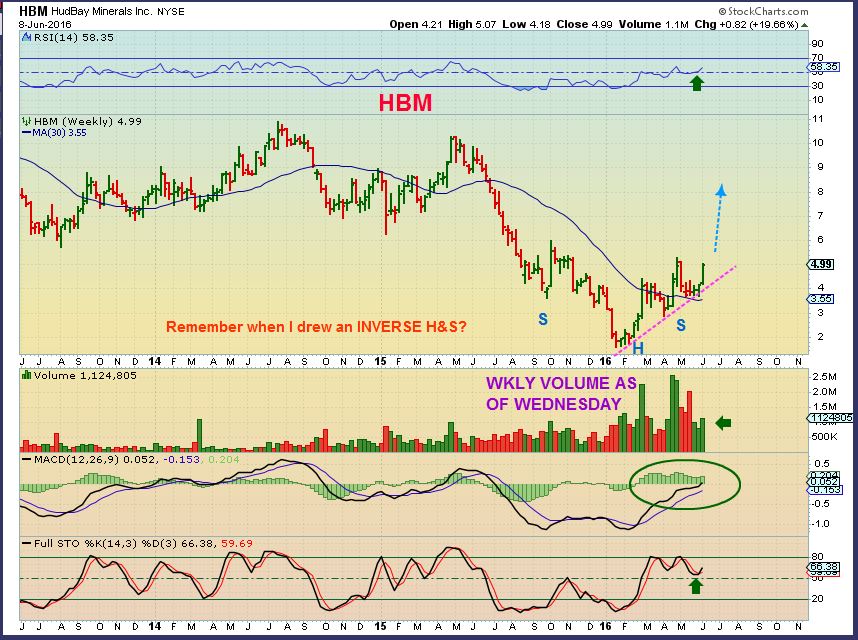
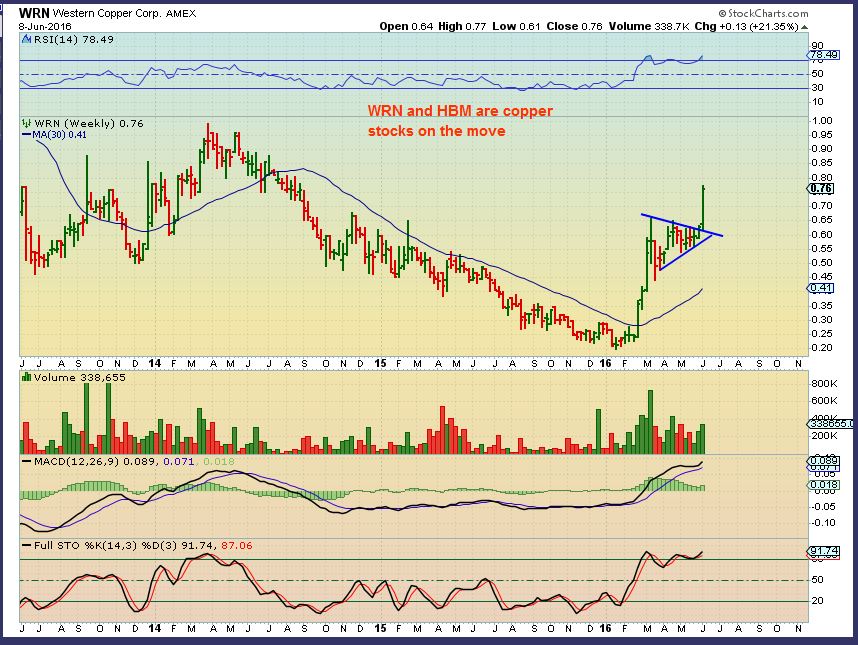
Copper stocks are showing movement too, even though Copper is at the lows.
.
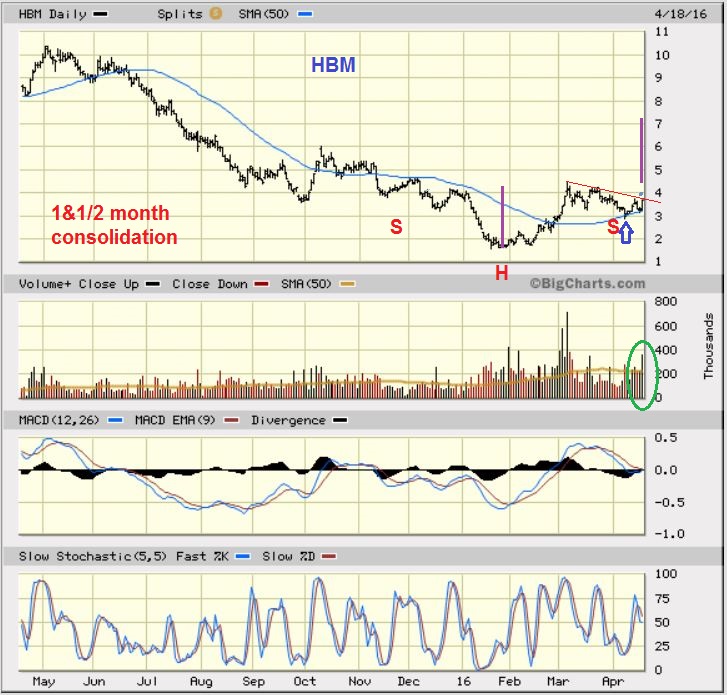
HBM – This is my older chart showing a possible longer term inverse H&S when we were buying it above $3.00
Last week I mentioned that it began breaking out again.
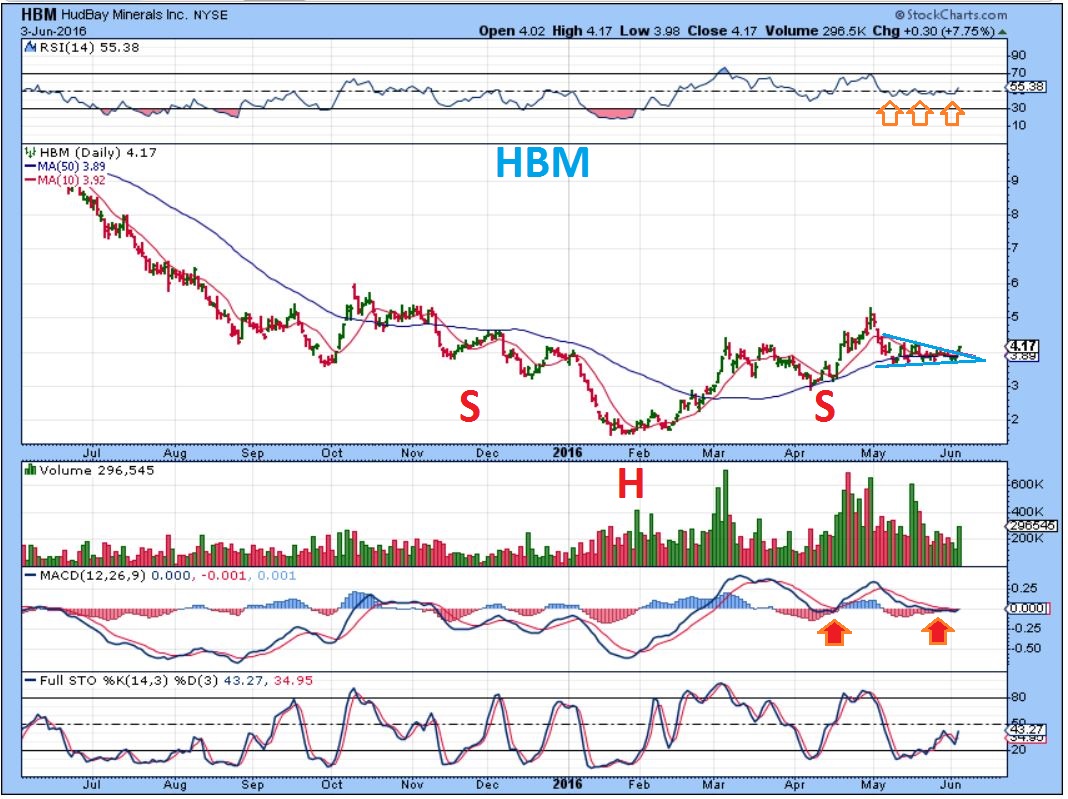
Wednesday June 8th – I chose a weekly chart. HBM is up 20% this week and shows good potential longer term too.
WRN WKLY – also up 21% this week. Todays POP was huge on the daily.
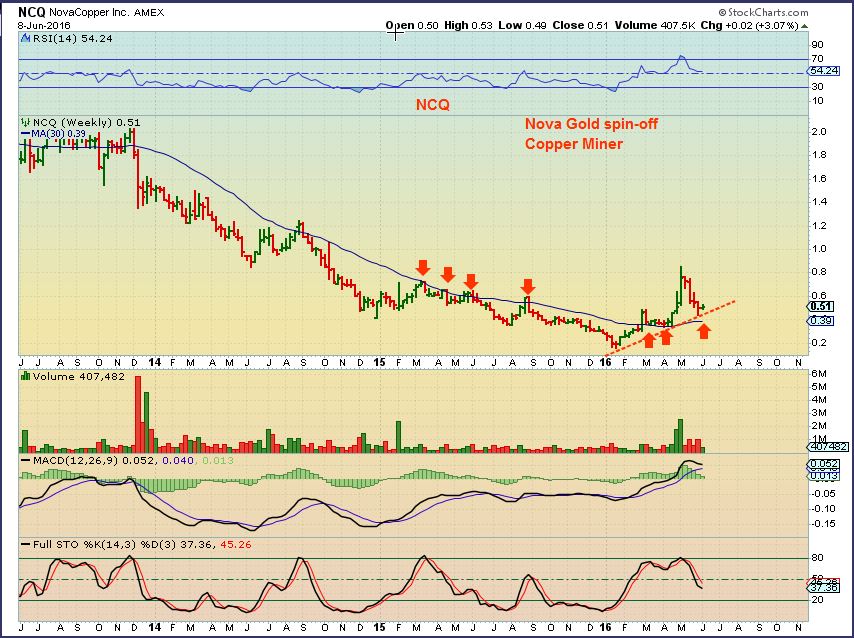
So that leads me to FCX and NCQ – Are they next? It might be worth watching .
NCQ looks to be at a low point of its consolidation after breaking out and running up 160% in April, then back testing that break out.
.
So that’s the market review and a few more trade ideas to watch for. Energy and Commodities are running, Miners Popped, rose up and may pull back a bit with a $USD bounce due. After Thursday and Fridays trading, I should be able to get a much clearer picture of the big picture, and so far , it looks pretty bullish in many areas. Enjoy your Thursday, and thanks for being here!
.


While you were away on vacation, Janet had this to say http://www.latimes.com/business/la-fi-yellen-interest-rate-20160606-snap-story.html
So it will be interesting to see how the mm’s orchestrate the rug pull that they usually do right before the Fed Meeting (starts next week on Tues)
I am wondering if this would be a good opportunity to buy the dip (with my URRE profits) in the next three days in gold- rather than get shaken out of the small basket of positions that I just took (AG, CDE, EGO, IAG, GSS, GPL, TGD, and even BAA)
I am still trying to figure out the best way to play these fed meeting
1. Play it like an Earnings: exit vulnerable positions and get back in after the announcement. Or
2. Take some profits off the table on the Thurs and Friday before so I have more cash to buy the dip..
3. Sit tight with stops, and see if they get taken out and just wait it out.
Crystal what happened to that pharma you had? Got hit hard, hope you were out.
Hi Bill,
I had high expectations for them having good results on their clinical trials. I had initially bought it low at $1.99 and had put a stop in a penny below the 52 week low.
I knew results were imment this month, and when the stock started acting quirky on Friday, I went to FIbrocells website and signed up for email alerts- so that if it failed and the price dropped fast, I could exit faster if my stop loss didn’t trigger exactly at $1.98.
So yesterday morning I got the email that it failed, and I immediately exited. So my loss was only about 2%
The dang thing really tanked. So lesson learned.
I had already sworn off ETFs like JNUG– now I am adding pharma stocks to that list.
I really hope no one here got burned on that.
If you remember I got burnt on SRPT. I held, and eventually came back. I got out with a small profit. I use LABU now, seems safer, which is strange for a 3x leveraged ETF.
There is a path that one must take in order to become even moderately successful in the stock market.
And I have come to the conclusion that it involves taking painful losses, learning from them, and coming back and trying again.
So we all have these scars/or badges — the ETF, Pharma, Options, Leveraging, After hours trading, Falling Knife, Buying the Top, Selling Fear, Over Trading, …..
Oh! Sounds like what I do!!! LOL
Welcome to the trial by fire 🙂
I think I’m crispy enough!…but what do I know!? LOL
Nancy.. is it time to get something back on HK…?
looks a bit pregnant 🙂
i just dabbled a small amount @ $40
(top of channel, even if its a bear flag, is targeting $50 by looks of it)
Back from work and came all the way down here to see the dreaded symbol HK in this comment. DO you mean .40 and .50!? It is going bankrupt! I now will run screaming from the room! No! I don’t want any of it ever again! LOL.
[Actually, I read my log of old trades and I had been in/out of it 3 times with some profit already…so only lost half of what I thought I had originally. Still…it was a big OUCH!]
whoops.. sorry, my bad.
of course i meant 0.40 & 0.50
was just watching the momentum breakouts on the 4H chart.
dunno if it did already top out at the 34ema (4H) resistance.
hoping it pops higher to 0.50.. but i’m out below 0.40 anyway, since it may not have found a bottom (and of course may disappear altogether!)
Been there, Done that !
We don’t make the same mistake twice Crystal… we make it 5 or 6 times just to make sure!!!! 🙂
I bet your teenage years were interesting 🙂
I have researched my head off on Pharma / Biotech companies in the past, and even my most bullish ones still got cut in 1/2 on a failed FDA release ( That was 99% sure to pass).
I have a hard time buying and holding any now too, no matter how good the company news is, its a real coin toss at times. It can be 100% gains pre market, or cut in 1/2.
I was even in a cancer drug company that had excellent test results, and 1 “side-effect’ needed further review, and that was all it took to kill the stock. I didnt realize at the time that …. “Further review” meant no increased earnings for a year, sell sell sell.
Indeed, so thats why the ETF approach.
yeah, tricky area
Hi Crystal,
At this point we dont have official “Confirmation’ of an ICL, but I believe we got one. I even was writing about the ‘timing’ for it before it happened, so to me, it would be a buy the dip event, but if you were REALLY HEAVY invested in Miners, maybe lock in profit in some until further confirmation.
I was going to discuss it more in the weekend report.
Good morning Alex!! Always a pleasure to start my day with a cup of coffee and reading your report! I do want to post a chart I was working on yesterday. I know nothing in TA can be accurate 100% of the time, so all we can do is try our best to *feel* the chart for possible direction, right? So I’m studying the $HUI chart, weekly line, going back 20 years. The relationshop with the 65 ema is VERY evident. I’ll post it, and we’ll keep talking about it…..
Nice job Peter
Thank you Bill!! Read the comment under this and see if you can take it from here!! 🙂
Ok, it posted above, not under!!
So, here’s what it is pretty self evident: touches of the 65ema are very common, horizontal resistance near 250 is pretty important, and the down trendline from the top is probably THE biggest hurdle. Those last 2 converge right around 250-260. This is just my opinion, but I don’t believe this is a repeat of the ’08-09 recovery. That was a v-shaped recovery, and this has been a basing b/out VERY similar to the ’00-’01 move. In either case though, we had a bull market. And in both, we had tests of the 65ema. That is what we are missing in this move. In ’00-’02, it took the HUI 18 months, to gain a total of about 300%, but it did come back about 30%, tested the 65ema, consolidated, and broke higher. Again, we dont see that here, yet. If the HUI were to gain that same 300% now, without coming down to the 65 and consolidating first, it would need to get to near 400. That is a MASSIVE move!! This is just to start a conversation about how this could act going forward. For anybody thinking they will miss *the* move, or wanting to bet the farm here and now, a move down to the 65 ema from here, could be a 30-40% haircut. And it does look like that 250 area is VERY important. Can anyone take this further, and post a chart of what the HUI did in 70’s & 80’s?? One last thing: look at the chart, and see how that move in ’00-’01 came back to the 20, and pushed higher again, AND THEN corrected to the 65. We *could* see the same here. Push to that area of resistance near 250, and pull back to the 65.
for GLD i am actually still waiting for my personal long-term-trend indicator which is a simple 75-week high. i canNOT say yet officially GLD the LTT is now UP. lol i hate that. and the GLD Weekly RSI-41 has yet to enter UP Zone Level 2 (basic OB area).
OMG… wow.. i just read this now.. sorry.. but Im just studying that gold chart again for the 900th time… and I see a pattern that jumped out at me ..
https://www.tradingview.com/x/6EdIXOW3/
I’ll take the other side of the argument for a minute. If you use a 5-year chart of Gold, I can draw the trendlines both vertical and horizontal trading ranges that show a very clear breakout. We have TWO higher hi’s on the HUI above and (if we ever really get one) a higher low. If you do a layover of the 2008 recovery with the 2016 bull, they follow almost the exact same line so far.
Look, I was the guy that wouldn’t buy b/c we were supposed to get a pullback. But we just didn’t get one. We will at some point, and your MA65 has some merit as I can clearly see it get tested many times above. BUT we just hit a 2nd ICL. So…what if…what if…we get the 2nd burst now to leave folks behind b/c we need a pullback and we get that next push higher AND then just when even more people are bullish early fall and seasonality is positive, yada yada, we get that 65MA touch and that 20-30% haircut we need??? Wait, that sounds like I looked at Maria’s chart already…. :O
That’s a possibility too C-man. But what I’m saying is that AT SOME POINT price will come back to that 65 ema. The higher we go, the more distant we get from that ema, the more violent that move down to it might be. From what level does it correct, who knows!! But if price can just burst through that downtrend, that will be huge. Does it break it on the first try, I dont think so. But thats just my opinion though. I am still in metals and miners. I always am! It’s just whether I’m heavy or light. Right now you can be heavy, but watching closely to lighten up if need be.
luv it Peter… CCC* – i feel the same way .. start the day with a hot cup of coffee, an old friend and a smile 🙂
(tho I do talk out loud to myself once in a while – annnnd … ok maybe I do laugh and slap my knee. 😉
Interesting chart btw .. I really like your longer term take on things…. reminds me of my old friend Chris…..:o) (Hi Chris)
Yeahhh .. .when I grow up in a couple years.. (stop snickering right now people) … my plan -God willing is to take longer term swings prob 80% of the time and maybe save 20% of resources for shorter term day/week trades, and that’s just IF i feel like trading that day…not becuz I have to … but just for the mere luv of the game. 😉 yowza!! (annnnd, that’s short for #Addict #Lifer) giggle. It’s kinnnnda what I am doing now on a much smaller scale .. but long story short- (yeah i botched that i no – but it ISS Thirsty Thursday u know) ;o) I enjoy reading your views and commentary though I cannot usually post at the time… so thanks.
*no that’s not a ticker CF… relax (.. don’t do it … when u want to go to it…relax …)
Thank you Maria!!! 🙂 I would like nothing more than for us here to become great investors!! We all have a passion for it. Hopefully we will be able to get what we want out of it…..
OIL, what if? See attached
https://www.tradingview.com/chart/USOIL/RjxqCbeu-USOIL/
Maybe? Your math is solid, but man I don’t see $60 without a retrace first. That would be $26 to $60 almost straight up. Yes, some consolidation but almost no down. That would be a sick move. That I missed most of. But not all!
Cason, We did have a pullback in Energy. USOIL went from $42 to $35, thats just over 38%. I thought I attached a link? I was seeing $26 to $42 as EW 1, then $42 to $35 as EW 2. Now as I understand EW wave 3 can be 1.618% of 1. If so, then that would take us near $60! Just the facts. I have no idea if, when, etc. it will happen.
I think it’s going to be interesting to watch and maybe play Natty today after the inventory report comes out. If it can break 2.50 with any sort of volume, stocks like CHK are going to rocket — are there others in that same category?
The Dollar is getting its bounce , up almost 50 & GOLD & SILVER just Popped higher.
THAT is bullish
Oil dropping, which effects commodity prices for sure.
ALEX…. Thanks for your report, and….. I have a short question.
Which sliver of gold stock is lagging, or which PM stock can I buy, is not to much risk?
If possible -I know you are very busy- I would really appreciated your help.
Thanks my dear.
If you are looking for a silver stock that has lagged, maybe EXK or GPL have not done what some others have.
SSRI, PAAS, HL, AG are at their 2016 highs for example, GPL & EXK have not run back up to their 2016 highs
Just as a sidenote for you and other readers too: RISK in P.M. stocks could come from many things, so I usually recommend a small basket or keep a single stock position small ‘just in case’ bad news happens. . Earthquake, flood, etc could affect a mine..
Thanks ALEX…..
Guert – based on the chart above – I’m putting in my limit buy on EXK now. Hopefully that hits before Fed Wed and then BOOM!
Copper has broken down below the lows, and has falled 2% so far this a.m. Kind of tough to understand why
NCQ is green, and HBM is only down 5 cents.
Fcx getting hit hard…
Probably just dollar bounce as you state below. Think of the day silver would have had with the dollar down $.50 instead….! whoah
This is NOT what I had in mind to kick off summer vacation!!!
here goes URRE and UEC!
Ssshhh – you know if you say it out loud, “they” hear you and sell it off. 🙂
rookie mistake. 🙁
well, its holding at up 10% – they must not have been listening ; – )
ASM – announced commercial production at a mine in Mexico and this has been an excellent week for them.
Full confession: had to get rid of AUMN. Bought at low .30’s. Sold 1/3 yesterday near .50, and the rest now at .44. That was intended to be a buy and hold, BUT… I can’t get over the Acc/Distr line in that thing going just SOUTH!!! Even with the bounces the last few days, a/d line keeps going only lower. Not that a/d line is the end all be all of TA, but it should be moving in the same general direction with price, as this one is going the wrong way.
Yes, may have some work to do. Hit the 50sma and now dropping, maybe to fill the gap.
At least you came out with profit.
I’ve been watching VGZ build this consolidation, but didnt enter when I should have
There are some others that I got into also that are threatening a mental stop today. I’ll post if I do anything. But man, look up the a/d line in AUMN and you’ll see what I mean. It’s unreal looking… nowhere but down! And what the heck is up with FCX today? Not a good day for that to be my largest position…. :-/
Yeah, I’m sitting in FCX too…..yesterday was looking good, then ….today!
I feel you Tamm…
Hey Peter! I’m looking at it like this…..it’ll give me a good entry to buy a few more shares….and then ride it up again….:)
Me too…FCX, VALE, and SID all look similar..and not nice…but just seem to be turning. I have to go to work so will face the rest later. Have a good day all.
Peter and Tammie, I think it will fill the cap @ 10.50
Look at the 3 months chart.
Yeah, CLF hit the sick button this morning, too. Not surprised.
Natty is taking off 🙂
UGAZ has been rippin.
ETF…. The volume on CHK is high but it’s not moving… ?
finally some relief. me and bros inherted natgas wells’ “pure dumb luck lottery win in 2008” monthly “mailbox money” amts maybe will tick back up a bit. peak month was aug 2014 royalties were.$200,000. natty was $5.50’ish but rollin over.
UNG is doing quite well today following the positive inventory report… would love to see that trickle down into some of the energy names, though it doesn’t seem to be having that effect…
Manipulation?
Hey Moe : )
just put in a sell.
Ringing the register – lunch is on Moe! 🙂
I made 70 cents as I only bought 1 share 🙂 Only kidding, but only had 1000 shares at 2.02
Thats a good trade –
if you could do it once a day you’d be making 6 figures/ yr trading 🙂
can one open a trading acct in a tax haven like cayman or Singapore and as long as gains stay there no usa grabbing 40% if ya position size is say $1,000,000.
I really need UEC to shoot to the moon.
… mmm .. nice.. ….. where we going?
let’s do lunch in Kankakee!. lmao.
… i was about to say .. where the H*LL is THAT? buttt .. then my BFF google told me…. ;o)
*no CF .. i didnt mean go burn your brain out looking up BFF stock
*giggle… smirk… giggle…………………
“The City of New Orleans ” train route.
“Ridin’ on ‘The City of New Orleans’, Illinois central, Monday mornin’ rail…”
oh mannnnnn …. AWESWOME TUNEAGE!!!
listening to it now………
*LifeIsGood
they renamed that route after the popularity of Arlo’s tune.
“…mothers with their babes asleep, rockin’ to the gentle beat…”
which of course now im listenin to …………………………………………………..
“… virgil cain is the name………”
shazammmmmmmmm…. good stuff
Moes Deli?
ham on rye. hold the mayo clinic lol.
I will have to think about this one. Maybe we can all meet somewhere when my UEC breaks out. Since CF lives relatively close by I can take him to lunch and get the ‘inside’ scoop on all things.
HA!! sounds good… i was gonna suggest a drive-by of your work to take a looksee to see if u were ….. “… up on the rooooooof” ….
*in my best JT voice…….
Is anyone still holding URRE? One cannot exactly hold this one until the 200-day, can you? Way too volatile. I just got in yesterday but probably should have sold earlier. My eyelids are twitching!
Full confession: well GLD last thu near the close a very short-term price-pattern recog. “big move on fri!” play. “which way?” “umm, coin toss” “no i want your educ guess Watson” “up” “up? NObody but nobody expects what your implying” “price analysis can predict the least expected funnymentals” “yes it can indeed. BTO $5,000 worth of the at the money 6 1/2 hrs to exp calls” in at the close thu at $1.50 out at the open fri at $4.00. then GLD mon at the open “daily rsi-41 finally in the center zone thus dcl or icl” BTO $4,500 worth of 9 days to exp ATM calls. exit is close above that high for the move 124’ish. but tue night i chickened out. lucky that wed open was favorable. out for $6,500. i’m done for the moment. i hate all this waiting and waiting for these events of the decade. feel like getting lost somewhere till after the election.
“…school’s, out, for, summa! school’s, out, for, evah! school’s, been shown, the, nieces.
no, more, pen-cils. no, more, rule-books. no, more, teach-ers. dirt-y, looks…”
Had to read it 2x, but I think I follow it lol
Nice chunck of money
yeah am in the process of major change. wanna focus exclusively on my price-pattern (volatility compression) quickie in and out BTO weekly options. #1 it “fits” my style. #2 volatility compression shaves off critical % of option premium thus reduces risk and adds to reward. #3 but in and out with 5-9 days to exp is to me unbeatable by any other related inst, derivative, or combo of, etc. holding long option positions is a long term challenge lol. i wanna be in and out, then grab a monsta and a guitar lol.
lmao just realized GLD is only 2.50 points away from my “counter-trend is complete now back in the direction of the long-term-trend and at minimum make a new high for the LTT move”. IMHO then back down to previous lows. maybe 200sma maybe 50%.
Keep confessing: so with todays beatdown, yesterdays gameplan is out the window. I had expected things to evolve differently, BUT… this is what we got, so let’s deal with it. When life gives you lemons…. Making a few changes: had to kill CLD, BCEI, LGCY, & IPI. I didn’t HAVE to, because positions were not huge, but I did it to scale back the number of positions to monitor. Added some of that to VALE and SID. FCX is also a gonner. That was my biggest position, and had bought it on the breakout of that wedge, but the loss was minor at this point, and I feel I can put that into some other position that has better potential. As far as the energy plays, the longer I do this, the more I learn the hard way that sometimes just sticking with the etf’s is better for me. Every time I have gone outside of ERX & ERY in energy, I end up regreting it. So that’s why I killed the energy buys from yesterday and will stick to ERX.
FCX is picking up a bid at $10.85 — wonder if this is a “drop it to pop it”?
Maybe it was just filling that gap Crystal. I really should’ve waited ’till end of day, but I think it will close below my mental stop anyway, so got rid of it anyhow. I am more bullish on the potential of some other stocks, so I’ll put that $$ into those.
That all goes back to what Alex posted about what kind of trader are you…. Me, personally, I don’t like to have more open positions than what I can manage. That # for me is 5-7. I speead out too much yesterday, so I took care of it before there is any real damage.
MUX looks like it is going to break out.
ASM – Yeah, that looked like it was going to Tuesday ,too
Nice call on $EMES CF! Been holding since around 4.50. Hard to take any off the table seeing all the air above it for a longer term play
Sweet D-Sonka ! It just about doubled in a week 🙂
I LOVE That chart and I was looking at the weekly. You might just want to let it ride, depending on your time frame.
Congrats – great entry!
Not feeling VALE, sold it for 10% profit on this trade. Looks like a H&S. Glad I dropped CWEI yesterday as it went red.
Added WRN, NCQ today. I’m addicted to gambling.
LOL
1-800- dble-dwn
the parlay. once at the las vegas club downtown in the sport’s betting/viewing area, dude had a 5 baseball game parlay and had in the bag 4, and the 5th game was 7th inning. i was betting on the boston Celtics (larrry bird etc) and my Houston rockets in the finals in june 1986.
NOTE: Mentioned in prior reports all week….Gold had to break above the overhead trend line to give me further conviction of an ICL that I have been ‘feeling’ was in place.
Many are waiting to buy miners on the gap fills, but if GOLD breaks that trend line, things could take off.
I see GOLD moving higher now, with the dollar up, and I do see Miners catching a bid in the last 2 hrs.
MUX may be breaking out, many at 2016 highs ( AG, SSRI, ASM, MUX, CDE, etc ) .
My thinking is that Miners may be under accumulation in case Gold breaks out higher.
Volumes remain quite light on GDX & many Miners at this point today.
…hmm….. indicative of a “5th” wave… annnndd coincidentally a “1” …. ‘funny’ how that all works……….
Do you mean ‘1’ of a 1-2-3-4-5 of 5 ?
no… 3 – granted i could be wayyyyyyyyyyyyyyyyyyy off and im SURE SOMEONE will tell me if i Am
ahem .. cough Ken .. cough … .. lol (please do chime in btw —)
that’s just one of my counts– ill show u the one i just thinking of throwing out now..next
… butttt .. here is the one that throw over really is really poking at me …looks done at 38% retrace for ‘2’ .. which means “4” should be 61% ish… given the law of alternation..
https://www.tradingview.com/x/retV8Kfa/.
Got it
https://www.tradingview.com/x/SO7eEnbu/
“Fifth waves tend to be less dynamic and display slower speed of price change than the previous waves. It will usually be accompanied by lesser volume and breadth.”
Now you’re confusing me.
I said “….of a 5th wave?” and you said “No, 3″…and now you are quoting writings on a 5th wave.
Por favor, no entiendo la señorita
yea..i confuse myself too…giggle..that was just an fyi ..that just supports the low volume ….
Thats what I figured – the statements were supportive of low volume rises. I like to see the hihgh volume spike into highs, and then sell 🙂
New post
In this one wouldn’t you be starting wave 3 (of next greater magnitude) up? The 1st chart looked like the triangle was a corrective 2 wave after 1 up from the Dec lows, right?
yes… *i think?? ;o)
i cant tell .. it’s too difficult… gold is a real mindbender…
I did this for Jime in case u missed it… https://www.tradingview.com/x/zRzxyqWM/
Superstar!!
and this is coming out of 2008 lows – … https://www.tradingview.com/x/Cr277ARb/
and this is my “bigger picture” main gold wave that i have been using for the past year….
just now sure what’s going on now… lol …. is it a 3 wave correction??? with a 38% retrace??
or a larger 5 wave — w/ a 50-61% retrace???
https://www.tradingview.com/x/35g3tpPW/
miss the boat.. hmmm
Wave 3: Wave three is usually the largest and most powerful wave in a trend (although some research suggests that in commodity markets, wave five is the largest). The news is now positive and fundamental analysts start to raise earnings estimates. Prices rise quickly, corrections are short-lived and shallow. Anyone looking to “get in on a pullback” will likely miss the boat. As wave three starts, the news is probably still bearish, and most market players remain negative; but by wave three’s midpoint, “the crowd” will often join the new bullish trend. Wave three often extends wave one by a ratio of 1.618:1.
What’s the call Alex? BUY miners or not?
Well, I just had CNBC on while eating my lunch – I have seldom heard so much bullish talk about Gold & miners.
Thats usually sign of overbought
Your thoughts above of an ICL? Gold at 1270?
“In advancing fifth waves, optimism is extremely high despite a narrowing of breadth. ”
… always keepn us guessing…
rekkaFrezzers
Gartman was on Squawk Box this morning, saying he’s buying gold!! How is he still alive??
This morning the call is BUY miners. Okay
GLD 2 big gaps now. what’s up with the USD. it is key. USD IMHO goin higher for a while. the retest of area attained by a “parabolic” (“blowin’ its top”) down leg.
omg NATTY! love sa much.
“…What’s the magic number for oil companies to jump back in and resume pumping? Oil prices have already risen to levels that some companies have signaled would lead them to start again…” The mindless extracting of oil, which is comprised of carbo-hydrate to hydro-carbon deposits that in part are what WAS overly dominant atmospheric CO2 but after zillions of years of Mother Nature’s genius “plant” creation working their magic and drastically lowering CO2, the furnace that was the earth’s surface was no more. And as expected from the much cooler environment could and did eventually rise and evolve more complex forms of life.
Alex, would you mind taking a look at KTOS ? I am tempted to buy. A defense stock ….
Hi Crystal, ( refresh & Click the chart)
I dont think that I like it right here at all.
.
It is struggling under the 10 & 20 sma and that is what supported it on the way up .
At the 200sma, see the arrows, no strength to recover.
Until it gets over the 200sma, shows a sign of strength, it is a sign of weakness to me.
Thanks…. I have had my eye on it for quite a while and perhaps it’s a stock worth accumulating. They have been winning quite a few big defense and security contracts lately.
i’m good. everything’s good. ty cf & friends. {*_* } .
any thoughts on labu
Hi Manny
IBB is sitting right on the 50sma, so it looks ok if that hold. XBI is holding up even better, so the pullback seems normal at this point
XBI is about $2 above the 50-day, if it touches down there, consider buying LABU. It’s also shaping up for a 50/200 squeeze in the next 2 weeks, could coil and then blast through. Keep an eye on NAZ though.
Alex I would like to hear your take on CRK
Hi Pankef,
I think it may drop to $0.75 , nice run the last several days.It got overbought.
I do not know how they are fundamentally though, heavy Debt? The chart seems to indicate that the next buy would be around $0.75 if it drops there on light volume.
Watch the 50sma / 50% retrace , etc
I like the strength of CHK this afternoon. Fought like mad to recover the 50dma. I probably would have expected more given the action in natgas, but whatever… it dealt with a down market, and a downgrade from RBC and still finished up reasonably well, relatively speaking.
Without question, EMES was the all-star of the day…
Oh yes. EMES – the one I loved, and let go 🙂
All – any thoughts for stops on CLF? Closest serious MA support is a full $1. That’s not an acceptable stop, obviously. Or are other considering adding if we drop for another 2-3 days? I’m not round-tripping this a 2nd time, but could continue with more upside after O/B conditions are relieved.
Alex, any buy points on X? I’d love to get back in steel as you show above. Might pullback for 2-3 days? I have limit purchases already in if it fills the recent gap.
Cason….I wrote
Many are waiting to buy miners on the gap fills, but if GOLD breaks that trend line, things could take off.
I see GOLD moving higher now, with the dollar up, and I do see Miners catching a bid in the last 2 hrs.
MUX may be breaking out, many at 2016 highs ( AG, SSRI, ASM, MUX, CDE, etc ) .
My thinking is that Miners may be under accumulation in case Gold breaks out higher.
.? Ah-ha, it’s in next report and stay tuned. Got it!! Sorry that my posts are all late nite, but that’s when I had time, my man.
Sold out of TQQQ today. I mean, the SPY chart in this report looks pretty awesome, but we are at nasty heavy resistance, I was probably just too late to the party. I was up a little bit, but the chop was going to end up killing leveraged positions so I figured I’d keep the lunch money I made and save the capital for miners next week.
Alex and Pete, you guys scared me out of some of my miners today. Sold GDXJ position; made chump change (but didn’t lose anything!) – it was a bad buy point, too, especially for options. I still have AUY, EXK. If we pullback before Fed, I’m loading up!!
Why scared?? AUY and GDXJ are easy trades. I would stay in as long as it holds the b/out, or we had some other negative happen. I’m in EXK and KGC because they haven’t shown the b/out yet. Lagging or yet to b/out?? I’m hoping the latter… and AUMN i sold but for a different reason.
Still in AUY, EXK. Just less confident. Really need to watch the overbought conditions and make better entries!
Cason….I wrote
Many are waiting to buy miners on the gap fills, but if GOLD breaks that trend line, things could take off.
I see GOLD moving higher now, with the dollar up, and I do see Miners catching a bid in the last 2 hrs.
MUX may be breaking out, many at 2016 highs ( AG, SSRI, ASM, MUX, CDE, etc ) .
My thinking is that Miners may be under accumulation in case Gold breaks out higher..
Yes, I saw, thanks. My confidence got busted up a bit, but I made a bad entry on GDXJ, any consolidation was going to eat options up, it was a smarter move to reduce risk. Plus, I really enjoy messing with Pete. I’m keeping non leveraged single miners and looking to add when time is right.
If GDXJ gets back to 20-day, I’m diving all in.
Ok, wow did anyone have any TPLM? Was looking back over at stocks I had once upon a time….it was up 92% today, geez! Wish I’d been keeping my eye on that one! But I’ve kind of been trying not to have under $1 stocks in my line up….although I make exceptions from time to time…
F.Y.I.
.
NEW REPORT POSTED A FEW MINUTES AGO, BUT AN EMAIL ALERT HASN’T BEEN TRIGGERED. NOT SURE WHY.
.
.