From Break Through To Follow Through
Yesterdays report discussed some break outs that were taking place in various sectors. Wednesday, we saw some follow through in those areas too. Just like a baseball player at the plate, when we get a decent pitch tossed our way, we also need to follow through to be able to possibly score. Some may wait for a pullback or start a small position and add on a pullback later, since it is early in some set ups. Lets review.
.
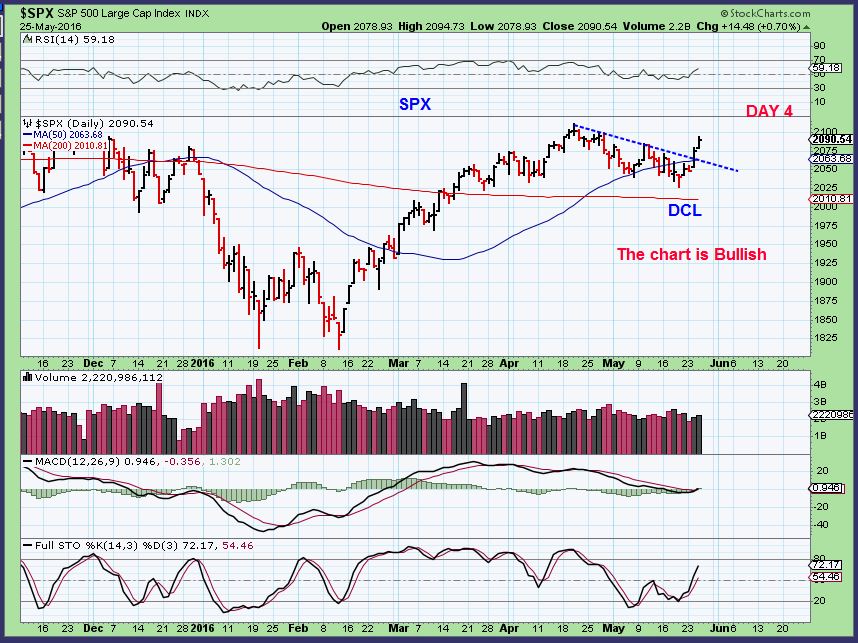
SPX – This is the follow through that we expected. We are only on Day 5 today, of a daily cycle that can last over 30 days.
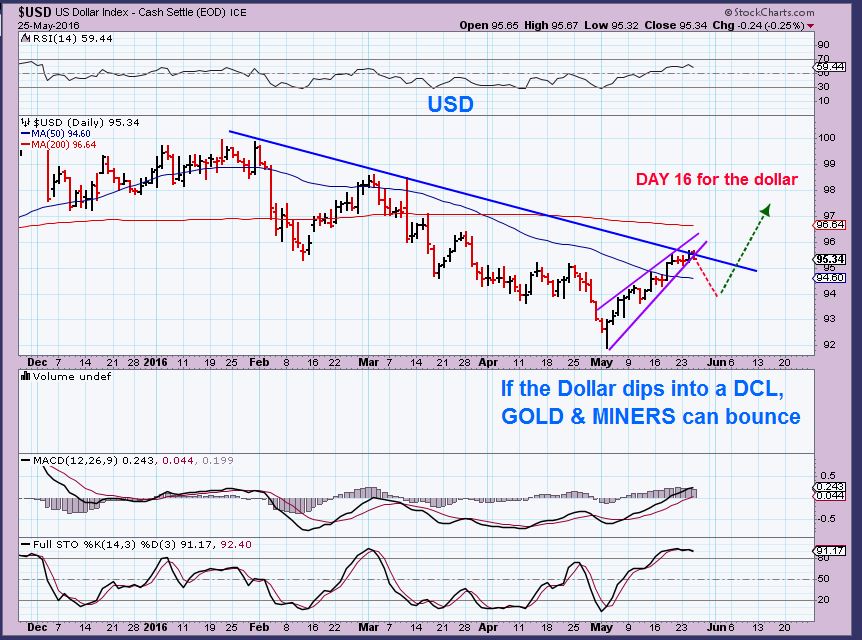
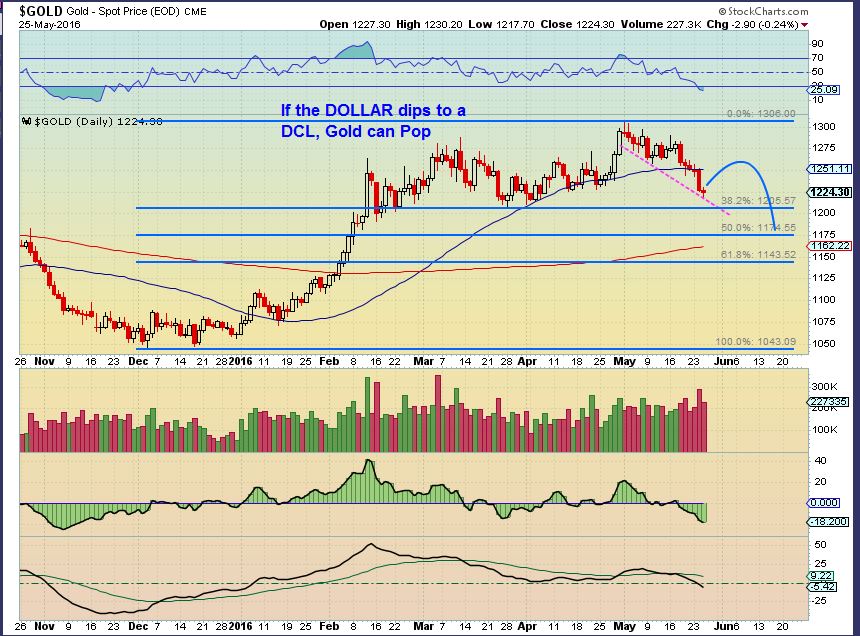
USD – The USD is at possible resistance and it is also day 16. I find that the USD cycles are usually short. They can be roughly 18 – 25 days , so we may dip down quickly into a dcl. This could POP Gold & Miners.
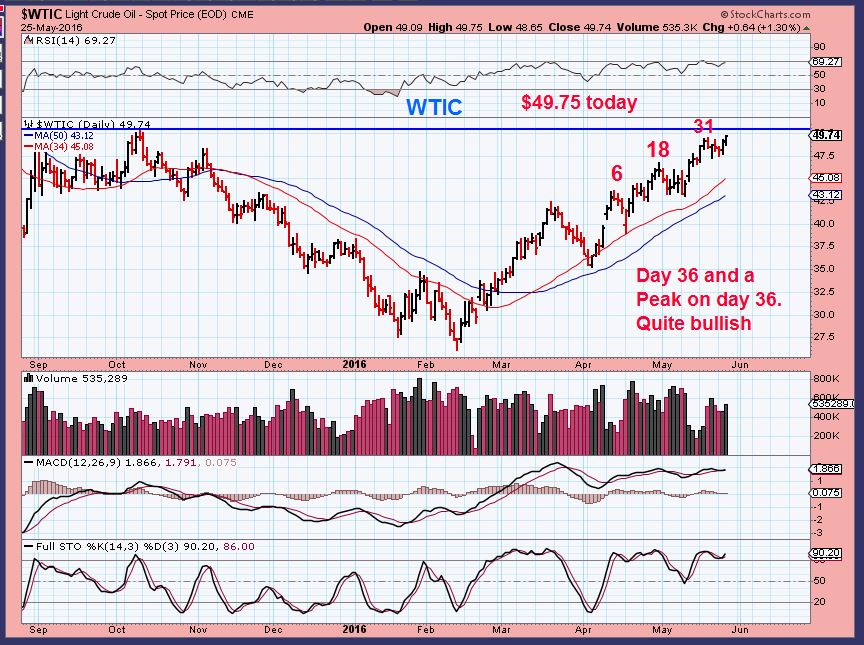
WTIC – We know that OIL cycles can be 30 – 50 + days, and being at a peak on day 36 is most likely going to lock this in as a R.T. Daily Cycle. My Oil Target was originally roughly $51.60 ish. Oil hit $49.97 overnight. It could pause in the $50 area and even dip into a DCL, and then make another leg higher in my opinion.
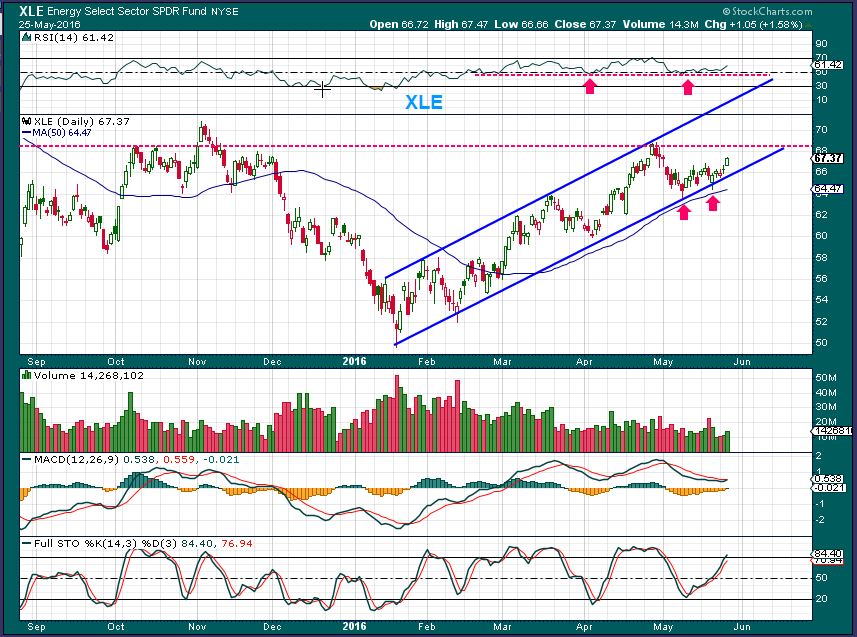
XLE – The XLE looks like it wants to continue higher, but it has been moving sideways in a resistance area.
.
GOLD – We could see Gold bounce if the dollar dips down. Using Cycle analysis, I do not think it is the start of the next leg higher.
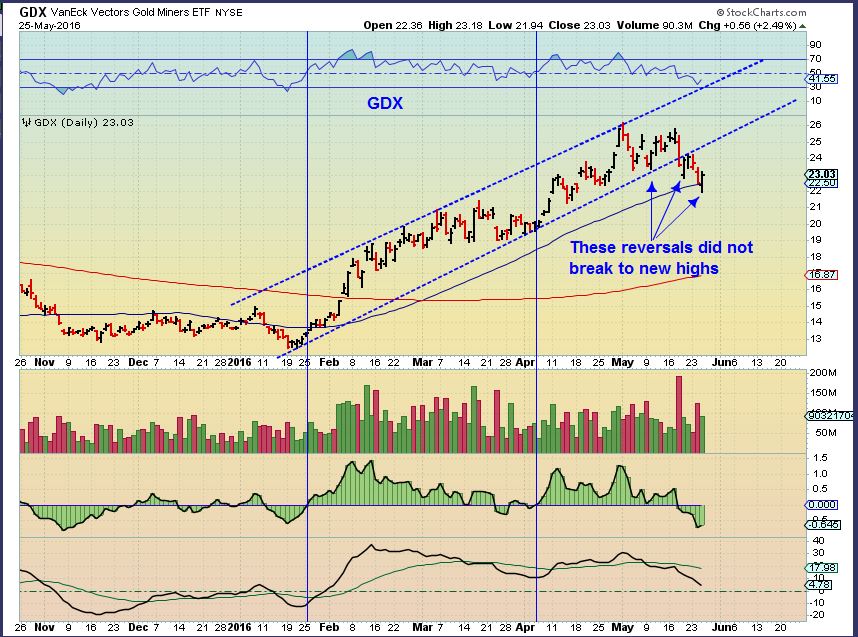
GDX – GDX reversed and closed up after opening lower Wednesday. We have seen other reversals recently too, but they didnt have follow through.
.
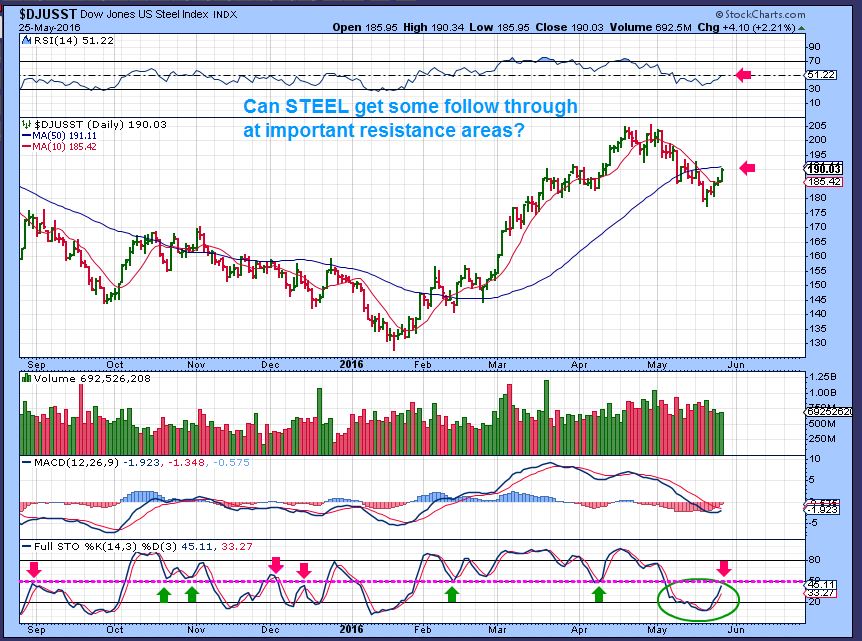
STEEL – I pointed out the bullish look of STEEL and ALUMINUM. This is one of the charts used. It created a lower risk area to enter, since we expect a move higher from that 38.2% retrace.
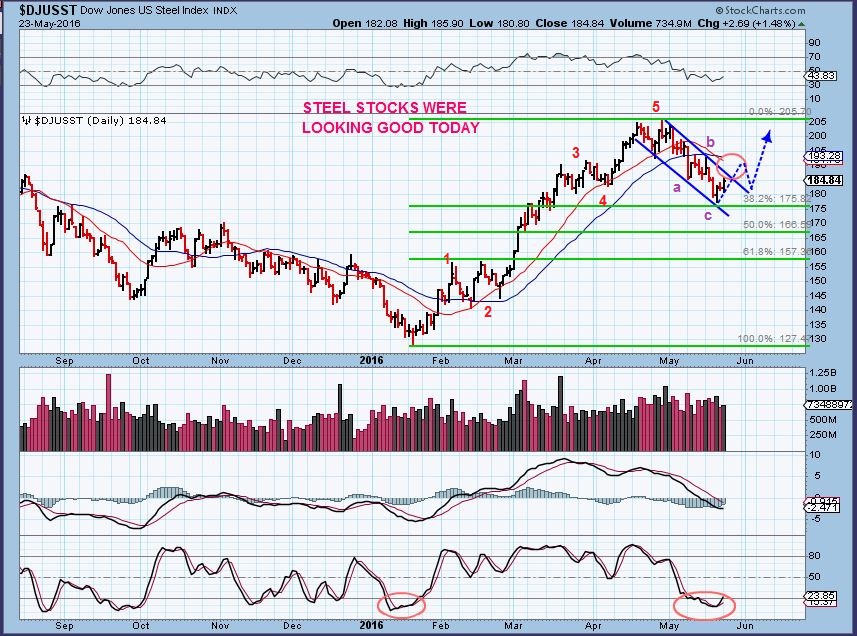
Steel did push higher Wednesday, lets see if it can push through the 50sma with some more follow through.
Some of the commodity stocks have been consolidating after their recent sell off.
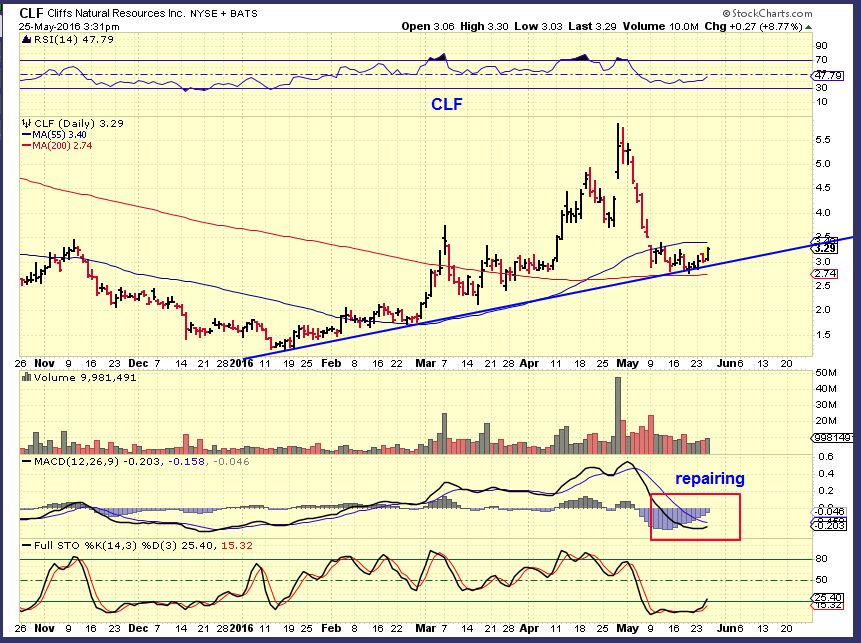
CLF – I couldn’t tell if that was a bear Flag or a normal consolidation, but I bought it as low risk after it tagged the 200sma and remained above that trend line. It can still be bought here, but we’ll see how it responds to the 50sma. It remains very oversold, so it may have some follow through left in it. Even a quick trade from the low $3 area to $4 is a good trade.
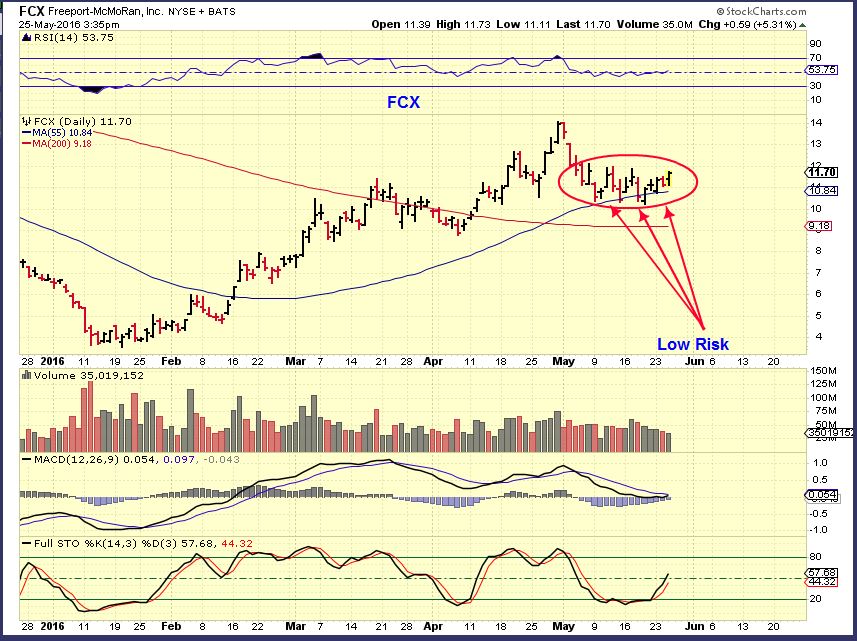
FCX-Sitting on support. This could be a good low risk entry, since it looks ready to move higher out of this consolidation.
LGCY – LGCY is being pinched here and it actually looked as though it might break through the 200sma Wednesday, but it did not have the follow through. It closed with 800,00 volume. I will add to my position is it breaks through convincingly. This is a tad higher risk.

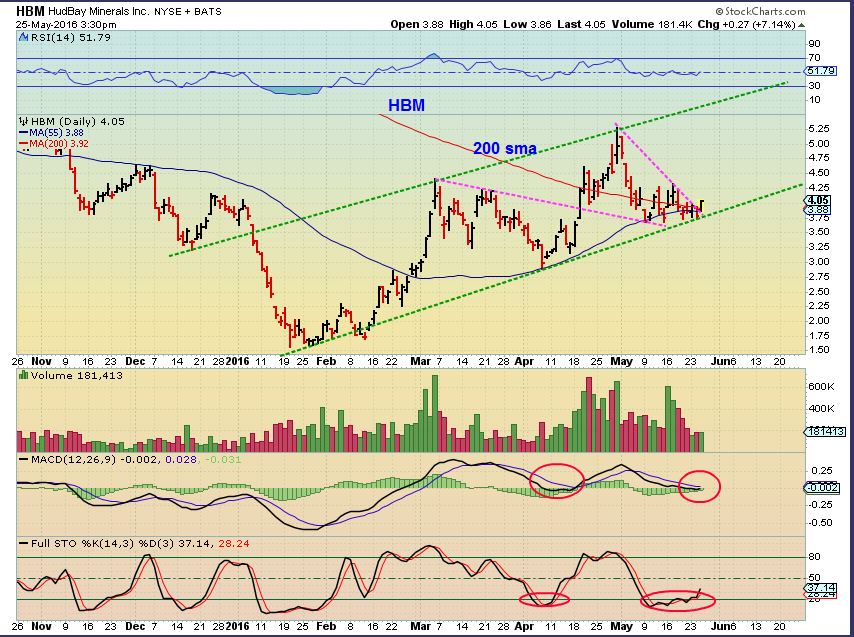
HBM – Back above the 200sma, but HBM has frustrated traders by dipping below and recovering both the 50 & 200sma. If you use a stop, it has to be a loose stop. I’m using a mental stop at this point.
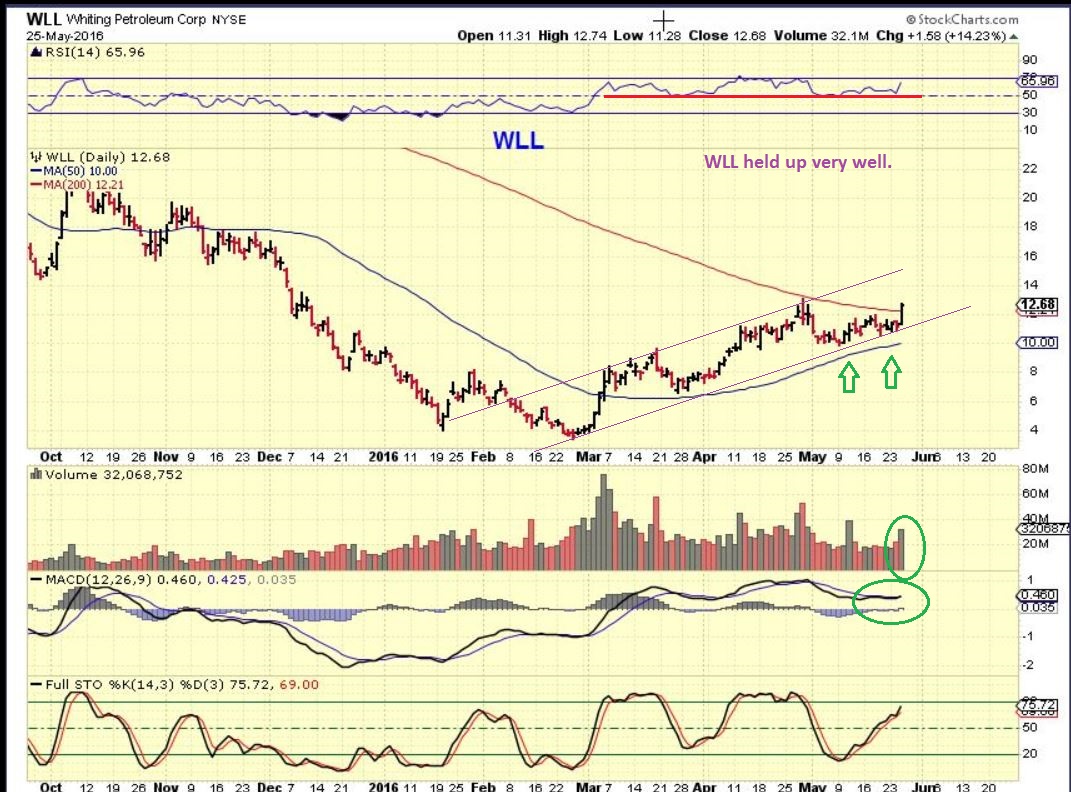
WLL – WLL broke above the 200sma Wednesday. It also never dropped enough to even tag the 50sma and the RSI stayed at or above 50% . Check the fundamentals if you are interested, or maybe just take it as a quick trade.
So that is a review of some of the market set ups and their follow through. The General Markets are bullishly set up. Oil has been following our script very well. Some of the commodity stocks that we have traded sold off rapidly and the Metals like Steel and Aluminum now look to have set up for a move higher again. GOLD & MINERS may bounce, and I know there are some traders trying to trade the bounce, we might even be seeing a DCL. I would expect a bounce as the dollar dips into a DCL, and then the Precious Metals could roll over again into a final drop to an ICL ( intermediate Cycle Low). I will continue to monitor this area.
.
For the sake of time, I will release this report near 7:30 a.m. Eastern time, and then add 2 more charts , so please refresh your page after 8 to see these. I will mention in the comments section when I am finished drawing these charts up and adding them.
.
~ALEX
I threw in 3 stocks.
.
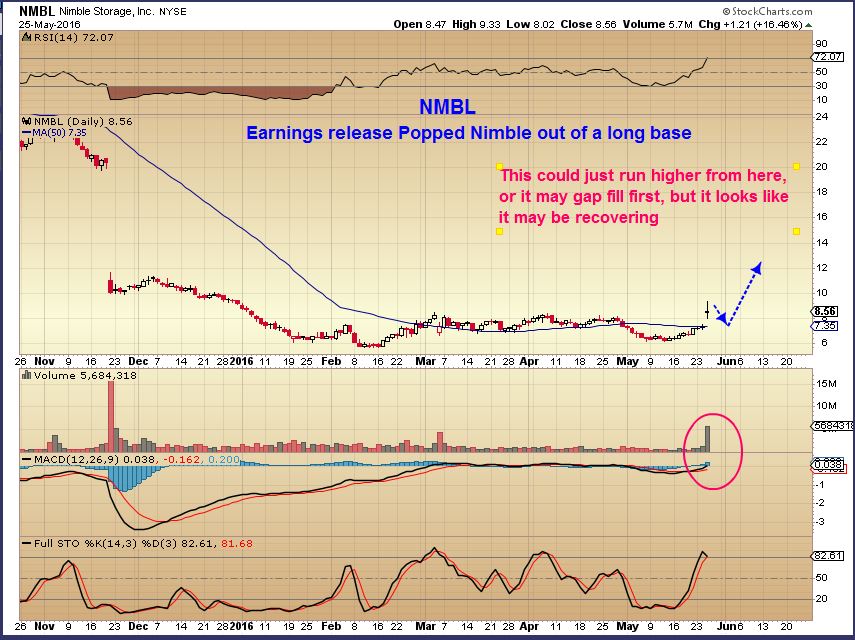
NMBL – This companies stock got crushed in November, but when they released their earnings, Wednesdays trading showed a 20%+ pop from a solid base. Its on my watch list, because even though it could just take off higher, it may dip down and fill that gap. If it does, I may take a low risk position.
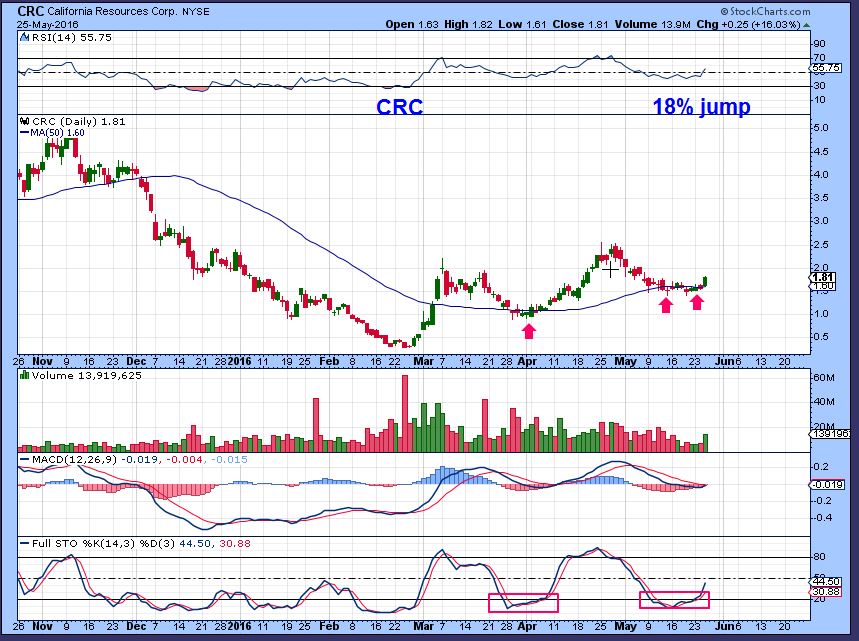
CRC – I think that this is a buy right here, with a stop below the 50sma, however.…
I do not know this companies fundamentals, and some of these companies that have high debt have run into trouble. Due diligence is recommended. That said, this has done well along the 50sma and I like this set up. That tiny pop Wednesday was 18%. It could lead to a nice short term trade. LEARN the fundamentals if you are going to buy & hold for a while, watch companies with high debt. Earnings were released on May 5th and it dropped to the 50sma.
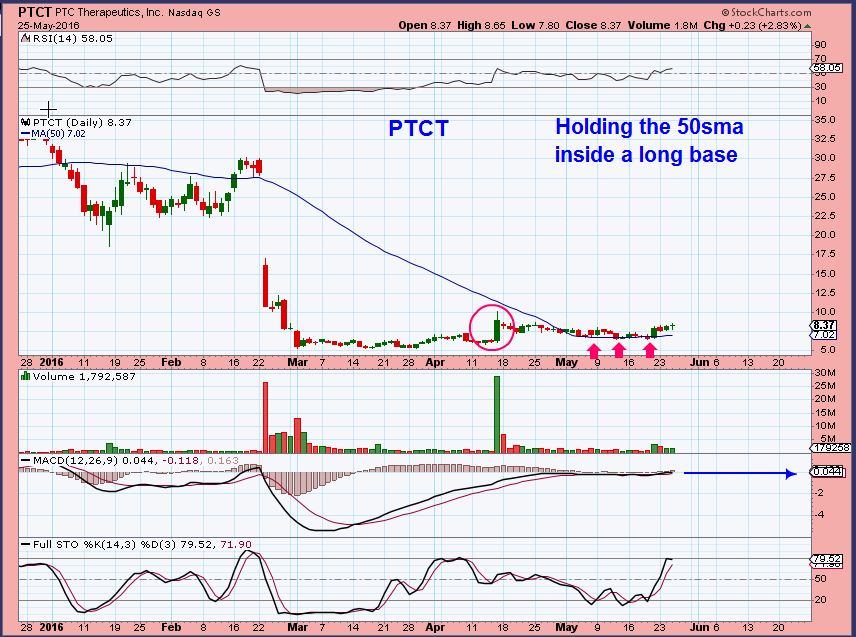
PTCT – Biotech stocks have high risk individually, but this set up looks very promising. One of our readers sent me this idea, and it is steadily holding above he 50sma. You may want to add this to your watch list, or even start a small starter position.


3 Charts have been added to the report
pre-market: CLF, X, Copper looking wildly bullish.
Alex, thanks for extra comments last night. Going long market now. Pretty long, but still have sizeable cash reserves to deploy when we get the next Miner Back Up Dat Truck signal!
When you say “Going long, pretty long” – Last night I was under the impression that you had no position.
Just an F,Y,I, – When I have no position and see a bullish set up, I often start a small position to have skin in the game, and then add on dips or other areas as the move unfolds. If you are already pretty long, just know that there ight be a small dip anywhere along the way.
If I was already long (Say with UPRO) , I might wait fr a dip to go additionally long. Often out of the lows, you do get a few days out of the lows, and then a slight dip down, and then another run.
Think of that 1-2-3-4-5 type move, and the first move up is 1, you can add on the ‘2’ dip.
Thanks for the big picture on Gold and gold miners CF. mini vacation until the next ICL……
Ur Welcome Shermo.
In the past, the pullbacks after a strong run have been fairly healthy pull backs.
I’m thinking that we get a small daily cycle that rolls over into an ICL – but this has been an exceptionally relentless move in Miners 🙂
Alex, You got your $50 oil. Fantastic call.
Thanks Rob
Next stop is probably $60. Its amazing, when we were at $26 I was looking at these price areas , and Most analysts were saying OIL would be in the teens this summer. It has been quite a recovery.
If you wanna read something just for fun, google “the economist oil cover 1999”. When oil was at the lows, I tweeted 2 articles from the economist from 1999. Everyone was tweeting back that this time was different because of the oil glut, platforms, etc… Funny thing is you could have just changed the date in those articles and it would’ve passed as oil of a few months ago. THE SAME stuff they were arguing about a few months ago in oil was the same arguments they had in 1999 for oil to go to $5. It never went there.
I get that a lot.
When I see a target and the charts are lined up properly, Timing is right , etc- I will always get discussions from fundamentalists saying why it cannot happen, just like you said. They mean well, and they are just looking at data that is available, but the markets look ahead and it shows up in the charts ( Smarter Money activity?).
I was calling for OIL $40, then $50, then $60 and I heard a lot of concerns about the Oil Glut, Saudi Arabia will force prices to $10 / Barrel to flush competition out, Gartman said Oil will never trade above $44 in his lifetime,how can you say $50 Oil? etc etc etc
We saw the same thing with GOLD. It must go below $1000, Bankrupt all the Juniors, and flush the markets clean, and you wont dare to buy Miners. We loaded up here 🙂
I have seen that the markets are future looking. They tell in the charts many times, what is coming in 6-8 months. So I listen to the markets and not certain fundamentalists. They can only see what has been, and ‘maybe’ what is currently. They cant foresee the improvement until after it happens, but somehow the markets do.
But really, look up those 2 articles. It was almost verbatim the same arguments!! Read them just for fun.
Yes, when the market is closed
AKS has been recovering nicely from its sell off.
Very nice volume in CLF and Vale for the first 15 minutes of trading.
5 million in Vale in 15 minutes, and it had 20 million all day yesterday, I am adding vale on the gap close that is happening now.
LGCY did break out above the 200sma (See chart in the report) And volume seems strong. I will add another position, but this stop will be higher than my original $1 purchases
THESE ARE JUST TRADES FOR NOW- I will watch them as they move higher ( LGCY,CLF, VALE)
Really want LGCY to close above the 200sma. It has popped above it and reversed lower in the past. The 200sma is at $2.70, $2.80 or above will be satisfying.
Thanks for your report ALEX.
Is it still good to go long with LGCY, I see it also it revered
It gapped open this morning and is closing that gap.
I would like to see it close above the 200sma, and that is around $2.70, so you may want to wait and see if it can hold above the 200sma
Thanks a lot ALEX.
EDIT TO VALE TRADE –
Look at VALE on an HRLY chart. Todays move looks very similar to the MAY 20 open- so I may watch that gap fill for a reversal higher before entering
I sold out of AKS at the open. It was my smallest commodity position. I’m still playing defense with the other larger ones like CLF, VALE, and CENX. that pop took AKS right to the 50sma. Let’s see what it can do now. That was a nice gain in just a few days. ERX is concerning me a little. Sold 1/3 yesterday because although the daily shows a/d line risig, the hourly a/d is stuck in the mud. SPY is also getting stuck at horizontal resistance. It wouldn’t surprise me to see the markets get hit soon. What I’m hooing for is that we have some kind of positive divergence in commodity stocks. A sell-off and recovery will do it. Let’s see what happens…..
Yes, it seemed like AKS was leading. That was a nice trade Peter, locking in gains is better than risking a pull back at that 50sma.
I like AKS longer term, but technically, had the bounce I was looking for off the longer term ma’s, and it is now pinned below the 50 AND, more importantly, below downtrendline. Things I’m looking at: a close above the 10 week tomorrow to come back in. Positives: MACD in the weekly has come together and touched, but not crossed over negatively. Stoch also right at 50 in the weekly. We’ll see what happens… Also, the longer term ma’s have held, which is what *should* happen in a bullish trend.
Same with CLF, as far as gapped open and hit the 50sma, now closing the Gap.
Getting above the 50sma will pull it back above the wkly 10ma
Thanks for sharing the trade
I edited the vale trade immediate after, but now there are a few comments placed in between the first post and my second one, so scroll down and read that post too, if you haven’t.
I’m waching a different time frame for the trade entry 1hr, 30 minute and 15 minute
I found an interesting article Saturday that talks about the components of the GDX. Since many here are getting their miner shopping wish lists ready, I thought this might interest you all. It ends with a pitch so you can ignore that…and I did check with Alex first if it would be ok to share this. Here is the link: http://www.zealllc.com/2016/gmq116fn.htm
I have read Adam Hamiltons articles in the past and I have enjoyed them. A disclaimer about him in case you do not know his work, they take FOREVER to get through, and he has been a perma bull for the entire bear market, but if you skim right to the middle of the article, his list of GDX components could be helpful. Showing their cost to get Gold from the ground, thier ridiculous EPS, etc
I do have a disclaimer about that. The Best companies fundamentally , do NOT always outperform other juniors. I can prove that, and may in a future report.
i’ve quite liked his articles.
but as you say.. permabull.
every blip up was the start of a new mega leg up.
he does invite flame emails, and i have obliged on occasion.. but he never responded 🙂
Yeah, I read quite a few articles from him all the way down, and every DCL was going to be the one where people were going to miss the boat.
Alex, nice call on the $50 oil. Attached (refresh) is what I drew up on the 16th. I believe we completed 5 of 1-5 EW. But I am not an EW guy and so just guessing. I could also see CD as a larger wave 1, if so, the 2-3 wave is supposed to be 1.618% of 1. That would take us to $60 after a small ABC pullback. What do you guys think, down a bit and then to $60 for the driving season?
OK, We have most of our gaps filled, can we get green by the close? : )
Anbody watch NERV? Crazy
In fact is this a sampling of the Pharma sector. Is it just starting to explode? NERV, FLXN, ALNY, CRBP?
look at AUMN right on the 200day
Alex, do an overlay of USOIL on, AA, CLF, X, VALE. Notice anything? If oil drops from here you would have to assume all these commodities will follow suit. You see it?
these rallies feel like they are up against it.
been trying to get a handle on where we are in some of the energies, with some EW patterns.
agree with your oil chart.
TVIA solar (formerly SZYM) looks to be in the middle of a corrective wave.
(usual EW disclaimer applies!)
Could be, SOG
Look at SID. I can see the 1-2-3-4-5, imagine if that was ‘A’ that followed
thats a pretty textbook wave.
SN looks clearcut also
SN is very clear. Now would you say that the A-B-C is complete, the way you see it. I can see one there, but I also know that it could be A-B- and a drop coming.
so difficult to read the ABCs, until after the event,, as you always warn us
but yes.. it could have already done the a-b-c… buttttttt …. that could just be the first abc of an A (ie. of a flat ABC)
Oh yeah, or an a-b-c-x-a-b-c .
Dont tell Maria, but I throw those in the shredder
ohhh charrrrrfreaaaak …..
SN looks to be completed ABC and now starting over? I assume.
remember though, wave 2 can retrace 99% of wave 1.
its only around the 23.6% mark at the mo.
NOOOO! I need out of this one too! And out of the red not darker red!
u guys……. such EW geeks…
When you look at Harmonics, SID is pretty clear. A little over done right now, should have turned higher at 88.6% its more like 100% right now. Should expect a 50% move higher to 2.87
50% move up….I’d still be underwater. Poo.
Should have taken my own advice on SID going to $2.87?
Big picture I see a close correlation, so what you are saying ‘Could happen’, but some ( Vale and CLF and especially X ) that you mentioned didnt seem drop in the last DCL in Oil. And then there was a disconnect of sorts at the end where OIL has gone straight up, and those mentioned already pulled back.
I see what you are saying, and so I would say that it could be. They are hitting resistance at the 50sma currently
It looked pretty close, until the last few weeks when oil went up and the others dropped.
yes, it is over a year a very close correlation . And like you said, Oil kept climbing at the end and those commodities didn’t keep up.
I’m kinda with Alex here, I see a de-coupling btw base, precious, and energy. Not some crazy inverse crap, just not an exact have to follow each other in every zag. Huge CLF, X, VALE, etc drop but miners ok. Now they are having a rough patch. All while oil and $$ are up together. Bears watching but I’m charting separately.
Look at CLF and AA with only a 200 and 50sma.
support & resistance in the short term
Alex, added to my CLF today. Just a little. Thanks for keeping it fresh, brother.
REMINDER – HOLIDAY 3 DAY WEEKEND ( MONDAY US MKTS CLOSED).
LGCY – No close above the 200sma
Maria, you see REXX Today? 20%
So a heads up, and sorry this wasn’t on my radar sooner. Yellen is speaking tomorrow at 11 am-ish, which explains why the positions I entered in the morning went south (FCX, CLF, LGCY …..) I’m holding over night, but she could easily ruin the weekend……http://www.nasdaq.com/article/close-update-stocks-turn-defensive-ahead-of-yellens-speech-cm627213
Very Good, That is the SOX, but I did not take that picture. I have a few and almost used them in the past. Maybe in the future 🙂