
Weekend Report – Bull Cycles
In this weekend report, I want to review the markets as usual and discuss where they are at. Things look very interesting in many ways. I also wanted to discuss a few things about my personal view of trading around cycles. In my analysis, many are aware that I incorporate a variety of helpful techniques. I Mainly use various forms of Technical analysis, and along with that I add Cycles, Sentiment, a little Elliot Wave and so on. In this weekend report, I want to also briefly discuss a few things regarding Cycles and some of the trading that goes on around them. To the charts…
.
SPX – As mentioned in a prior report, for the amount of time that the SPX has rallied out of lows and moved to oversold, it has had a mild pullback. Not even a 38.2% retrace yet.
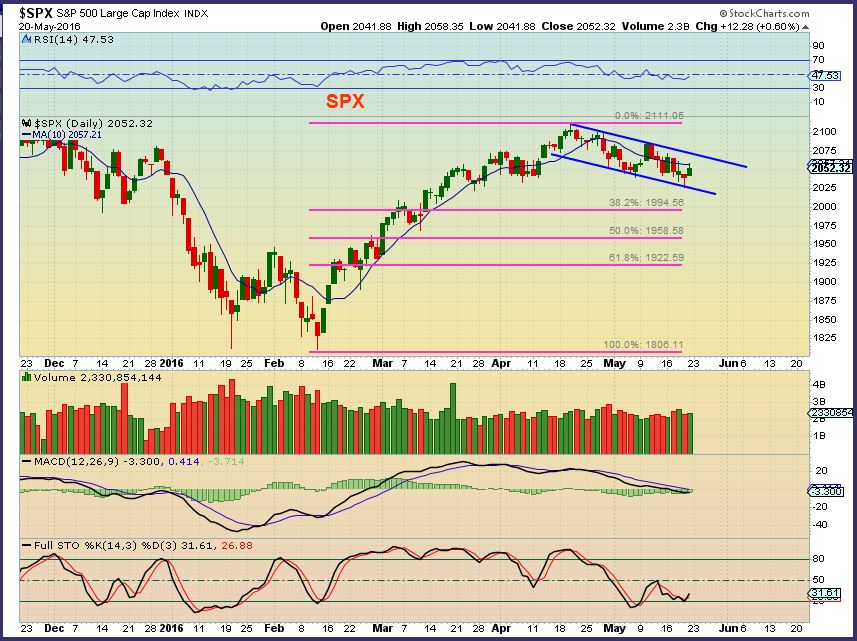
Look at the SPX here- It is actually matching an area right now that is where prior Lows were found, not tops.
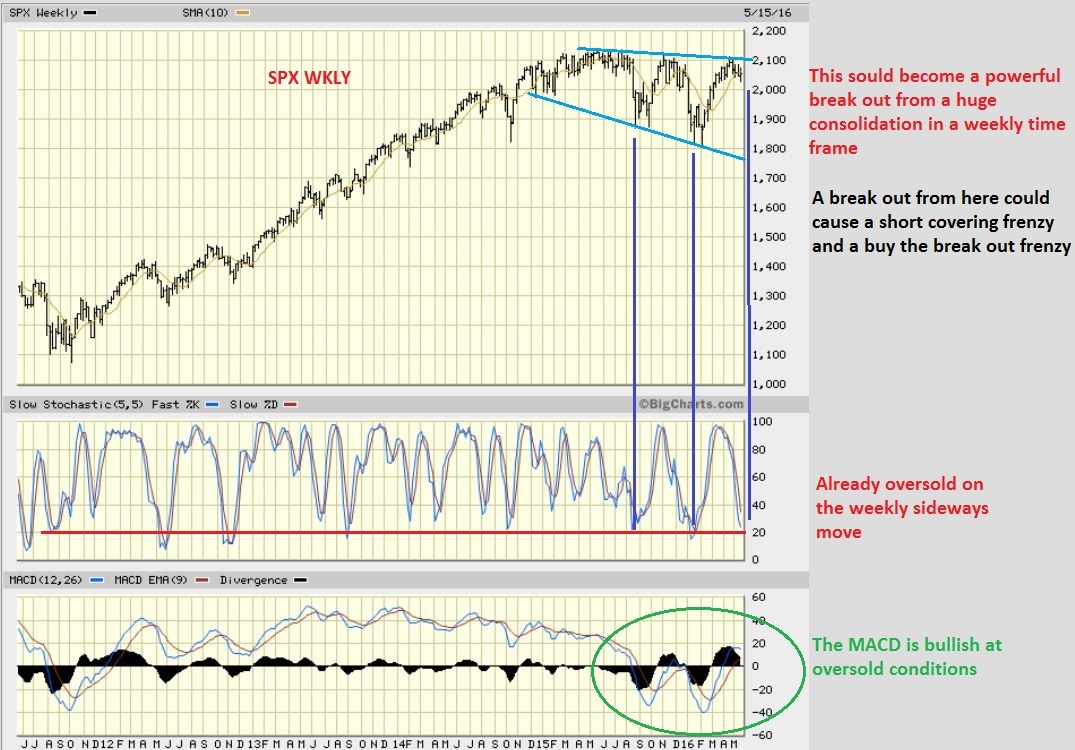
SPX WKLY – Guess what? The weekly SPX chart is a Bullish set up. That is very interesting, because most analysts are recommending sell in may and go away. SENTIMENT is bearish, people are selling holdings and even shorting the sideways move here ( Group mentality is usually wrong). They are looking at valuations and a variety of other things that are encouraging people to go short or sell. A break out higher could…. (read the chart)
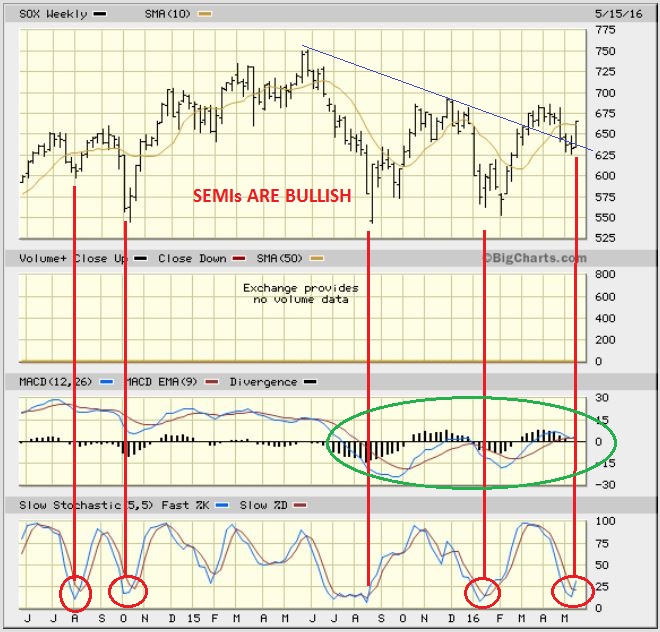
The SOX WEEKLY – Often the Semi’s lead the markets, and this is NOT leading the markets lower. The Sox index is bullish and oversold on a weekly.
QQQ- This also looks like it wants to eventually break out, maybe sooner than later.
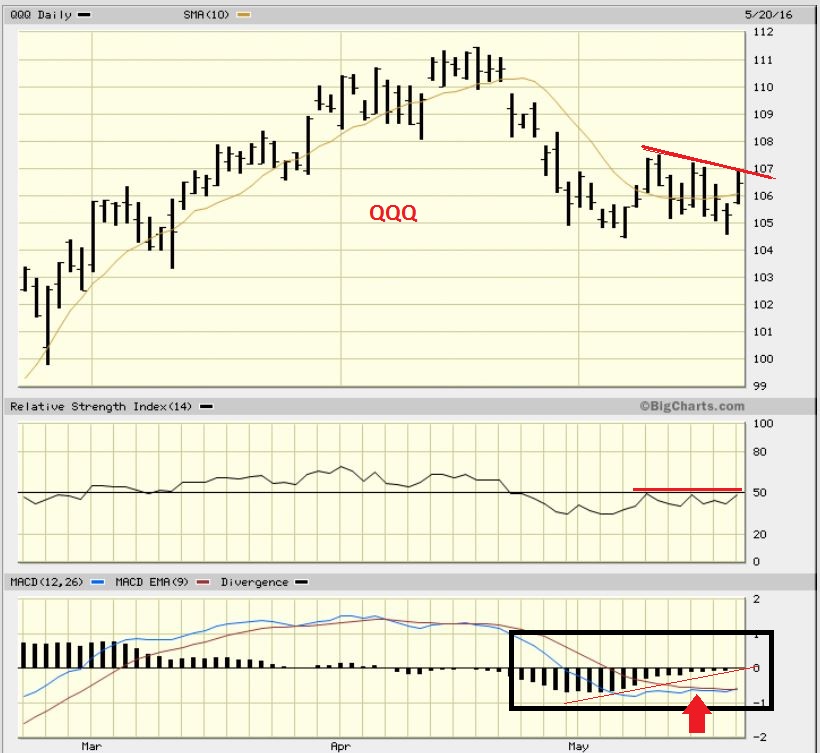
So the general markets actually look like they are lining up bullishly within this consolidation. Being oversold on the weekly charts also would indicate that a break out higher could have some legs to it ( Short cover and technical buying).
.
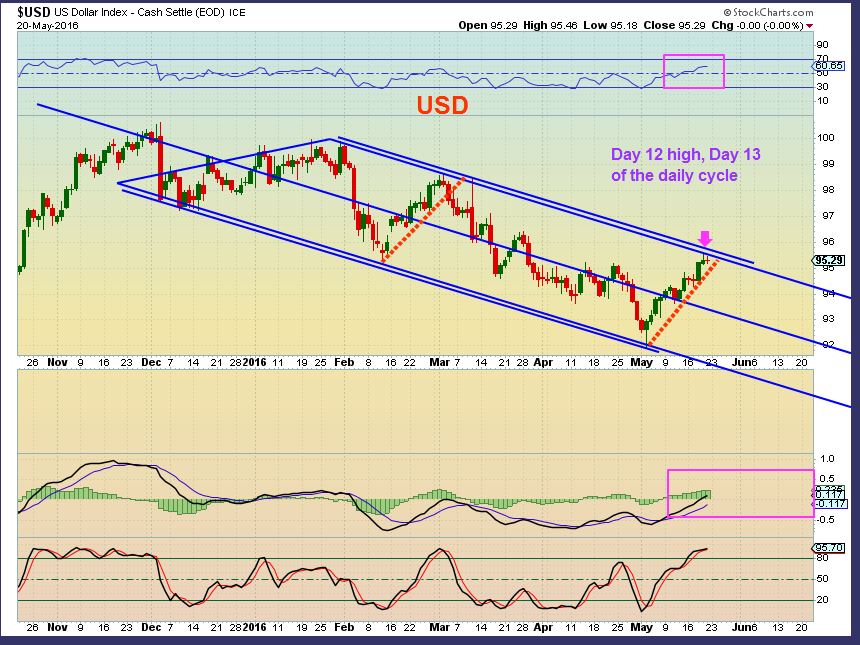
USD – We got the expected rally and it is at resistance, so it may pause or pull back into a DCL. A drop in the USD into a daily cycle low could cause a small pop in Gold & miners, but I expect a higher dollar and lower Precious Metals for a while. More on that later.
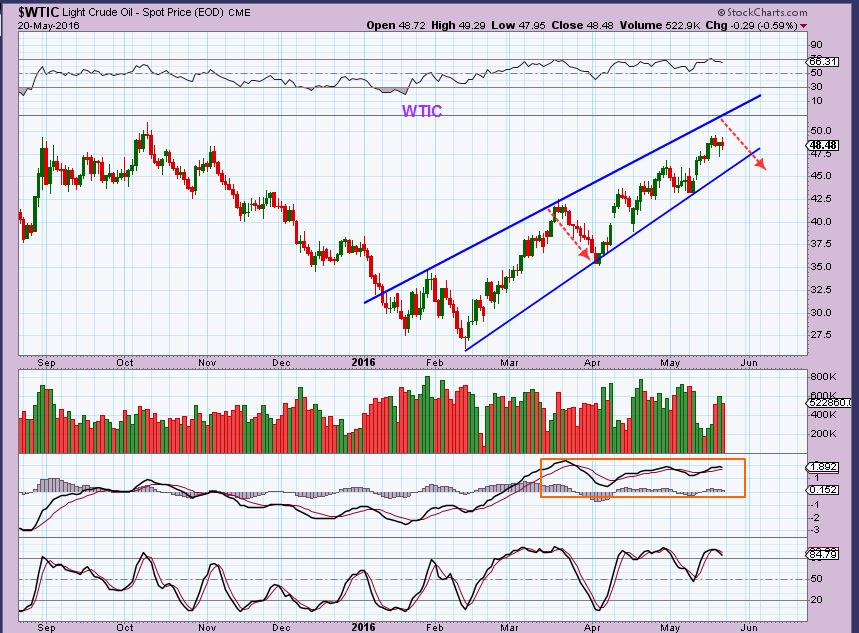
WTIC – Oil can continue higher for a bit, but is reaching the 50 area where I expected a pause or pullback.
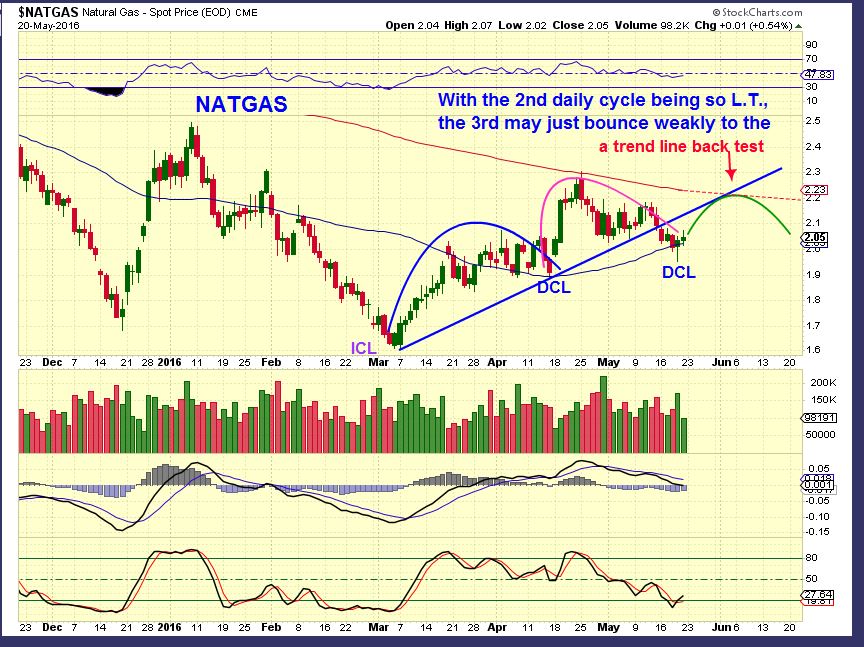
NATGAS – Oversold and possibly ready to bounce, but I do not expect it to get through the 200sma. Read the chart.
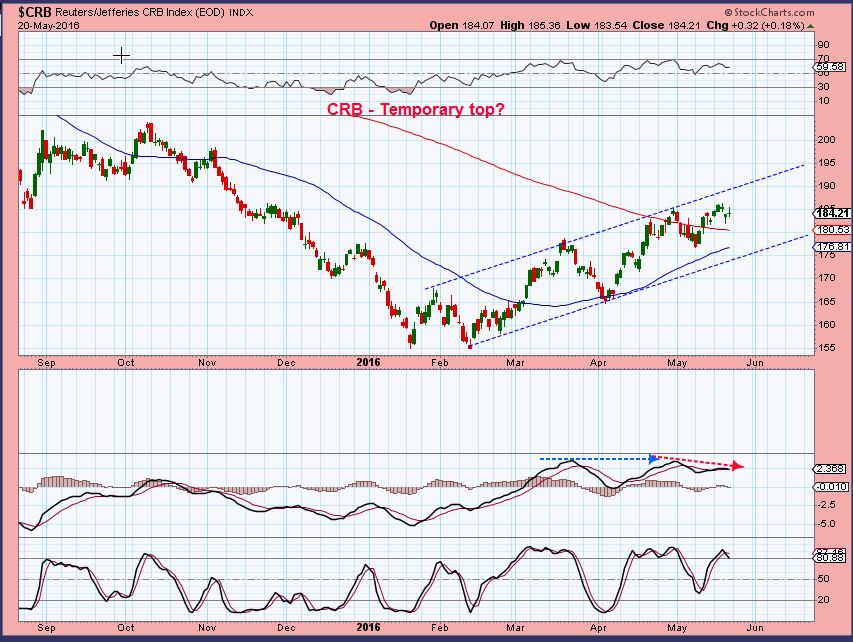
CRB – The CRB has been moving along the 200sma and basically moving as expected and stated in prior reports. I would expect sideways action for a while.
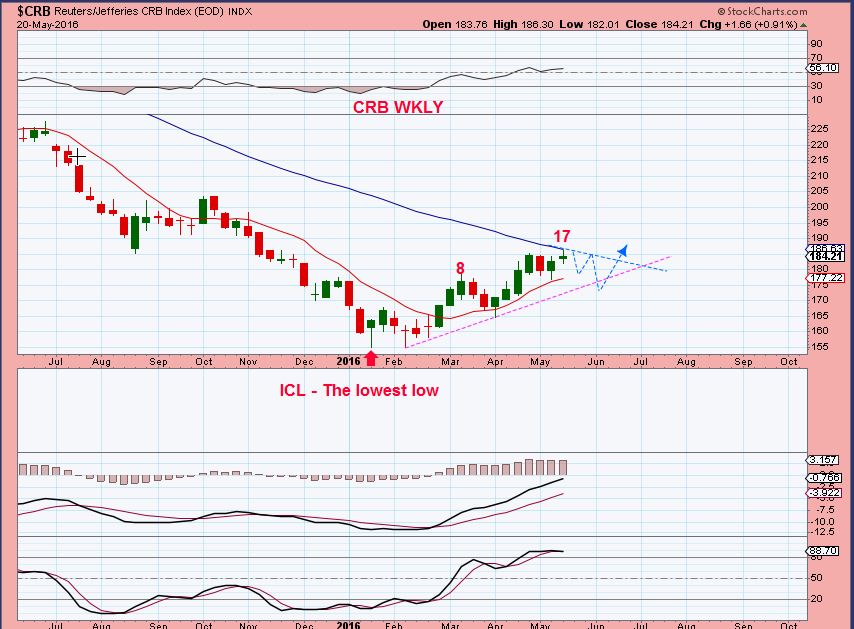
CRB WEEKLY –
.
GOLD & MINERS
.
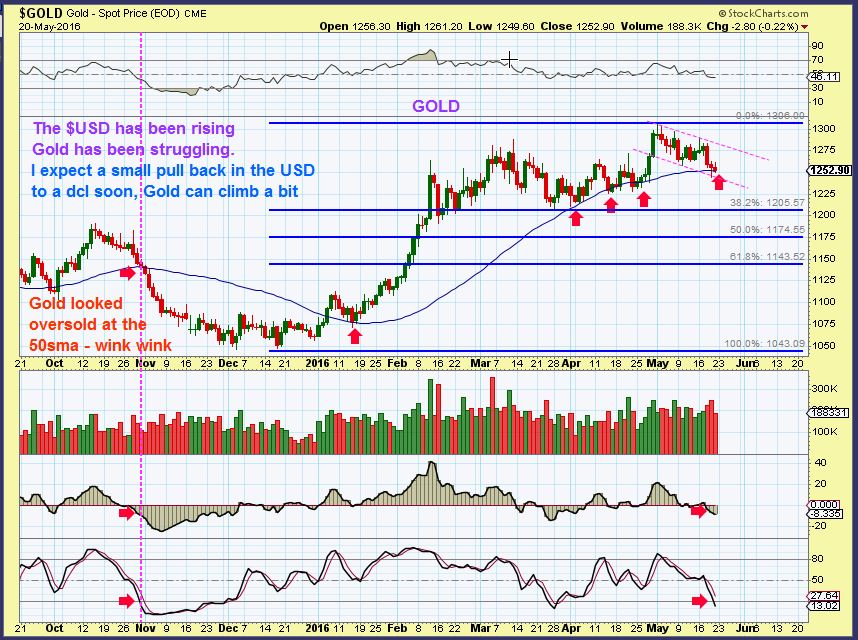
GOLD – Gold has been holding the 50sma rather well, now near $1250. The USD ran higher and Gold drifted lower. Now the USD ‘Could’ be ready to drop into a dcl soon, and that could lift Gold again, but how high? I feel that GOLD is going to drop into an ICL in the near future.
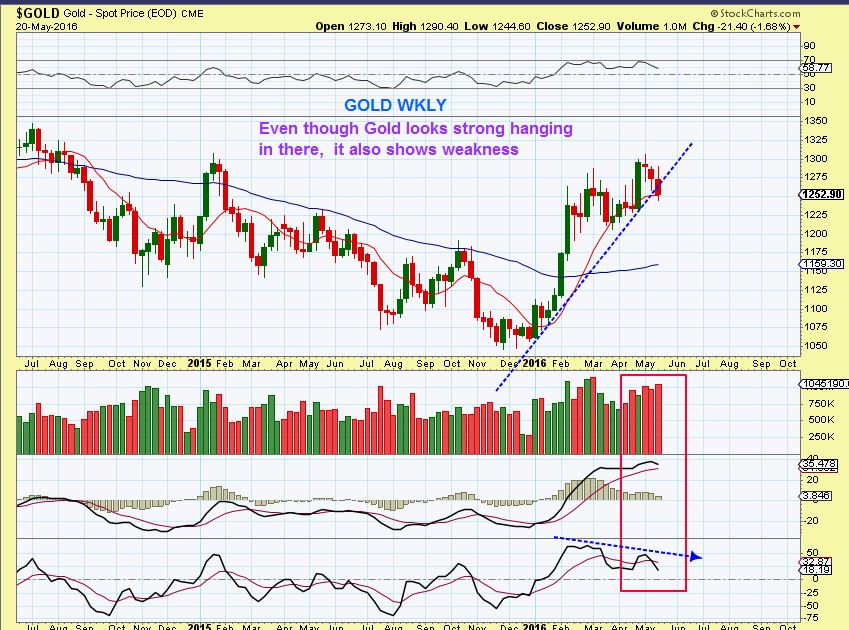
GOLD WKLY – We see a break of the weekly trend line, and this could start the drop into an ICL.
.
GDX WKLY – For Miners – If I was using E.W., I’d expect another push higher. This may not play out unless we get a dip in the $USD into a DCL.
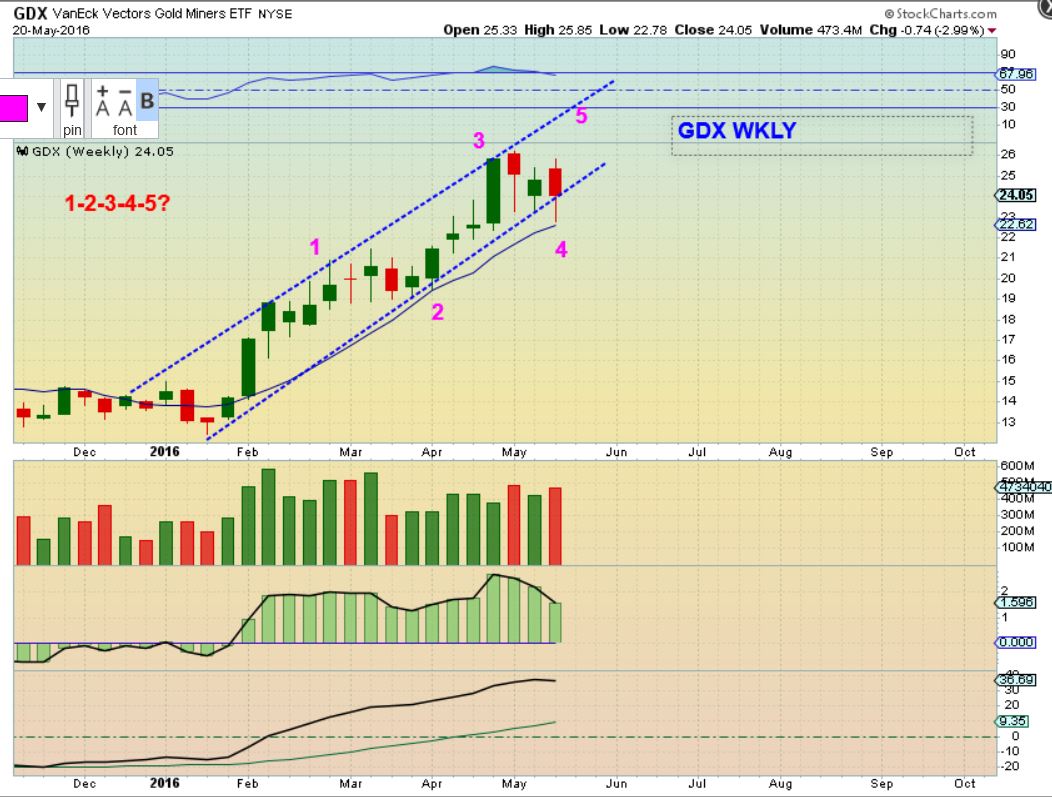
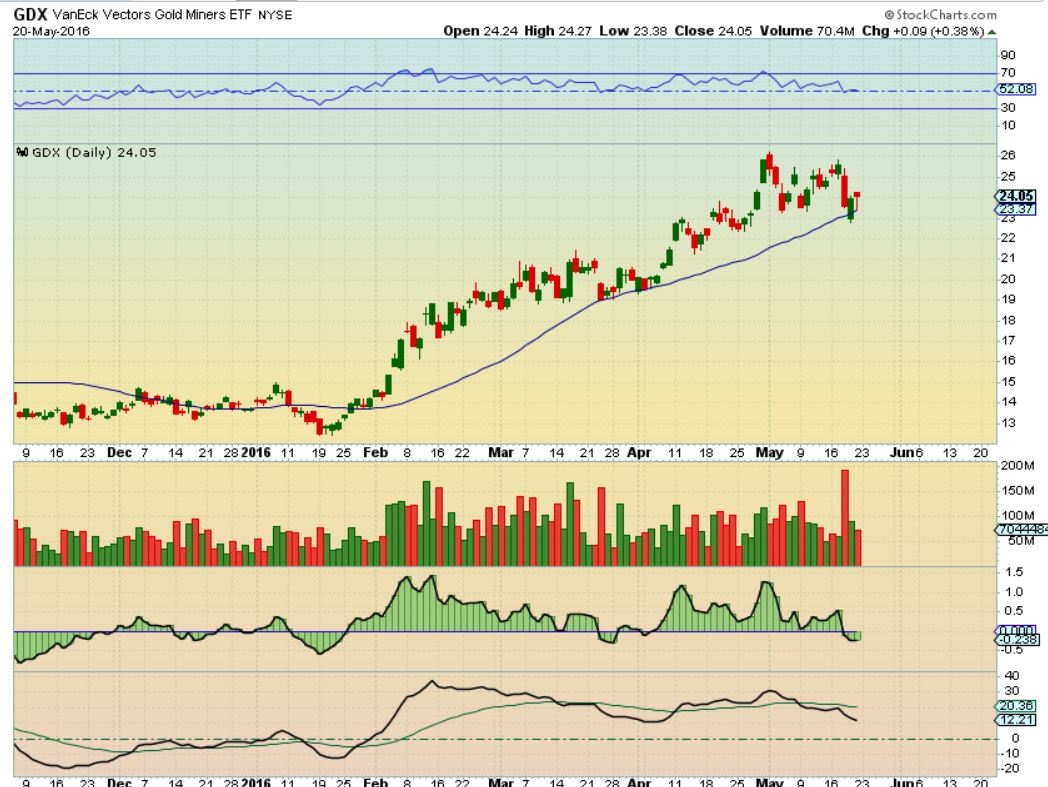
GDX – The GDX broke down with strong volume 3 days ago. It did do that in March too and then recovered, so I take note of that. Look at DUST & JDST and they had HUGE volume 3 days ago, and in the past, that has marked Tops in GDX, so I think we may finally have a top in the miners. Time will tell.
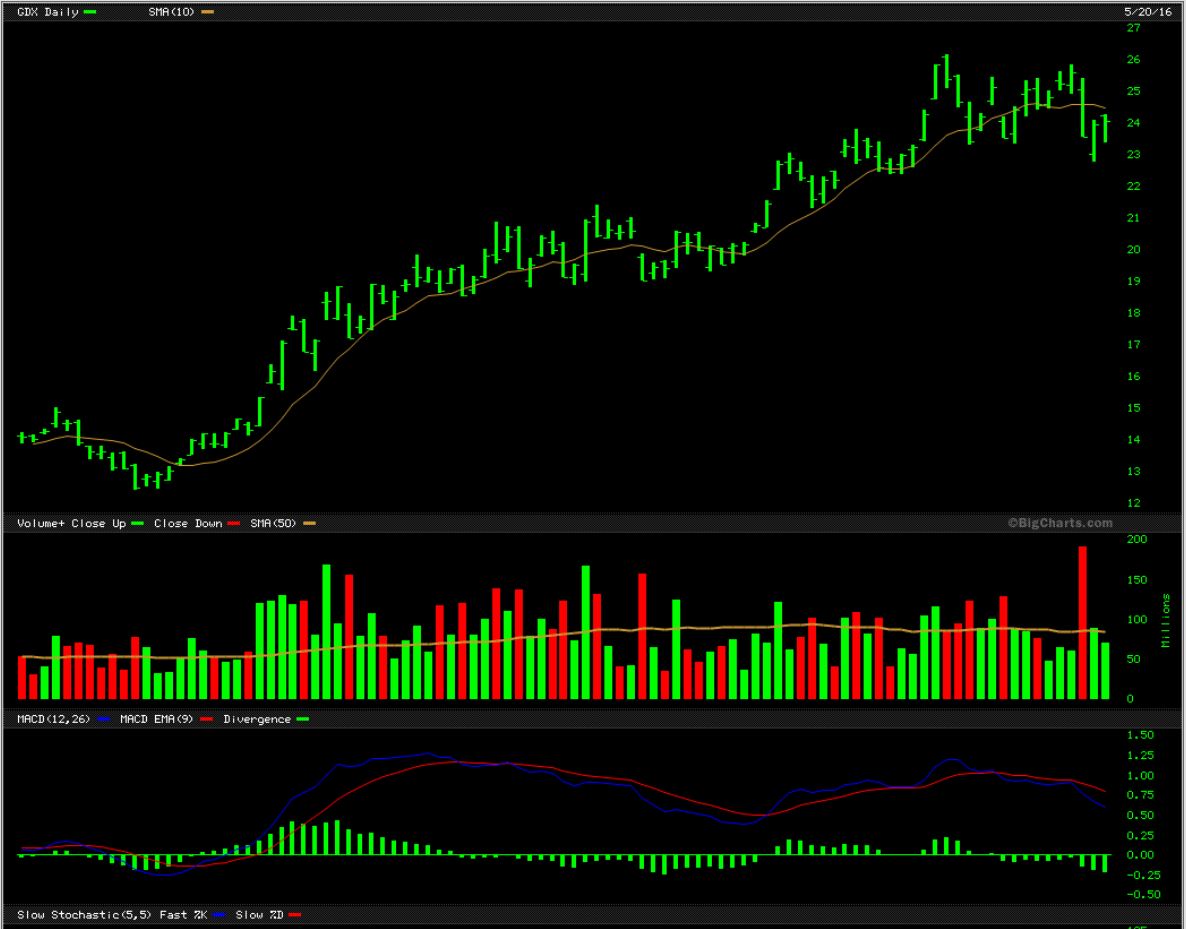
Before getting overly bearish and trying to short Miners ( I do not recommend that) note that GDX found support again, so lets keep an eye on it.
.
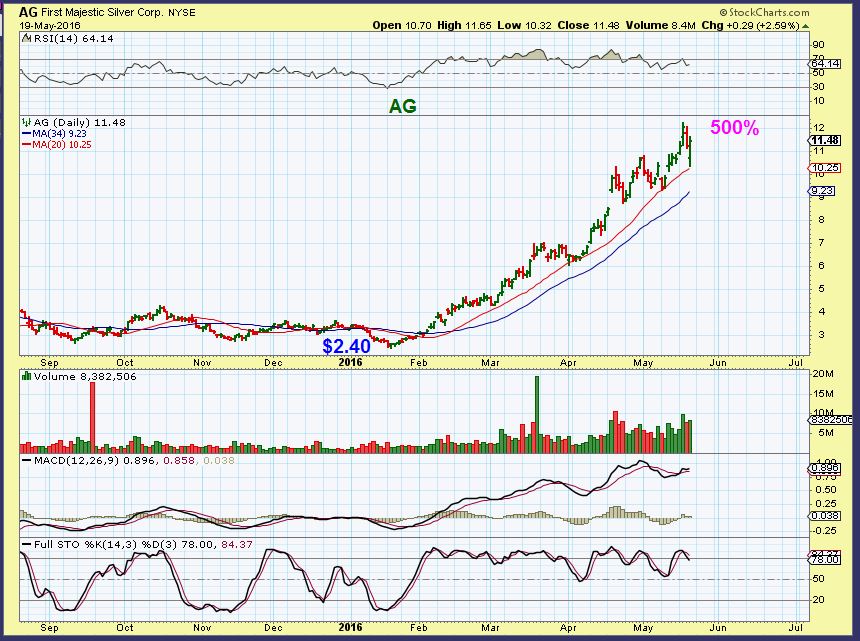
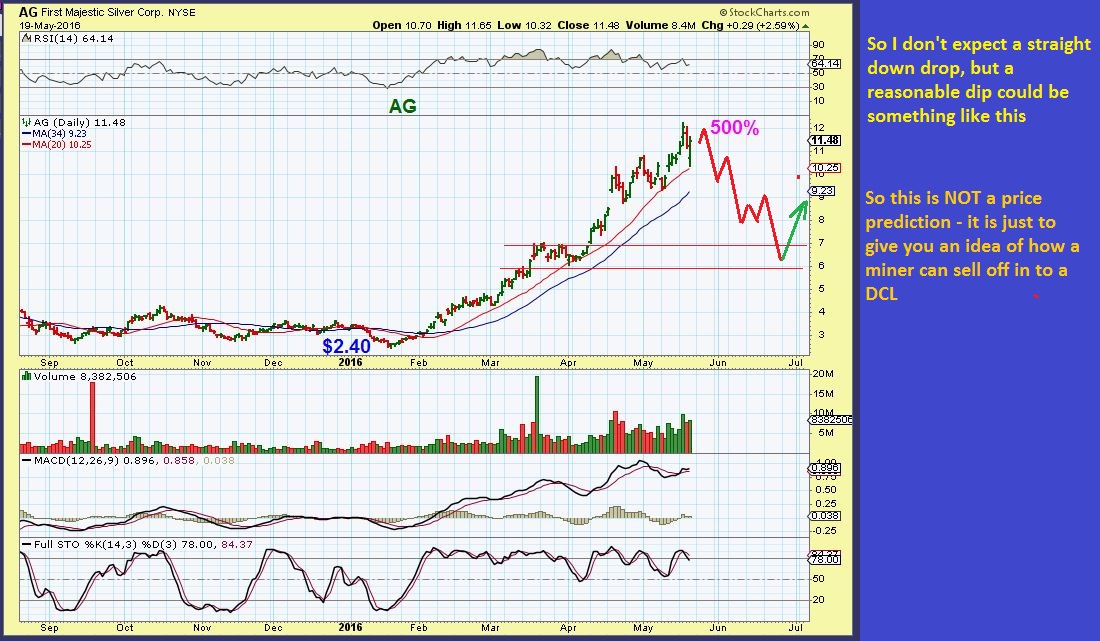
Miners have been so bullish coming out of the lows that many cannot even picture a pull back, so lets discuss that possibility for a moment. Take a look at this run in AG for example. So strong and another bullish reversal last Thursday, could it realistically pull back very much?
.
.
Well, US STEEL (X ) was a stock that looked pretty strong on its run from roughly $6 to $20+
Could a stock like X that was practically running straight up really drop all the way to the 200sma? That would be $2.91 at the 50sma.
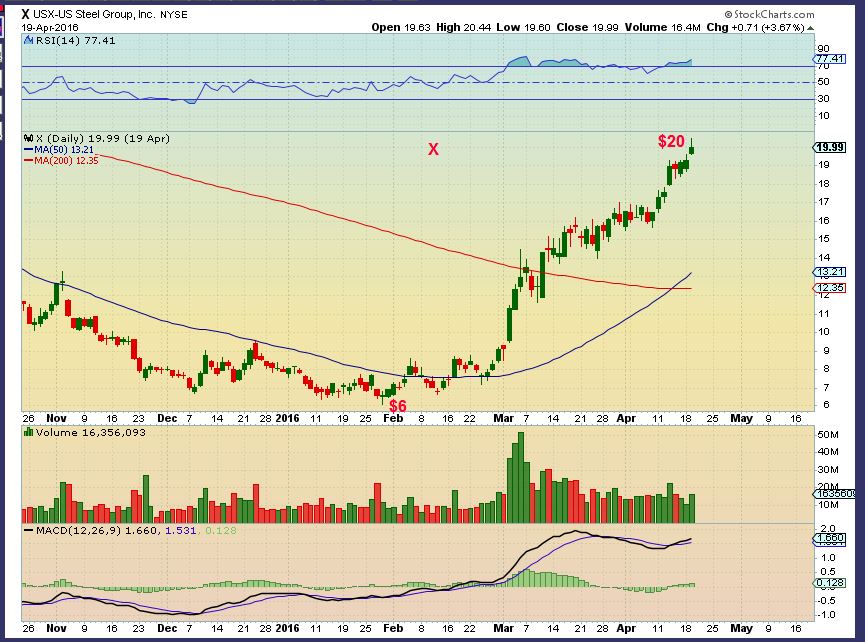
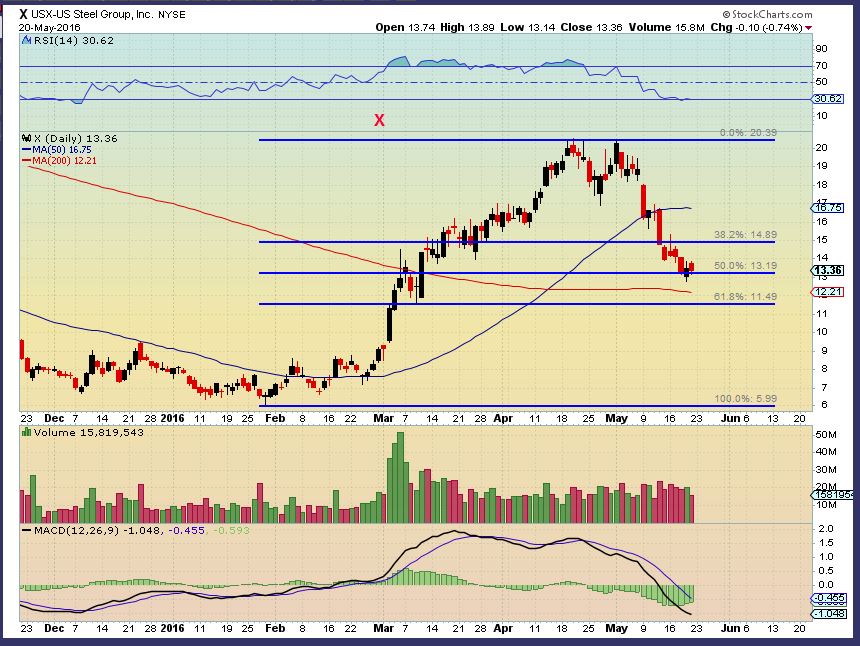
First we saw a double top, and maybe we see that in Miners if the Dollar does dip down. As of May 20 X had dipped below $13.00, a 50% pull back. This just shows how rapidly things can change when the selling accelerates.
.
SO I hope this can help to give us a visualization of what some Miners could look like when they eventually start pulling back. This will give us a much lower entry point if we can remain patient. This chart should say ICL , not DCL.
That is what I am seeing in the markets. There may be some strong opportunities in the general markets if they break out higher. They Could just go sideways for a while, so I will be keeping an eye on things. OIL and Commodities have been very bullish for the first few months of 2016, I expect a pull back that will lead to another run higher. Precious Metals have been VERY strong on their run from the Bear Market lows. A pull back will give us a great buying opportunity and I do think that one is coming, though topping can be a process. We may see a double top or a break higher and then a drop, so I still recommend patience in this area.
.
We’ll see how these things unfold in the Mondays trading. At that point we can look for more clues and go from there.
.
~ALEX
.
Read this part of the report when you have extra time. This is a basic review of Cycles and like anything else, there are exceptions to the rules. It is not a perfect explanation, but should give you a better idea of cycles if you aren’t familiar with them. This may be a bit lengthy and may need to be read a few times. I also wanted to explain how I personally try to go about trading at different times within a cycle. This could be difficult to grasp at first glance, but its worth trying. If you already understand cycles, you can skip or skim this.
.
CYCLES AND TRADING
.
– An ICL ( this is an ‘Intermediate Cycles’ low) is THE LOW of an Intermediate Cycle and the time period from one ICL to another is Roughly 5-6 Months for Gold.
– A DCL ( This is a shorter ‘Daily Cycle’ that lasts roughly for a month of trading days). A daily cycle is a bounce or rally that rises to a ‘peak ‘ and then drops to its next low. After sufficient time has passed in this move higher, a daily cycle will begin to sell off into that next low. There may be ‘false swing lows’, so we look for a ‘ confirmed swing low’ to be safe. This swing low is a bounce or reversal that moves above the candle of the lowest point, and above the high of prior days candle – to confirm a DCL it shows its strength by regaining the 10sma and breaking above the overhead down trend line, but also needs to be within the proper timing.
EDIT: If the above still sounds a bit hazy, no worries, I always cover these details in the daily reports.
.
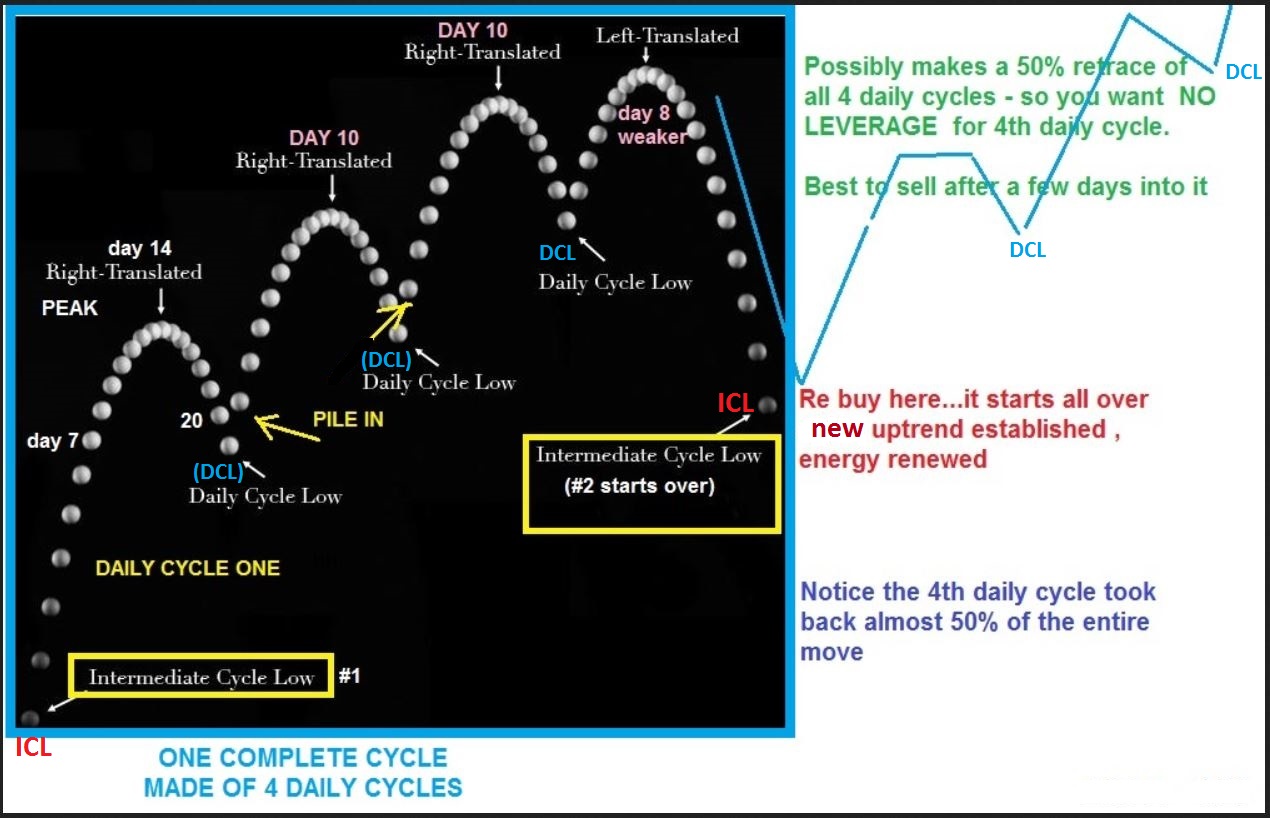
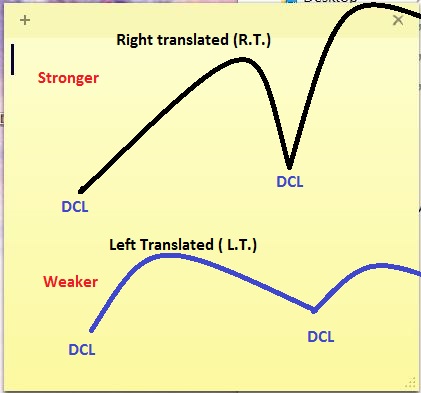
For the sake of our example: Lets discuss this as An Intermediate Cycle of GOLD 6 months long. An Intermediate Cycle for Gold can be made up of 3, 4, maybe even 5 bounces as shown in the chart below. These are DAILY CYCLES within the larger 6 month cycle. The 6 month intermediate cycle would be ICL to ICL. So below we see Gold rise out of an ICL ( Intermediate Cycle Low) and bounce as 4 daily cycles lasting roughly 17-20 days ( They last roughly 30 lately) . A Right Translated (R.T.) cycle shows strength. A L.T. daily cycle peaks early and gets weak. Read the chart.
.
1. SO I drew this example to point out that a R.T. Daily cycle peaks on the right side of the daily cycle bounce, and then usually runs higher after a dip into the dcl.
2. A L.T. Daily cycle peaks early and if you see it in the 3rd daily cycle, the 4th will most likely be weak, with no new highs. SO trading in the 3rd or 4th daily cycles requires lighter positions in my opinion.
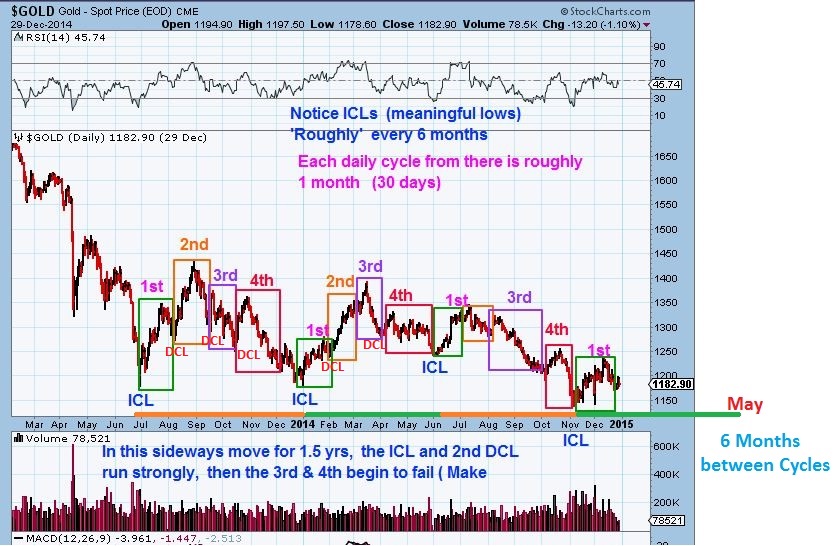
This is an OLD CHART of GOLD that I use to show how these daily cycles bounced along, and made up the 3 longer Intermediate Cycles that occurred roughly every 6 months. The point that I wanted to make is this…
-
Notice thateven in these bear market rallies, the first 2 daily cycles out of an ICL are usually strong and ran right up. See The ICL : THIS IS WHEN I GO IN HEAVY. Leverage can often be used in the first or second daily cycle, especially in Bull Markets.
-
This ‘bounce’ action is why you often here me say that I went in heavy, but I sell partials as it rises. I hold partial positions in case it does keep going, but since I expect a dip into a DCL eventually, I lighten up on the run higher. Then I can add again at the next dip (DCL).
-
With GOLD being in a bear market, The 3rd daily cycle was always at risk of being L.T. and weak – That means it would peak early, maybe by day 10 or 12. SO I would not go in very heavy after the 2nd DCL in an intermediate cycle. The 3rd and 4th daily cycle may exhibit volatility, sideways moves, and weakness, rather than being able to rally strongly. I’m more cautious in 3rd or 4th daily cycles. IN the bear market, this would drop to new deeper ICLs lows)
.
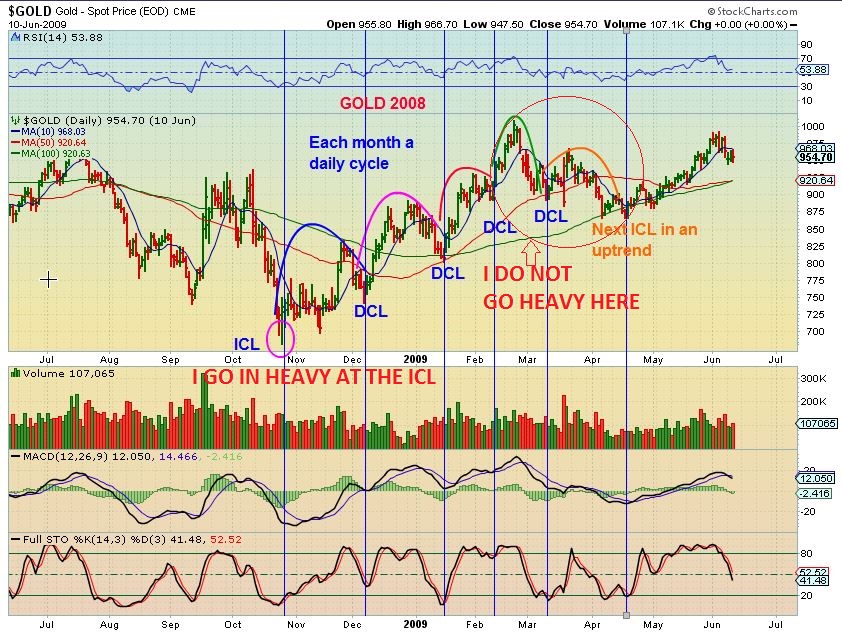
This was GOLD coming out of the 2008 lows (ICL). It would now be starting a Bull Run. You see the daily cycles run up and dip down into a higher DCL (Daily Cycle low). Coming out of this Bear Mkt sell off, the first 3 daily cycle were strong , much like we have seen on 2016. See the 1st Dcycle in blue, the 2nd in Magenta, and the 3rd in Orange all lead to higher prices and were R.T. Then the 4th in Green topped L.T. and dipped in a big way. THAT is where I think we could be at this time. SO please notice that the dip to the ICL took ‘weeks’. Patience was needed. This dip from the Peak in mid February didn’t hit the ICL until mid April.
In the past when we were approaching an ICL in Gold, The CRB, or Oil, etc. I repeatedly said in report after report that it is a deep meaningful Low that should run higher for weeks, be ready to buy it. Often times we saw a “Shake out’ move and then the run begins when none dares to buy. ICL’s have a lot of short covering and they rally strongly , like we saw with Miners and Oil in 2016.
So now maybe you can see that if I say , “We are dipping down into a DCL, and then we should be starting the 3rd daily cycle” – that means that we might be nearing the entire intermediate Cycles peak. The peak from ICL to ICL. That means that Gold, Oil, or Commodities, whatever I am talking about, has been running out of its lows for the past 2 daily cycles and may be getting tired. I take trades since surprises are to the upside in a bull market run, but not as many trades in a 3rd daily cycle and not “All in” or leveraged. Timing within the Intermediate Cycle is important to how much risk may be in the trade too. At Bear market lows (ICL’s), even old dogs will run strongly , because they are so heavily shorted. The first and maybe 2nd daily cycle will see exceptional gains . In the 3rd or 4th daily cycle, I am more cautious about trading heavily. I would rather raise cash, have a few trades on of some good set ups, and wait patiently for the next ICL. THIS IS NOT EASY. MANY DO NOT LIKE THE WAIT FOR A DIP INTO AN ICL WHEN STOCKS HAVE BEEN RUNNING HIGHER. We see this in Miners now.
.
Now go back and look at the WTIC, NATGAS, and CRB charts in this report and see if you see daily cycles.
.


Great tutorial…but I will have to do the homework later as it is a work day. Thanks
Thx Nancy – I hope work is painting a happy puffy cloud type mural : )
No clouds today..fish and undersea grasses, shells, creatures and corals. Fun. I need something pretty and lots of greens…again too much red in my account!
Nice
I second that Nancy!! I’ll have to read over the last part a good 10 times!! But very good explanation of cycles Alex. I’ll go over a few charts tonight and see how I can incorporate cycles into my style. Thank you!
Thats a good idea Peter, I’m sure that the more I mention them, the more people will see it .
I didnt mention it in the report (Many things couldn’t be mentioned for the sake of time, but I do mention it all the time in my regular reports) – Different cycle lengths are found in different sectors. I have mentioned many times that OIL really has a long cycle, it can last 50+ days low to low. Miners are often 28-33 days o in that area, etc.
awesome tutorial on cycles Professor charfreak…. :o)
This has been on my agenda for months now so thank u from the bottom of my twinkling toes for the extra nudge getting started. Will have to print it out and study it carefully ….I’m a ‘hands on’ learner u know – always loved those labs …. 😉
**hmmm.. a CF lab …what a great idea.. he he he (snicker)
Ur welcome, and maybe you’ll be able to see where some type of E.W. often fits in with the Cycles, as they bounce higher.
They are similar , like having 2 daily cycles bouncing higher out of the ICL ( 1-2-3-4- ) and then the 3rd daily cycle peaks and rolls over erasing 50% of the gains ( Thats the ‘5’ followed by a-b-c down from the top of 5.
Hope it helps a little
Good Morning all – just looking at the inflows at etf.com and noticed there is still quite a bit of money flowing into GLD. I wonder why this isn’t pushing the price of gold??????
Alex, nice report, thanks. Give me your thoughts on LABU and XBI please. Im in LABU, and I see the MACD crossing bullsih. Volume seems to be picking up.
Hi Bill,
When I look at XBI, I dont look at the ‘base’ anymore, instead I focus on a series of higher lows and it looks good. Bullish . Labu looks good
Thanks ALEX….. you are a good remedy.
Good morning Bill!! I just shared some thoughts with Cason regarding XBI. It definately has things that I like: above the 50 sma, and 100 sma. MACD cross positive, A/D line advancing with price. XBI is also right under its downtrendline from last July. But when you look at LABU, it has price above the 50 sma, BUT.. the 100 has been tough for it to crack. Thats about $1 away in LABU. So if I was buying it, I would wait to see if it can break above there. Do your own thing!! Just sharing what I see and what i would do.
Thanks Peter
Hey Bill!! FYI, took a starter in LABU a few minutes ago when it sold down to about 3% up. I think that’s a pretty low risk entry with a stop below the 50 sma (with confirm. break below mid line in cci 50), if it were to drop back there. Volume looks good. What I told you above still applies IMO, but it is a fairly low risk buy, or better than having chased at the open up 7%. I would buy the rest of the position on a break above the 100 sma. Let’s see what happens..
wish i had the cojones to buy up some of those droppers…
off the lows, in recent days, BBEP up 100% ,, LINE was up nearly 200%
I saw that too, but the drops were jaw dropping 🙂 I remember you mentioning that you owned Line at one time. Even CJES got some traction, but they could be short covering.
There is more talk of FED raising rates in June, seems it might actually really happen – so that would likely mean a drop in oil prices (as well as gold?)……? I’ll be treading lightly I think….anyone have any other thoughts on rates?
Thanks for the extra info on cycles. Cycles are new to me, so I appreciate the extra info.
Glad it could be of help.
It takes time to see these things in the markets and I dont think it will be an obvious “DING- I GET IT” on the part of everyone right away, but as we discuss things going forward, I think the picture will get clearer.
Thank-you Alex for your explanation about Cycles, I understand It better the anytime before, only what I don’t grasp 100% is the R.T. and L.T. Daily cycle.
As you explain the R.T. and L.T. goes down. How come?
THANKS ALEX for all your work you do for me!
They both drop because they need to eventually go to a DCL.
The R.T. goes down into a DCL, but then it is more likely to bounce to a higher high on the next daily cycle.
The L.T. is weaker and after it drops into a DCL, the next bounce higher may not go to a new high, it can just pop and roll over quicker.
Both drop eventually , just because they will drop into that DCL in time, but how strong they will be on the next bounce often depends on whether it was R.T. or L.T. on the last run.
Hope that helps Guert.
A lot better Alex, still what I don’t get is: How can we see at the top if it’s a R.T. or L.T. Thank-you again for your time.
You dont know at the top, you know at the DCL
Hi Guert. The way I visualize Right and Left translated cycles is any cycle that peaks before the mid point is left translated and after mid point is right translated – so in a 30 day cycle the mid point is Day 15 and if it peaks before day 15 it is Left Translated. Of course, as Alex has said, you don’t know the mid point until you know the total number of days in the daily cycle from low to low.
Thank-you Conrad? Great…. nowwww I got it !!!
A big hug from Geurt.
THANKS CONRAD !!!
Aw, crap. I didn’t see your reply so I wrote the exact same thing 8 hours later. Oops, what a waste. 😛 oh, great answer btw!
Guert, find an entire daily cycle from low to low. One that is already completed. Draw an imaginary line right down the middle. For example, if the cycle is 40 days, draw at 20. If the cycle is 30 days, draw at 15. If the high is LEFT of this imaginary middle point you have L.T. and expect weakness ahead. If the high is to the RIGHT of this line, you have R.T. and expect another strong run!
Cason….. thanks man for your respons.
Many people on board by CF are helping me greatly.
I’m blessed here with Alex and you guys.
Have a relax evening and sleep well.
Yeah, man, no problem, always willing to help.
You still trading Bio-techs. I know that at least Bill and I are trading LABU.
Yes… I still have XBI. Last week I sold (to early) LABU.
I think we will go higher from here with Bio….
See you tomorrow.
I added to IPI this am. It looks like a tag of the 50sma and a higher low on that pull back 2 days ago on a daily chart.
The 15 minute chart looked good to me
I am still mostly in cash ( over 50%)
CLNE kind of slowed down and became lack luster in a sideways move , but looks a bit better today with nice volume
Why mess with CLNE with the entire sector taking a beating. Its only a matter of time.
CLNE is liquid NatGAs and other clean energy fuels, it may do its own thing and the set up looks fine.
DQ set up looks great too.
BAS. Ugliest chart I’ve seen. I’m calling now she’s the next bankruptcy
We should have a pool?
I’ll take REXX to go out before BAS
AMAT looks interesting
Happy Victoria Day to all the Canadians at C.F. and Alex. I am surprised you didn’t mention as you are an honourary Canadian citizen. 🙂 Alex and I have know each other for a while.
Well I’m a bad honorary then, becuz I have to google Victoria day 🙂
I hope you have the day off from work, but not the markets – enjoy!
thanks
oh my.. i have a wicked headache just lookn at that ;o) Tooooo many trips to the 1000 Islands back in the day… whewww hooo! Happy Day Rob
no comment….
Thats a first and a blessing
HA!! HA HA!!
… your special, one time only gift for all your Hard work
yup, I see that was just a short lived ‘first’
Zing!
Victoria Day is also commonly referred to as the “May two-four weekend” or the “May long weekend” and it marks the unofficial start of the cottage season where cases of beer* are consumed by hard working Canadians. That’s what we heard anyway. Or maybe it’s called May two-four because May 24, 1819 is Queen Victoria’s birthday 🙂
You are correct, Bill. cottage season begins today and copious amounts of beer is consumed.
Speaking of Cycles, would you think we are on the 4th DC on the energy sector XLE? Im thinking the 1st DC was 15 days, the 2nd was 35 days, and the 3rd was 23 days.
ALEX or something others: How looks X (Steel) in the charts ??
Thank-you.
Geurt, Looks good to me here. Looks to found support at the 200sma and moving higher. RSI and %R are both oversold and turning up. Stochastics has a buy signal. MACD curling up also. Looks good.
Thanks Bill, I bought just some of X.
You are always willing to help us (me).
Have a great evening Bill.
Well good luck Geurt
CLF and AA also looking similar
I am a little hesitant, but all of the metal charts look like they are turning up and just below their 9/10 MA. Waiting to see which break, one way or the other..I was thinking of what WW used to say on Polys site…about picking the low hanging fruit . AA AKS CENX CLF HBM PKX STLD X
Whatever happened to WW?
he hooked up with this chick named W .. and together they created many URLs…and lived happily ever after….
clever girl!
I only knew of him through the trading sites. Always the first to offer advice. Very inspirational. I kept waiting and hoping he would post again.
As you know, he had health issues and he literally seems to be up 24 hrs a day trading 🙂
That may have caught up with him, but no one seems to know for sure. He just disappeared.
I was on Polys site for a few years. WW was insightful with his knowledge and use of MAs. I know he was in poor health. It was feared that he passed. Lets hope not.
Good ole William W.- he never came back ,huh? he was a FAST trader and I enjoyed chatting with him. I always feared that he had the troubles with his ticker, because he just stopped replying to my emails . He NEVER did that before. : (
Alex, Thank you for the weekend report and all the cool chart info. I really appreciate you sharing knowledge.
Alex, so what criteria have to be met to determine if it is in fact the DCL and not just a mild correction, or what criteria determines and ICL? A low below a trend or prior low? For example, your DCL on the nat gas chart above in april was preceded by a small peak and correction in April which was even a lower low than your DCL in April? What do use to determine what and which are cycle lows? And why is April the DCL and not March? Thanks for the time on this also btw,
Thanks for the lesson!
Still like IBB/XBI here but sold out of 2/3 of LABU this morning. Trading around it to attempt to lower cost basis. Or it just goes higher and I sell the rest. Win/win.