
Wednesday May 18
FOMC MINUTES RELEASED TODAY, that can affect the markets , since they seem to be at pivotal points. I have a lot to discuss for a Wednesday, so lets get right into the report…
.
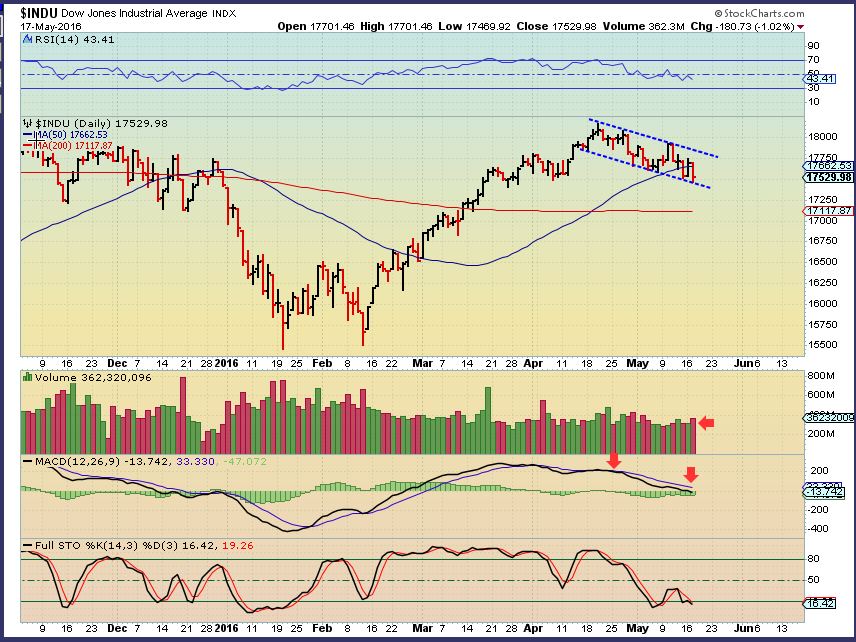
DJIA– I usually use the SPX, but they are similar right now. POssibly dropping to the 200sma, but ‘time’ is important here. It really needs to move higher sooner than later cycle -wise.
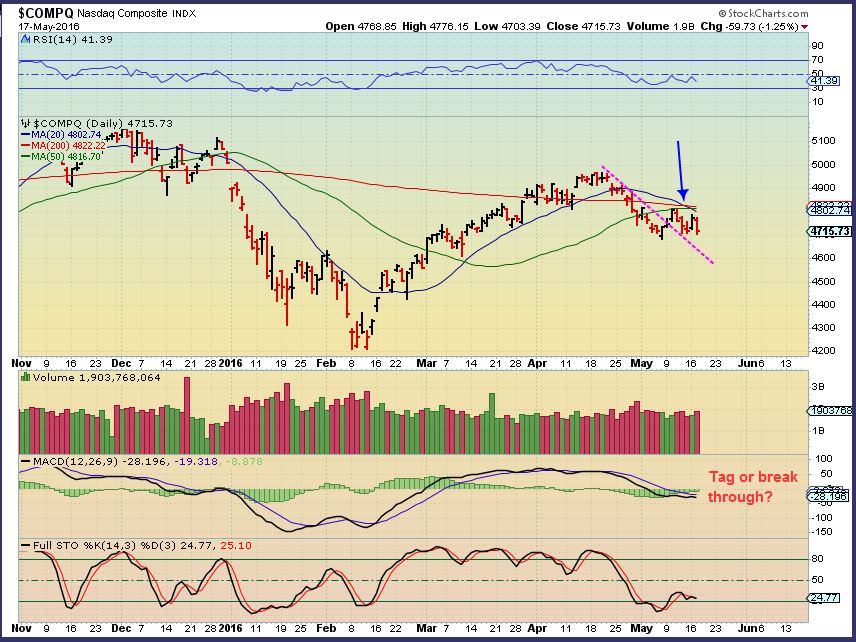
NASDAQ – The NASDAQ has heavy overhead resistance. This just isn’t a bullish chart at this point. It has weak relative strength and the MACD is curling down. FOMC MINUTES released today might save or sink this in my opinion.
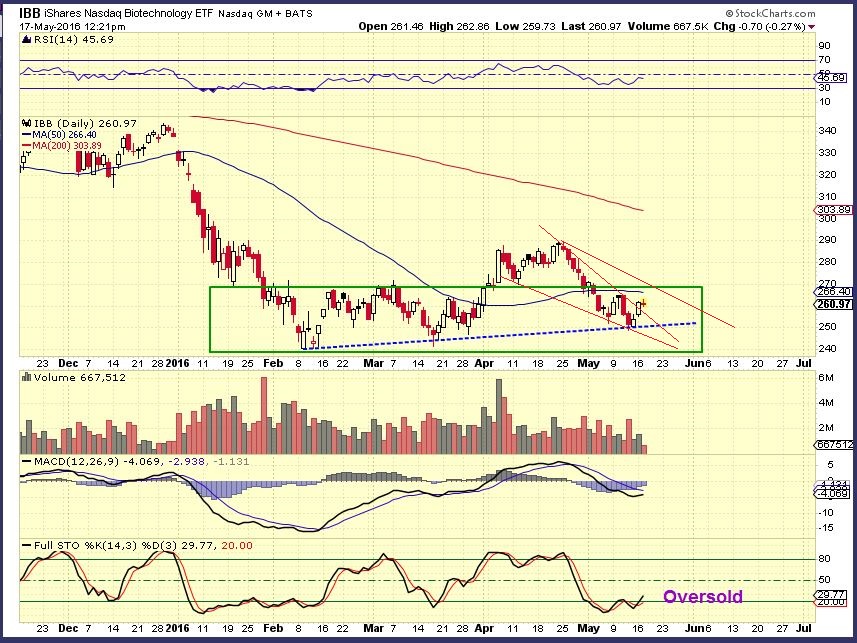
IBB – Oversold, Higher lows, MACD improving, etc . It is back inside of its base. Worth watching.
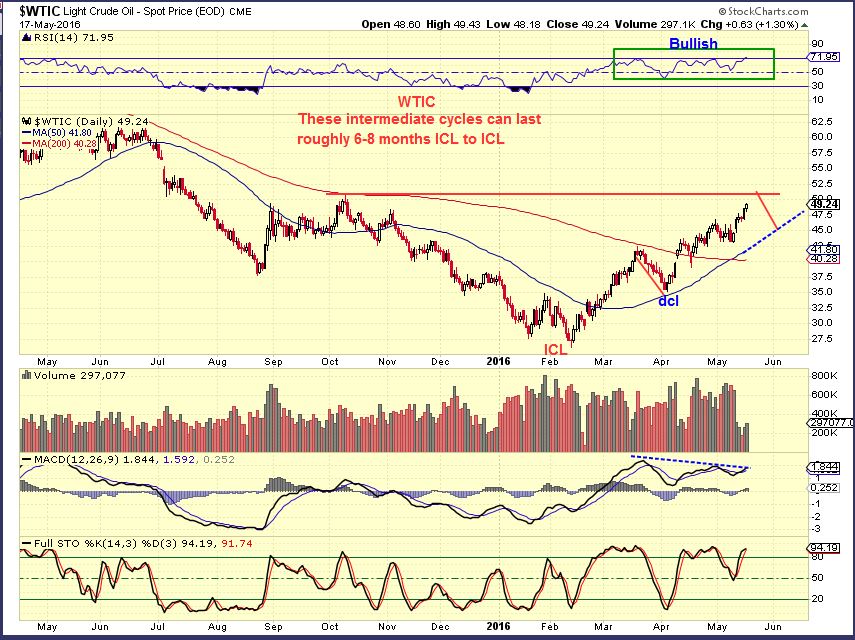
WTIC – Oil is still acting exactly as expected. I think that it will react near $50, maybe some profit taking. Then I think it continues higher.
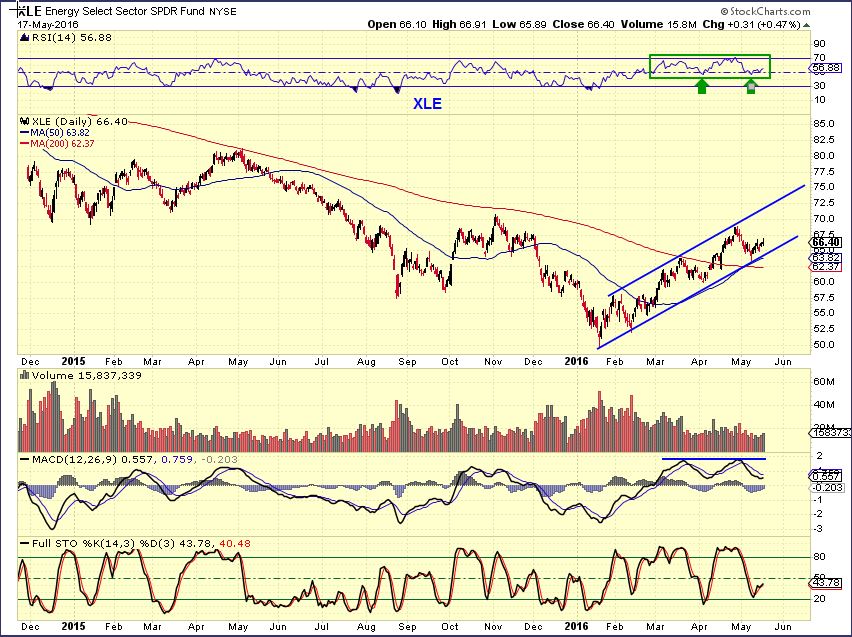
XLE – The set up on the XLE appears to lag Oil, but it is a bullish uptrend. Some energy stocks are consolidating, others are Moving along nicely.
Last Thursday I posted this chart . I loved this chart sitting along the 50 sma. It had just run from $6 to $21 and I tried to buy it the whole way up, it never let me. I mentioned that, because once this got going, I figured it would do the same.
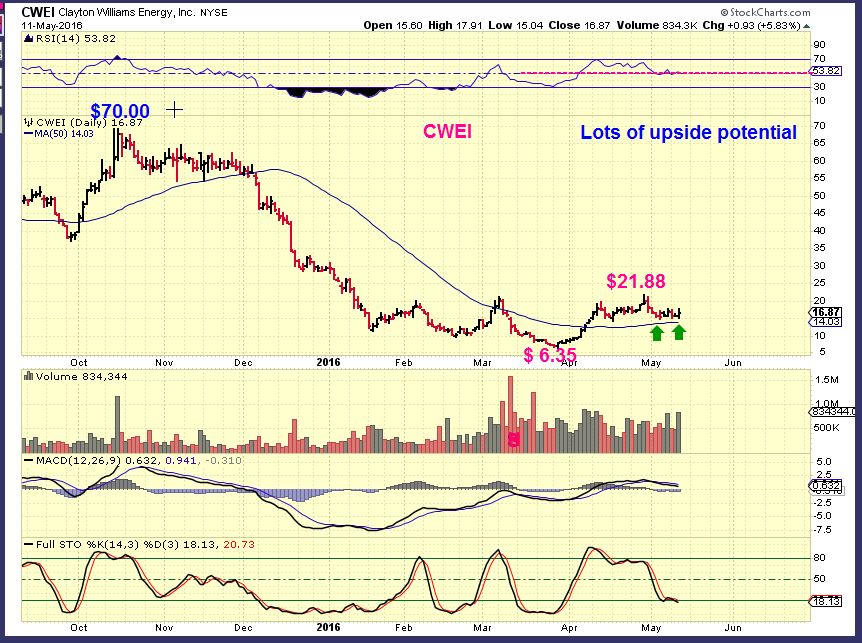
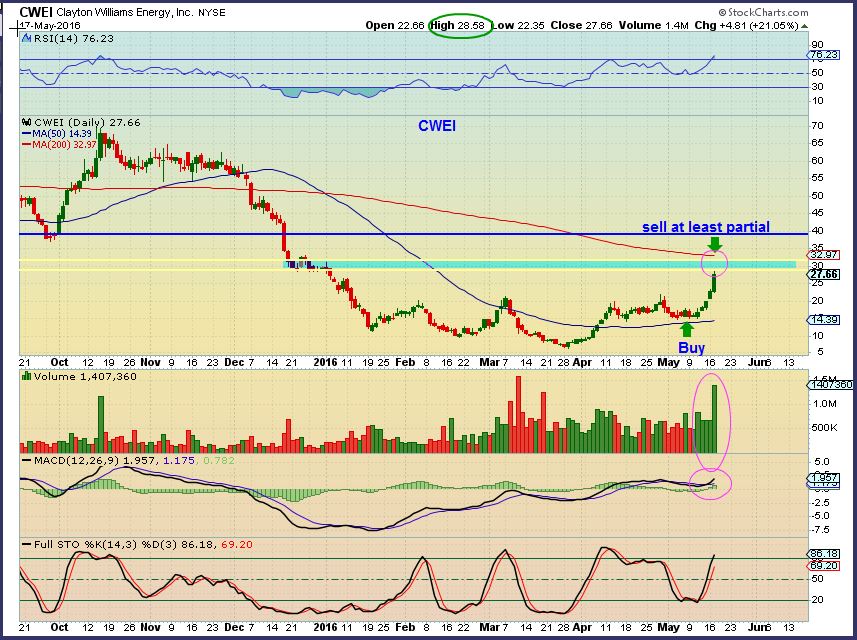
CWEI IS NOT LAGGING. $15 to almost $30 since Thursday. I think that this stock will be $60 soon enough, but it may be at a lighten up point.
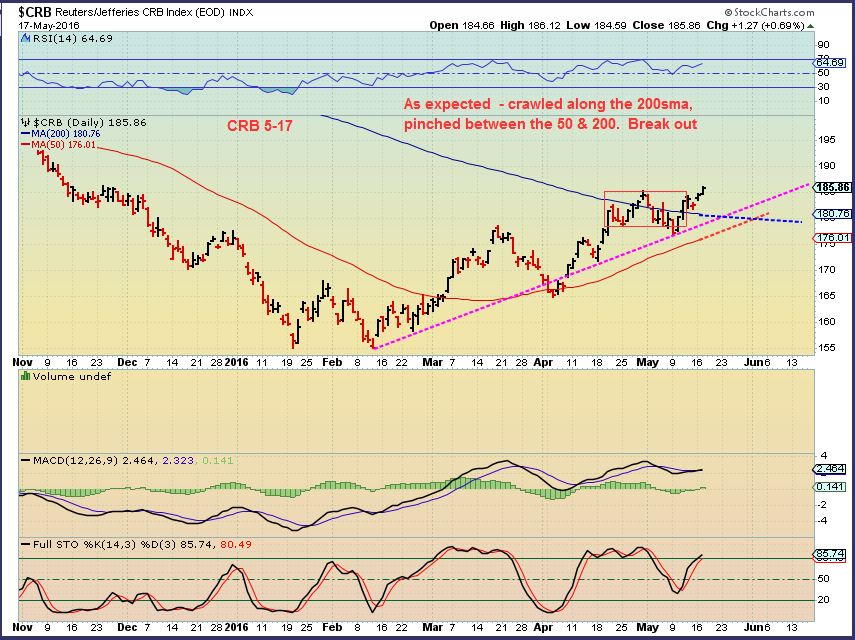
CRB – Reminder, On April 25th I thought that the CRB would crawl along the 200sma, before moving higher, and then dropping into a DCL.
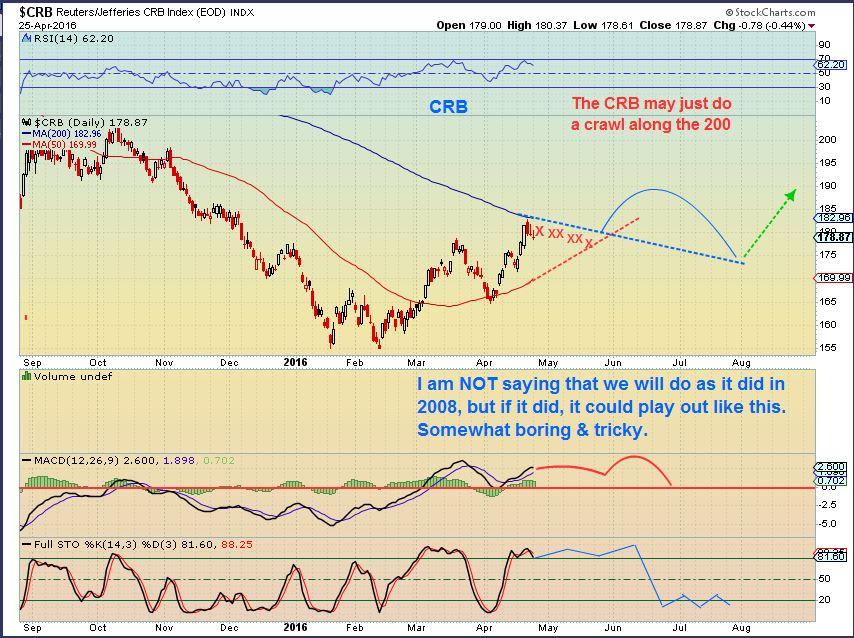
CRB – It has moved along the 200sma and is moving higher. BUT, that may have been the dcl. We may be in the 3rd daily cycle.
.
GOLD & MINERS
.
I have been asked why I trade Miners on the side, but do not share the set ups since late April. As a Trader, I trade bullish set ups, but even a bullish set up in a Miner will fail if Gold sells off. Remember the game Musical chairs? EVENTUALLY, the seat gets pulled out from under you and there is no support. I DO EXPECT a pullback in Gold, but I trade the set ups understanding the risk. I keep positions small, I watch them closely , and look for clues intraday. Most here cannot do that. So lets look at where GOLD is right now. GOOD NEWS, BAD NEWS.
.
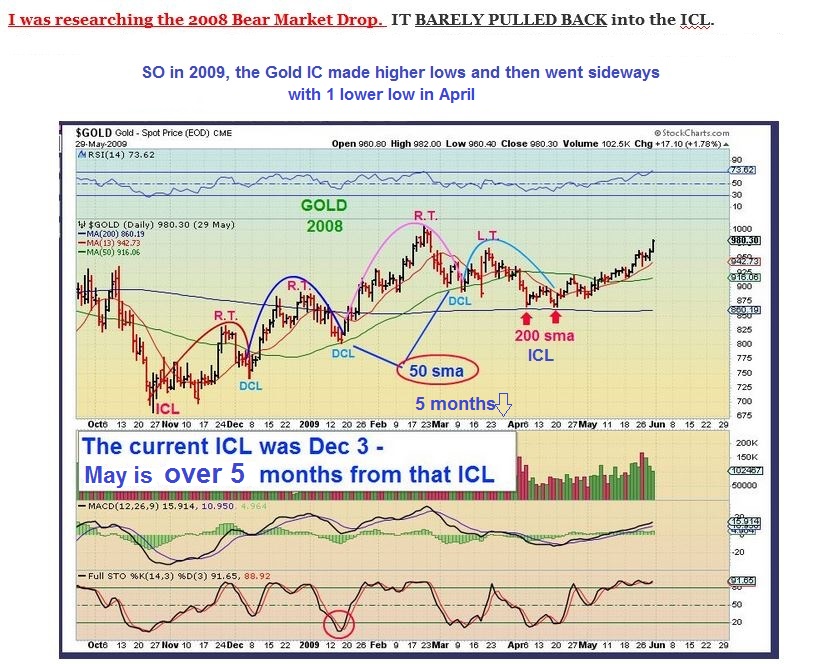
1. GOOD NEWS is that GOLD is getting late in the run, and should pull back , like it did in 2008 recovery. IT ALWAYS DOES. See the Red ARROW tops and Green arrows into ICL’s
.
2. BAD NEWS – Gold could conceivably POP quickly to $1359 -$1400 before that pull back. It may , it may not. More in a minute, please see the chart directly below for both the good and bad news
.
This is the BIG PICTURE of GOLD. I want to use it to show why I expect a pull back in the near future. Look at 2008-2009 recovery. We always eventually get the dip into an ICL ( A deeper sell off than the normal pullbacks).
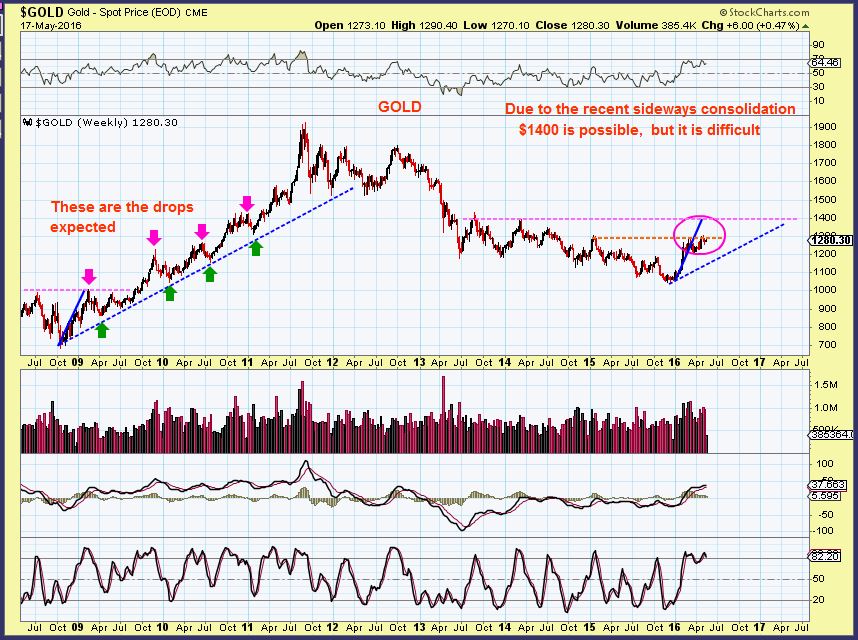
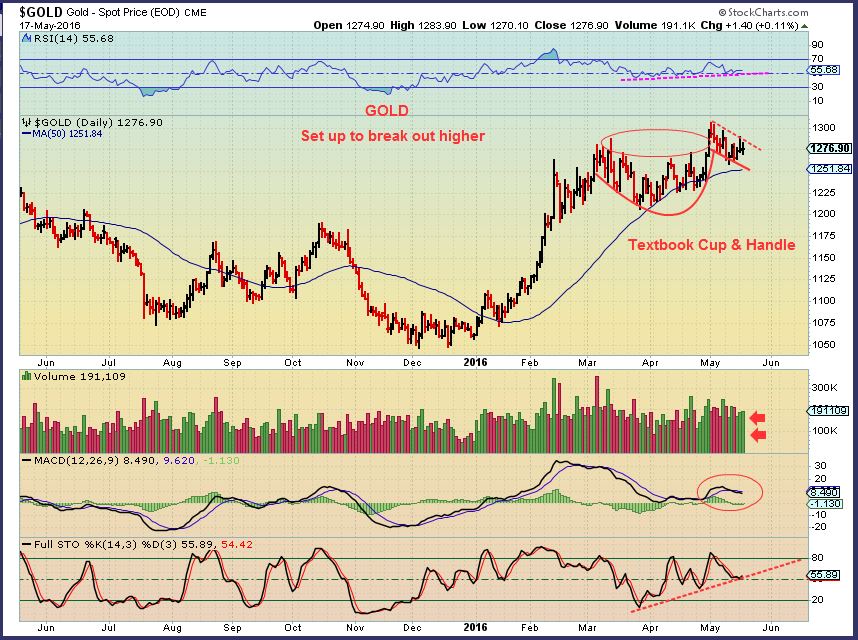
THIS IS WHY I SAY GOLD COULD POP to $1350 – $1400 first. Today Fed Minutes are released. Will it cause a reaction? I DO NOT KNOW, but this Cup & Handle is about as textbook as they come. Can it fail? of course, but this is so bullish looking, that it cannot be ignored. A drop to the 50 sma still keeps this valid. The MACD simply shows that if it runs, it will return. A quick $100 points is NOTHING for Gold after a consolidation phase. It could happen in 2 days and we all know that.
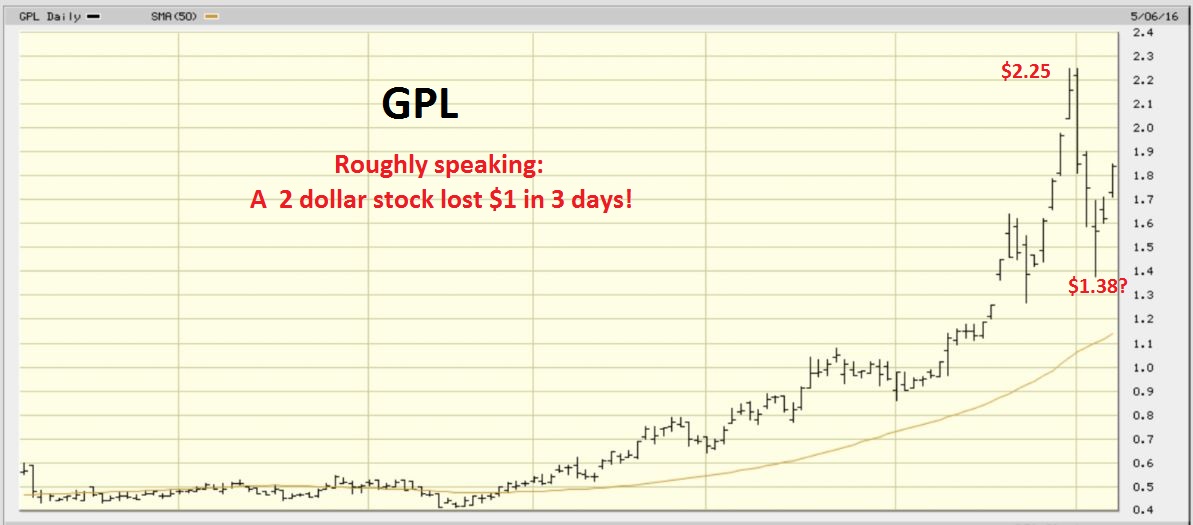
The above chart of Gold is why I still trade Miners, but am very cautious as a letter writer. No one was happy getting caught in the selling in FCX, HBM, AA, CENX< etc, and that selling was nothing compared to what some of these Miners could do. Look at this drop that just happened in GPL. $2,25 to $1.40 in 3 days. I cannot safely put you in a stock that does this while you are at work.
.
COULD the ICL be milder than expected? I already posted this below , the 2008 ICL. You may hear some analysts expecting a drop saying , ” You wont dare to buy it its so drastic, so dont buy until you feel like throwing up from the selling.” Really? It did take 2 months, roughly $1000 to $850. Thats like a $10 stock going to $8.50. No biggie. I was trading in 2008 and I dont think the pullbacks are that bad. I am always drooling when they sell off. We will find good entries without fear, panic, and emotions.
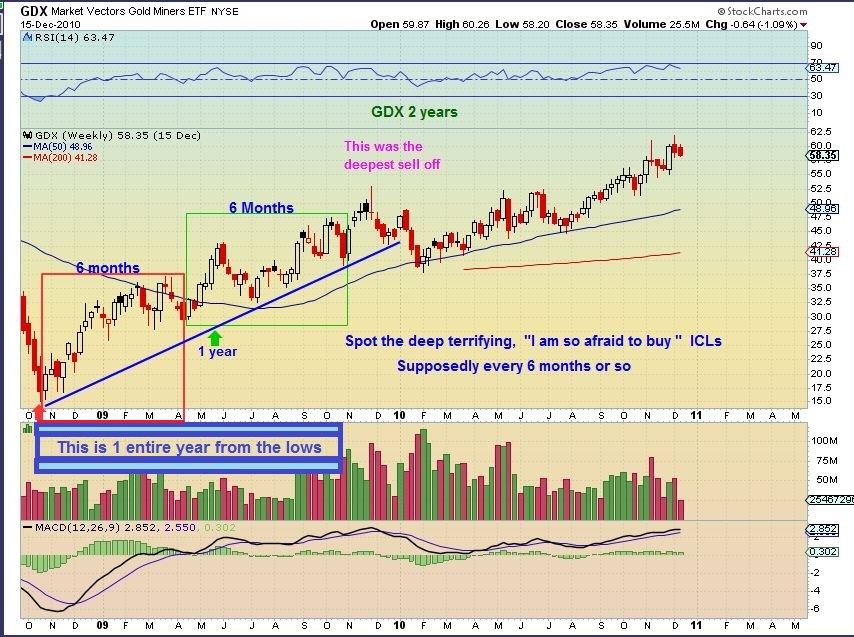
I posted this in a prior report. Roughly 6 months from ICL to ICL
GDX May 17th – Another reason why I still trade Miners set ups, is the orderly manner in which they are still acting. Consolidations are still higher lows. The Music will stop at some point, and the support chair will disappear fro a while.

AGAIN 2009 – I dont see deep scary terrifying sell offs that make people want to throw up after 6 months ( Red Box). The deeper selling occurred at 8 months into 1 year later. It still remained in an uptrend
.
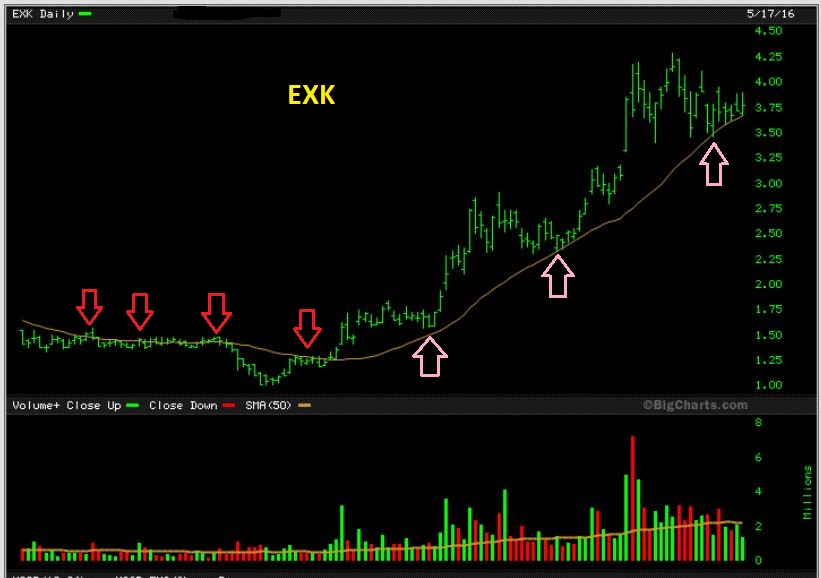
So I mentioned that I took the trade in EXK yesterday. Why? It is forming another consolidation and find support consistently. These trades have been so successful , that when one finally fails, it wont take back hardly any of the profits that I have made in Miners.
Miners move quickly and they move a lot. I cant recommend these trades to everyone here at this point. The recent selling in FCX, HBM, etc really lit up my email and the comments section. If you know who you are as a trader, you can trade proper set ups until the music stops. ( Fed minutes may stop or start the music here ) 🙂
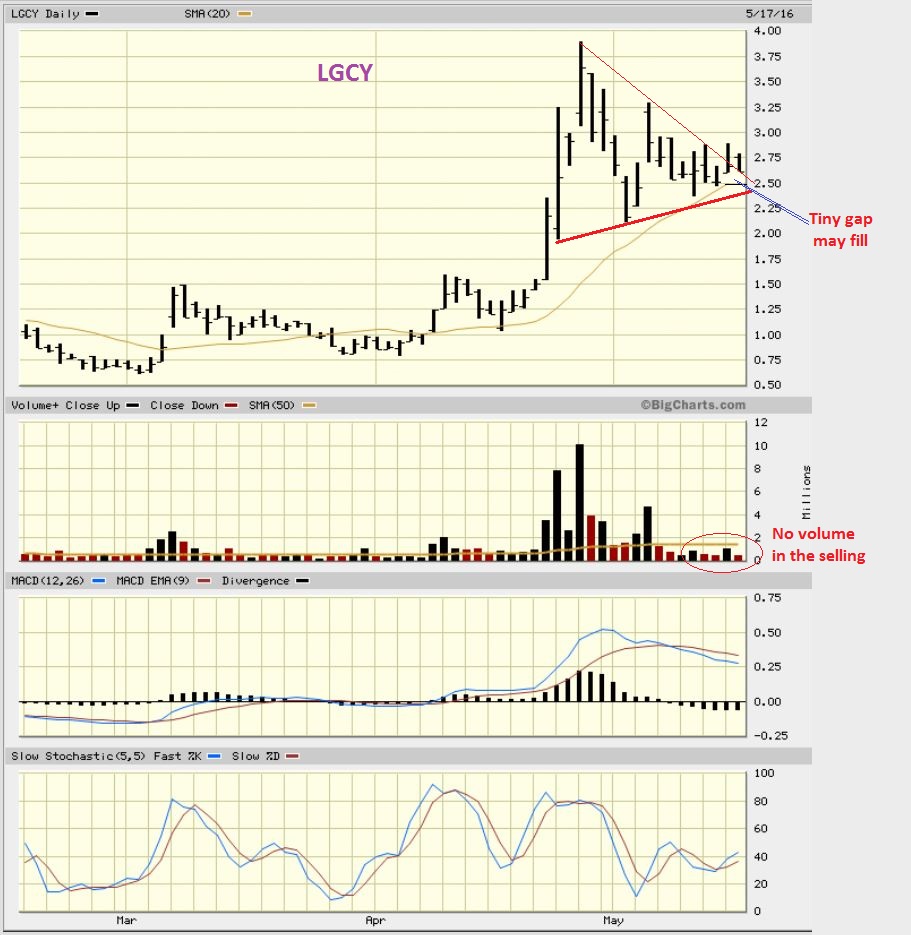
I drew this May 10th and wanted to post it, it is still valid, LGCY remains with in this triangle.
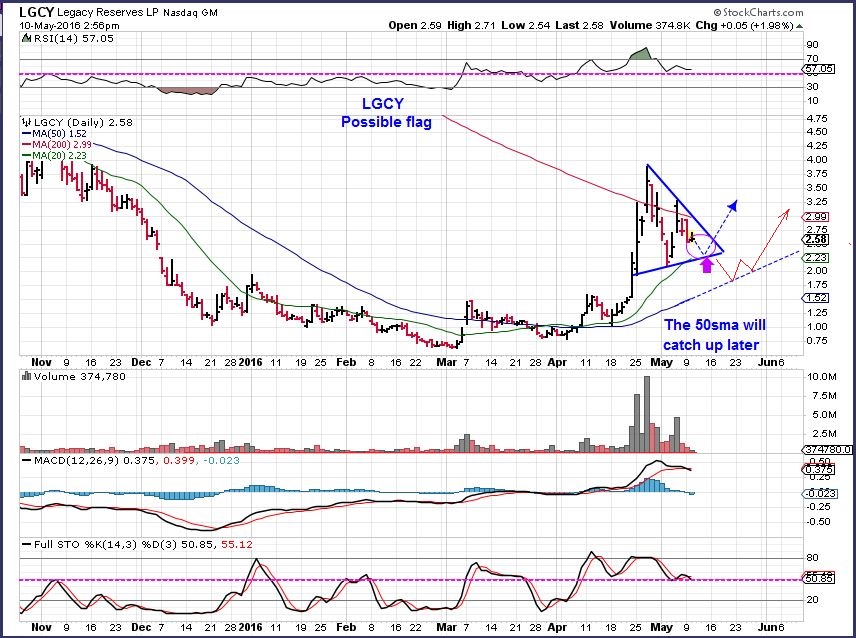
LGCY May 17 – That gap at $2.50 MIGHT get filled. This could still break out higher or lower, but it is pretty much at the APEX. Time is up. The selling volume is light so far.
.
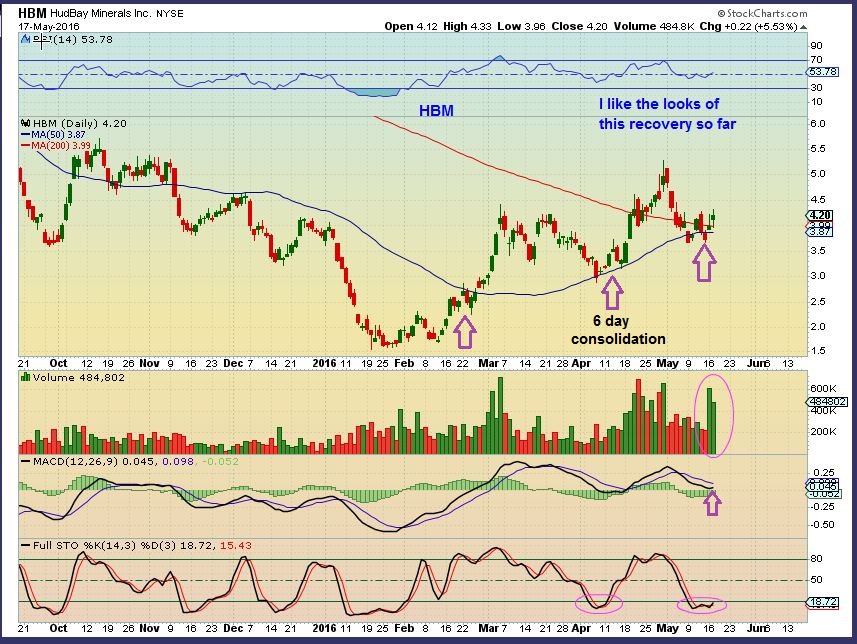
HBM just ran from $1.50 to $5, it is above $4. A dog? It has big swings, but it doesn’t have fleas in my opinion.
.
I think that HBM is Bullishly setting up. I own it and I add at support.
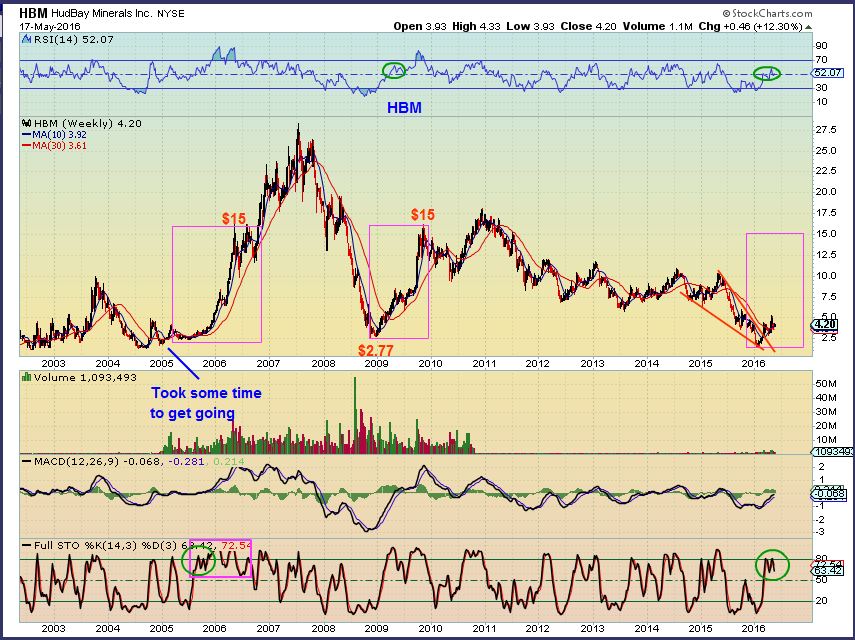
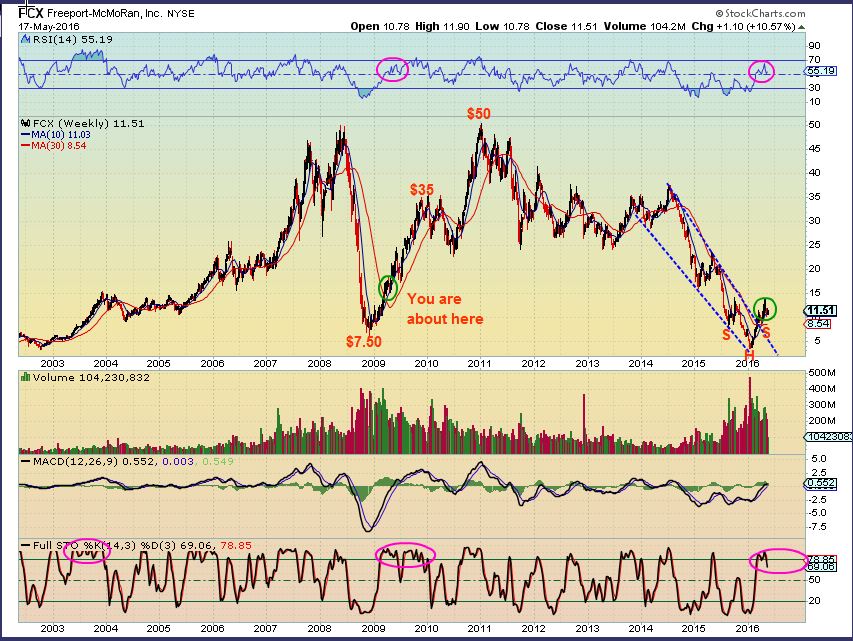
Lets go longer term. I keep hearing people say that HBM, FCX, etc are “Dogs”. I think it depends on your expectations. We are coming out of bear market lows. Look at Past lows. My recommendation is to look at more than a 1 month or 3 month chart occasionally 🙂
FCX – $3.52 to $14. A Dog? At this point it could move higher after a pull back. Bigger picture?…
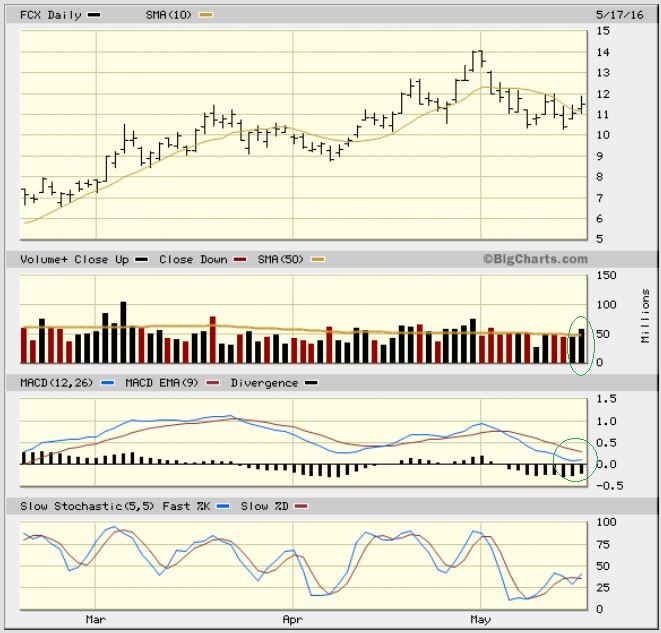
It may be at $35 to $50 someday
So it is the day of the FED MINUTES RELEASE. We see weakness in the General markets, can the FED help? We see GOLD right in the middle of a Bullish Cup & Handle set up, but late in the timing for its drop to begin into an ICL. Can the FOMC release push it 1 way or the other? OIL is still looking good, I prefer the Energy stocks and base Metals at this time. Lets see what the Wednesday morning trading brings, and the FOMC is at 2 p.m. Eastern, we’ll see if that changes anything.
A day to keep an eye on the markets, A day to be Frosty! 
~ALEX
.
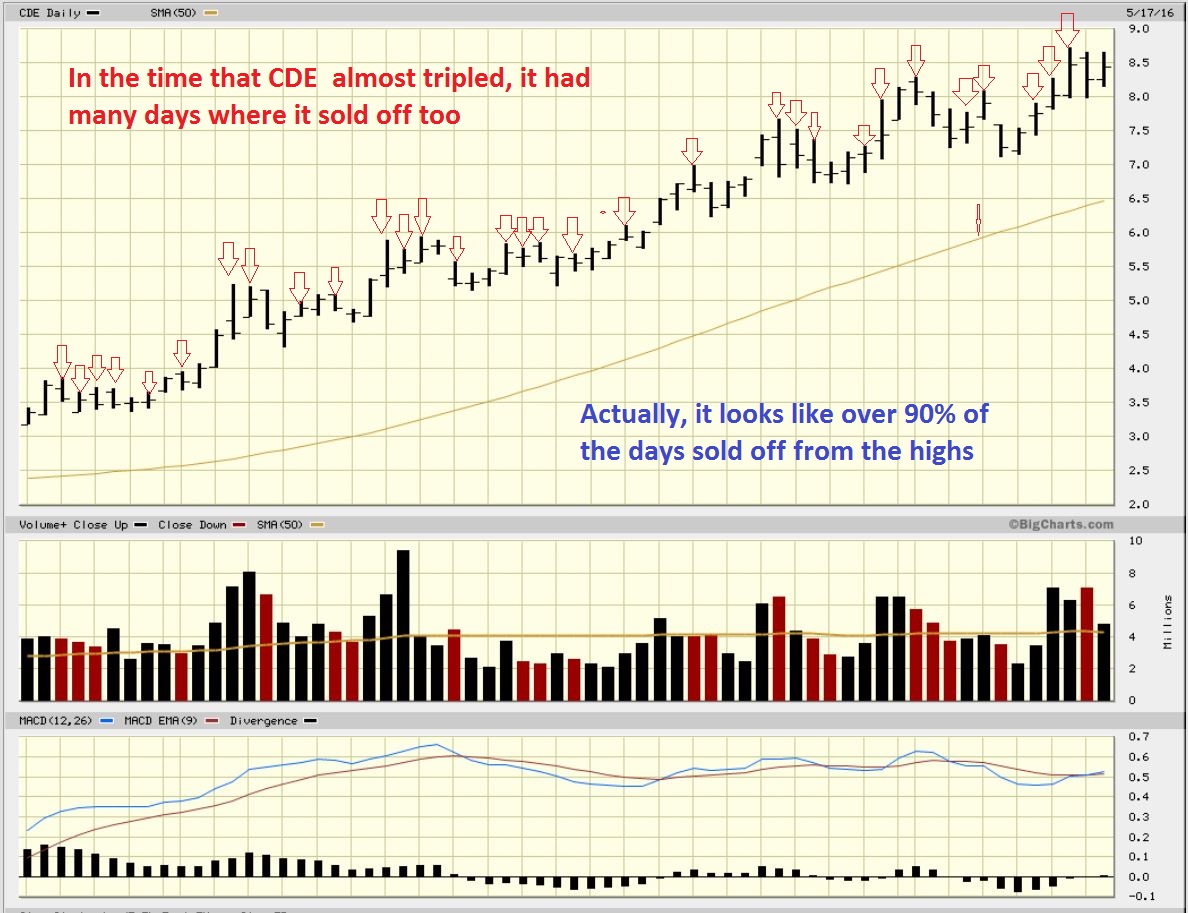
Yesterday the comment was made that all the rallies are selling off, meaning that the run higher in the morning is selling off into the end of the day. My response was that I see that in Miners. Miners are doing incredibly well, but yes, they run up mid day and sell off too. That doesn’t mean it is bearish necessarily, and it doesn’t mean they cant go higher, so for a visual …
.
Wiggles: Look how many days ran up and sold off , closing off of the days highs. This stock pretty much tripled.


APA- Apache Corp ( NATGAS & OIL ) up $6 pre-market
Alex, Thanks for explaining the CWEI pick. I was wondering if it had been the Angel of Good Fortune that had whispered in your ear. It has been incredible!
Yes, Edward, that was a fast %-Gainer . I love those. I really hope that it back tests that break out, I’ll be looking for an entry again
Incredible CWEI pick, Alex! I’m still holding onto 1/2, but it looks to be in no-man’s land right about now?
Great
This could drop down to the gap and back test, or it might just bull flag and continue higher. No way to know for sure
me too
Alex, LGCY does look like it’s resting up for another upside run. Of course, if oil does correct for a short time I would expect that to impact LGCY too but the longer term looks appealing.
I still own 1/2 of my position , I think in time it should pay off.
I saw a stock MGT Take off like a rocket, and I thought that it would flag like LGCY and a few others that I have owned.
NOPE, the one that I dont own just keeps flying. Check out that 6 month chart . THIS is what I wanted LGCY to do 🙂
Holy Gomer Pyle! Sorry about that one, Alex. : )
I didnt see that one until the 3rd day that it took off, when it crossed $1. I thought, ” Ohh, nice volume growth, but I dont want to chase this.” – Then it went straight to $5.50 – lol
Win some, Lose some. 🙂
Alex, I have so much red and only a few green spots in my oil , commodity areas. Could you please comment on WTI and OAS…I am considering dumping while I can walk away with some profit.
don’t take my word for it, but it looks like we’re in the C wave of ABC corrections that started yesterday
see 1 minute chart .. refresh!
SOG….. you talk about OIL ????
Thank-you so much.
no its OAS, but maybe oil also.. i havent looked
just looked at USO, but its doing something completely different to OAS
DNR, which was also following a similar pattern, may have completed its C wave.. not sure
Hi SOG…I don’t really understand the waves….I try but can’t always see it. I see your #5 way down low on the right..is that where my poor OAS is headed?…or are we in some other internal up down waves within that wave that is going there but with a possible better place to exit than now? Did you follow THAT!? I think I just confused myself!
yes that #5 is the target for the Cwave… its only a ballpark figure based on the trend of the #1 and #3 of the C.
Waves are basically 12345 impulse in direction of trend, then ABC correction in countertrend. This pattern (supposedly) happens at all scale levels, whether minutes or decades.
i’ve done a clearer OAS chart.. refresh!
If you have time….to teach me something…I assume, if we are in a C leg happening in this bigger wave down to #5…where are its A and B? Could you label them?
That helped. Thanks
assuming this correction is now done.. you can see here how the Bc & C5 waves overthrow the main body of the trend channel.. to try to suck you in at highs or buck you off at lows
Good demonstration! So, it has completed the A B C and the 1 2 3 4 5 . Is that movement up from the C/5 the start of a new cycle? Is it numbers, letters or both?
yep.. hopefully thats the end of the ABC, and a new 12345 impulse upwards has started.
bad scenario would be that that ABC was actually just a single A wave of a bigger ABC correction… or worst case scenario, that was not a correction, but teh start of an impulse downwards
this is the problem with the Elliot Waves.. any reading is a subjective interpretation of what constitutes the structure of any particular wave, so often its hard to tell where you are within a move.
Alex might tell you, that its just an additional tool (often only confirmative, after the event) to try to see whats going on the bigger picture
Thanks for the information. I realize too that we were looking at a chart with a very tight time frame. Alex piped up and said he thought OAS was fine so you both backed me away from the panic cliff for now. LOL. I’m going back into my art studio…too depressing in my computer room! Way too much red for this artist!
it was a the badder scenario (so far) … i got stopped out at 9.50
probably bounce back up from here now :/
BTW.. as far as numbers & letters are concerned,
if a 12345 wave up is happening,….
1 is an impulse in the direction of the trend, has its own (i ii iii iv v) subwaves
2 is a counter-trend correction, so has an (abc)
3 impulse has (i ii iii iv v)
4 another c-t correction , so (abc)
5 impulse has (i ii iii iv v)
then comes the bigger ABC again.
…and so it goes on… and on
Hi Nancy –
Click on his chart to enlarge it and Look at his chart again. Look at where price is and look at where “Way down at 5 ” is. Its only 10 cents lower 🙂
Well, we got that lower target with overthrow. Lets see what tomorrow and Fri bring.
I think OAS is fine, WTI is still going sideways near support, but below the 50sma
Hi Nancy, I’m in OAS as well and up a bit. Not interested in staying it if it craters CLF style. The 20-day has held recently for OAS and is only 9 cents lower. If it doesn’t it has reacted to the 34-day SMA. Below that and I’ll stop with what’s left of my profits.
On the other side, if we get a rally that gets RSI above 70 (really unlikely), stoch above 80, or price to upper BB, I’m out.
Alex. What do you think of X here? I was looking at adding at support around $12.50 – $13. Weekly chart might have support at 50wma (refresh)
Hi Conrad- That would be about a 50% pullback and it is oversold, but I’d have to see how it looks when it gets down to that area. Looks like a good area to review it though.
Thanks Alex. Your comments always appreciated.
I was thinking the same thing. This could be a great add shortly!
Alex i don’t know if you have had a look at CPE Callon Petroleum. It seems to be one of those charts that just keeps marching upward. It is free of most of its overhead resistance going back a long way.
Hey RB
Yes, I look at quite a few and agree. You want to see the one that really escaped us as far as no overhead resistance on the way up…
PGH
Nice urge to caution your readers yesterday and today on the impending IC backsides. But then great opportunity again at the bottoms of the hills. Patience pays in the intermediate term!
Alex, how are the tea leaves looking? I’m only seeing wildness here. Thanks:)
I’m sorry Kathleen, I dont know specifically what you are looking at . SPX? GDX? CRB? OIL? GOLD?
Keeping positions light , using stops was the latest recommendations. Volatility with FOMC as usual.
It is a Fed Minutes Release and everything is selling off. Markets are now making a comeback
I got stopped out of some Energy stocks. Locked in small profit, will have to start the shopping hunt all over again.
Look at a 5 or 15 minute chart of SPY or QQQ = Sell off fast, recovered already.
It will take time to see how EVERYTHING else plays out.
I’m in oil and CRB. It’s looking a bit better now. Fingers & toes crossed!
alex,
have you cut EXK loose?
I hedged it with JDST before the minutes, so I still own EXK . I will be cutting one of them loose soon, seems like it is JDST and DUSTS turn to run.
The Volume on DIST and JDST seems to be indicting that this will be the sell off into a DCL, possibly ICL ro Miners.
MACD on GDX – Refresh , I’ll make a chart
Thanks for your quick response, Alex. Thumbs up.
Hiep Piep….. Hoeraaa
Where is the top ALEX in DUST ????
Thanks my dear.
Ye, you may get your rally in DUST now, the volume in DUST and JDST is super high today ( Right after the split, funny how that happens).
It will take time to know how far it can run.
holy cr@p.. look at that volume in DUST!
i got it as double any previous day in last 2 yrs on my chart
JDST too, that often marks the lows and the GDX / GDXJ pull back
Did the split play havoc with it? Check out GDX. 190M, wtf?!?!
Wish I had thought of that. It’s obvious who writes the newsletter and who subscribes.
It could have gone wrong the other way too. JDST could have dropped 20% and EXK been up 7%, so it was just to try to keep things semi – balanced on a fed day.
Yes, but now we have a technique for next time!
I’ll routinely buy/sell options against/with a position with something like today but really hard to do with smaller float stock. With blue chips and ETFs, very easy due to liquidity in the options market.
Guess there will be some good energy buys! I’m trying to look at the bright side…..:)
At this point Tammie, energy is a toss up, IMO. I’ve gone back to playing energy through the 3x etf’s because you can see better in their charts the potential upside and downside. ERX and ERY, for example. ERX is still being capped at the 20 sma in the daily, even though the weekly shows a nice bull flag. When you look at it from ERY perspective, you see its bear flag, but you also see it is way oversold in the weekly. MACD lines are too far apart in weekly as well, and a shorter term MACD is showing a bullish divergence for ERY. I’M still holding ERX, but it getting less bullish by the day. The 50 is still below, so maybe it still finds support there, but ERX has had every reason to rally this week with oil flying, but it just hasn’t been able to hold gains.
Agree Peter, Things are getting weaker the longer we get into the run. Not completely falling apart, but not responding to Oils final moves higher.
The good news, MINERS look like they will finally be falling for a low entry.
Some leaders up are leading down. SBGL, HMY, AU , etc rolling over
I wonder though, how many will have the ‘nads and ovaries to actually pull the trigger if we were to get a CLF-type plunge? Seems like everyone is waiting for miners to correct so they can jump in, but how many are actually buying stocks like CLF, VALE, CENX, AKS, etc….?? It IS easier said than done! I think these stocks present a better entry right now. They broke above their major ma’s with huge volume, and are now in the process of testing those b/outs above the 30 & 50 week ema’s. These *tests* are never pretty, and never feel good, but it is where you should be a longer term buyer! I’m adding to all of those! Why? ‘Cause it feels like I’m making a mistake, it makes me uneasy, and I think these will probably go to zero! Thats my buy signal!!
LOL – That was Funny.
I kind of look for an A-B-C slam down, ‘A’ the slam, ‘B’ the bounce , and ‘C’ test of lows or final break lower & reversal .
We’ll see when we get there in Miners, right 🙂
I’ve got the nads. I missed it the first time and have been waiting since Feb. I thought 35 in NUGT was ‘chasing’. Oh man!
I’m selling into rallies.
Hey Peter! Yes, I see what you mean about watching ERX and ERY – just went and looked at what you were talking about – a toss up, yes – hopefully oil will stay bullish a little longer for those of us in some of these stocks….:) 🙂 Now I’m going to search the house for some chocolate. 🙂 🙂
Chocolate makes everything better Tammie!! Dark choc for me… 😉 But in regards to energy, not all is lost yet. Like I said, there is still support underneath, so maybe there still is some upside here. Remember that a lot of times these are sell the news type events (FED minutes, FOMC, etc..), so who’s to say these sharks aren’t rotating away from the dollar and buying this slam in commodity stocks. We just have to see how it plays out by the close on friday. But I think wven the 3x etf’s are safer than playing the individual energy names. IMO at least.
I’m buying nothing. I personally got in way too heavy for this far along the cycle to still be comfortable. Commodity space and oil appear to be weakening to me. I’m slowly rotating heavy cash at this point. I gave back Huge gains with CLF, that won’t happen again with energy.
Yeah, I’ve got a few more stocks right now than I wish I did ….most of them in the red…..hoping oil pops up enough to make them at least green again……when I look at some of these stocks and how much they fell today, gosh, makes me really want to jump in and get some …but…..probably can’t bring myself to do it. That tells me they’ll probably go up and I’ll be wringing my hands watching them go up without me…..
When your stocks go down, you wished you didn’t have so much; when they go up you wish you had a lot more! Thats human nature…. thats why you cant get too high when you’re up, or too low when you’re down. Are you trying to day trade Tammie?? Or what timeframes are you focusing on?? Just curious….
I think you’re good to wait here. I’ve bought just b/c of a big smackdown before and it didn’t turn out well. Could be different rules now owing to bull market vs bear. But wait for sign of strength first. I think most of us are turning a bit more cautious here. Picture is a bit unclear.
JPM, MS, GS, BAC, RF, KEY, HBAN,
Exactly. The other side of the rate hike trade! Game on, Wayne!
Stopped out of FCX today. Bad entry, has exit, lots of promise, no performance. Stayed in HBM by 1 cent. Trying my best to get out of AA, just didn’t get the performance I wanted/expected.
SN Volume is high today. As is HBM.
Seems likely I’ll get taken out of my HBM tomorrow morning.
BCEI! Nooooo!!! I had a limit on for 3.90 yesterday but something happened with my broker and it got goobered up and didn’t execute. Since I had a limit, that means I had an order in so no stop. Sooo Pissed!
that’s sick
Yeah, I had the limit to the exact cent of yesterday’s high. I haven’t been able to trade during day this week, just adjusting stops as necessary night before.
SDRL…thoughts anyone? Have been sitting on it for a while in the red….from a long term perspective I think it still looks ok…but from my short term red….not look so good.