
Waiting For A Sign
Patience in the markets can be rewarding and it might come in various forms. Patience is often needed to wait for a pull back to turn into a buying opportunity or a trade set up. It also might come when we are holding positions and we are waiting for price to show follow through. This weekends report showed mixed signals in various sectors and Monday started clarifying a few things, but a little more time might be needed to truly see what is unfolding. lets review…
.
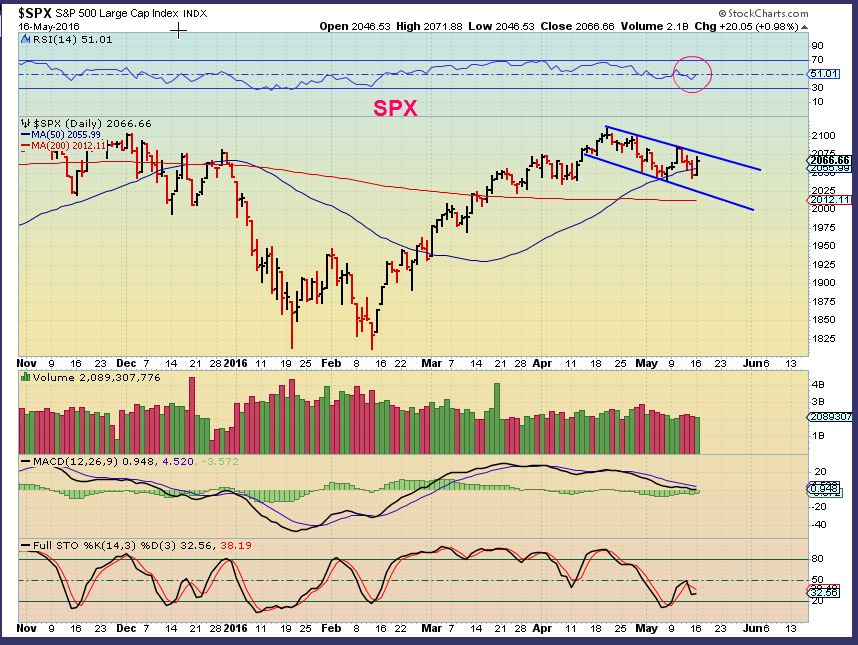
SPX -The general markets showed some upside potential, regaining the 50sma. It looked like the DCL came 7 days ago, so now we need to see some follow through to new highs to avoid having this become left translated and a repeat of last fall.
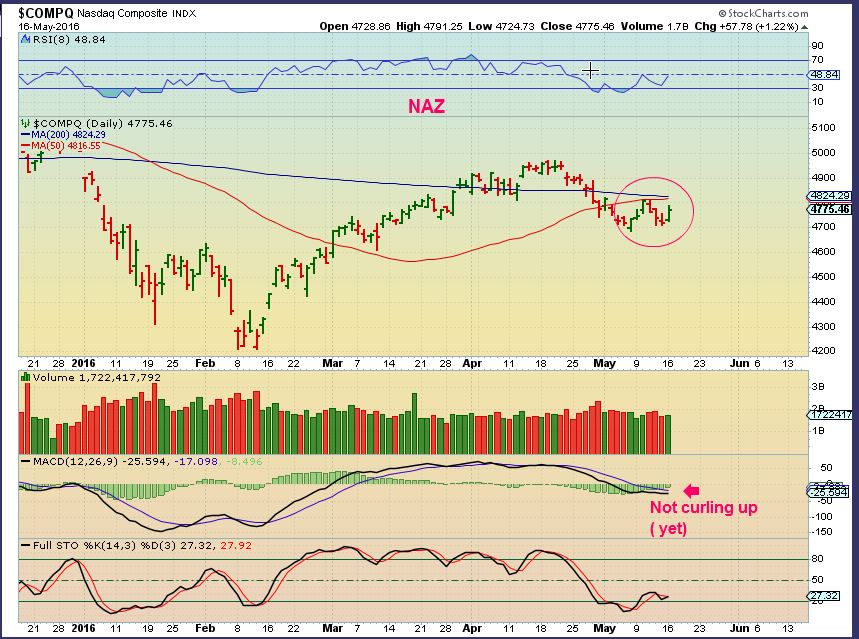
NASDAQ – Of course, some of the charts from the weekend report pointed out lagging weakness, and really need to improve to look less bearish. The NAZ has overhead resistance as shown.
.
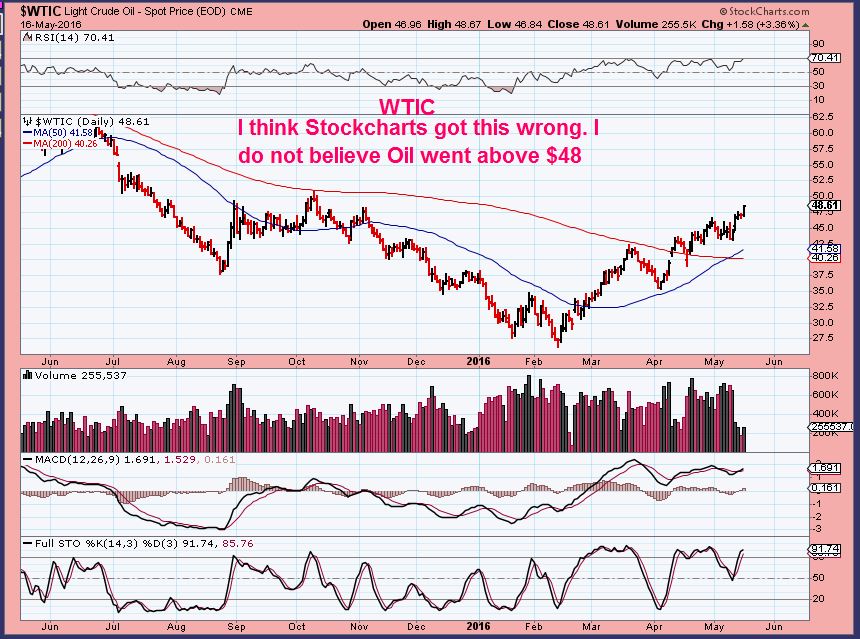
WTIC – This chart is not an accurate view of Mondays Oil rush, but it’ll do. Oil continued higher , up 3% at one point, but I dont think that it went to $48.61. The volume on the chart also looks wrong. I am holding some energy stocks and they did offer some gains.
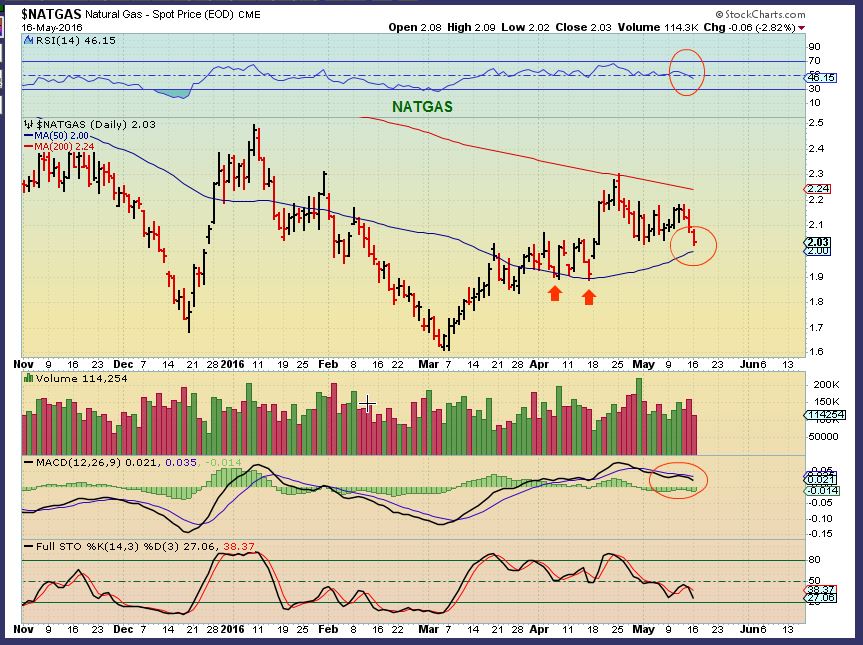
NATGAS – Natgas dropped and the MACD crossed. It could be dropping to its DCL. We’ll see if the 50sma offers support. This would then be the 3rd daily cycle, and could be weaker, so I would think that the 200sma will continue to cap the price.
.
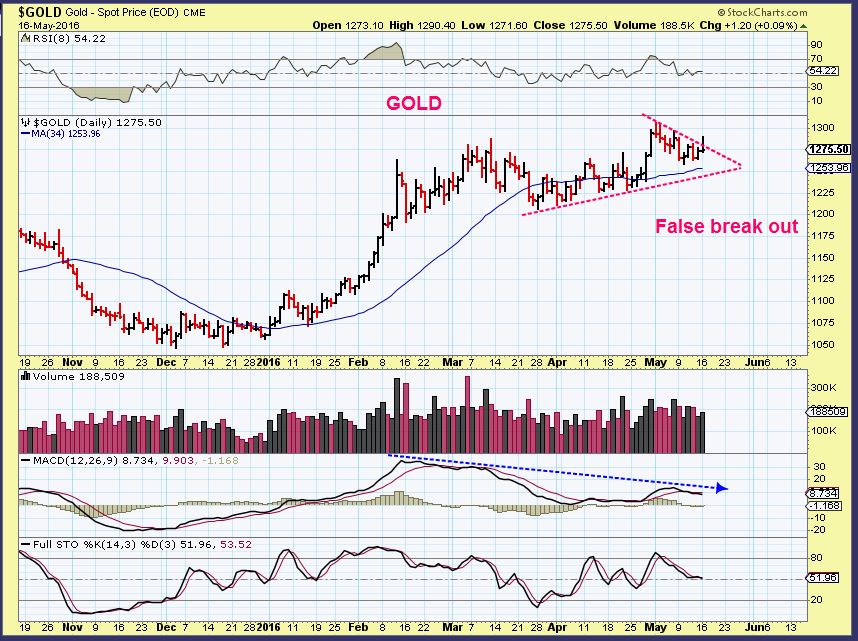
Gold broke out Monday morning and quickly reversed , giving us a false break out. If Gold continues downward, the high of this daily cycle came on May 2, and this would be left translated. Patience has been a killer on waiting for Golds next pull back.
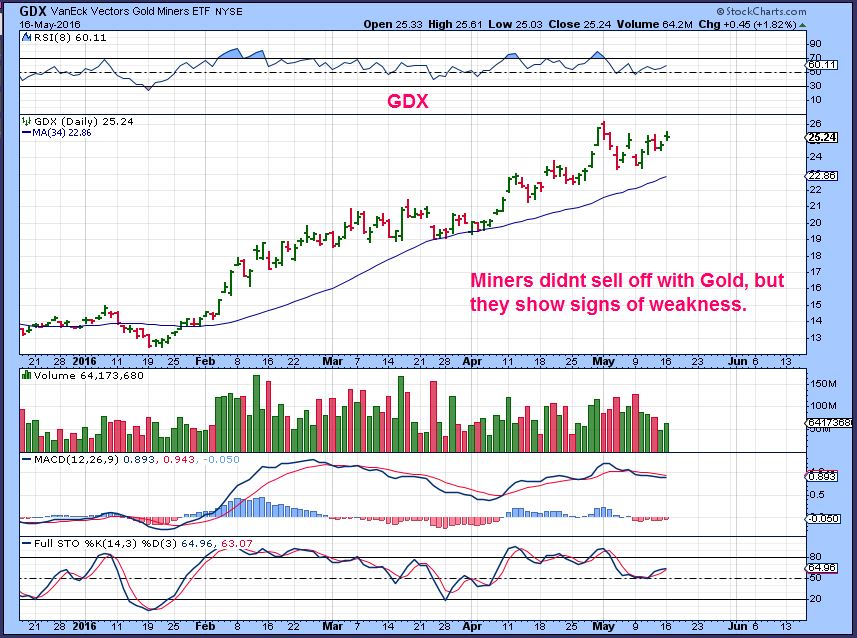
GDX – When Gold ran up to $1290 and swiftly dropped to $1275, that was a $15 drop, and Miners didn’t really sell off like they used to. There are signs of weakening in this chart, so if Gold drops, we may finally get a buy-able pullback in Miners, but this is just a nice trend higher so far.
.
SO I want to move on and discuss some set ups, some reasons to be cautious, etc. I’ll start with Aluminum, since it can affect AA, CENX, and other aluminum stocks.
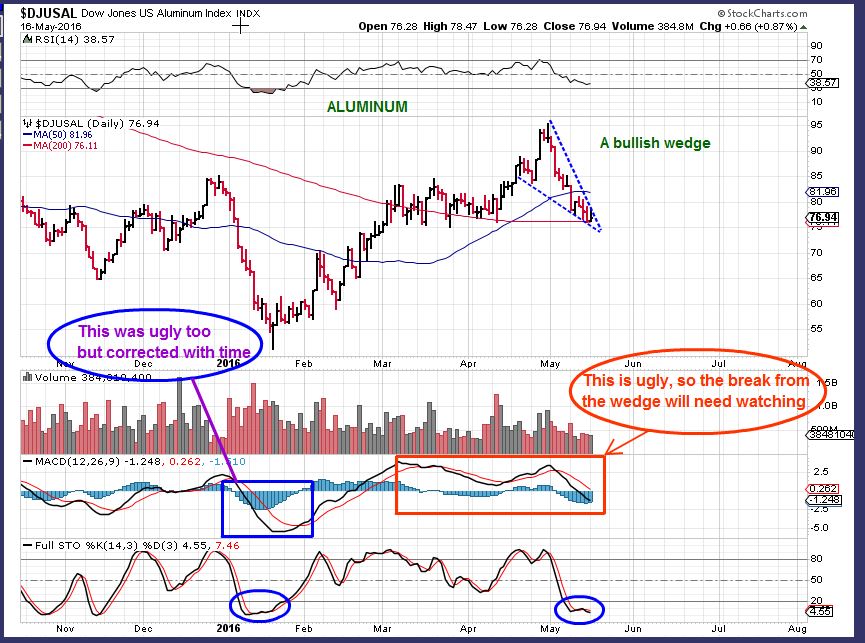
ALUMINUM – This is a bullish falling wedge sitting on the 200sma. I would expect a rally from this if it breaks higher. Look at the current MACD, it is ugly, so I will be watching how this unfolds. It may become a sell on the move higher, or it can just correct itself like we saw in all of these in January. All MACDs were ugly in January, all MACDs are ugly at steep sell off lows. Read the chart.
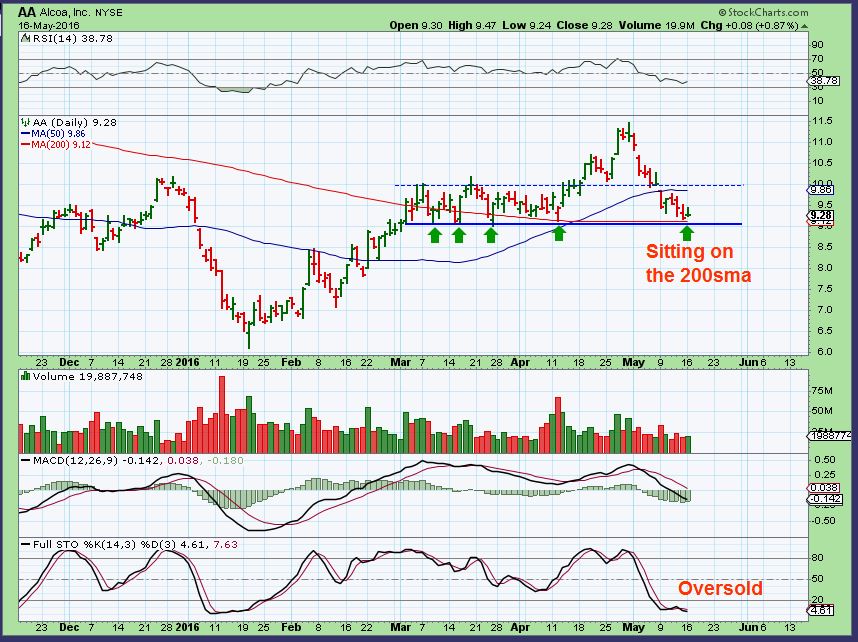
So lets look at AA – It is also sitting on support and shows a similar wedge ( not drawn in). I expect a move higher , but look at the move out of Januarys lows. It took a little sideways time to correct that MACD. By watching the moves in AA, CENX, X, AKS, FCX, HBM, etc etc – we can get an idea of what kind of recovery or bounce is ahead.
.
ALSO I like to review the moves out of the 2008 sell off lows.
1. After the run from March to May highs, the drop felt steep.
2. It then bounced around and took off to new highs into June.
3. Then another steep sell off into July Lows. Look at JULY. The drop dipped below the 200 & 50sma and must have looked Horrible. What would you have been thinking if you owned this then? That MACD broke down and got ugly too in July. And then it went sideways for a week and took off adding 50% again.
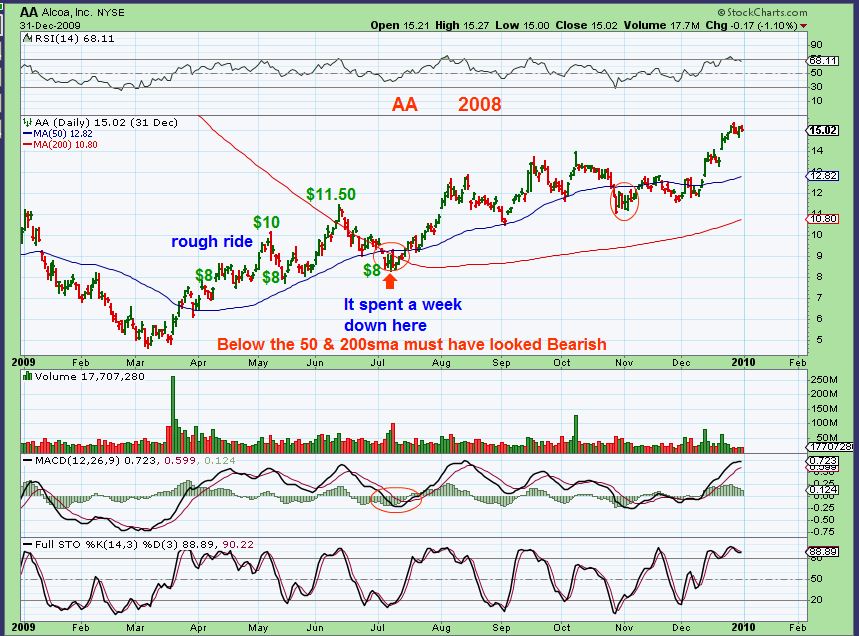
I like to review these recoveries from 2008, because I feel that we are in a similar situation. I dont want to give back gains when we make them on strong runs, and I also dont want to lose sight of the bigger picture and miss out of future gains. That is what the Theme Pic says that Patience is bitter, but the fruit is sweet. We have already tasted that fruitage. There will be more set ups and more moves higher over time.
.
Side note: I want to remind everyone here, the best trades are found at ICLs. You can use leverage at ICLs and at the following DCL. Buying later in a second daily cycle or third daily cycle is usually volatile. It may be best to take smaller positions. It may be best to think of a quick trade, selling some as it moves higher. It is not a time for leverage and going ‘all in’. If you are owning a core position, pull backs can be a good time to add.
So while being cautious , lets look at some interesting set ups for traders.
.
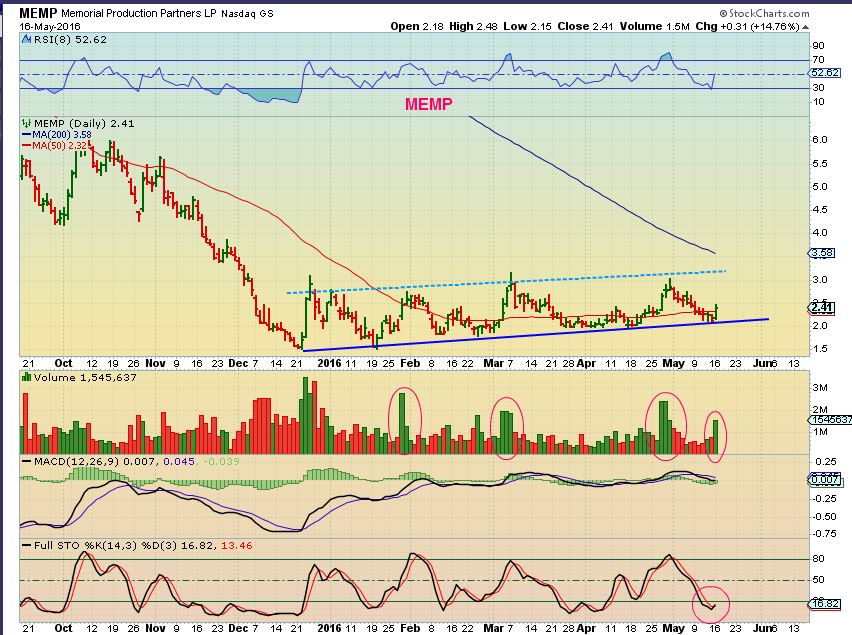
MEMP – You may recall that I pointed out how I had been playing this in the past. Buy the low, sell the run. I wrote that if it drops to $2 , its a buy.
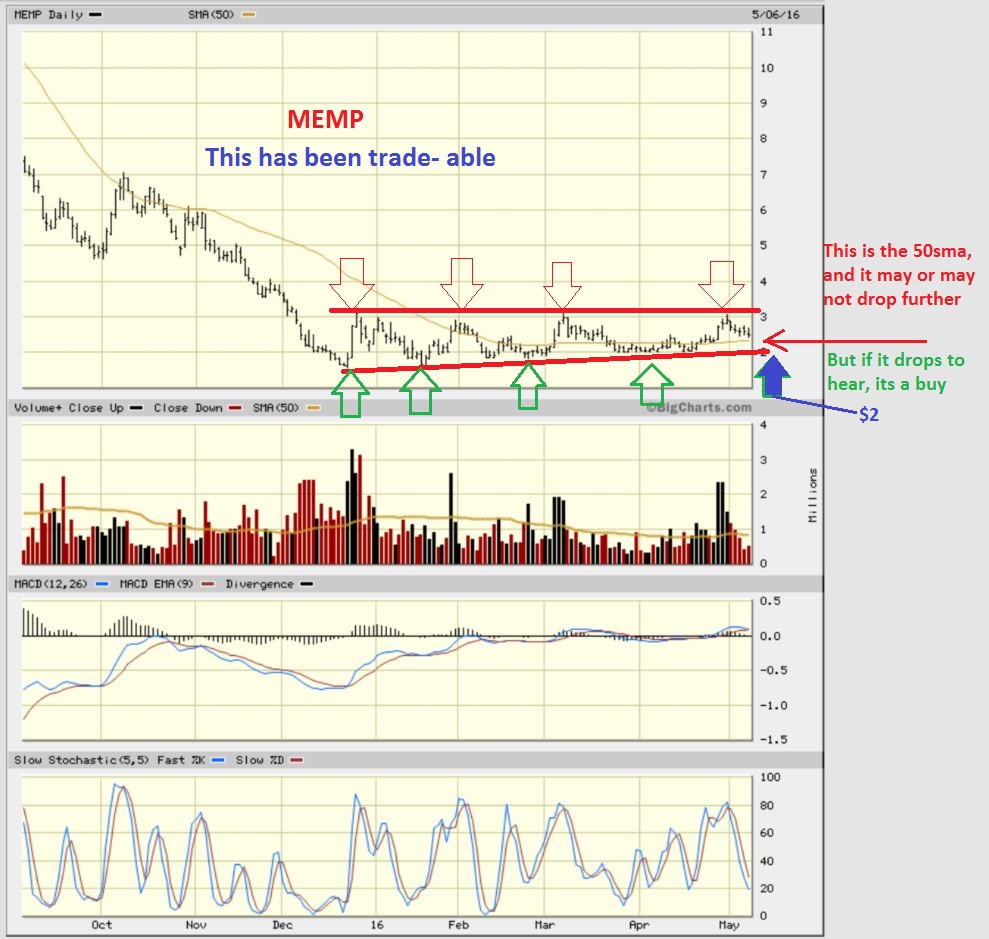
MEMP has been at $2 for a couple of days and now a reversal popped up. $2 to $3 is a good trade.
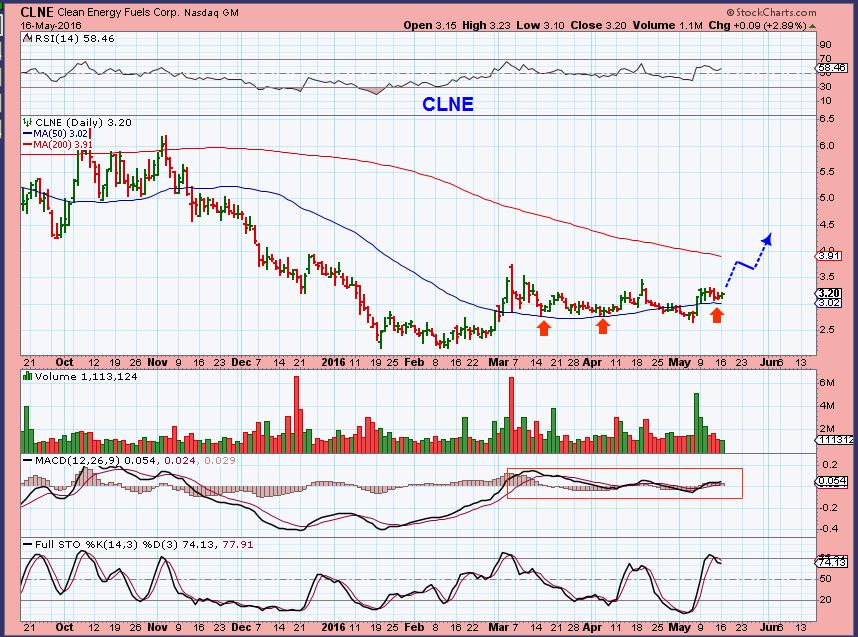
CLNE – I own this and it has been a tad boring the past few days, but this still looks good above the 50sma. My mental stop is a bit below the 50sma. I’m not worried that it is overbought.
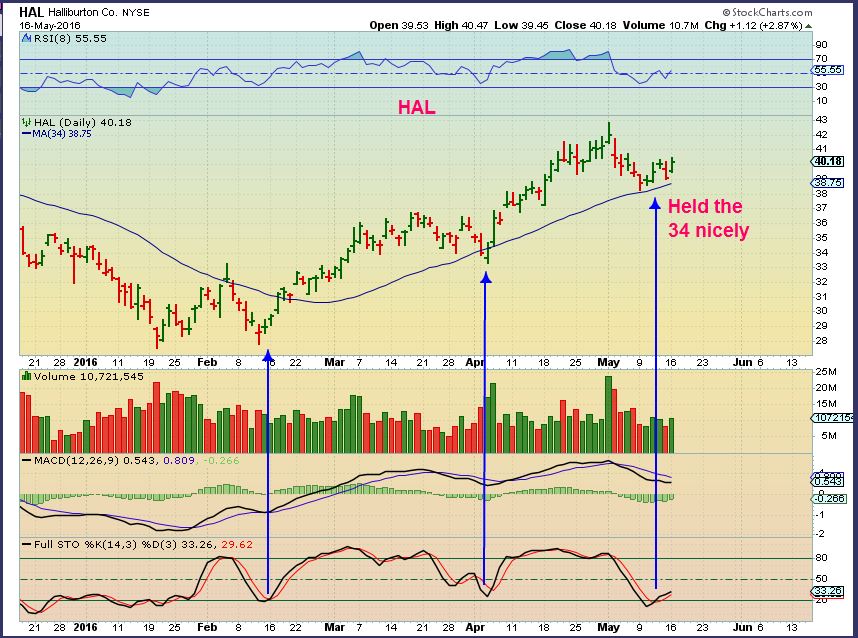
HAL – Oversold and holding support again.
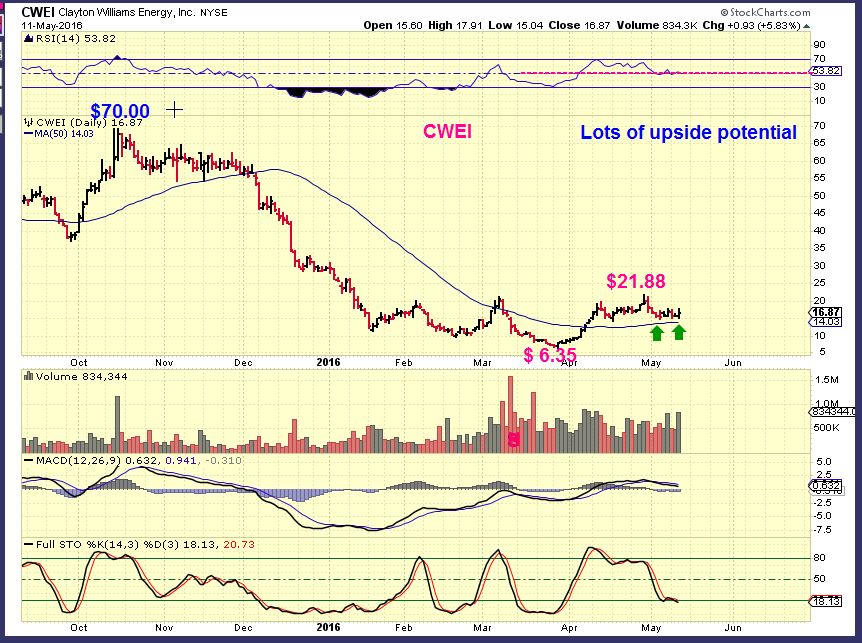
I pointed out CWEI days ago at the $15 area. I love this stock so far. The lows of the past several days was $15. I watched it run from $6 to $20+ and the chart hardly looks like it tripled. The upside potential could be $60+.
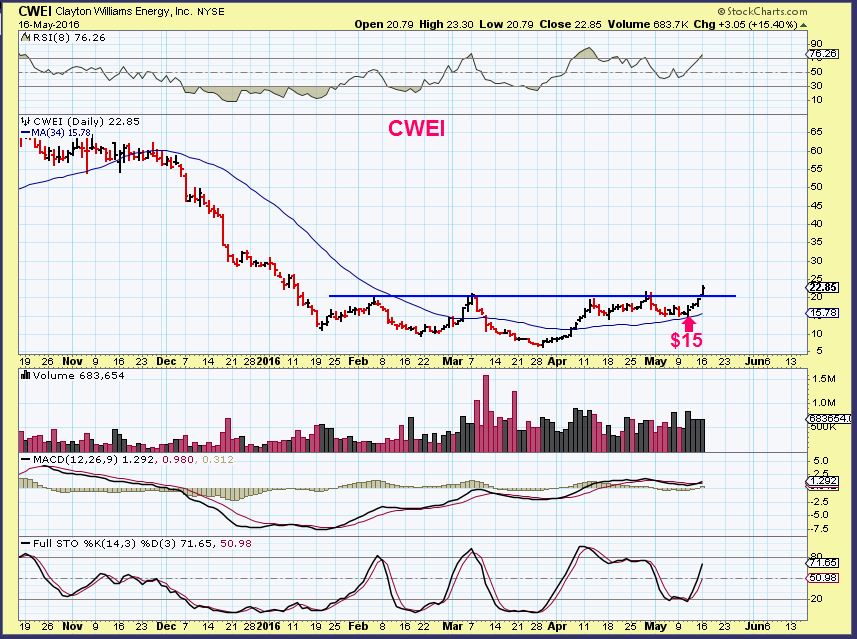
CWEI – 3 days later it went from $15 to $23 Monday. I hope someone else took this one. This now looks like an Inverse H&S break out.If it does a back test in the future it could offer another buying opportunity.
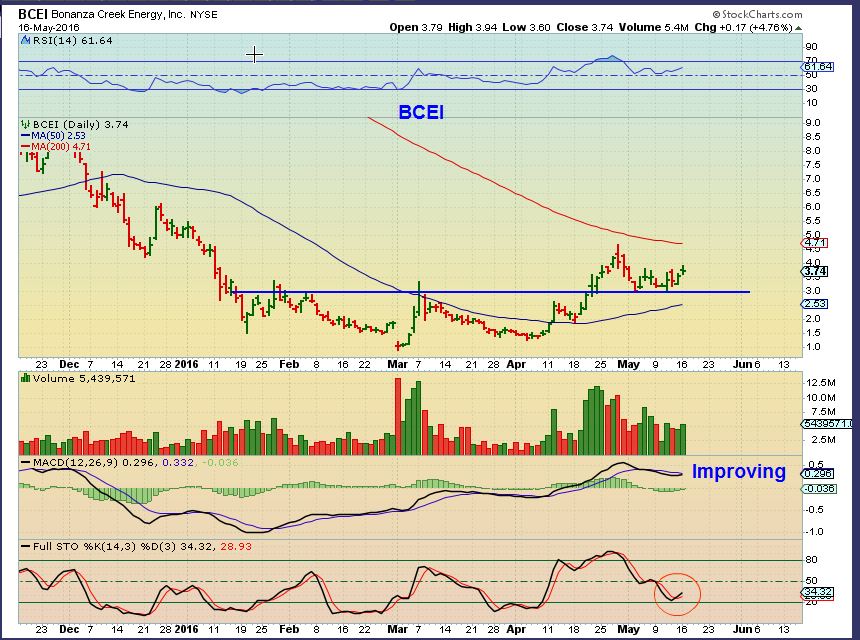
BCEI – I have talked about this one and its weekly chart for quite a while. I added on this dip. I may sell a partial if it gets to the 200sma with light volume.
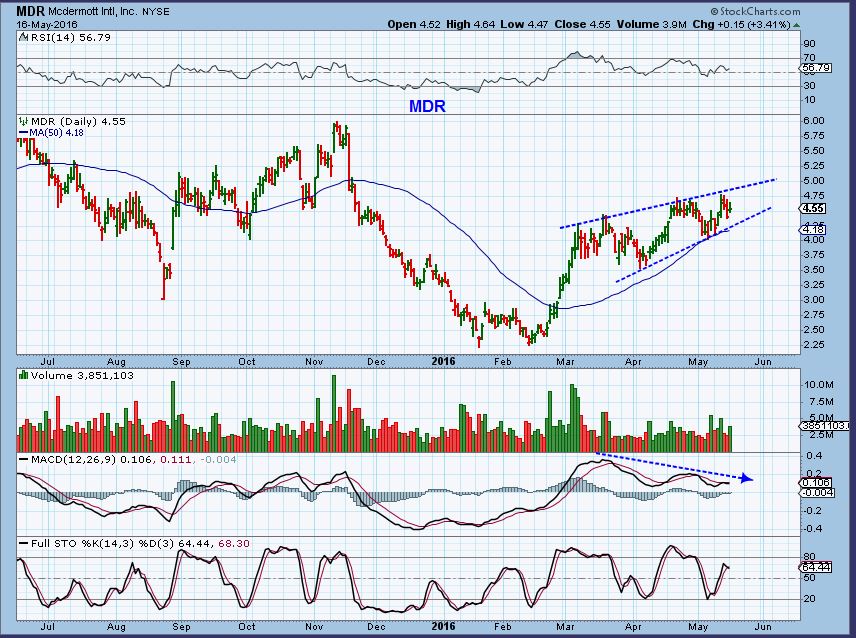
MDR – I mentioned MDR a while ago, if you own it, it is becoming a sell soon, in my opinion.
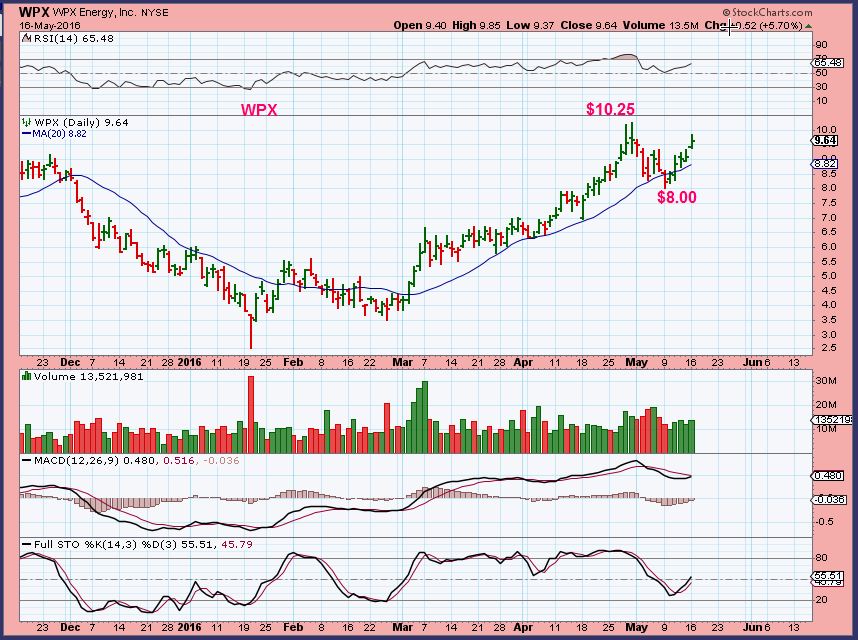
WPX – Mentioned long ago near $4 and again near $6. Still acting correctly, the drop from $10.25 to $8.00 was normal. Notice the WPX rides the 20sma, so it has remained strong.
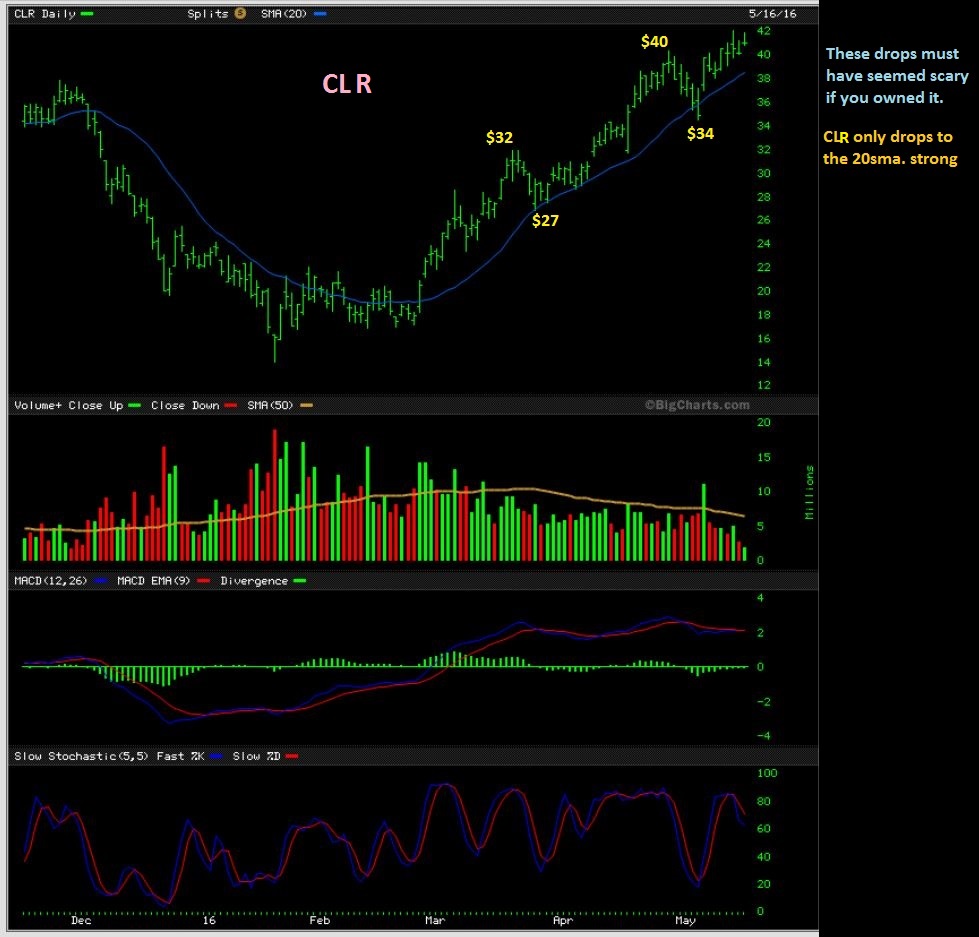
CLR – This is a strong run, and I just wanted to point out that even the strong running stocks have corrections that can seem steep. $40 to $34 may have seemed scary if you owned it. This also has been a buy at the 20sma.
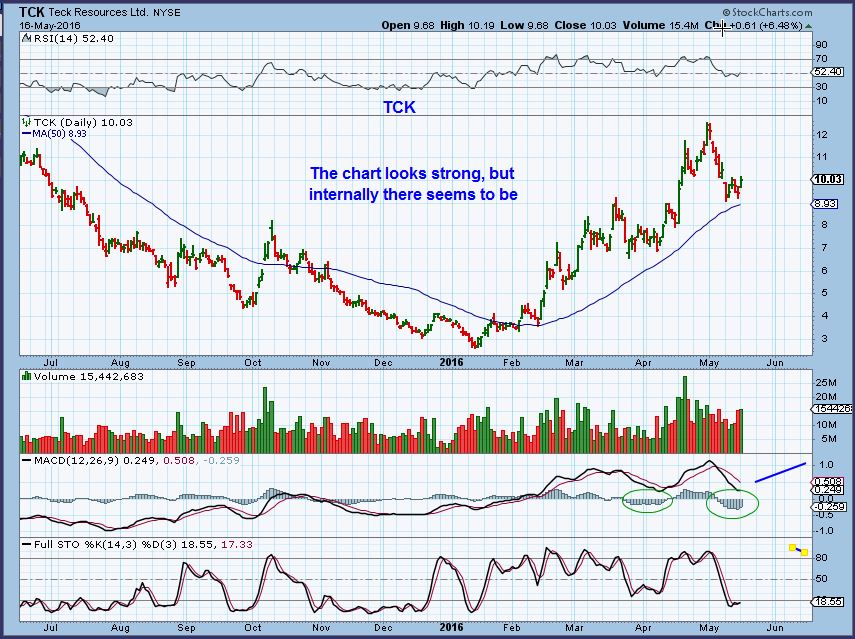
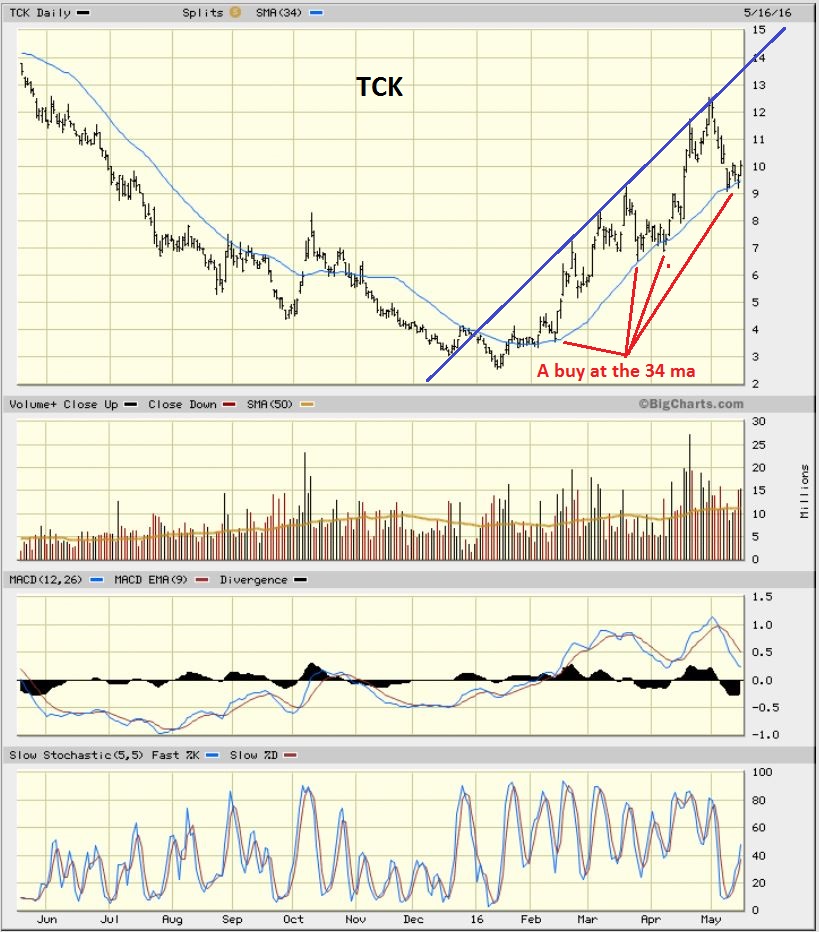
TCK – TCK has pulled back to a potential buy spot and is oversold, so it could be bought as a trade from here. I should have drawn TCK with a 34 MA – and it is a buy right now for a trade. USE A 34 SMA.
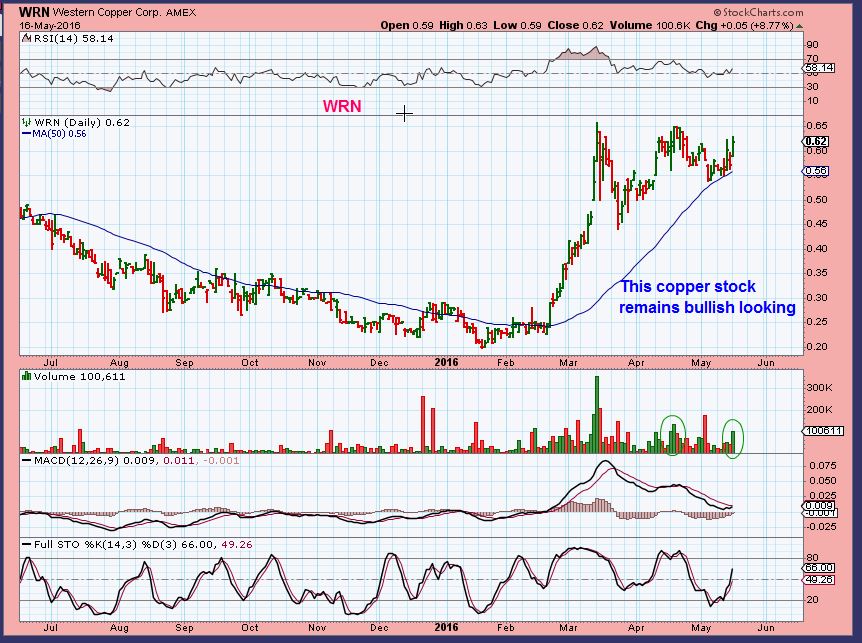
WRN – This copper stock doesn’t seem to care what Copper does. It remains bullish and has put in a bullish consolidation. Possibly bull flagging.
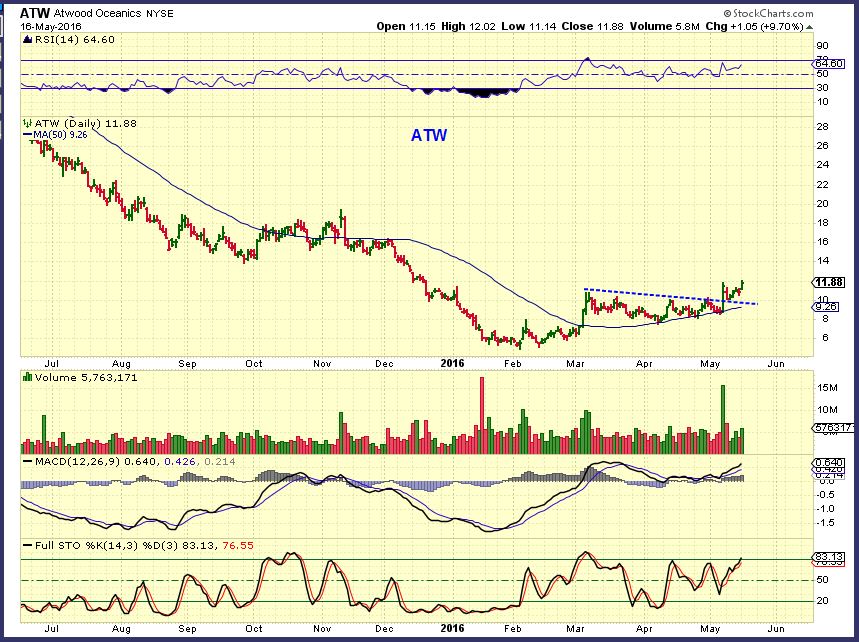
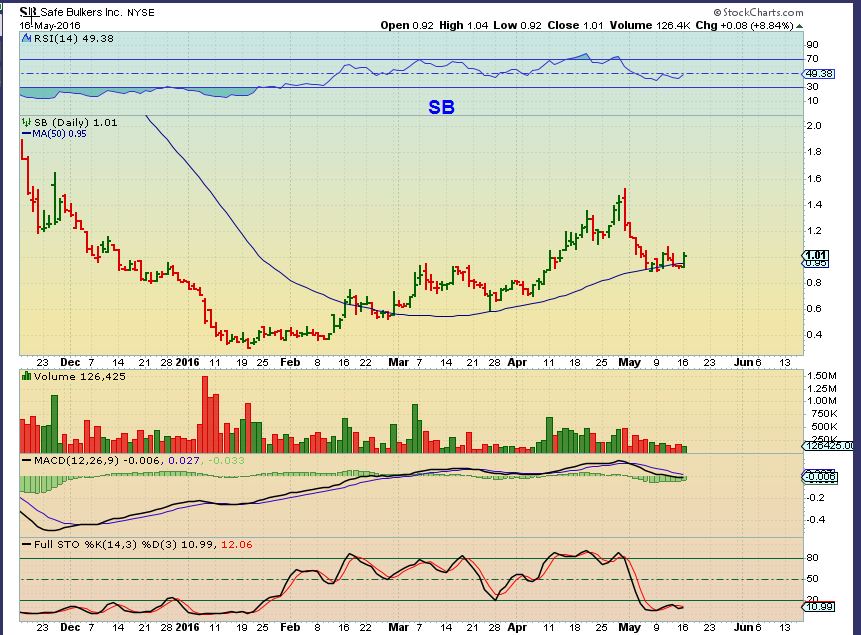
Here are a few SHIPPERS setting up. The Shippers have been very volatile around earnings release, so if you take a trade here, please do due diligence.
ATW-
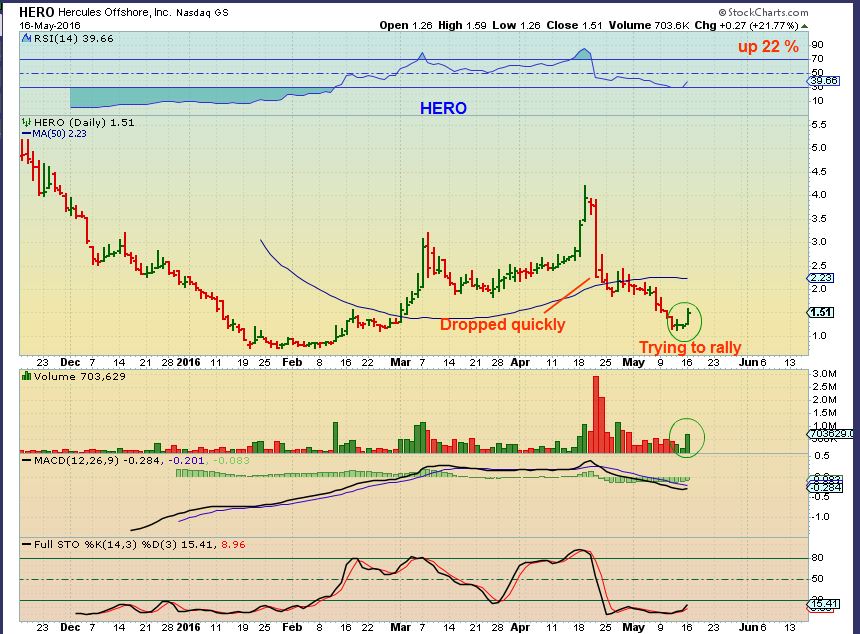
HERO – Got crushed in mid April and now has double bottomed with a higher low. This is a bit tricky looking and only for the nimble. It was up 22% Monday.
SB –
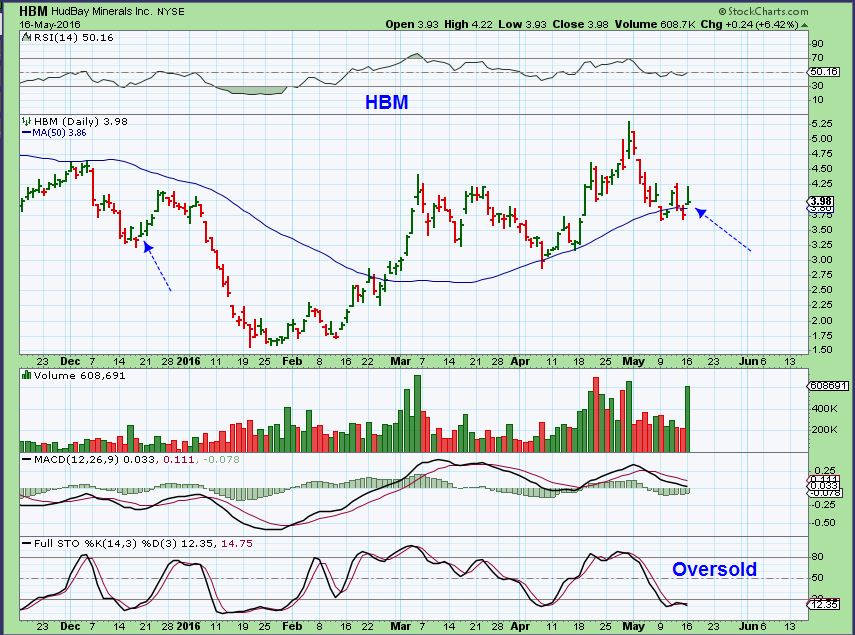
Finally HBM – A Copper / Gold Mining company. I still own it . Does this do a shake out at the 50sma on pull backs? So far, yes. It took off at the open Monday and was up over 13% , but then started to sell off, closing up 6%. So that leaves a weak reversal type candle, but I’ve pointed out that it has done that before at lows right before a rally. Volume today was strong.
.
I know that this is a lot to digest, but I am NOT saying to Buy all of these. What I am really doing is trying to show a well rounded view of Commodities and Energy. Most have pulled back now and are around some type of support. Some have been very bullish all along, others have shown a deeper pull back this time around. At this point, they are still valid trade set ups, but being this late in intermediate cycles, the follow through can be weaker. An ICL should be closing in for Commodities and Precious Metals into the summer. Oil can go for 6-8 Months from ICL to ICL, so Oil and Energy may just try to keep working higher. Oil may pause or just break through the $50 area. Time will tell.
.
That said, some may want to be patient and watch what the Miners do when gold dips down. Gold is due for an ICL. I cant imagine it being all that mild, so what will Miners do when Gold finally dips down? Miners may set up low risk again too. Please keep in mind that being this late into an Intermediate Cycle, upside may be limited and sideways moves may occur, so positions should be smaller, trades may be quicker, leverage buy & hold positions are dangerous, etc. Lets see if we get some follow through on Tuesday.
.’
~ALEX
TCK – This one shows TCK at the 34 ma. It is a buy with a stop below $9.00. Please notice how this moves day to day. It has great potential, but not for the trader looking for a smooth ride. The dips from the blue line are deep.


Thanks Alex, when you see an ICL in whatever I trust you will let us know???
You wrote: ” the best trades are found at ICLs”. I will wait for that, the rest you know.
Alex…. you give us excellent lessons, and….. now to receive and do it.
Have a good trading day.
Hi Geurt,
yes, I always point out what I am seeing. Patiently waiting for Miners to pull back is not easy, and some pull back and run on their own, allowing traders to continue to make money in this sector.
See ASM yesterday , and GORO. For traders in front of the screen all day, The train keeps rolling along.
Hope you are feeling better today. I would appreciate an answer to a question when you have time…several times on comments on charts you mention “left translated” and “right translated”. What does that mean? Thanks.
Thanks Nancy, I am fine today. It was a stomach / food issue.
BASICALLY : Picture a daily cycle being 30 days long from low to peak to low.
If the Peak is within the first 14 days, it is on the left of the 1/2 way point. That is Left Translated. The further to the left the peak is, the weaker that stocks bounce was. It shows weakness.
Then picture 30 days from Low to peak to low, and that peak was on day 25 of a 30 day cycle. The peak is right translated, and shows that that stock was strong enough to peak late in the daily cycle, so the next bounce or rally could also be strong.
giggle
*stick forks in my eyes now please
Hmmm, tempting at times, I guess.
Anyway – Cycles, It’s like the ocean , Maria. Ebb and Flow. You just need to learn to roll with it. 🙂
mmmmm … nice visual.
agree.. i *still want to learn cycle theory and how it correlates with EW theory…
They do work well together, and Cycles are far easier to learn than E.W.
A bit less intricate.
And just like the Ebb & Flow of E.W. – you get the occasional Tsunami
Thanks. Another mystery solved for me.
Obviously I cannot cover everything in the reports, but yesterday UUUU broke higher and other Uranium stocks started to look interesting for traders. See UEC, URRE, UUUU.
Warning : I didnt cover it because this sector has been a little too jumpy and unpredictable at times too. The April base in URRE broke down and See DNN , etc
F.W.I. W.
I do still see successful trade set ups in the Miners continue to play out, despite Golds sudden sell off yesterday and the USD rising lately.
THESE ARE NOT LOW RISK BY NATURE if we expect a pullback or dip in GOLD, so I dont put them in the reports, but using a reasonable stop does allow TRADERS to trade them. For example: pull up charts of …
RIC – Use your 20sma. This has gone up / sideways / up. Gorgeous chart.
CDE – Use the 20sma
AG – Use the 20sma. It broke out from a sideways consolidation, very similar to what EXK is
doing now ( Use a 20sma to view both).
MUX – beautiful chart.
GSS is consolidating.
BAA, ASM, GORO, as they set up & move higher.
I sold TAHO around $11, it hit $14
Now I see PPP, which has not moved higher at all, in a base ready to break out.
Now that I’ve posted this, maybe they’ll crash down a bot like GPL did 2 weeks ago 🙂
hmm … ur NQ is gettin spunky…
yeah, it did the same huge gap up in March but gave it up with the markets. 🙁
i quite like the look of your DNR.
Ditto – even the wkly
yes..it’s a beauty,.. right?
… my HelloFloridaInFebruaryFaithfulFriend….
I didnt know that you going to see Nancy and Peter 🙂
( I think it was Peter in Miami)
both
*nancy is teaching me Piano AND how to paint
**ahemmm .. Peter?????? I am an open book….game for anything … u wouldnt happppppen to know cycle theory? smirk
Paint…yes. Piano…LOL! …No!….you wouldn’t want me!
Lol..
I wonder why i thought piano. . Too funny. Was it u that wanted to play as a child. .or am i thinking of someone else?
Ahemmmmm…. I’m here Maria.. sorry but I hadn’t checked in all day!!! Don’t know squat about cycle theory!! Weinstein stage analysis, thats about as complex as I get!! What can I teach you??? I have to think about that….. I haven’t played guitar in forever, but I can still teach you, since you seem to have a liking for art… 😉
😀
Checking in for the first time today!!!!!
I also forgot to re mention the Bull Flag set up in LGCY. It was in a report last week.
refresh for 2 chart ideas from last week
.
Did I mention CWEI? 🙂
This is exactly what it did in that move from $6 to $21. Everyday I would look at it for a pull back and it would be up day after day.
yes.. i got that one the other day when you mentioned it 🙂
i did commend your pick on friday, i think it was
Great It has some nice upside potential is it keeps running, my initial targets was $29-$30, but there is little resistance on the left side of that chart
HBM looking a little better today . BTE acting correctly, and it is one that has a great weekly chart base
Thank-you Alex.
Ur welcome Geurt
PGLC just broke from its base
giggle.. that’s thrice this am … 1st LGCy, then BTE, now PGLC …
I am missing something?
ha! sorry- i was looking at charts and u posted EXACTLY same time…
ok, ready….. BCEI & HBM
Well, thats what I was looking at. HBM looking good on the recovery, good volume.
where is the volume on these? zzzzz … peeps on sidelines?
been watchin SXE as well – waiting for that to finish up.. zzzzzzzzzzzzzz .. my eyelids are heavy.. feel like Im watching one of your old videos….. teehee ;o)
Well,
HBM has 200,000 at 11:30 – now look at when it was selling off, it had a little ove 200,000 each day all day.
BCEI – Larger volume days are the up days and it held all support. Not only that, but I added the other day at $3 when it had a small gap open there, and its already almost $4. 25% gainer on just what I added.
I think the volumes are bullish
well not those two… LGCY, IPI, SXE, CLNE, BTE-arex etc. others im watchn
Here is what I do, I find it works 90% of the time ( Except for GDX)
Take your noon time volume and double it. That is usually what you’ll see at the end of the day .
BTE has fairly good volume today.
Yes, LGCY & IPI have had lame volume for a while. I own both.
ooo… ok tx CHARRRRRRRFREAK …
and i should add.. i was looking at ‘right now’ not the daily volume.. cant really study charts – just in spurts- when I have a couple minutes –
SXE looking less sxey by the hour … hope this picks up
Dont tell anyone, I bought the set up in EXK this am
Refresh – I jumped the gun, but its worth a try. Worth a trade on a bullish set up
.
You are funny ALEX, where is your stop?
Thank-you for letting me know.
I have 500 EDR. (CAD)
I dont really want to be stopped out unless Gold & Miners really start to sell off, so I will mental stop it below $3.50 ( The consolidation ) – but only if I think we are really getting a strong sell off in Miners.
Thanks Alex…. let us (me) know when your mental stop is target, or you get out again.
sdrl has some nice action – might be time to come out of its base
It is oversold. It got rejected at the 200sma and lost the 50, but maybe that was a shake out. Its currently Pushing against the 50sma overhead. It’ll be good if it can push above it.
SA still looks nice after the consolidation…..
It does, and it looks like the MACD wants to cross back over too
AXU and BAA
Miners continue to defy the pull backs. Just sideways consolidations.
My plan has been to hold miners “Old Turkey” but I wanted to rebalance & change some individual miners, so I pared back one week ago today, trying to buy back at lower prices, of course.
YES, I’m still waiting! I may have to start easing in, although this sure doesn’t seem like a low risk area to do so.
Thanks for continuing to share your thoughts on them each day, Alex!
That has been a plan that has been working. Congrats!
My core positions have no damage at all, in fact , they are way up from when I bought them , and even continued higher after I started to trade Miners a bit more in March / April expecting a pullback.
See RIC for example.
question… do u earmark a certain % for core – say in same act as daytrade?
or do u have separate act for LT core holds…
You may do either 🙂
1. Anyone with a retirement account can keep a core in there.
2. Anyone with only 1 acct can just buy & hold.
3. You may also do both.
Like if you bought MUX under $1 and didn’t sell yet, you may not want to sell for gains yet to avoid short term taxes, so you just keep it , determined not to sell pullbacks. I am told by others here that they do not pay C-Gains tax in their country, so they trade more to lock in gains with out that penalty.
Pretty vague answer, huh? Just pick 1,2, or 3 🙂
.. as my daughter says .. yeahhhhh No.
I do both… Butt… 😉 since delving deeper into day trading and EW theory, in terms of ‘holding’ thru the complete wave (or cycle) let’s just say there’s been a disturbance in the force…….. i find it more difficult to trade with equanimity …
Ignorance Is Bliss …… it’s how I began – just holding for longer term swings -but now I almost feel compelled to trade in/out of waves .. or icls,dcls,etc.
*i need discipline
meow
I’m guilty too at times. The ICL is that deep A-B-C at the end of 5 up, so knowing what is likely going to be a deeper drop than a sideways move, I tend to lighten up. The DCL’s are the 2 & 4 dips usually, so they can be sideways or mild. Easier to hold.
Right now I feel that E.W. and Cycles is just being stretched or morphed into something unexpected
if i don’t know where i am in a cycle/wave, and i don’t trade out at a safety stop of some sort, i just end up marching my troops back down the hill, Grand Old Duke of York stylee.
so i either risk overtrading, getting whipsawed in & out (but at least avoiding cascading waterfalls)… or i risk undertrading and getting caught in the deep red.. and that sucks more.
Yes, they are a good guide.
I did take the CWEI trade, up 30% currently. Thanks Alex!
I was watching MEMP and had an alert set, but it didn’t drop far enough to my buy point. Guess I was being too precise with trendlines.
Wild ride on OAS between yesterday and today. I tend to ignore intraday moves like that and watch the VWAP instead. I think that’s how they shake off loose hands.
Still holding ERF and PQ, hoping they join the party.
Great, glad you got that JT.
And VWAP – my friend Steve C. used to use that and trade by it in all time frames. VWAP was like a magnet to price.
ERF has been steady and its back up near former highs, so no matter where you bought, you are either doing well, or at least back near break even 🙂
I missed MEMP this time too. It may not be too late if I wanted to just jump in or see if it pulls back one more time, but I have too many trades on to bother. EVEP is back at its bottom too, weak volume so far on the reversal.
what parameters are you using for the VWAP ?
my VWAP doesnt give me any parameters.
this is the blurb from google…. “VWAP is calculated by adding up the dollars
traded for every transaction (price multiplied by number of shares
traded) and then dividing by the total shares traded for the day.”
Thanks for the definition. Where do you find it or do you have to compute it yourself?
i can get it as an indicator on freestockcharts.com, and as an overlay stockcharts.com.
both can be obtained without subscription.
dunno if or where its found on tradingview.com
Thanks.
TV — click ‘indicators’ button…scroll down to select
ta
What’s VWAP?
nice….congrats (cwei)
Alex…. how bad or good looks IBB or XBI ????
Thank-you-so-much.
Refresh for a chart –
I think it is neutral at this point. It returned to its base and it’s too hard to tell if it will reak out again now, or just bounce around.
It could just go up to the 50 sma and stop right at the top of the base, since that is resistance. It’s hard to know right now, but I dont see a lot of strength yet , so it could bounce around for a while.
Plus I dont dare to say Bullish, because I know you are looking at LABU – LOL. Just kidding.
Good luck with LABU. For me it’s been a guaranteed loss the several times I tried trading it. While I may trade that sector I probably won’t trade LABU again. I may try again it it hits sub $20 (nothing scientific, just shows how much I hate it).
Hi hear you….. 2x I make around the 750 dollars profit CS.
Now I’m doubting to sell it again.
Many times I’m too early to sell it, but sometimes I miss it, so as with DUST
Maybe just XBI or IBB? Single bio-techs occasionally implode during FDA time. LABU is leveraged so will decay. With IBB you can hold for a few without worrying quite as much. Buy more shares but less decay.
ALEX…. THANKS for your support.
Guert. It’s gonna pause at the 50-day at 266. If you’re in I’d lighten up then.
Thank-you Cason for your good advice.
Sleep well., till tomorrow,
OK MARIA _ LETS DO A TEST RUN.
It is 12:30 Eastern Time . ROUGHLY…
BCEI – should have close to 6 .6 Million by the end of the day
BTE – should have 3 Million
HBM – should have a tad under 500,000
…This is only a test sample 🙂
i like homework …………………….
ever the girly swot
I’m gonna have to google that .. lol
are you in sxe?
im watching this for a possibility… u??
https://www.tradingview.com/x/Y8ODwCTo/
not yet in, but its on my list to enter when the time is right.
am waiting after the wave 5 like you…..
in case you havent yet…
http://dictionary.cambridge.org/dictionary/english/girlie-swot
#guiltyAsCharged ;o)
#SummaCumLaude
although the major was Health Education … I was going to teach SexEd .. can u imagine THAT classroom? LOL ha ha ha
i envisage lots of rubber catsuits & stiletto heels
Kids, Plugs your ears! Earmuffs!!
All 3 came up close in my book, all came in under
BCEI – 6 million
BTE – 2.6 million
HBM – 465,200
,,,
so hott
i mean cool
CWEI – 17 % ( again) YAY
22%! … extra yay
hit some resistance at around 28.30.. are you selling any CWEI?
TEGP – Earnings release. Some companies are getting a nice response
Where Bill?
Bill here! Golf trip on Friday, back in the office Today. Nothing new to mention. Recovery progressing in Energy sector, day 6! I think your $50 target is a good spot (refresh). I see some resistance in that area. I’ll look to lighten up there.
Welkom back Willem !!!
Nice to see you here again.
Thank-you.
Danke Geurt!
Someone here that doesnt comment all the time ( Sorry I forget who) asked me about ORIG weeks ago, and I liked it.
I think that it’s a BUY from a Bullflag.
EDWARD or R.B.?
Hey Alex – I think it was me – I had it a couple of times and then sold…thinking to get back in now…have been watching it the last couple of days…..if I remember rightly it has decent balance sheet too…started to get it yesterday and wish I had now….
I like the way it is setting up too.
Earnings for ORIG on 5-23-16
Not me, Alex. But, I will opine; with oil taking off like this the energy stocks seem very muted.
Can wee take something from this Alex?
I think as OIL closes in on $50, ot will stall . UCO & USO have gaps below to fill, so Energy stocks may be doing ore of a consolidation / sideways. SOME MIGHT. Others like
CWEI, WPX, SM, SN, and others are just acting normally.
We arent getting the 20% gains per day like we did out of the lows, but I am still seeing 4% – 7% and cups formng in some like BTE, BCEI, ERF, etc
So what does it indicate. lighter positions, locking in profit, etc on the way higher.
Thanks, Alex.
Ed, same thoughts here. You taking some off the table yet?
Yes, Carson. I took some positive gainers off the table (in energy) as well as some that were just barely red, This left bigger losers along with big winners, which I trimmed somewhat. Just wanted to reduce my exposure in energy knowing its volatility. While I have a core miner base the FED release this morning may give the opportunity for a gold takedown and possibly a better reentry point with some more miners, if I have the courage!
rallies get sold these days
I actually see that a lot in the daily charts of many of the Miners. They run up, and sell off mid day and close only slightly up, but day by day, the overall run is higher.
I will put that in tonights report in case others are seeing that too. It doesn’t mean that things cant sell off even more, but I’ll add it in the report as a sidenote. Thanks.
Energy. Some of them doing the same thing. Mentioned a few names yesterday. I’m reading that as solid resistance overhead, right?
crap, or maybe not – I decided that SDRL was not where I want to be. It always messes with my head when I have a position in the red, and I hesitate to take on more opportunities. So I put in a sell order at my break-even and went down for a bite to eat and – bam – the order was hit – not sure it is a good one to hold through earnings next week.
Hey RB – I have some SDRL sitting in the red……have been trying to figure out if I should get rid of it or hold….I’ve made a little money on SDRL before but not this time…..hoping it will get back in the green for me but it’s taking it’s time…..not sure what to think about it right now…..:(
CWEI – Almost double from $15 in 5 short days . 🙂
when to trade out though Alex??
keep hold of some?
Yeah, it is tough. I have targets in this area, and higher. And at the left side of the chart, minimal resistance means that continued buying like today would just push it higher .
I usually sell a partial maybe 1/2 at my first target ( and regret it later when its at $60 ) 🙂
My experience in some cases is also….look at the left side of the chart. Why cant it run back up the way that it fell down? Sellers bailing out , then buyers piling in…no resistance.
comparing with the previous run-up in April.. it looks like we could only just be 1/2 way up.. if its an AB=CD
…yeah.. can u imagine is this repeats..?? yowza
https://www.tradingview.com/x/dAS1xVXC/
nice , and check out LGCY on a 2 yr weekly. I’d like to picture that return to former highs while I still own it 🙂
i like that one.. onto my list
WG possibly breaking out of its flag pattern.
https://www.tradingview.com/chart/WG/6v1jQ9c8-WG/
It does…or…it looks like it is at the same place as it was in the middle of the lower flag that you drew in.
It had that fake break out then and took a little more time. Good catch
For whatever it’s worth, I thought this analyst upgrade and DD on HBM is interesting http://business.financialpost.com/investing/trading-desk/hudbay-minerals-inc-upgraded-at-rbc?__lsa=ddca-ec16
Also this link from IBD — recent analysis of zinc http://www.investors.com/research/futures/zinc-other-metals-could-be-at-brink-of-recovery/
Inventories also fell in latest report http://www.moneycontrol.com/news/brokerage-recos-commodities/zinc-to-trade1239-1279-range-achiievers-equities_6664061.html
PS. Fed minutes released tomorrow at 2. Market has rallied after minutes in previous months…unless Fed minutes are hawkish..
I HOPE TO HAVE THE REPORT OUT BY 8-8:30
Yeah!! 🙂
All, folks here looking to start taking profits in energy? USO getting ready to grapple with the 200-day, oil near 50, markets having a little bit of trouble staying positive. A pullback soon or at least longer consolidation wouldn’t surprise here in a few.
May not completely clear the deck, but have mentioned a few times we’re seeing upper tails every day on the candles. Still moving up but clear on some charts that there is resistance. I’ll tell what I won’t do is a CLF where I give all of a huge win up!!!! Thoughts?
Can CLF go higher here (5.25) ?