
May 15 Weekend Report
While looking at a variety of charts for the weekend report, I started to see things give us some mixed signals about he health of various sectors. With that in mind I wanted to do something just a little different for this report.
.
I wanted to just take a fresh unbiased look at these charts and say to myself, “If I didn’t own a position in this area, would I view this as Bullish and want to Buy? Or would I view this as Bearish and avoid it?” At times when you own a position, the bias is simply trying to justify why we might be holding a position. This rather neutral view may be helpful at this time. I am getting mixed signals at this point.
.
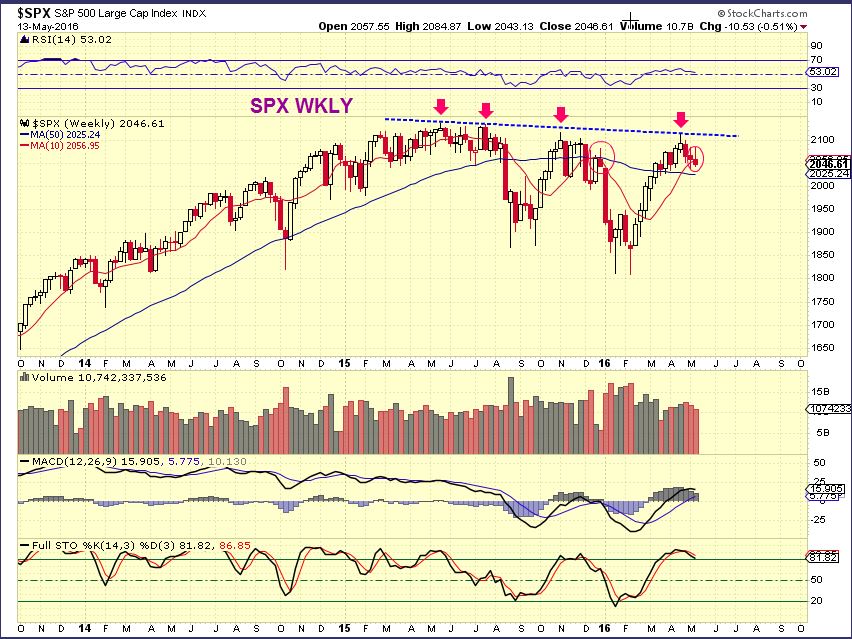
SPX- I have been waiting for a second run higher, possibly breaking to new highs, because CYCLES seem to indicate that the first daily cycle is very very extended. That said, this weekly chart could be viewed as 50/50. I see price rejected at the highs again, but that would just be the first daily cycle peak. Another push higher COULD break out to new highs. It is overbought, but it can stay that way. Notice the little candle in the red circle. We saw that before a plunge last time, but it was also in the 3rd daily cycle.
.
This wkly chart would have me neutral, or with a stop below that 50 ma.
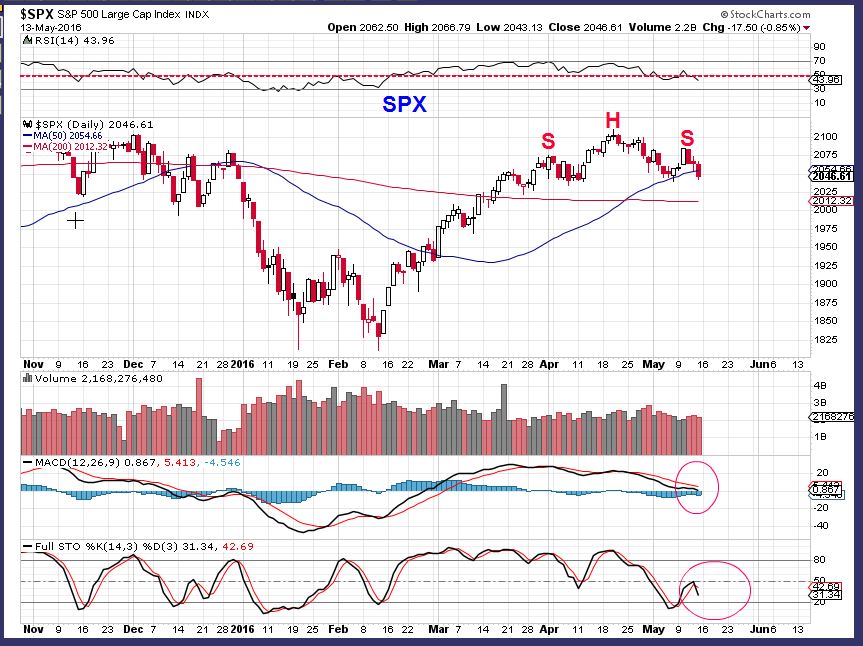
SPX DAILY – This chart would have me feeling bearish. A drop to the 200sma looks likely.
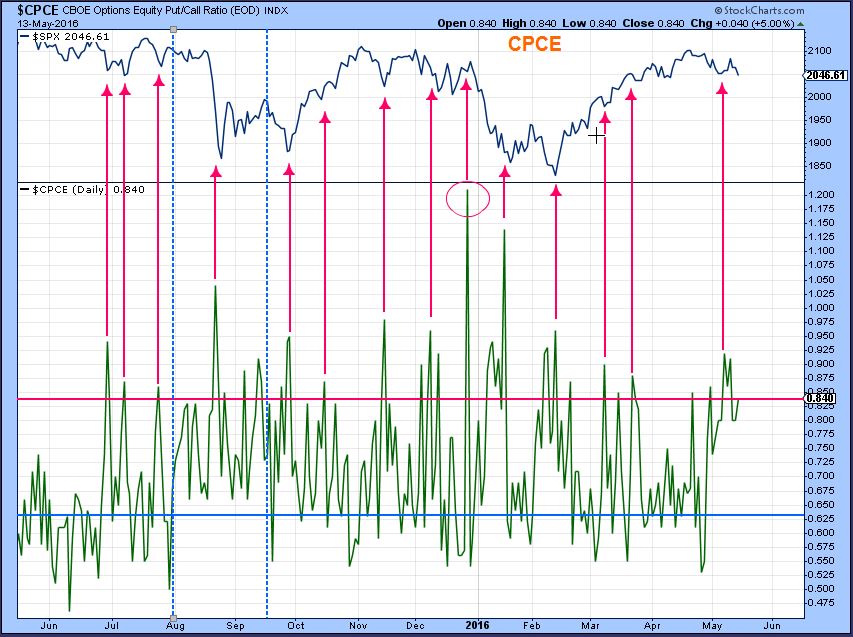
The CPCE is closer to where bottoms took place and not tops
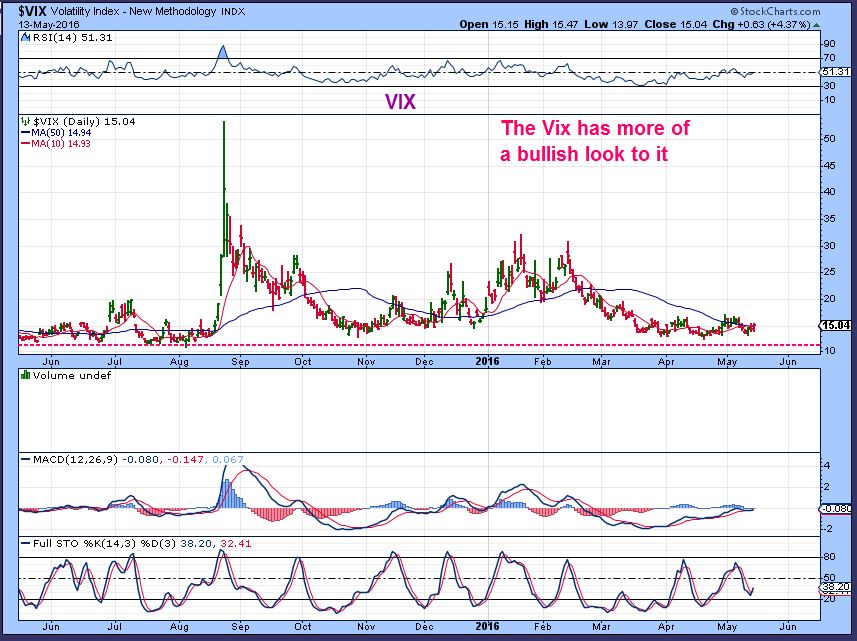
VIX – The VIX looks bullish and that would be bearish for the markets. Maybe that H&S on the SPX plays out, and the vix moves to 20 , like it did in November.
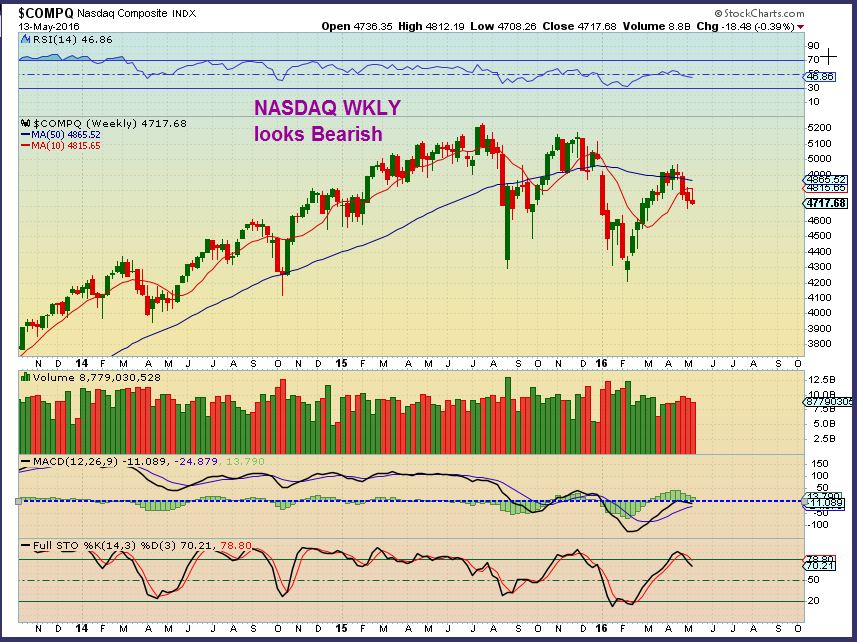
NASDAQ – The NASDAQ just looks weak and as though it is struggling. It is not near former May 2015 highs like the SPX is. The NASDAQ looks bearish to me.
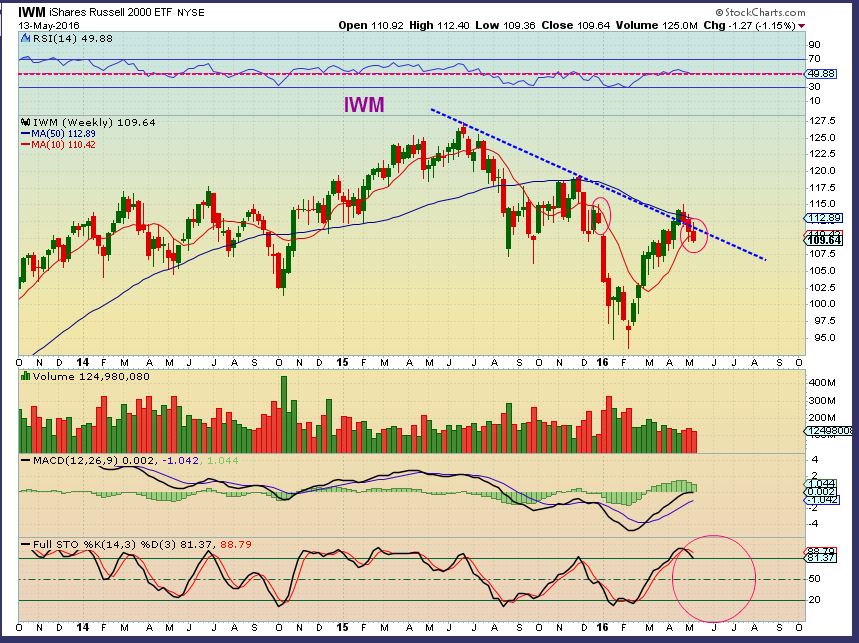
IWM WEEKLY- The Russell 2000 had a nice rally out of the lows, but is dealing with strong resistance from the price action in from Aug to Dec last year. This chart is neutral and pretty much needs to prove itself.
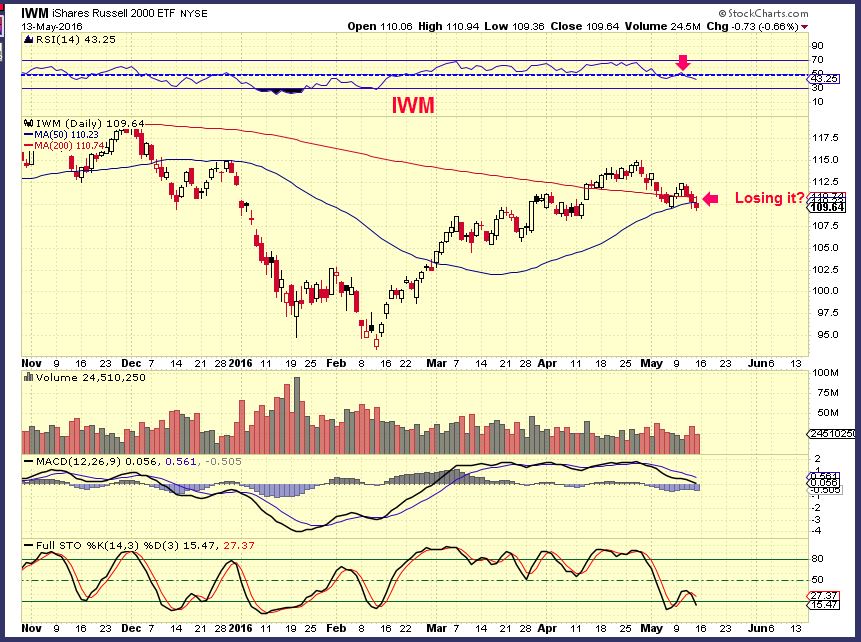
IWM DAILY – This looks bearish and is showing weakness.
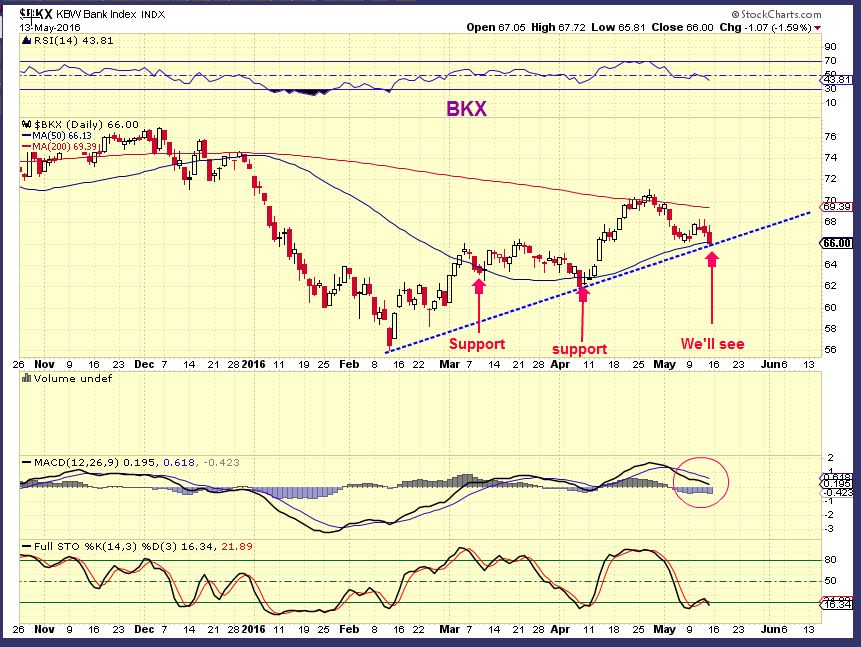
BKX – This is the Banking index. It has been recovering since February and it sits on support in the form of a trend line and the 50sma.
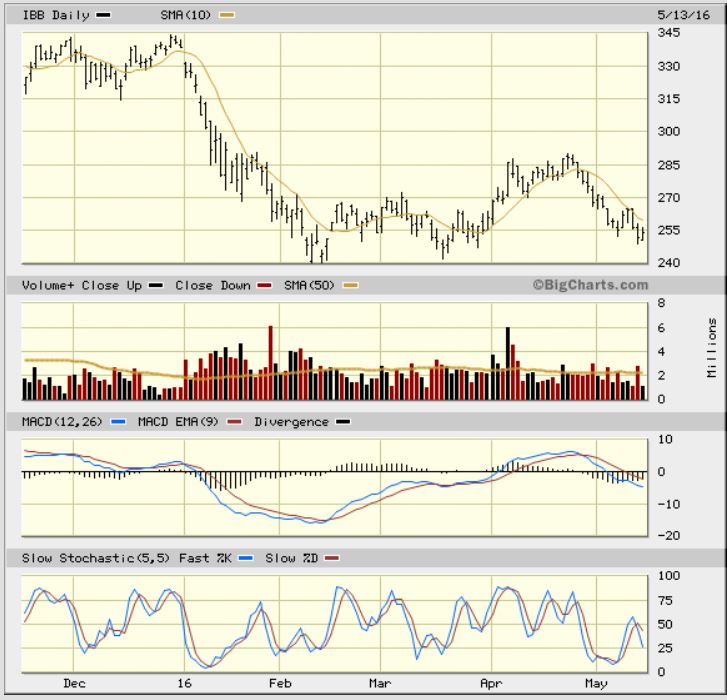
IBB – The IBB had that false break out from a base and has been dead money if someone has been holding a position. As mentioned in a prior report, this chart no longer interests me , until it proves itself. It could remain inside that base or even break down with that MACD failing like that.
.
So overall , the above General Markets and various sectors are neutral to bearish until they show a sign of strength. Cycle count would indicate that a push higher should be coming, but lately I have found ‘cycles’ alone have been difficult to read and pretty much useless in Precious Metals. Now we see in the SPX that the first daily cycle is supposedly as long as 2 daily cycles, stretching out? Cycles are being altered by forces within the markets. The charts are becoming bearish in several ways until they show signs of strength.
.
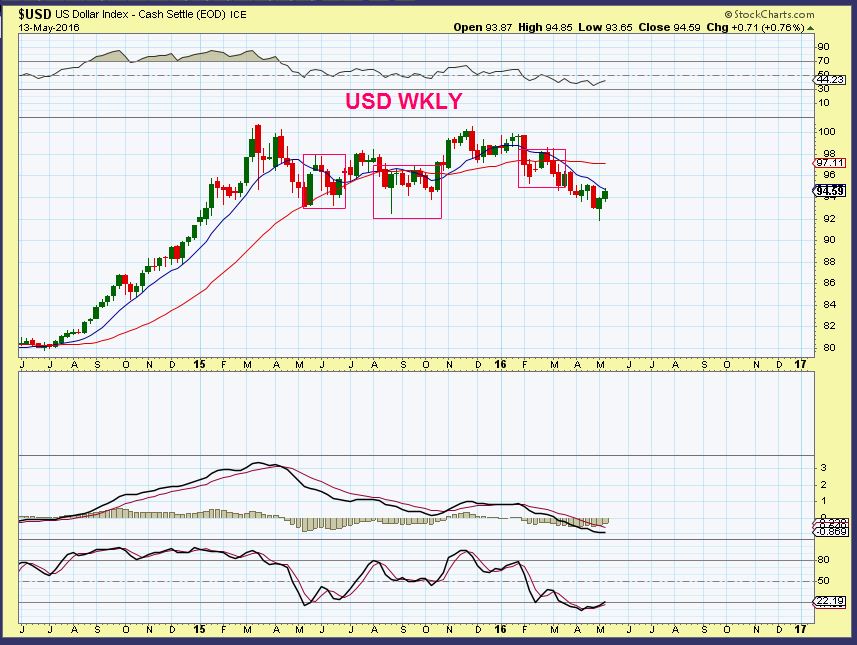
The USD WEEKLY – The dollar should have put in an ICL I believe, but it still looks like a top in the big picture.
.
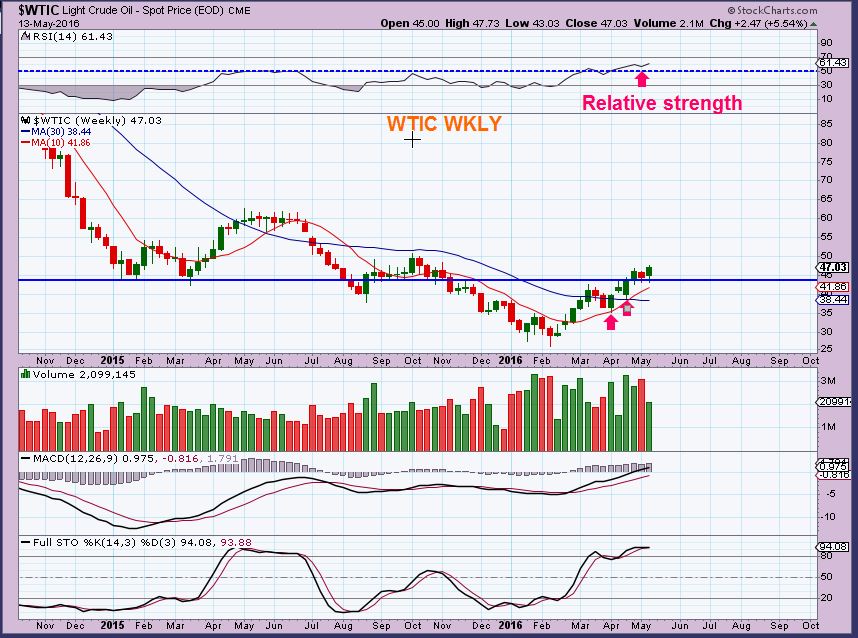
WTIC – I have liked OIL and Energy since calling the lows at $26.
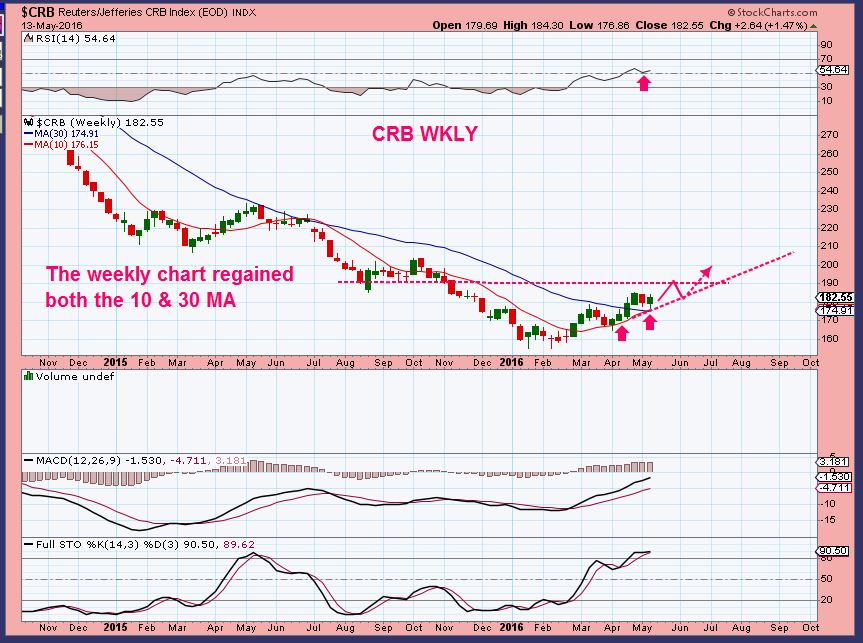
CRB WKLY – The CRB has been acting correctly and looks bullish long term. I had a 190 target from long ago and then it could stall a bit.
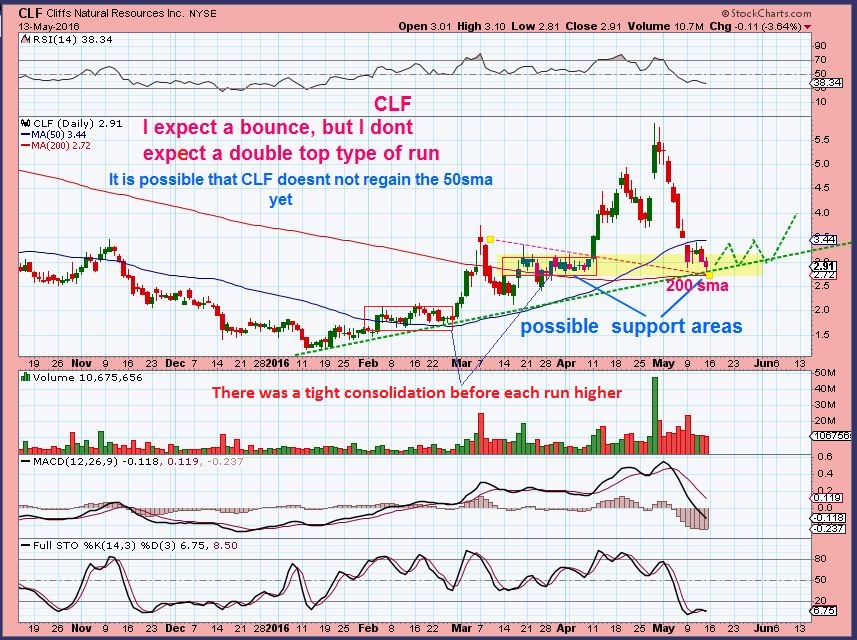
When it comes to some of our Metals stocks like CLF, FCX, AA, VALE, ETC. They have had a couple of strong moves higher in their efforts to recover from a bear market type sell off. This is what can happen in the process.
.
Because I think that we may be looking at a 3rd daily cycle here in the CRB, some stocks might not be as strong as they were during the first couple of legs higher. I tend to feel that the rally wont be to new highs. We could get a rally of sorts for 2 weeks ( 10 trading days = just a guess) and then temporary top & drop or move sideways to down. The CRB is made up of a variety of ‘things’, and base metals could move on their own.
.
IF we remain in a bull market, and I do think that the CRBs lows are in, the 3rd daily cycle starts to re-set sentiment from strongly bullish to negative. With recent price action people become less bullish, they get bored and frustrated when the gains arent as good as the first 2 runs higher. They may eventually even start to short them. In time we get a new ICL and shorts are forced to cover , which then starts another upside strong run again.
CLF EXAMPLE: This could go sideways rather than just take off higher, but it is oversold and at support, testing the 200sma and a trend line. So I would watch and see if it can break strongly above the 50sma again, or will it struggle?
.
REMINDER:
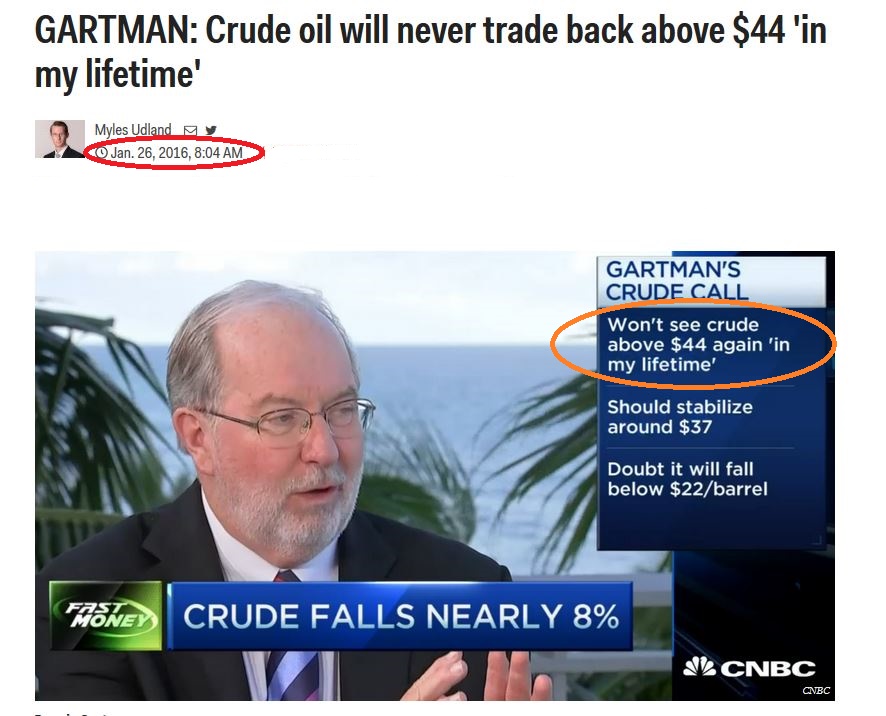
We all remember that I was watching Gartman with Oil. It seems like certain people like to makes these Bold Predictions to draw attention to themselves. They never mention it again when they fail. Some use Gartman as a contrary indicator. I was calling for Oil to go to $50 & Higher in time, he was saying that it will NEVER trade over $44 in his lifetime. This was his OIL prediction, and OIL trades at $47 currently.
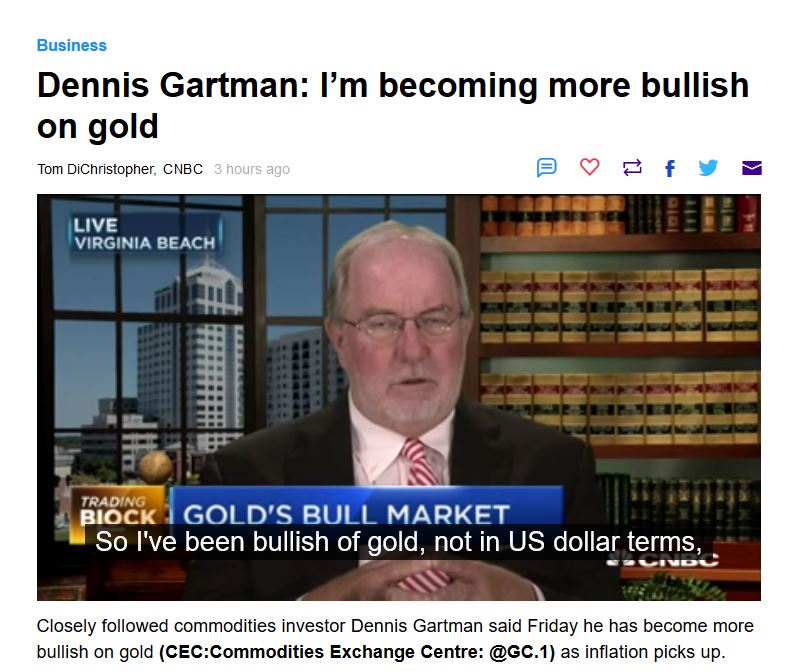
SO we have been waiting for GOLD to start a pull back. Does this mean that it finally will? Gartman is now Bullish on Gold ( After it rallied relentlessly from December to May). Maybe that means we get a May pullback into a summer low? 🙂
.
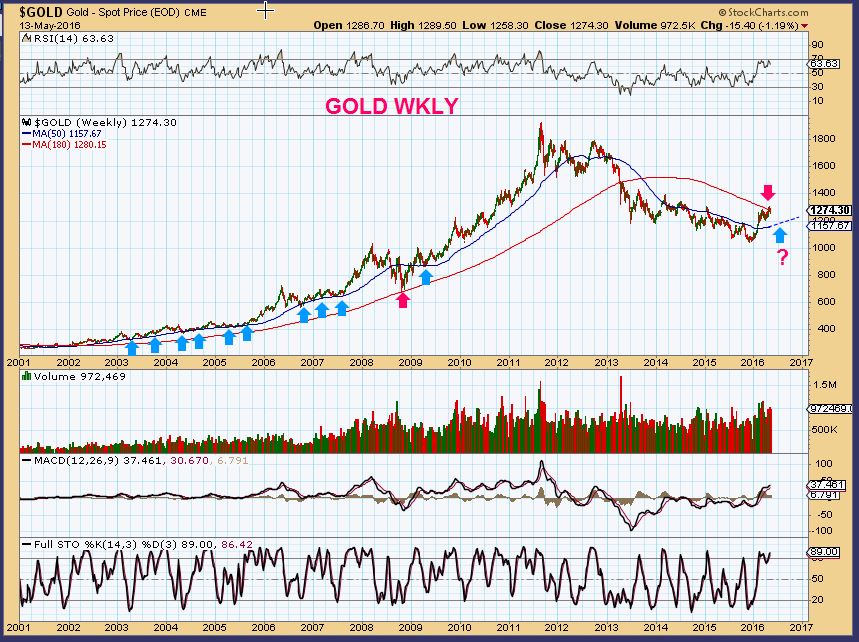
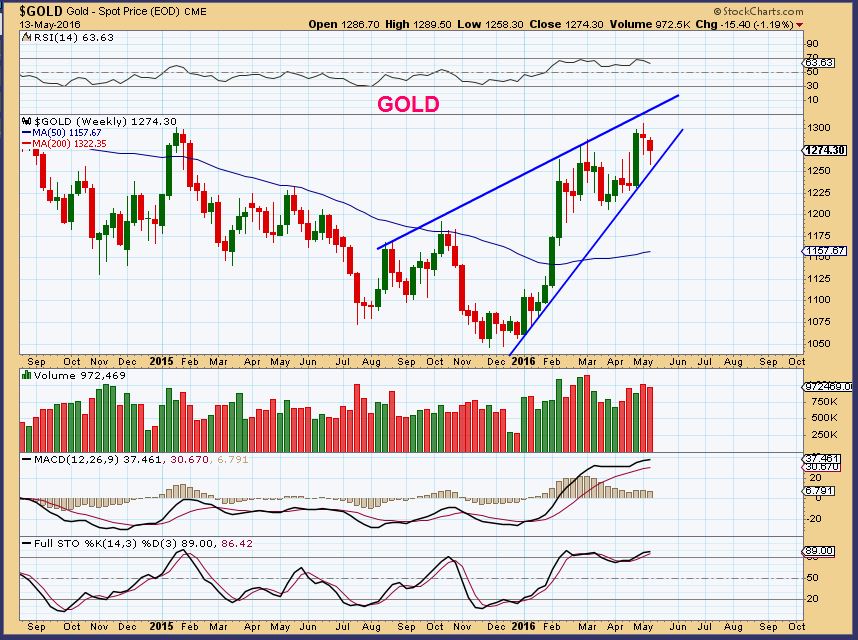
GOLD WEEKLY – This long term chart just shows that Gold is at resistance and so we see a sideways struggle lately. In the past it has pulled back to the blue line. Notice how it rode the 50 ma in the bull market, it became resistance for the past 3 yrs. It could drop there if we get our pullback, but this is a bullish looking chart. If this did a mid point sideways move and ran higher with a bigger correction coming later, I would not be surprised.
GOLD WKLY –
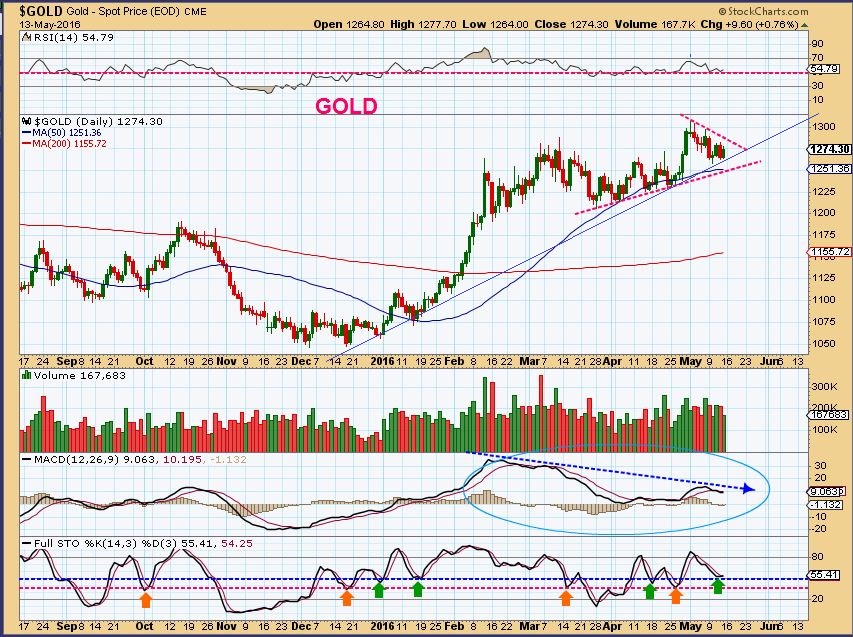
GOLD DAILY -So far price is capped under the trend line shown ( $1285ish), the MACD shows that momentum is falling. A pullback into the summer months would be perfect.
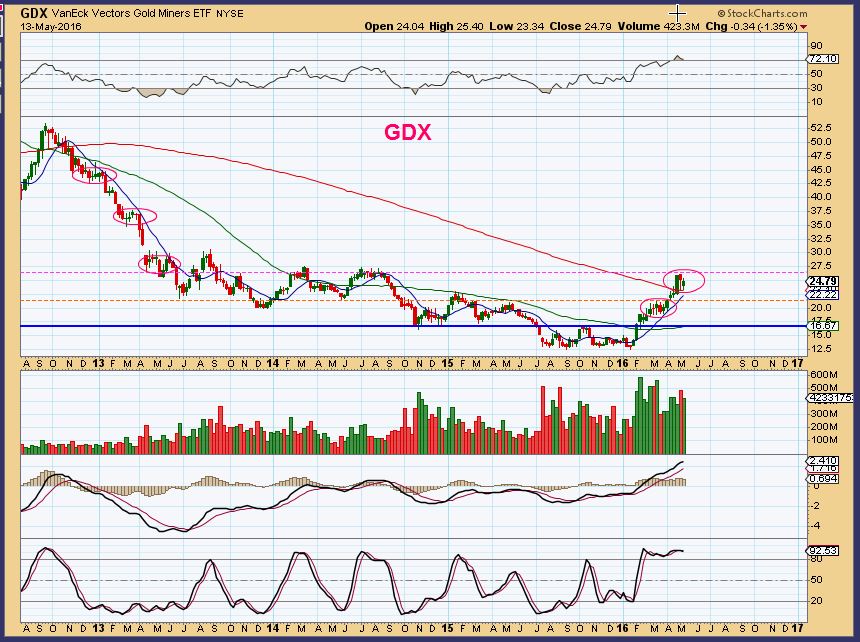
GDX – The Miners have had a very bullish push higher. They have run up, consolidated, run higher again, and are consolidating. This is a very bullish looking chart showing that the lows in Miners are in place. Longer term holders and Core positions have been rewarding this year. We are waiting for a low risk entry / pull back to re-position.
I’m sorry this is a little later than usual this morning. I collected charts this weekend, but still had to write this report up, and I’m feeling a bit under the weather on this Monday. I am personally still in IPI & HBM and Energy stocks like BTE, BCEI, CWEI, LGCY , and I added back to my CLF position ( Not as much). As I looked at charts this weekend, it does give a bit of a mixed picture in the General markets as shown above. The OIL and CRB charts still look healthy, and what can I say about GOLD , SILVER , and Miners that hasn’t been said already. I stopped trading Miners with the USD recent strength, and I am hoping for a pull back to gain a low risk entry. That run was excellent and even catching the first half was excellent as stocks doubled and tripled right out of the lows into March/April. Now some have even doubled from the March prices. A pullback into June or July would offer a nice entry, so I am remaining patient before adding any longer term positions in Miners.
Lets see what Monday brings for our Energy and Commodity positions, and see if the other sectors give us further clues to their future price direction. Have a good Monday!
.


Thanks, Alex – Hope you get to feeling better!
Thanks Cal, appreciate that .
…yeah.. what he said. 😉
Thx Maria
I do feel a bit better
Hi Alex, I’ve been wondering, can you tell from long-term charts where oil ends up???? Does it go back to $100/barrel. When oil hit the mid-twenties, many chartists believed that it would be in a bear market for many, many years. Cities such as Edmonton and Calgary rely heavily on oil in their economies. TIA
Hi Rob
At this point I have a target of $50, then the next target that looks perfectly acceptable is in the $60 to $70 again. It might stay in a range bound in the $70’s area for an undetermined amount of time. If we experience inflation, I think $100 Oil is possible over time.
Keep in mind that usually longer term forecasts play out differently than expected. I have to watch it along the way for signs of strength or weakness, will it consolidate sideways for 6 month to a year, or just remain strong and climb a stairway higher? So I might say that we are going back to $100, but I cant tell you if we get there in 2 years or 5 yrs
Dennis Gartman bullish on oil today! And gold. Now we’re in trouble. 😛
Alex, would you open a position in LGCY here if you didn’t have one? I don’t but the daily chart looks like it has bottomed in the short term. Hope you feel better as the day progresses. : )
If I was using a 20sma, I’d open one with a tight-ish stop below $2.50. It looks like a flag type formation, but also it is starting to look like VALE & CLF did after their first run out of the lows.
So – Just so you know what could happen here,
Look at VALE and CLF using the 20 sma and see what they did in March. After bouncing off of the 20sma, it wasnt straight up from there, there was a consolidation, and we could get that here too.
Much appreciated Alex! Great point about VALE and CLF and the need to be patient. Point taken.
Yes, patient to ride it, but maybe not patient as in waiting to buy it.
when VALE and CLF did that first run up, and then the drop, they flagged a bit and went sideways, but lows were in and they made higher lows in the consolidation, so LGCY might be a good buy here, but it may be sideways /higher/sideways/higher.
And the sideways takes the patient person to ride it out.
HBM looks Bullish here, back above the 50sma , above the 200sma, a d that is HUGE volume so far
And boom, there it goes…
Agghh! I’ve been watching that this morning and started to get in a few minutes ago…and then….boom like you said! Think I waited too long…..
The volume is very good and does indicate that there should be follow through to higher prices.
The volume right now is higher than it was All day Friday and All day Thursday.
You get in this afternoon? It came back to pick you up!
EXK and some other Miners look nice here after consolidating too, and the volume looks healthy. These Miners are still acting correctly.
Whew.. Between John Snow and HBM, coming back from the dead is a huge relief.
…
nooooo, plugging my ears and humming loudly – no more clues about TGofT. lol
Oh! I’m only on season 2. Ok, that particular cat was pretty much already out of the bag.
fxc too up 8% +
I love the action – BUT – there is nothing conclusive about which way the USD index is going to trade. hope it keeps easing down
refresh-
that a $15+ take down so far
.
Miners didn’t care, as overbought as they are, that was unexpected, imo.
Hi Alex…. good afternoon.
How is NatGas looking? UGAZ?
FWIW Geurt.. the 4H MACD has only just done a negative crossover (UNG/UGAZ).. so it would be very risky until the MACD recrosses the trigger line.
personally, im going nowhere near UNG until this happens
Sunof…. Thanks… this what you say is WAIT.
Thank-you so much for your response Sun…
yes indeed Geurt.. WAIT WAIT.
.. for a MACD triggerline cross (safer above the middle 0 line) and for price to reclaim the 13eMA
(especially using those 3x leverage monsters)
that is, using a 4Hour chart
as Alex might say.. stay frosty!
SunofGod 😉
Great help Son….. again THANKS a LOT !!!!
Thx for helping him SOG – I was away from the site . I agree, that gap down in UNG & UGAZ this morning looks like it may have put price below a trend line.
But if you are like me and hate having money in your account then grab some Nat gas!
I’m bullish long term on fundamentals but chart recently has been crap.
agreed.. totally crap chart.
still looks like it might yet have to complete a final wave 5 down.
from march to may.. was that an ABC wave 4?….. i dunno
just been so choppy & corrective
Happy monday Alex and everyone!!! Been absent from the comments today because, in all honesty, it is healthy to take time away. I also decided since last week to go back to what I am most comfortable doing, which is position, or end of day, trading. HBM seems to have thrown me off friday with the close below the 50, but is recovering it today, so I will be adding it back, but only 1/2, since I put the sale of HBM friday into ERX, which is also up today, so not missing a bid deal in HBM. This really is a lot more relaxing, having to look at the market maybe twice during the day. Really don’t know how day-traders do it!! Miners are flagging again, BUT… remember the 3x etf splits later this week!!!!
Hey Peter,
yes, good to take a break once in a while.
Miners flagging: I have been drooling over EXK and want to take it as a trade if it breaks higher, but I know that one of these times, it’ll be a false break and catch me 🙂 Its just odd that Gold got clocked earlier and GDX didnt sell off to red.
Gold and Silver are taking more short hostages… Miners not selling off is telling us, price drop today was just COMEX manipulation.
Wasn’t that something? Miners just didn’t give a crap about gold selling down pretty hard. Crazy sauce.
Alex, Looking at HBM candle (not pretty) but above 50 and 200 on lots of vol. Any thoughts?? Thx ion advance!!
Look at the dip that it made in December. It has the same candle coming out of that low.
Thx! See it now…hoping history repeats itself (not just rhymes). 🙂
Alex, similar question on energy – looking over last 2 weeks, lots of top tails – BAS, OAS, BCEI, and others. Consistently hitting HOD 15-30 min into trading day and selling back down, even today with crude oil up HUGE. Time to take profits early AM on some of this or am I reading to much into ‘the wiggles’ – regarding my timeframe, happy to hold for a bit, but planning to sell next top (Ha! Like I’ll actually catch that) and not ride oil’s next correction, at least not with full position.
Alex, I’m thinking of buying some calls on VRX, I like the chart and Citron is now long. What do you think?
Actually the chart has a double bottom set up that looks pretty promising, but it is also obviously a little bit of added risk due to the surprises that tend to pop up in that sector.
I do like the way the chart has been setting up & apparently stabilizing though.