
Light On The Horizon
We’ve seen some selling in the markets this week, are their brighter skies on the horizon? Yes, I believe there are. Lets take a look…
.
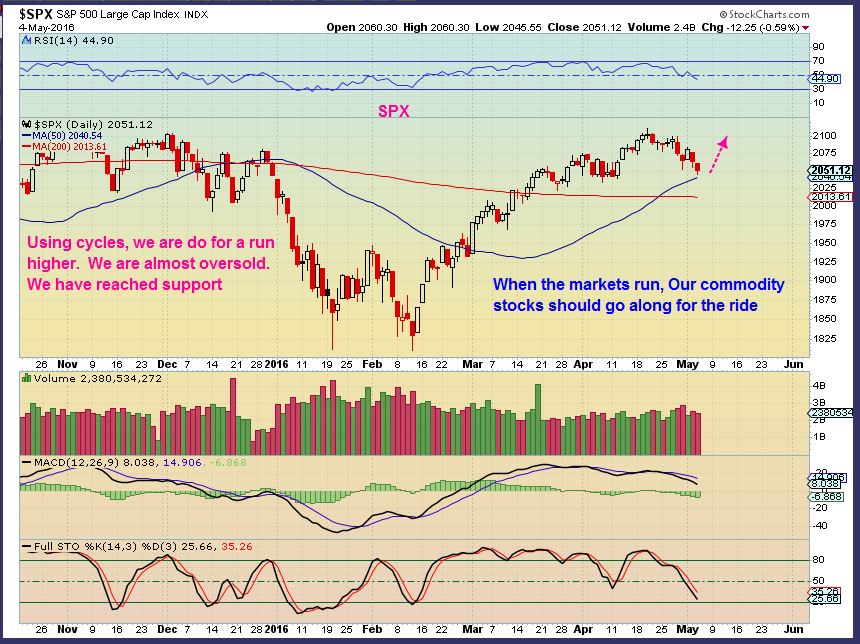
SPX – The selling in the markets should be about to end. There are several reasons for thinking this, and a couple are on the chart. I dont know if support will be at the 50sma or the 200sma?
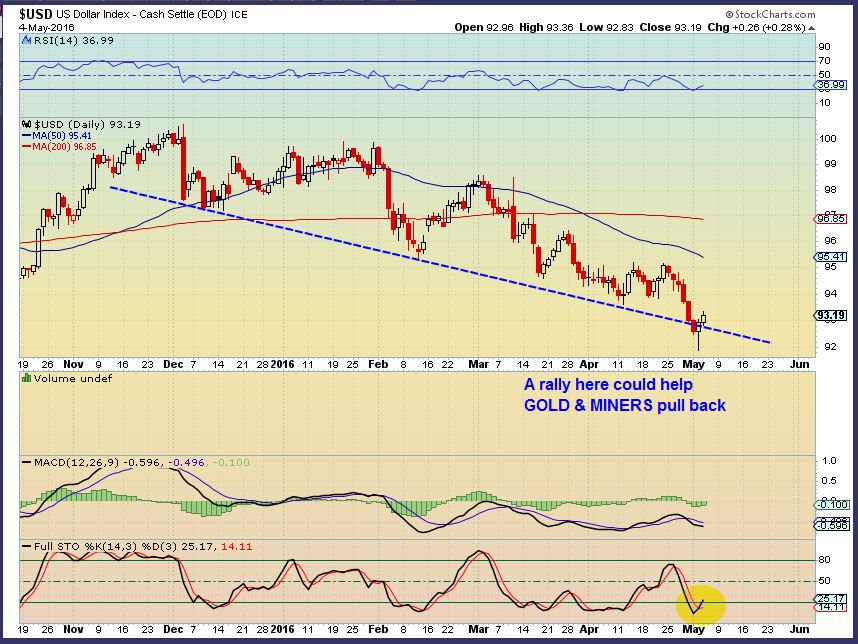
USD – Shake out / recovery
.
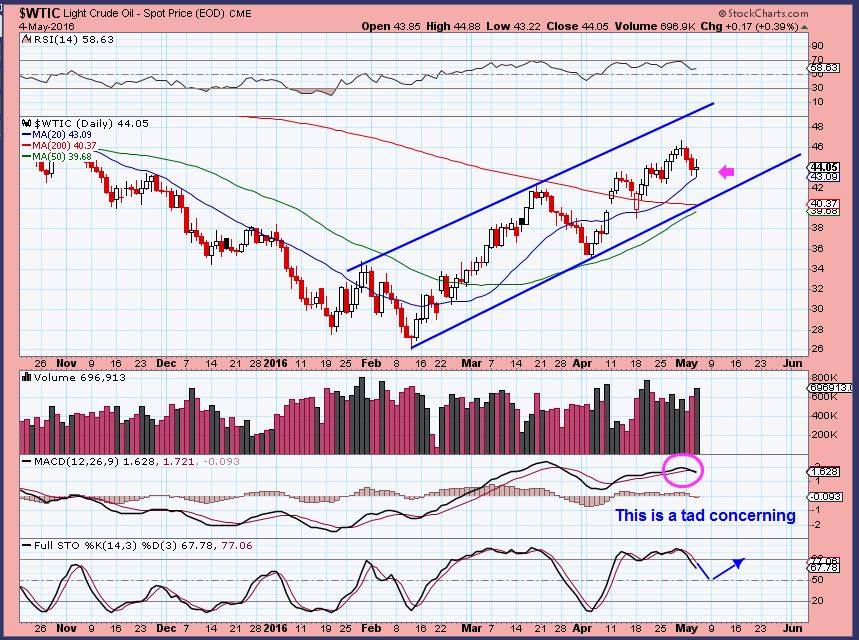
WTIC – Oil held on the 20sma today, but that’s a doji candle, they can lead to further selling. I want to see some strength in Oil soon. Oils cycles can be up to 50 days long, so possibly this is just a dip into a 1/2 cycle low now, but I do see some bearish marks too. The MACD is a tad weak too. Oil may still fall to the 50sma/ 200sma intersection and I will continue to monitor it.
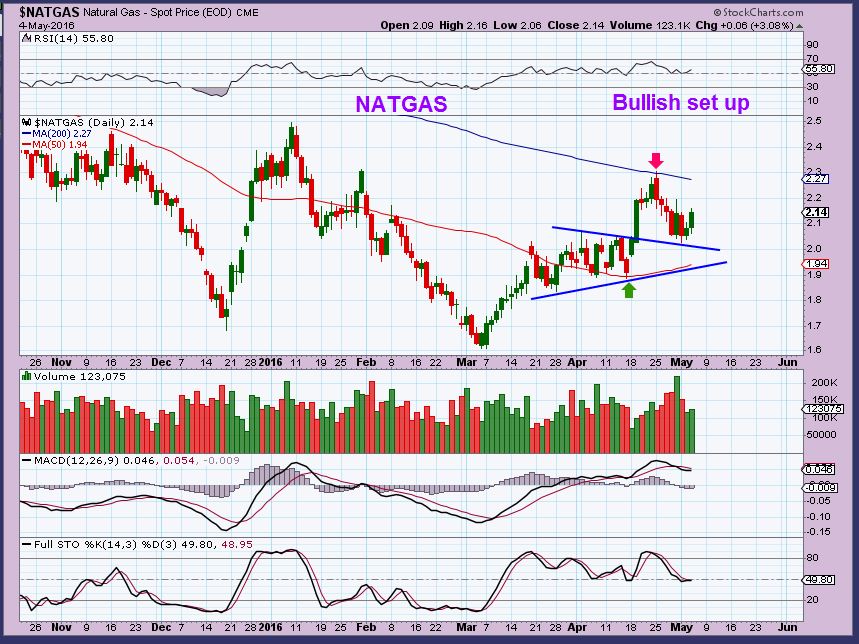
NATGAS – The NATGAS still looks like a bullish set up. It was blocked and supported at the major moving averages.
.
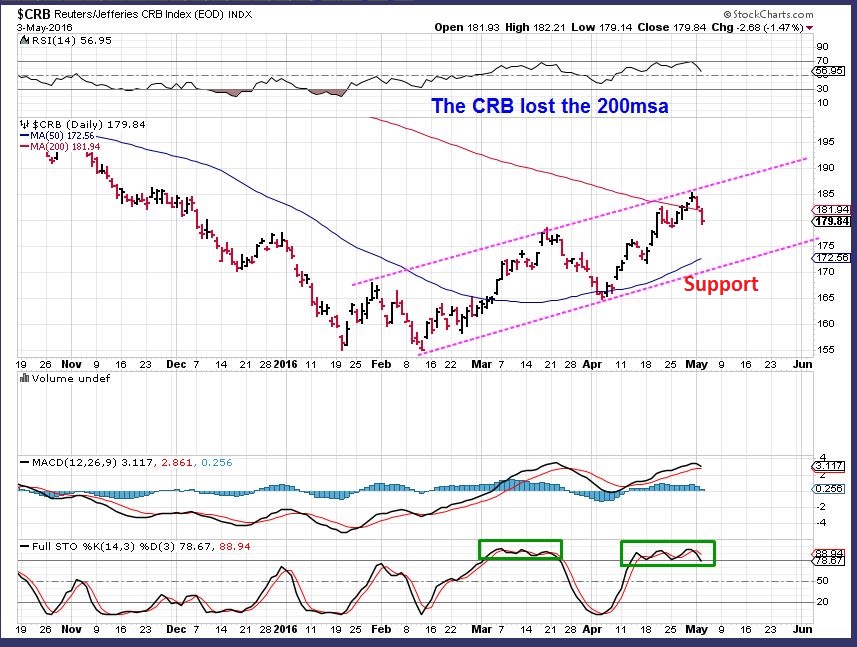
CRB from yesterday – Using this channel, the CRB met resistance. That means that it would drop, but it might crawl along the highs, battling the 200sma, or fall to the lower line, and meet the 50 sma.
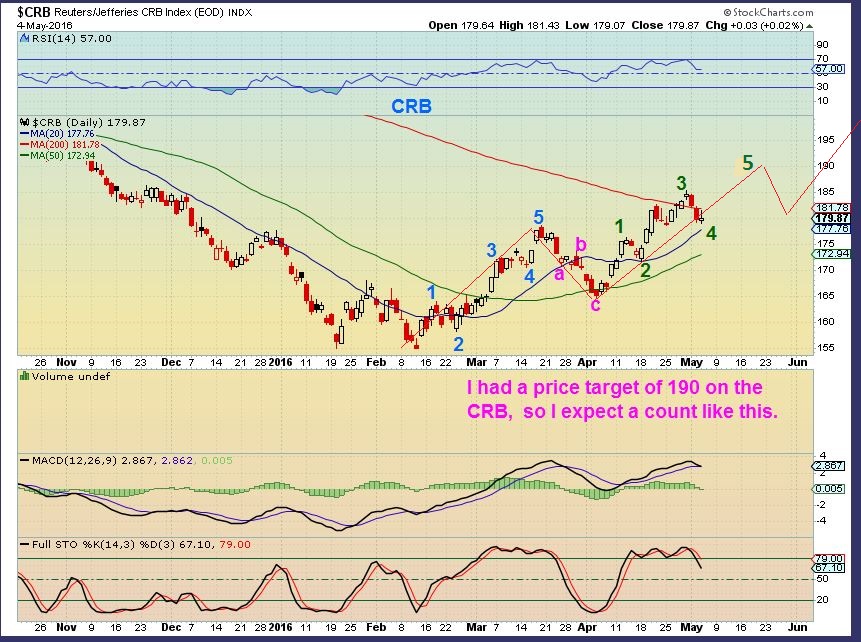
CRB #1 – This is what I was thinking for the CRB. This would mean that we do have another run higher, and that could happen when the SPX runs higher. HOWEVER, I didn’t notice that by pennies, the real low for the CRB was Jan 20 and not Feb 11th. So the first rise probably should start there. We still could go higher and get ‘5’ of ‘3’ at 190, but …
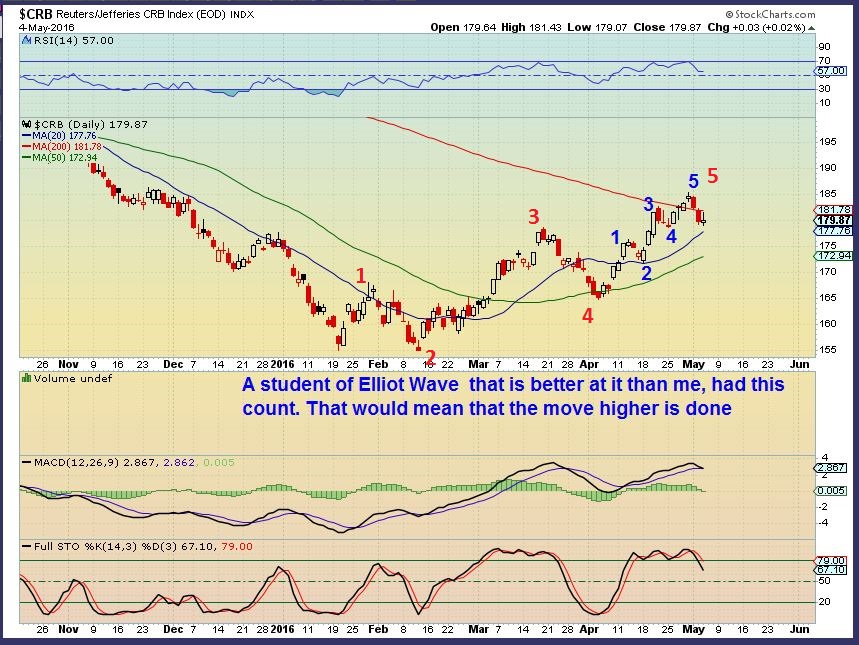
CRB #2 – This slightly different count was what a reader here had, and he has been using E.W. longer than I have, so he very well could be correct. If so, this would indicate that the CRB run is done for now. That MIGHT go along with a dollar rally, CRB drop.
.
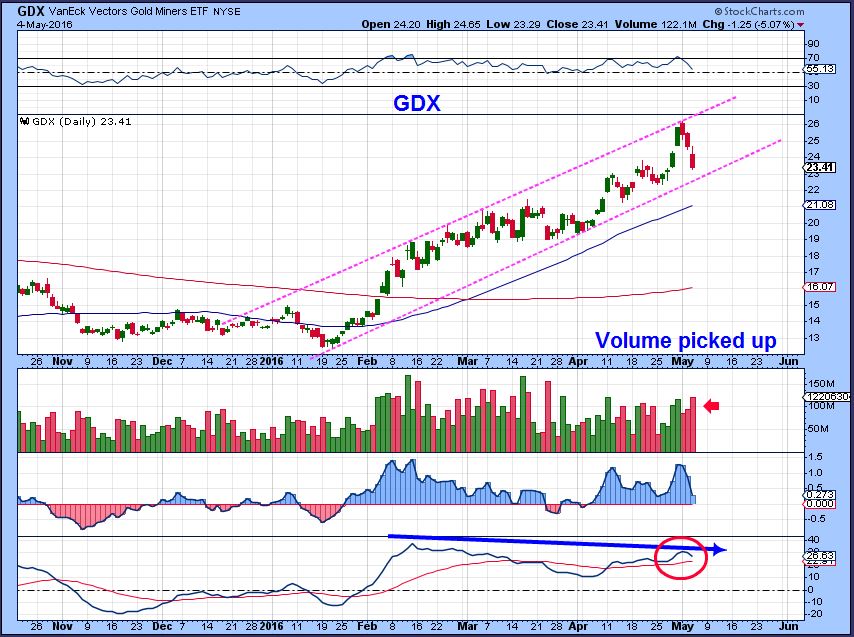
GOLD & GDX
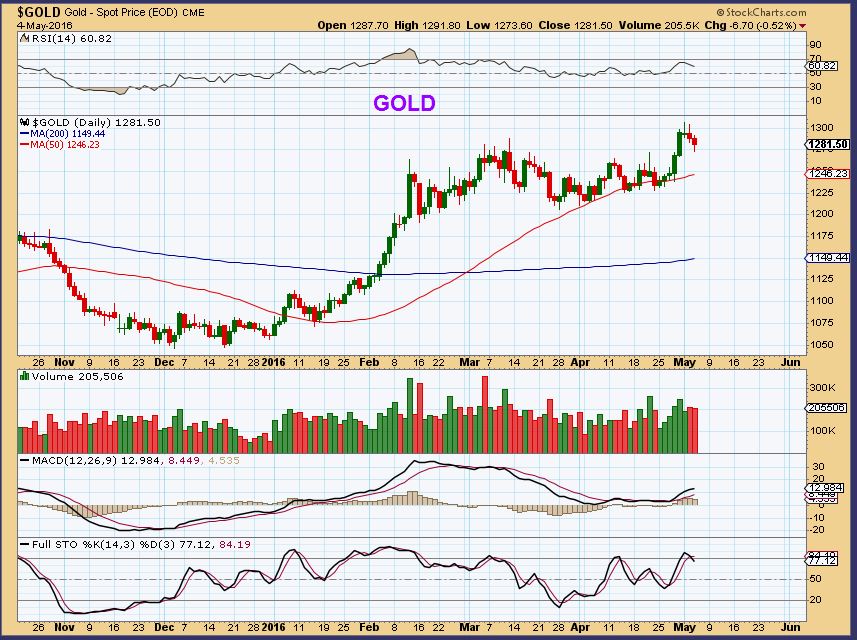
What can I say that I haven’t said already? : ) Looks bullish, but is due for a fall, especially if the dollar rallies.
.
Lets look at some charts
.
Light on the horizon, I know that many here own this one.
.
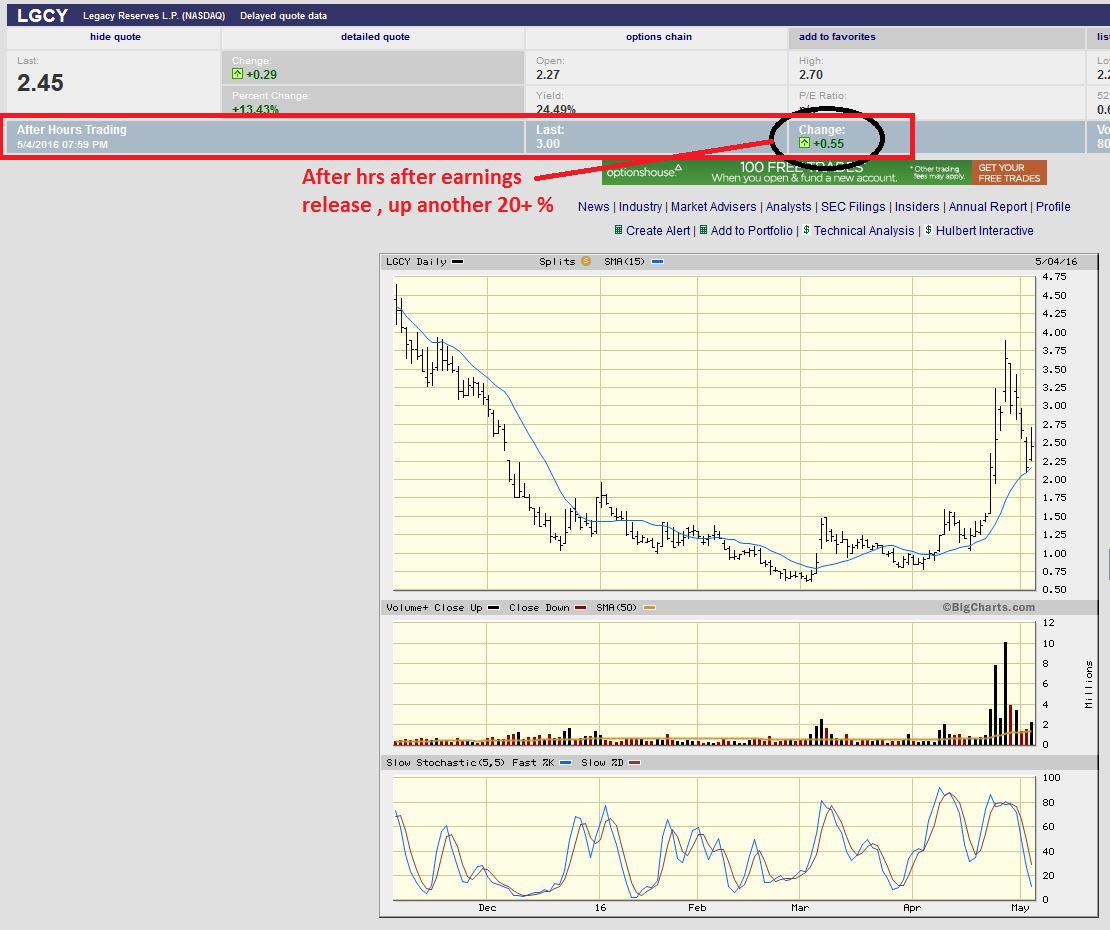
LGCY released earnings after hrs and had a very positive reaction ( so far) . It was up 55 cents, almost 23% or close to 40% for the day. Lets hope this sticks in the Thursday trading. 🙂
.
.
As mentioned in prior reports, the selling continues in commodities and can be normal consolidation, but it is difficult to endure if you own them.
.
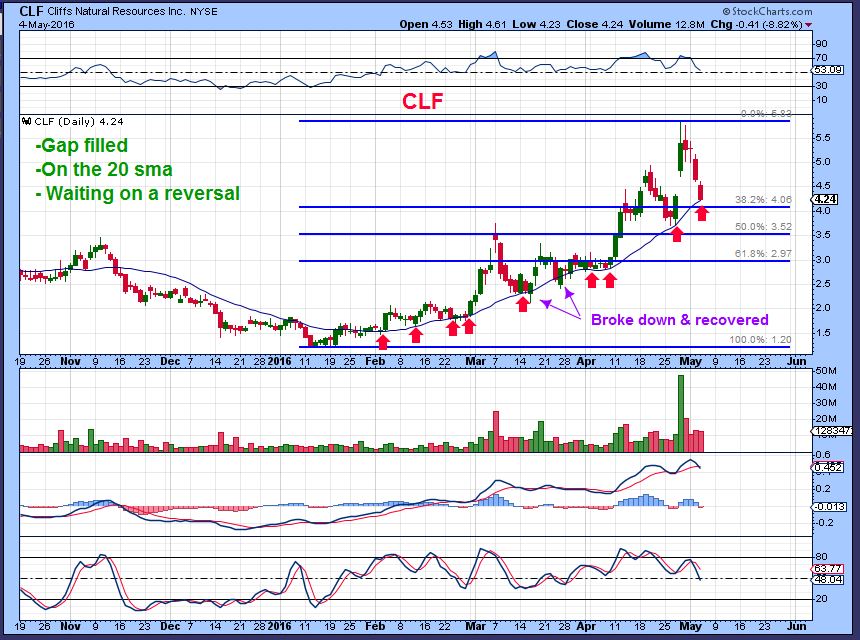
CLF from Wednesdays report– Possible gap fill and drop to the 22 sma?
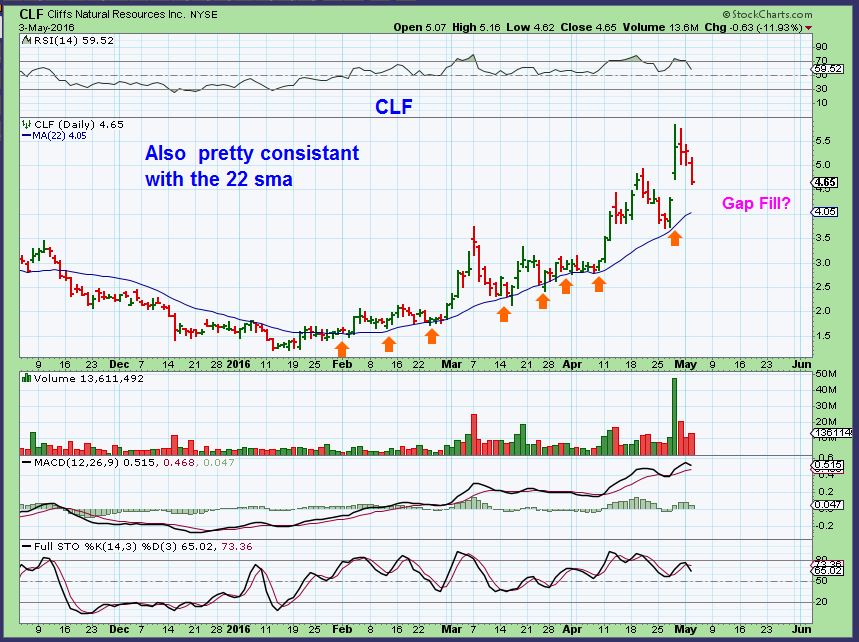
CLF today – The gap did fill and it hit the 22 sma. This is where I would look for a reversal.
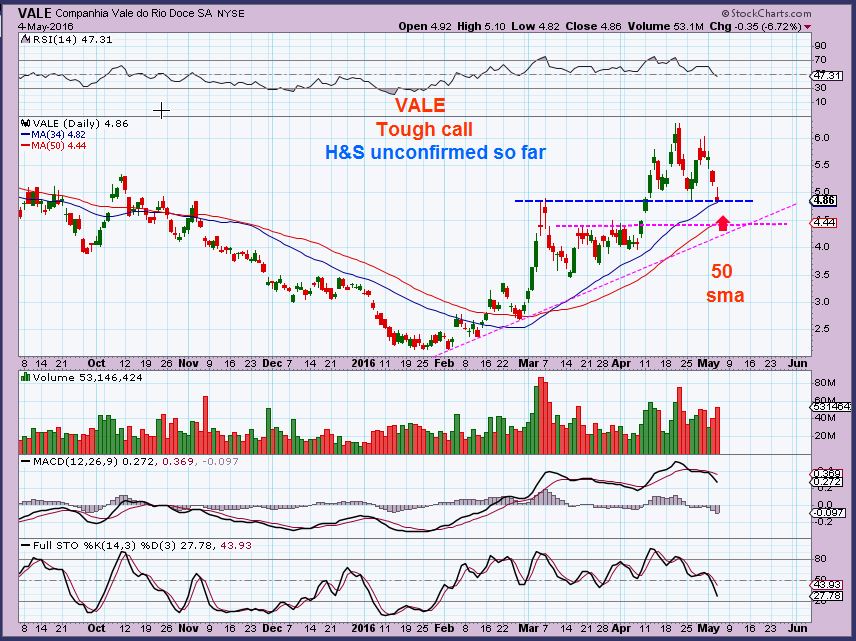
VALE – Vale had some bad news repeated about a lawsuit, but it only dropped 6+%. It is entering a support area , but there is more support at the Gap down at $4.50. The stochastics is not oversold, so wait for a reversal if you are thinking of buying.
So there is a ray of hope. LGCY had good earnings and was up a lot in after-hrs, lets see if that sticks. The markets are due for a relief rally, maybe that can drag some of the commodities higher? Oil is holding up and NATGAS does look bullish, just in time for the report released on Thursdays. Lets see how these things play out today. If LGCY continues higher from here , it could be VERY bullish, and I will cover that in a brief report… yes, on Friday.
.
~ALEX
Side note:
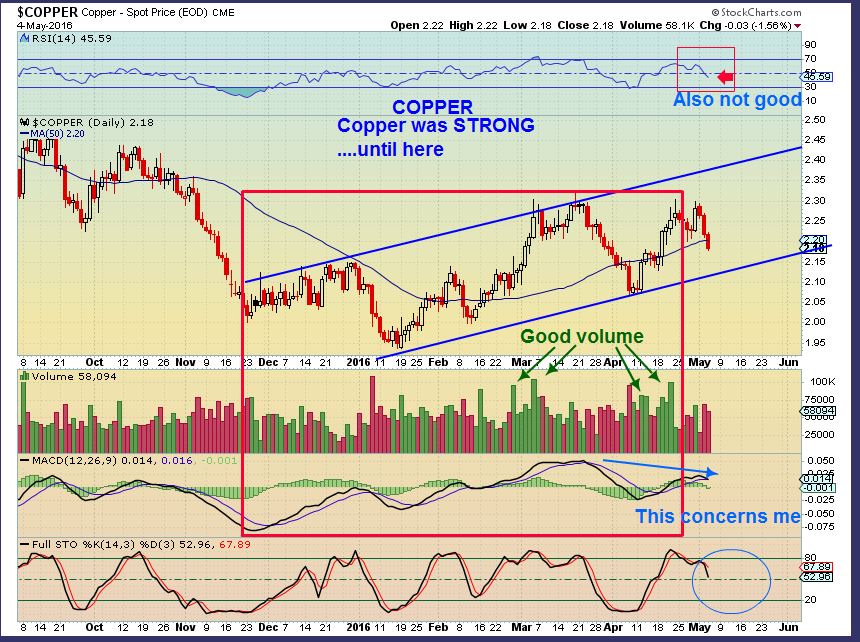
I want to mention that OIL was Strong, COPPER was strong, and Commodities were strong. Could that change with a $USD rally? Oil is showing odd signs of weakness early in the 2nd daily cycle. The CRB could be topping short term.
And this is Copper.
Copper was very Bullish looking, and I wrote about that and pushed FCX, HBM, NCQ, TGB, etc. Now I want to just say that COPPER looks to be slowly changing. It could be absolutely fine inside of this channel, with higher highs and higher lows, but it needs watching . That MACD could not make new highs when copper did and the relative strength is dipping down below 50% very early in the 2nd daily cycle. For now, everything is fine. I want that lower trend line to hold though.
.


Alex, looking at FEYE (earnings out AH today). Just wondering if you’ve noticed that after a tight base breakdown slowly, IF it turns suddenly does that create a powerful trend the other way or is the base effect broken by then?? Hope that made some sense?!?
I may or may not have followed that. Here is what I think you might be asking.
If the recent break down is turned higher and breaks upside after earnings, will that start a bullish trend higher.
The break down has been kind of light volume and may be just following the markets selling off. It is almost oversold (but they can trend down in oversold conditions too). If after earnings it breaks higher and breaks above that consolidation, they do usually run strongly, and later the recent dip looks like it was just a shake out.
IF I didn’t own it here, I wouldn’t buy it until I see that reversal.
Thx! You interpreted my gibberish perfectly!
Oil and gold up pretty good in Pre-M,,hope it runs all day, best to all.
Hey Miller,
Looks like a real good start in many areas based on pre-market prices.
Oil was up $2, and that was with the USD up too – we needed that.
And yes….Best to all!
Just want to say what a great job you do of keeping the big picture current and in focus. That has been one of my trading flaws in the past and I’m learning to keep that in mind. I appreciate it.
Thx Miller,
When I first started trading and didn’t do that, I got shook out a lot. Looking at how stocks can move up & down over time definitely helps me to be more patient too.
ALEX…. eine gute morgen. Thank-you for this short and powerful report.
I like this manner who you explain it.
See you later, and God bless.
Hi Geurt –
ik hoop dat het goed gaat met je
or
Ich hoffe, es geht dir gut
I thought you were Dutch speaking, but you wrote in German?
I hope your day goes well, and I hope that you possibly have a few Energy plays too.
They look like they will do well today.
Yes…. that’s right, my mother language is Dutch.
But…. I speak more then one language Alex.
B.T.W. I didn’t know you speak Dutch so well?
To be Honest, I wish I did, but I dont. It would come in very handy when I go to the Dutch Islands in the Caribbean (Aruba) : ) I had to look it up
Modern technology makes it happen.
… such a Renaissance Man ………………………..
YOU again ! Shouldnt you be working or something? 🙂
Ha!!! Now THIS is funny. New best part of my day.
hahalol
(only just seen this)
#photoshopskillsmusttryharder
Guten Morgen Geurt, ist es Herr Geurt oder Frau Geurt!
Was denken Sie?
I’m still and are eine Herrn (Sir in English)
Ich weiß nicht , müssen Sie nicht einen Avatar haben
BTE and oil
I Bought BTE and BCEI yesterday, sadly, I didnt add to my LGCY
( BCEI earnings after the bell today )
I think everyone knows that I love the BTE weekly chart
2 charts here. BCEI earnings after the bell
BCIE only good trade I’ve made in weeks, hope they don’t implode tonight.
I bought LGCY 2 days ago. I wanted to add Yesterday, but how could you with earnings after the close? Gambling
I know. I didnt add to LGCY for that reason too, but I did own it a lot lower.and sold some higher.
I added to my BCEI yesterday, and then remembered Earnings was tonight, but I’m going to hold it. I own some early shares of that lower, so a big drop would not break the cost basis
I didnt know you had a chart here, until I refreshed. That’s a petty tight correlation Thx
CF….how do you think the Canadian fire will effect oil stocks?
Sorry, I have no idea if it will or not.
( I usually ignore news events, because it is rare that many cause long term changes )
Poorly. Here is how it works with gold – a news article breaks that causes panic buying pushes everything up overnight or early AM but news pops ALWAYS come off. Sometimes same day, but usually within 2-3 for sure.
Alex, Is the bottom in? Should we be buying this reversal
Sorry Bill,
I went away to buy the dip in LGCY. also I dont know what you are looking at, I’m looking at 8 different sectors.
Sorry, again I thought you had the crystal ball. I’m seeing the Energy sector heating up. Not sure if this is a one day event or a bounce out of a half cycle low. I’m thinking this is the real thing after the recent sell offs. Just asking for your input!
AAHHH, Oil / Energy bottoming.
I can’t tell so early in the day if OIL is done going down, but I am thinking that OIL was dropping into a 1/2 cycle low. If so, Oil should run higher through in May most likely. The Good energy stocks may have pulled back enough. Some with earnings released BTE, LGCY, etc are acting strongly.
So some of these Energy stocks have very big buying today , volume -wise. It looks promising, I added yesterday in small quantities in a few, and today too.
Mornings like today you want to jump all in thinking its running away. Then 10:30 comes and things pull back. Energy sector, I want another run higher please.
Over the years I have seen these POPs, Gaps open and noticed that often ( Not always, but more often than not) looking at 10 day hrly charts – many of these POPS at the open do drift down all day. Some return to running higher the next day, some dips into the mid day, rise into the close.
So there is hope 🙂
Good. B/c otherwise I’m jumping off the top of Moe’s building as well. I’ll get directions from Maria.
even rexx looks like its trying to get ready to rumble….
Funny Girl
lol .. seriously.. i just got an alert it was nearing the TL .. lol
You set alarms for that? In TV?
yes dear…. right click on TL … select “set alert”
Such a Renaissance girl!
… that’s right .. teaching/training just another one of my mannnny hidden talents… ;o)
I can see you now, with your face in a book, just like Halley Berry!
*wink
And it’s over…
LGCY had pulled back on LESS THAN 2 million in volume, and went higher on 8 & 10 million.
It now has 2 million in the first 1/2 hr.
Looks like it’s time to bail on CJES?
Very oversold, could bounce. Earnings not until 5-10
You stole my comment!. Mine was, does anyone want a hideous energy recommendation to destroy any possible wealth they have? If so…
CJES!!! Sell sell sell
“a reader here” lol !
Quid Pro Quo Alex…………….
… your famous 😉
butttttttt.. he didnt get his name check like me & thee have had.
personally, i’d sue..
only kidding A 🙂
I have a few good lawyers as readers too : )
we don’t litigate in England .
just plot some hideous revenge
btw.. why does hollywood always cast Brits as psychos?
.. is there a historical reason for this?
Kings and Queens and guillotines? lol
and then there are the Benny Hill / Monty Python types 🙂
Trust me, psychoses ( or violent social disorder) is a global phenomenon now
Um, Bond, Jame Bond!
Haven’t you seen the commercial. You do drive a Jag-uar, right (just imagine I said it in a funny accent)
I shall not steal from the experienced traders here – LOL
Credit where credit is due
2 LGCY chart – Gaps tend to fill on this one. I added this a.m., but will likely add again if we get gaps filled.
The TOP of the gap fill is around $2.70. The lower end where price closed yesterday ( near $2.50 ish).
The idea is longer term, unless something changes in the meantime
,
click charts to enlarge
.
2 stocks that I’ve pointed out here that has been a real trooper in Energy is LPI & CPE
Sidenote : WTI looks interesting today. Oversold and inside of a base on base with good volume
Where is Moe? Last I read, he was ready to jump from EXTR (eme) heights, unless LGCY pulled through.
.. i actually *think I saw him up there when i was driving by……………….
Careful Moe , I think I detect a stalker in the Extreme neighborhood doing a ‘drive – by’
Glad Maria saw this. B/c other than a Maria,.gif today SUCKS!!!!
Good thing LGCY popped as I couldn’t find how to get to the roof. The top of the 1st floor is much higher than I thought and the soft lawn is further out than I can jump. Whew
I thought I saw a familiar face drive by today. You can kind of see the building from the highway too.
Ok, I found my way up to the roof ~ no, that’s not Arnold up there it’s me after pumping up before the jump.
LOL
The charts for MRO and OAS look good. Both found support at the 35sma. MRO made earnings and beat estimate. OAS has earnings on the 9th
Thanks for sharing this info, Bill.
Alex, what’s your take on stocks like AA & CENX??? Lot of damage has been done this week, and the uptrend line is hanging on by the skin of its teeth. Only support I can see is in the 50 sma a few cents below. If that gives way…. Sitting on AA, CENX, RIG, MRO, HBM, CLF, VALE, and to be honest, this weeks beatdown doesn’t offer a lot of hope. Trying not to freak out and sell everything. Give me some perspective. Would you still.hold these if the 50 sma gives way?
CENX actually looks pretty good , If were looking at it as a buyer, the volume is very light today, so sellers drying up? Above the 50sma and oversold. RIG looks good, CLF, VALE are lightening up on selling and look ok, but pull backs are difficult to ride when you are heavily positioned, I agree.
I’ll return with a chart to add perspective
VALE — Pretty oversold now. See the chart. So pull up a 2 yr chart of VALE and you see that it fell from 15 to close to $2, but it wasnt straight down, many consolidations.
Right now many are still above the 50 sma, and may test them.
Yes, I’d lighten up if they start threatening those areas with strong volume.
If you bought any positions a lot lower and want to lock in profit and lighten the pain on down days ( or develop a hedge using other methods ) , that works too.
The problem with lightening up is that would have to have been last week. Given back K’s in profit this week. I was up big on energy and VALE, CLF and thought I could get through the wiggles and keep longer term. The problem is what if it doesn’t turn back up or I stop at the low, b/c I’ve done both.
The thing that ticks me off is not so much the lightening up, but my failure to follow signals that point to trouble. You can have 100 charts all display the same signal that i would interpret as bearish, say a negative divergence at o/bought levels, and/or a level of strong horizontal resistance. Since no system is perfect, there will be some in those 100 charts that keep moving higher. But I’d say that the majority will correct down to another support level. If I had been totally out of these stocks, and got back at say the 20 sma, and failed, and kept going lower to the 50 sma below, then at least you capitalized on your gains near the top, and repositioned lower, although you are now at a loss. That is easier to handle. But to see the signals flashing in front of you and still sit expecting higher prices is stupid IMO. If what I am trying to do is grow my portfolio, it is irresponsible of me to see that and still not act. And one of the things that blinded me was a higher price target on these stocks. Price targets may or may not make it. But ALL of these charts had red flags all over them, and still I held. I am so ticked at myself that I can’t even eat dinner, it is that bad. I have lost a lot more money than what I’m down on these, that’s not the biggest thing. But not having done the right thing although I saw it in front of me, man that’s got me beyond angry.
Hello ALEX – wondering if you have followed PKD (Parker Drilling). I have traded in/out of this stock for many years, what are your views of the charts – any insights appreciated!!
I have traded it too, not lately.
The chart looks good because it recovered the sell off below a support of $2.50 on a 2 yr chart.
It just completed a measured target from an inverse H&S , so now it could drop to the 50sma and consolidate, or drop and reverse higher again. I would want to see it stay above $2.50
Going to lunch, Good day All!
CLF broke below the 22 sma, and that was holding it well. It might drop to the 34 or 50sma? Ugh.
34 sma has acted as support, and it should be oversold by the time it gets there.
10 day 15 minute chart shows what looks to be a bullish wedge on CLF.
NOW I can go to lunch 🙂
Checked my account. It fell off a CLF.
Alex, FCX is really confusing me. It’s never had so many red candles in a row. Wondering here if the commodities trade is taking a long pause or is the chart broken? Thanks
Copper. Check out the chart of copper. Dollar reversed back up, China data came in light, and copper took a hammer to the face. Blew through 50/200 both like a hot knife. Only saving grace is stoch will be oversold in 2 more days. Not a great chart, sorry on mobile, this is all I got, can’t mark it all up.
Mentally preparing for a good correction in the gold stocks. when it looked like another runaway advance was hitting it seems like all we received was a double top. Looking at all the prior runaway advances in gold.
When the HUI declines by 15% I will believe the correction has started looking for a drop below 199. Most all runaway advances in the past were complete in 4 months…we are 3 1/2 months. Once the top was confirmed the average decline was 58% retracement or 34% from the high in the gold “stocks”. looking for that in the Hui, Gdx and gdxj ….155-160 for HUI …we’ll see. I’m out CF until you help point us to a good sell off low to start the process again. Thanks for the great site.
If BTE closes below the 25sma, I will most likely sell.
Oh, I posted a chart with my previous comment.
Just got back to computer to look after being away since open. Boo!!! Boo!!! I’m throwing rotten tomatoes at my screen. BAS, CLF, FCX giving me that fresh, I just barfed up some in my mouth feeling.
Cason, misery loves company. I thought I was the only one in FCX here. Tell me something positive about the chart…please:)
Buddy, the pain is mutual!! And I was lucky enough to avoid LABU!! But this week has been an absolute horror show. I wished I could be more positive, but there is no way. If these stocks break their weekly trendlines, and close the week out near the lows, it’s time to let go and take losses. Timing is everything if you’re a speculator, and I think most of us here are. If you had the entry right, then you are just giving back gains, but if you came in after the move started, or worse, near the top, you are feeling a pretty good drawdown right now. Not good at all.
yep… basically over that past 2 weeks i’ve been up and back down to where i started.
i can get in at the starts but, im having real trouble getting out near tops..
working on it though… backtesting some systems.
what doesnt kill me off makes me wiser
… also been constantly offloading over the past week, so the pain is nowhere as bad as it mighta been
https://youtu.be/Xn676-fLq7I?t=7
thanks M..
bet she’s never owned BAS though, so her sentiment remains untested in action:)
hmmm… maybe this then??
*one of my theme songs.. lol
https://youtu.be/FVovq9TGBw0?t=12
crazy fecker!..
is it your drink-a-wine-box night…. or is that friday?
I’ve tried just about everything SOG, and I can tell you 1000% there is not one single system that works perfectly. All we can ask is for a high probability system. If you can be right 70% of the time or more, you’re gonna make good returns on your $$. My system might be different from yours, or Alex, or anyone else, but it works most of the time. I’m a big fan of the KISS principle. Cycles are too much for me to follow, thats why I follow Alex. And Elliot Wave is the opposite spectrum of keeping it simple! Horizontal support/resistance, price above/below a major ma (50, 200), divergences, weekly trendlines, these are some of the simplest and they work very well for me. As always though, I am my own worst enemy, and don’t trust in myself nearly enough as I should. I end up making decisions that fall in line with someone elses system, and that puts me in a bad position from the start. But hey, it is what it is. And I hope you dont interpret this as a knock on Alex, i think he’s great at what he does. Again, no system is 100% correct. It’s a knock on me. I have to be better, it is that simple.
im similar.. come up with some great predictive charts, and then proceed to not follow, cuz i dont trust them enough
Tell you whats the worst, I held miners and ERX heavily from december into january. That drop sucked, but I was confident we were seeing a double bottom in miners, and ERX had some positive things in the chart as well, so I held. We came back strong, and I sold most of miners for great gains, and like everyone else in the world, am waiting for a pullback. Now I get into CLF, VALE, AKS, CENX, etc, near the top of the move, when momentum divergences were telling me not to, but lo and behold, I did it anyway. Now we’ll have to be long term holders of these instead of miners. It’s like the smart money said, “here, I’ll trade you my AKS for your KGC”, and stupid me is like “yyeeiiii!!”. Oh well, I can always sell and start again. All I can tell you is that these stocks need to bounce hard tomorrow, and after today, I don’t know if they’ll be able to do it. We’ll see….
i working on the theory that we’re in the A of a correction.
maybe some already getting a B wave bounce (eg LGCY) ?
i dunno fo sho, of course , but its just safety first
B should be enough to lighten up by half. If I hadn’t been a greedy pig and sold half last week, I’d be solid right now. Make a chart that will make it happen. Please.
I guess that’s the good point. I’ve given my gains, most it, but still up on most positions. Most. The ones I was late on? Yeah, not so much.
I just got home from work and I completely understand because I face the same thing. 3 horrid days. I f you look at longer time frame charts, in most cases, over time it will be ok….but as Peter says below…speculating was my plan…not holding. Damn.
My plan was holding. My plan SUCKS. I’m not doing that again.
check this shizzzzda out … playin with patterns again, (using a 3day chart) this is the 1999 oil low… EXACT replica mind you.. just a copy and paste.. LOOOOOOK at all those candle matches… UNREAL … damn …………………..
https://www.tradingview.com/x/IaFSVkuc/
w… o … w .. the daily is even freakier… holy wow.
* i think i need to go for a run now.. or a cold shower ..
https://www.tradingview.com/x/gH885A8F/
awesome charts Maria – keep em coming!
I mentioned MRO earlier. I think we are getting close to a reverse in the energy sector.
https://www.tradingview.com/chart/MRO/zxRCqdk3-MRO-Marathon-Oil/
From your computer monitor, to Gods ears buddy!! I’m hoping so, but I’m definately not as optimistic as Alex and you. Energy is oversold in the shorter timerames, but daily and weekly are FAR FROM oversold. Weekly trendlie is hanging by the slightest of margins. Same goes for AA, CENX, AKS, and others. I could be wrong, and I hope to God I am because I own MRO and the others I mentioned, but this doesn’t smell of consolidation. This has the marks of a reversal.
What makes me nervous about charts like this is RSI divergence. It’s just one indicator and I am no TA expert so take this observation with a grain of salt.
RSI and % R on different time frames are oversold. The 50sma looms close by as support. The 61.8% Fib rretracement all point to a reversal point. I plan on buying at $11.62 with a stop below. Little risk for me, quite different if you have been holding since $15. My 2 cents for what its worth.
MRO also has a sma50 of $11.58, CLF is scaring me, maybe ill split half my position into MRO. Hopefully Alex can shine some light for us!
clf in a bit of trouble
the second run up is the one Gann always bought…..not even here yet…..that’s wave 3 in EW….much to look forward to…..believe me it will be every bit as fun as the first one…Thanks CF….a bucket load of profits awaits us!
I watch the same data and follow that person as well Shermo
Just…have…to…get…there…(before account dies!)
I love GANNs work, studied it in the past but seriously….if one thinks they truly know Ganns work, they should admit that they only know 10%- 50 % of it, if they have studied it immensely .
He was a Master, and many of his ideas were never really published, so the legend goes.
BCEI, up $0.17 AH (~5%) – beats by $.18 on earnings, misses on revenue.
Nevermind. It’s gone now.
Hate to say that all of these familiar names CLF, FCX, LGCY, HBM etc will probably depend on the dollar tomorrow. Bad jobs likely sends the dollar lower and we get relief. Good jobs data and …..we get more pain. Worst three days for me in a long time.
For me too, Markm – maybe next week will be better! 🙂
I have all but one of them….plus MANY others flaming red. I do look at 4 year charts for some perspective.
Updated chart of CJES!!
*REFRESH*
Man that made me laugh!!! I needed that… laughing makes everything better!
I just saw it again…i’m cracking up!!!! Watch it be up 20% tomorrow…
Drinking. Drinking also makes it better.
I missed this yesterday but came back to see it after Friday’s report. Funny! I have several blood red holdings I would like to throw in that dumpster!