
May 1 Weekend Report
Week after week we are seeing very good action and even fairly clear predictability in the various sectors. We have experienced some great gains in Miners, Energy, and Commodities for all of 2016. I have to keep reminding myself, and so I want to remind the readers here too, that pull backs and corrections are expected and keep a market healthy. Lets review our markets and discuss that idea further.
.
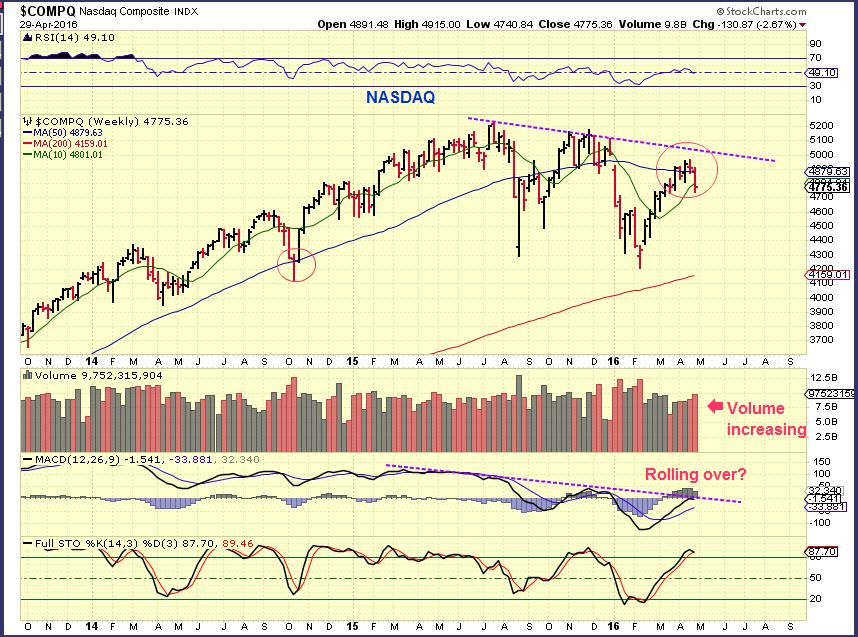
I’ll start with the NASDAQ WKLY – The NASDAQ hasn’t been as robust in its recovery as the SPX. It almost looks to be rolling over, so lets keep an eye on it.
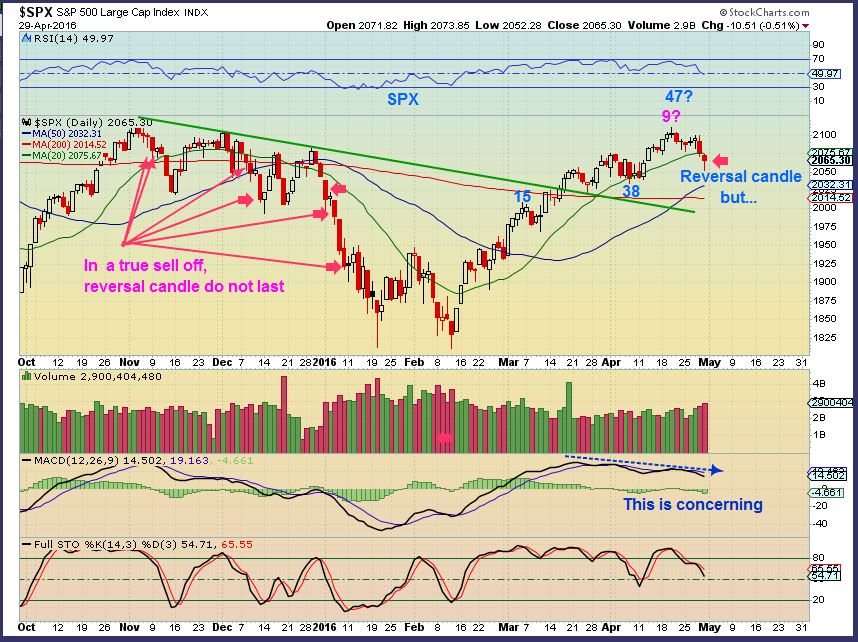
The SPX Daily began rolling over, but I see bullish signs too. Remember that corrections and pull backs can be healthy. Is this a healthy pull back?
.
This chart points out strengths and weakness. A reversal candle is bullish, but last fall many of them failed ( red arrows) so we can be cautious here until we break down or break higher. The cycle count is late, so a DCL is due. Did it happen on day 38 and this is day 16 breaking down? or is this the 1st daily cycles low Friday? We need a bit more time, however…
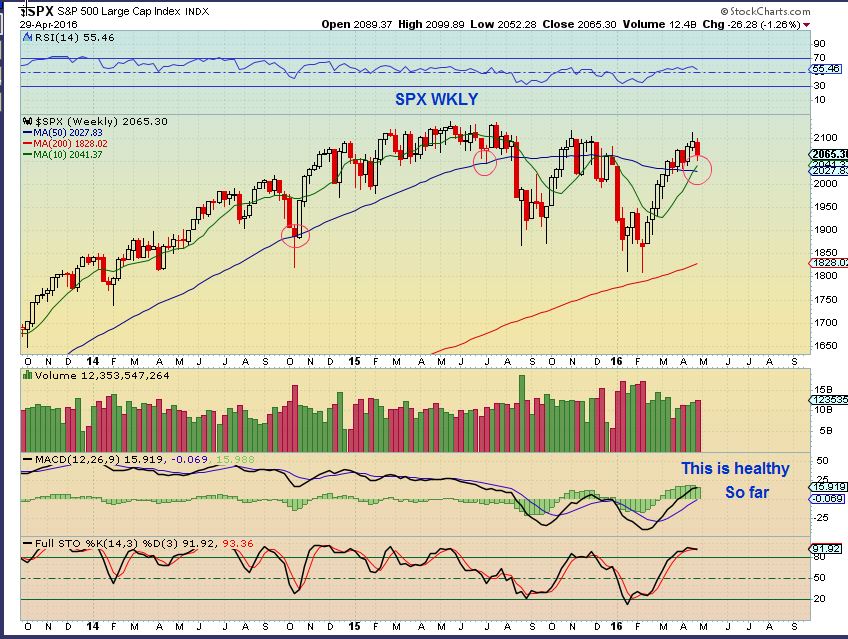
SPX WKLY – This chart remains bullish . When I called for a rally in February, some went long (bought UPRO or TQQQ, etc) and have asked how to play this going forward.
We are now is a decision point.
-Will the market roll over and break down ?
-Or break out and the Bull returns?
I would lock in my profits and wait for clear signs. This is semi neutral to me, it could go either way. I also might just sell some of my position and keep a stop right under SPX 2000 with the rest.
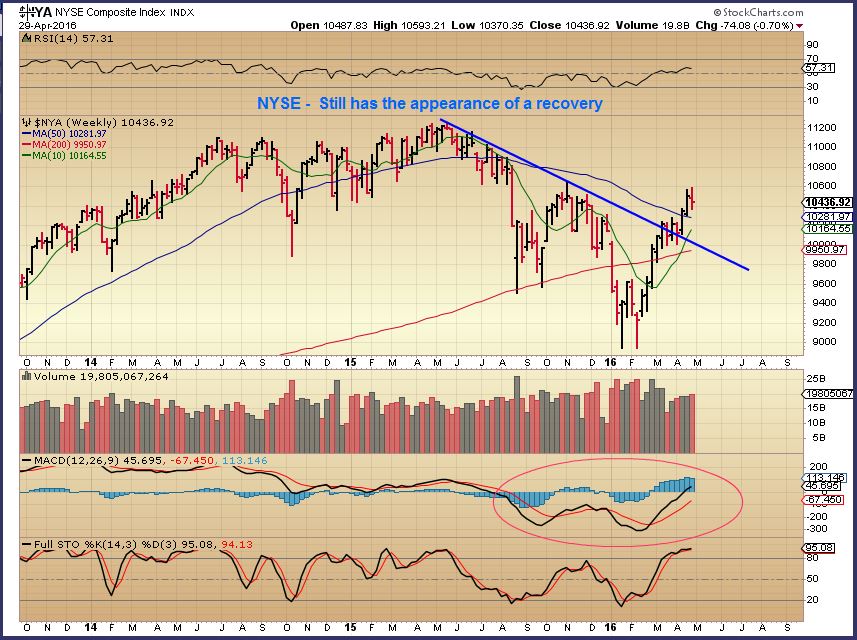
Again- I am basically neutral now. Why? Because the SPX is near last Mays highs, the NASDAQ is lagging. The NYSE WKLY looks quite Bullish (see below). And Banks?
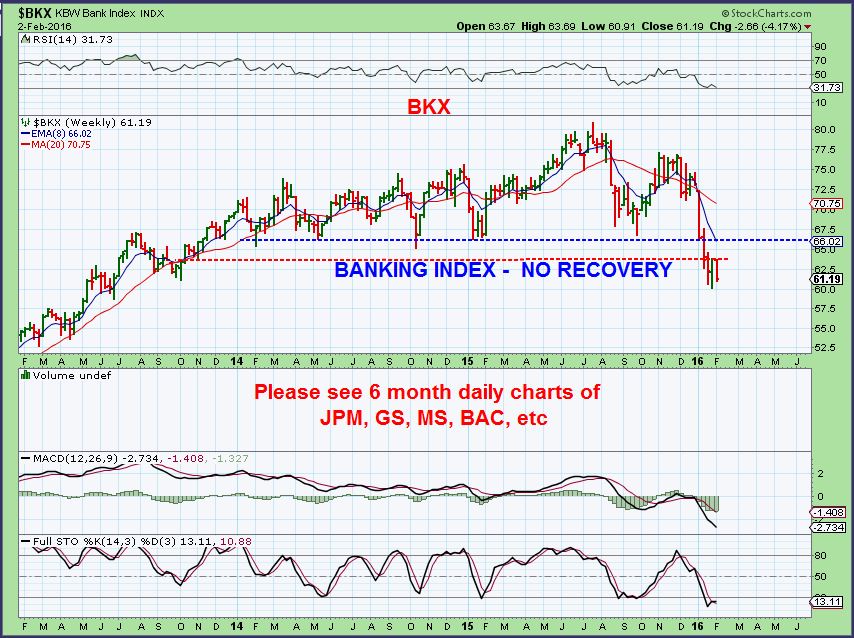
I mentioned that banks breaking down were a concern to me in February and I posted this chart. Bank stocks looked very ugly. A weak economy could hinder the bull run, but then…
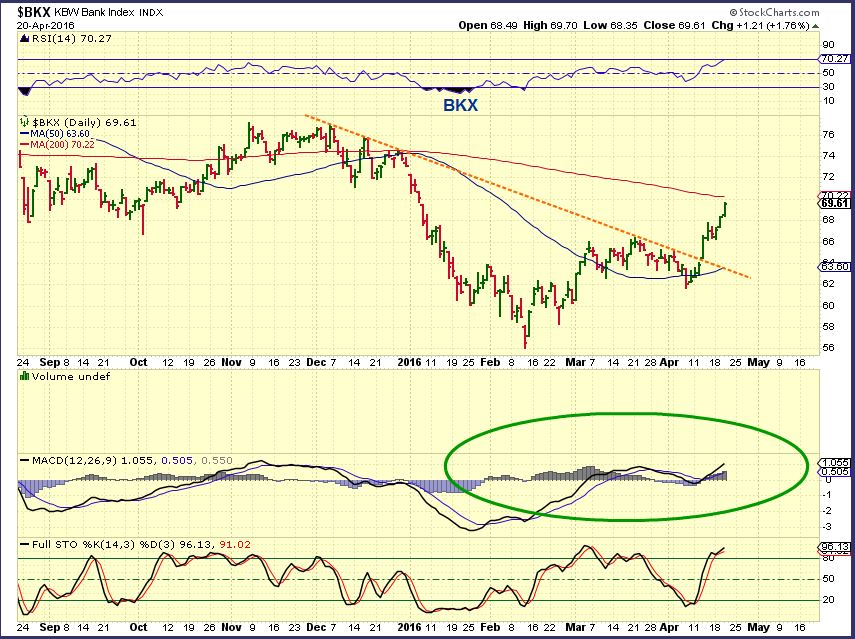
BKX – In Mid March -April I said that Banks were now recovering. Many bank stocks improved. I used this chart over a week ago. How are Banks doing now?
BKX Currently is also neutral. It recovered the red support / resistance line at 65 , but has turned down at the blue line over head. So far, this could be a larger pattern of lower highs and lower lows. Will 65 hold?
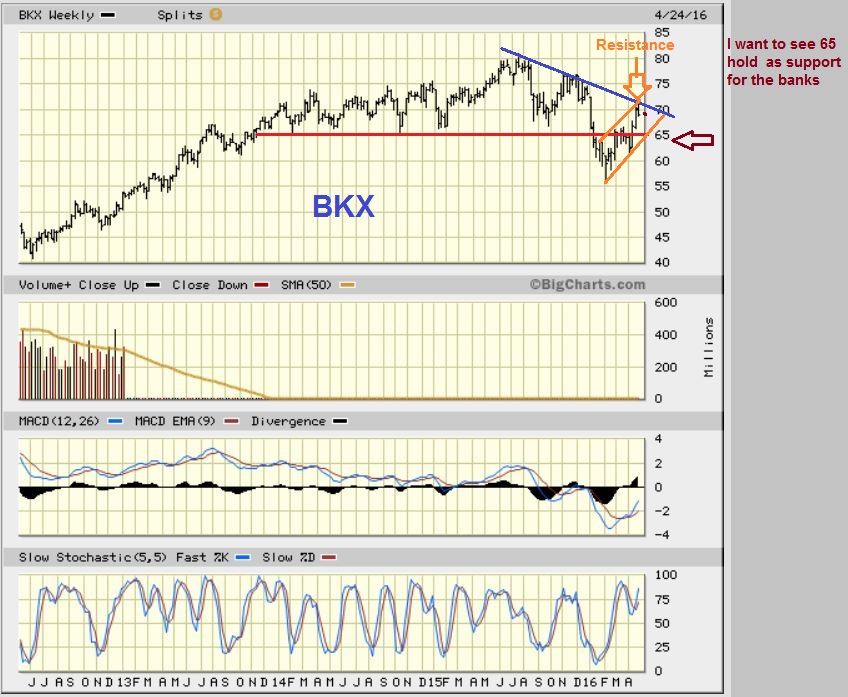
SO I AM NEUTRAL ON THE GENERAL MARKETS, BUT THE WEEKLY CHARTS REMAIN BULLISHLY RECOVERING.
.
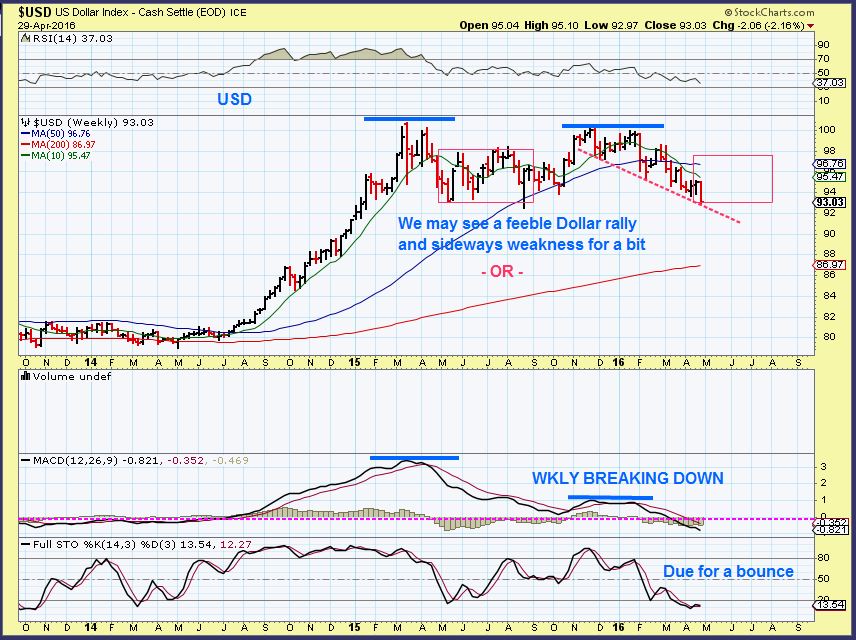
USD APRIL 1 – I mentioned that the DOLLAR was due for a rally, so maybe GOLD would finally pull back.
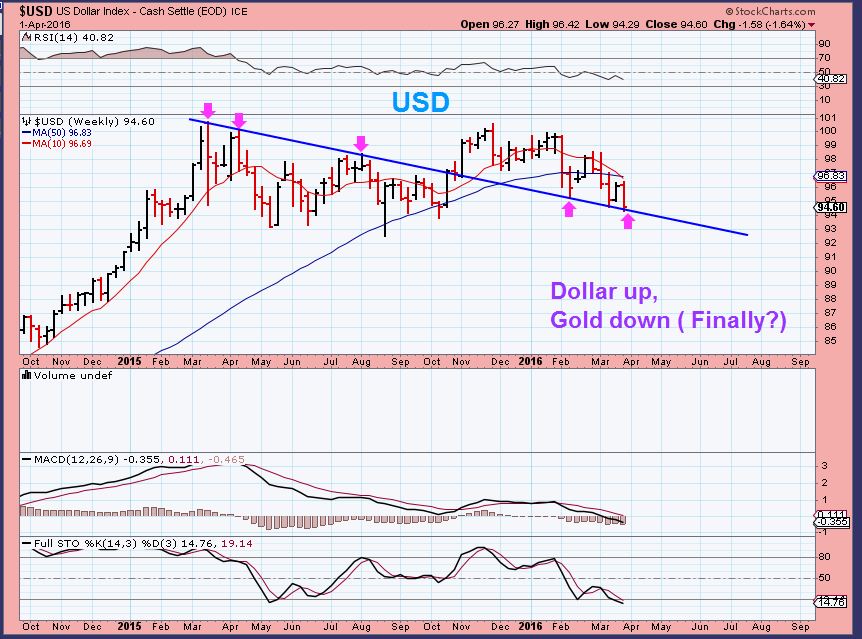
USD WKLY NOW– That was a WEAK Bounce in April ( sideways) and it ended with the dollar down on that trend line again! SO we are due for an ICL ( A low that produces a bit more of a rally) in the USD, and that could cause a pull back in Gold. I drew a red box similar to the other sideways move this summer, because I do not expect a strong rally. Next is what I really think of the USD…
.
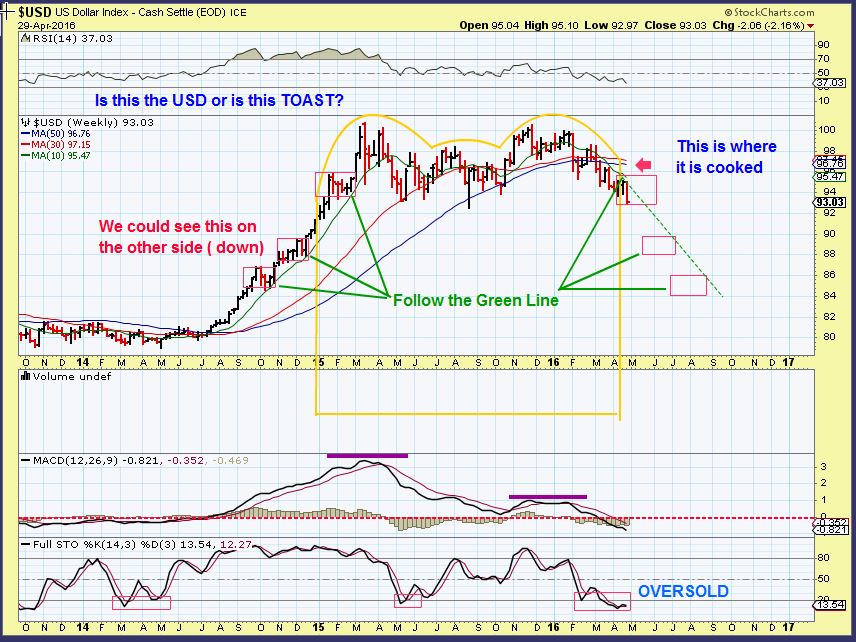
Important:
USD – I called for a double top LONG AGO, way back in the Spring of 2015. I think that the Dollar is most likely ‘Toast’. If this drops the same way that it rallied higher in 2014, it would look like this in 2016. Why did I say this was ‘Important’? STARE AT THAT 2014- 2015 RISE for a moment.
CRB – Now look at Commodities in 2014-2015. When the US Dollar rallied strongly, The CRB fell fast. So if The USD drops, The CRB should Rally 🙂 Read the chart for the shorter term thinking. CRB 190?
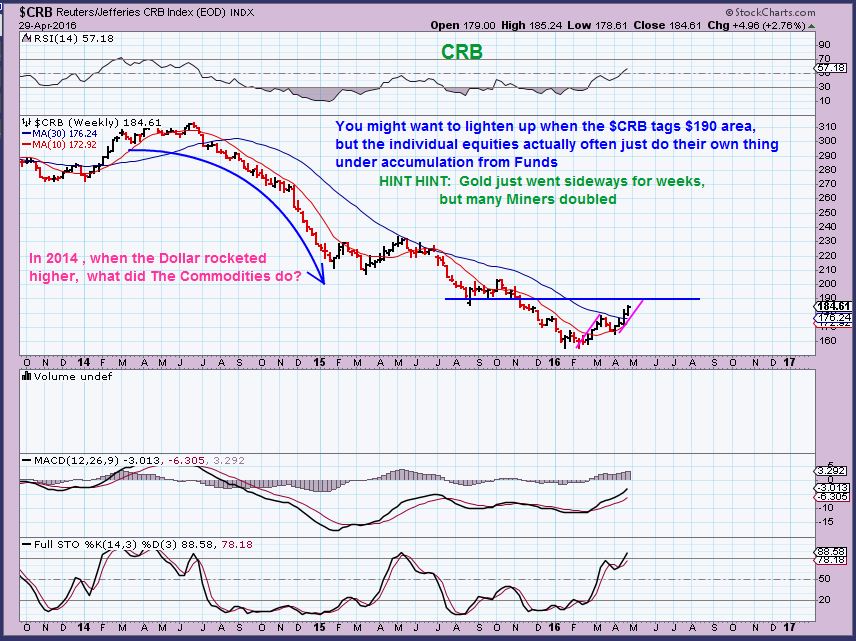
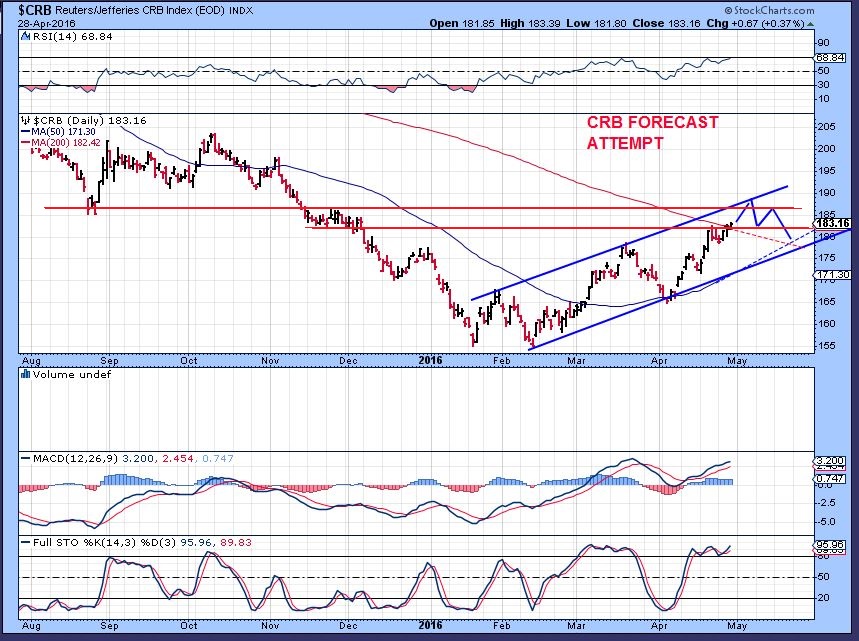
I drew the CRB as inside of a channel last week and posted this chart in the report. You can see that 190 is at the top of the channel too, and I’m thinking that my red line should be higher as shown in the ABOVE chart at 190.
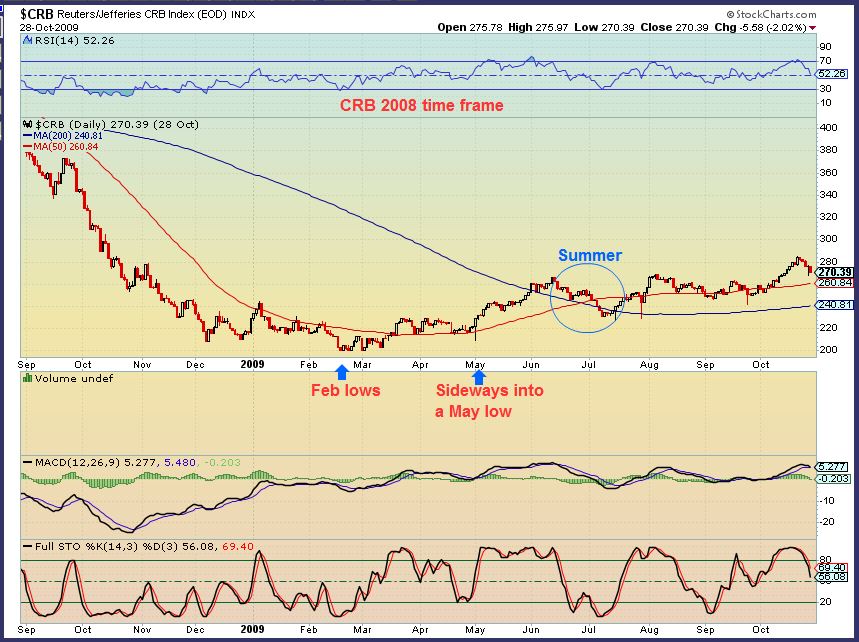
I’m going to re-post this chart that I posted 2 weeks ago – it is the CRB coming out of the 2008-2009 lows. I’m showing that the move out of Feb 2009 lows didnt peak until June, but there were pullbacks along the way. Price simply went higher / sideways / higher. We may be seeing the same now coming out of 2016 lows.
Our Commodity Stocks ( X, FCX, AA, VALE, CRB, CENX, TCK, HBM, AKS , ETC) are acting very well. Long term I think they will eventually move a lot higher. They do not go straight up, but pull backs can be healthy and this has been a nice sector for us to be invested in.
.
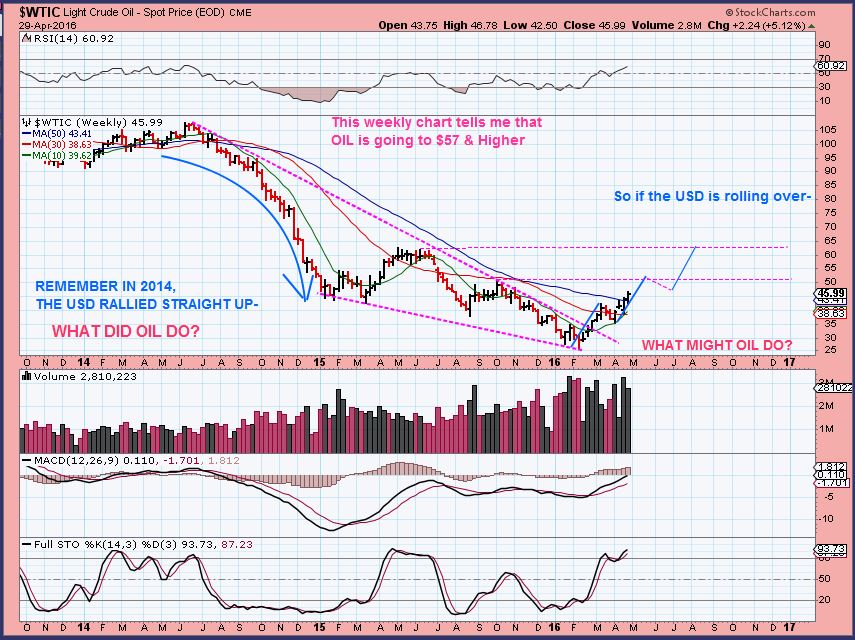
WTIC – OIL
Again – The Left side of the chart, Look what OIL did in 2014-2015 when the Dollar rocketed higher. It dropped quickly, so if the dollar is working its way back down, I’m anticipating a recovery .
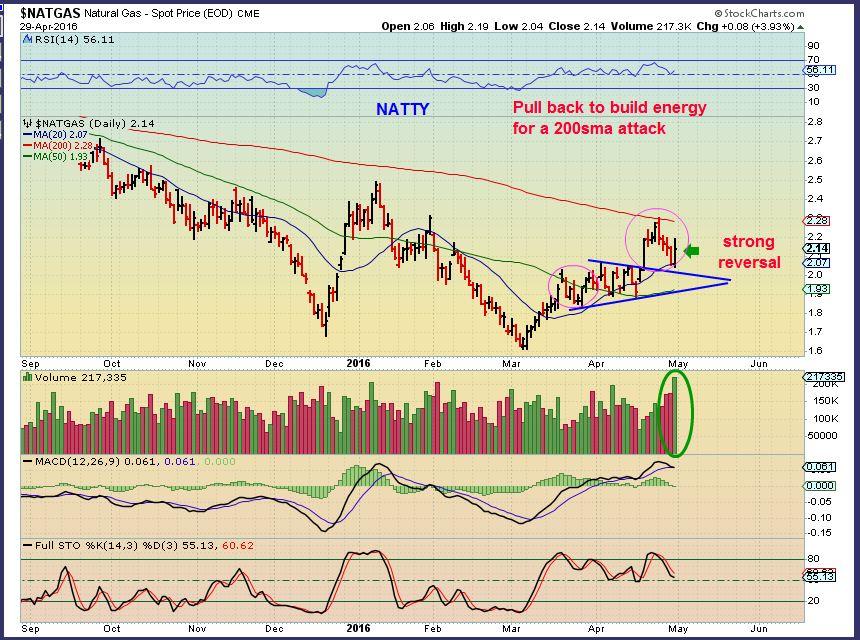
NATGAS – I mentioned that NATGAS would probably pause at the 200sma and drop to build steam for a push through it. We saw a nice reversal Friday. It looks ready to go.
PRECIOUS METALS
.
So much to say when dealing with crazy strong recoveries 🙂
.
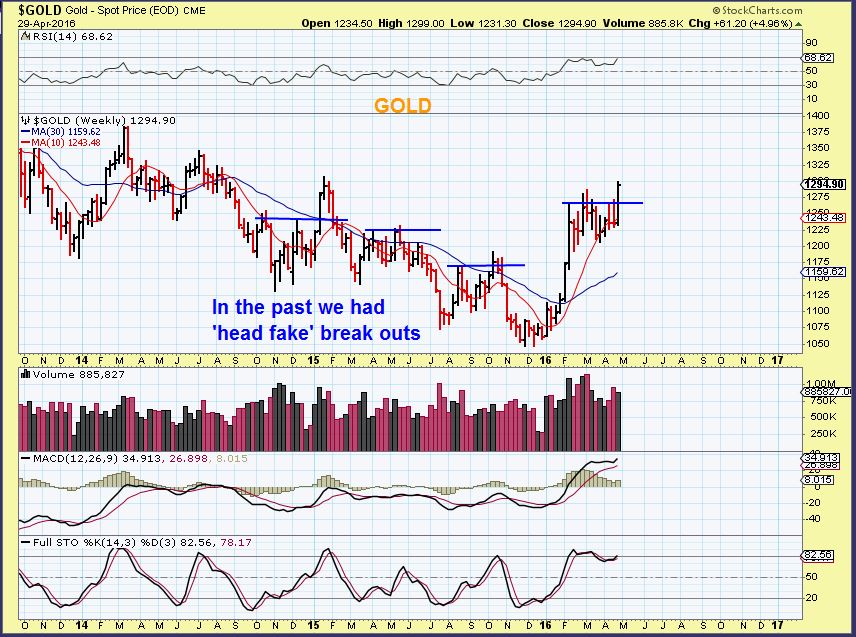
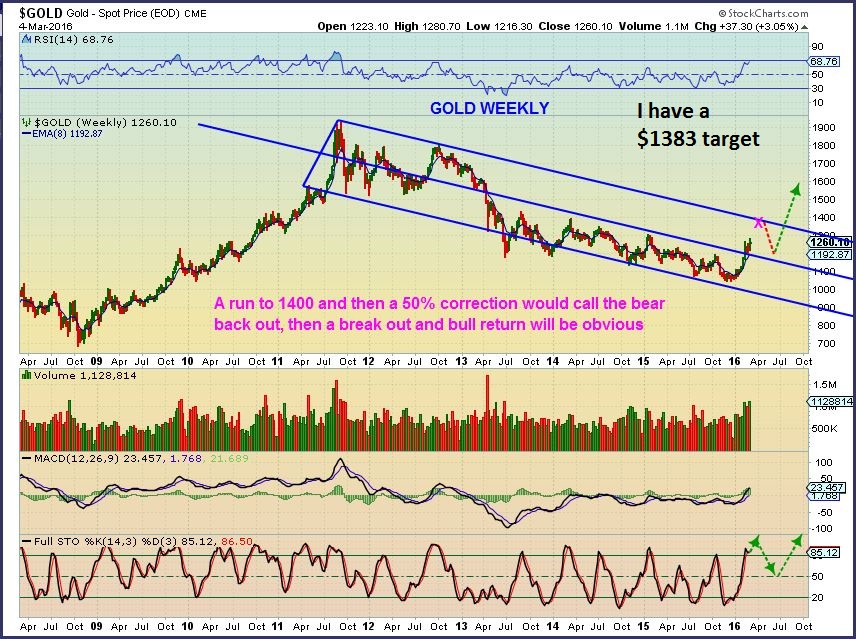
GOLD – As of Friday, Gold very convincingly broke out from the sideways consolidation. This could have a price target of over $1400, but we have seen that POP & DROP head fake in the past (see the chart) . In a few ways, this looks a little different this time , however. It looks Bullish. So let me show you something that I have been looking at…
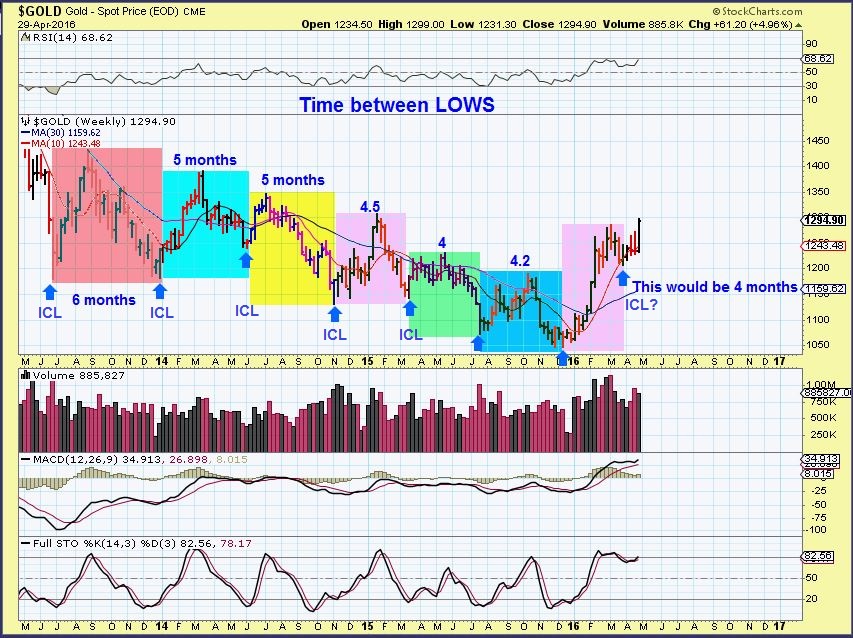
GOLD TIME TABLE – I have mentioned this is prior reports months ago, but for newer readers, I will repeat.
Using cycles from LOWS to LOWS, I noticed that ICL to ICL ( The deep lows before a rally ) used to run about every 6 months. Lately they are shorter. The ICLs fall about every 4-5 months, with the last 3 under 4.5 months. April 3 would have been 4 months. May is now 5 months from the Dec 3 lows. WAS THAT A STEALTH ICL at the dip in the sideways consolidation? (see chart) It came at 4 months? Or …
.
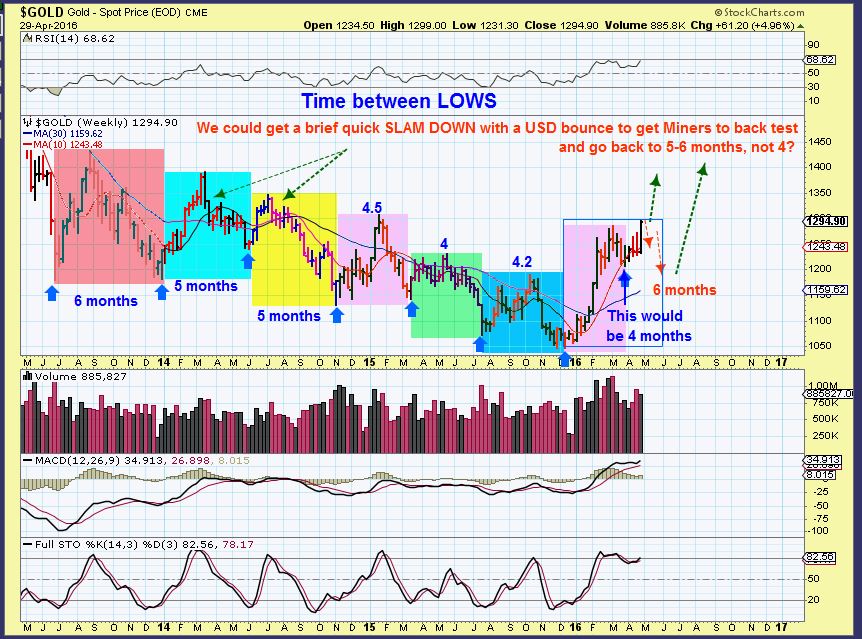
GOLD – I have been expecting a drop into an ICL, so this is what the same chart would look like if we got a quick sell off into an ICL this month, month 5. Maybe Gold breaks below $1200 and then higher to $1400+.
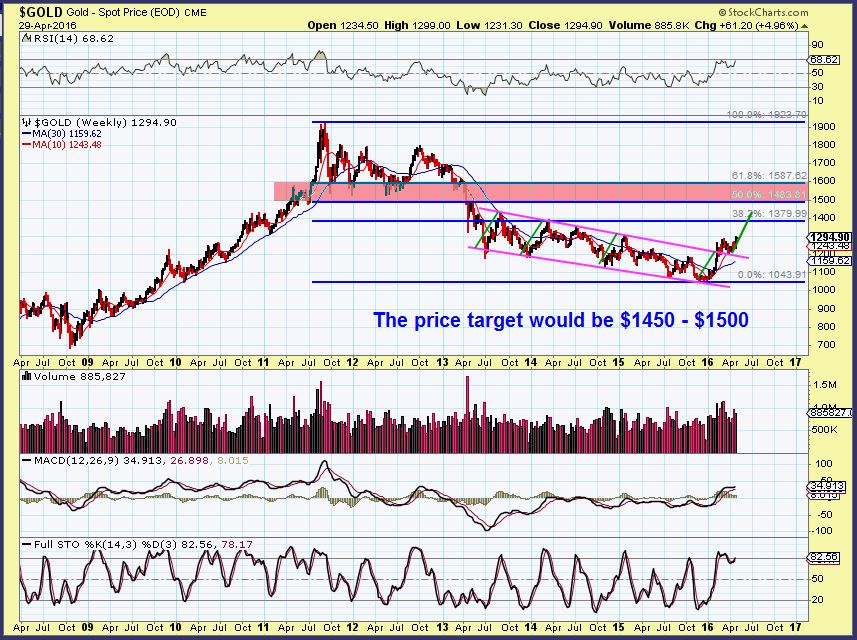
I also have shown a chart similar to this showing a break out and back test of a downward sloping channel. This run would lead Gold to $1450 -$1500 also. It is bullish and possible.
.
Review of where we were and are now:
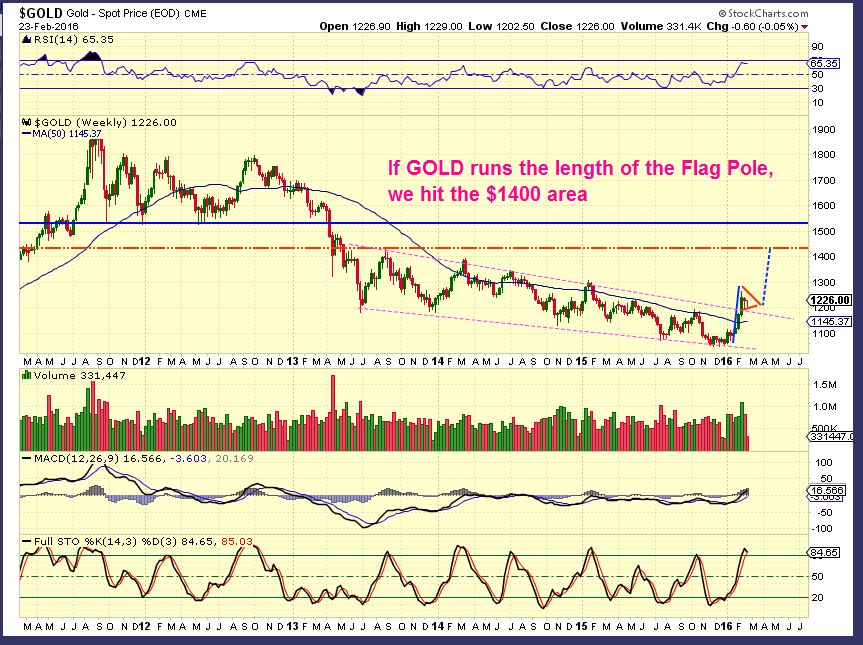
In Gold way back on Feb 23rd, I said that using Technical Analysis, we have a $1400+ target in Gold several times, but might flag or pull back first, due to CYcle expectations (ICL) . I used these 2 charts below on Feb 23rd and again on March 4th. Using cycles, however, you should wait for a good dip to get a safer, lower risk entry. As seen in the charts of Gold above, GOLD is now breaking out from a multi-week long consolidation with a small dip in it at 4 months. Tricky.
.
Another Pullback in Gold (and Miners) should still come, but will GOLD break out now, head fake , and drop to a deeper ICL before another strong run higher? Or will we just break out and run above $1400 and then pull back later? It is almost impossible to know for sure. The set up is Bullish either way. Lets look at Miners, I’ll show possible pull backs.
.
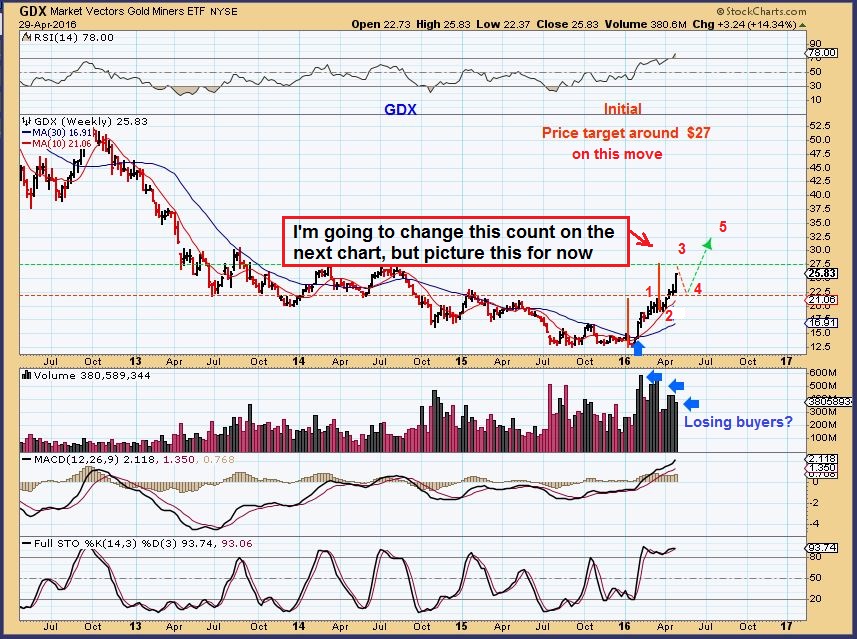
GDX WEEKLY – This has been a strong move, almost straight up on a weekly chart with a small sideways consolidation. An initial price target of the $20 area found the sideways consolidation and now a move to $27 is likely. (read the chart) I hope we pull back there so we can buy at lower prices and do not just have another sideways consolidation. 
.
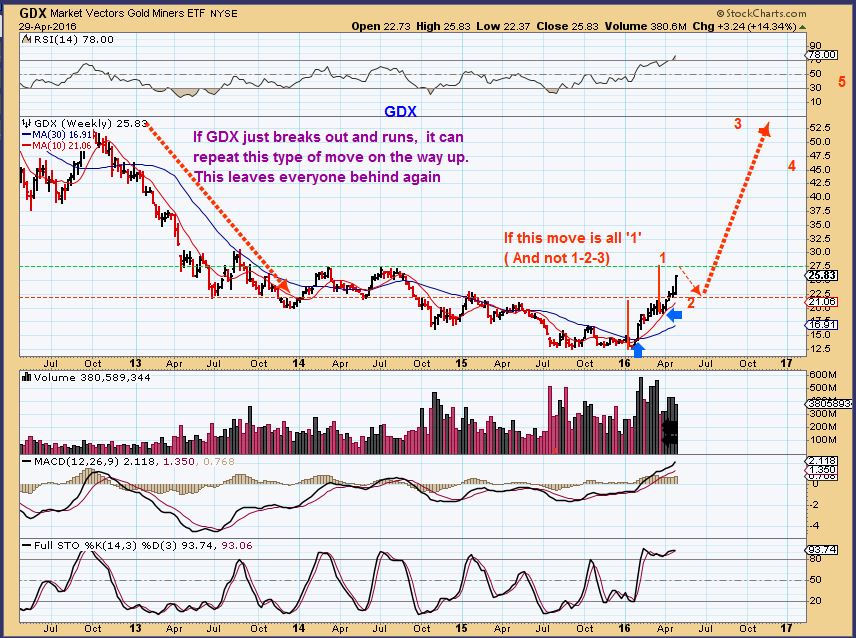
GDX WEEKLY – I changed the count and this would put a crazy big move in place. I only did this because on the left side of the chart, price dropped from $50 to $22 in 8 months. Read the chart.
Big Review
So here at chartfreak, we bought Miners in Mid January and rode them for weeks. Expecting a pullback, we sold 1/2 , kept some as ‘core’, sold more as they went higher. I then noticed that Gold was going sideways as OIL & the CRB bottomed, so we traded Energy & Commodities and did very well there. The SPX had also made double bottom lows, and I mentioned a rally there was expected, but I really needed to stay focused on mainly Energy & Commodities.
Miners keep ‘setting up’ properly too , so I pointed that out in different charts and mentioned that experienced traders or those in front of a screen may still want to ‘trade’ these set ups until Gold dropped. Gold still hasn’t really dropped, so we’ve traded some Miners. We were also still waiting for ENERGY STOCKS and Commodity stocks that had good rallies like CLF, VALE, AA, CENX, HBM, etc to pull back & set up again. We have now re-entered those areas and I think they continue to look good. Some Miners still look good too, like the trades that I mentioned in BAA, TGD, etc. I am actually seeing a few more that look like good trade set ups, but only for traders . Many other miners do look quite extended.
.
So I’m remaining mostly focused on Energy and Commodities this week, since these sectors have been acting correctly and have allowed low risk entries. Look at charts of SM, SN, CNX , LPI, and many more energy stocks recommended here – they have tripled. The best part is that they had pullbacks along the way allowing re-entry. Our commodity stocks have done that too. Please consult last weeks reports to see some of the newer charts of the energy and commodity stocks recommended. I will cover more in the week day reports. As always , Thanks for being here and I hope all are having a great weekend!
.
~ALEX
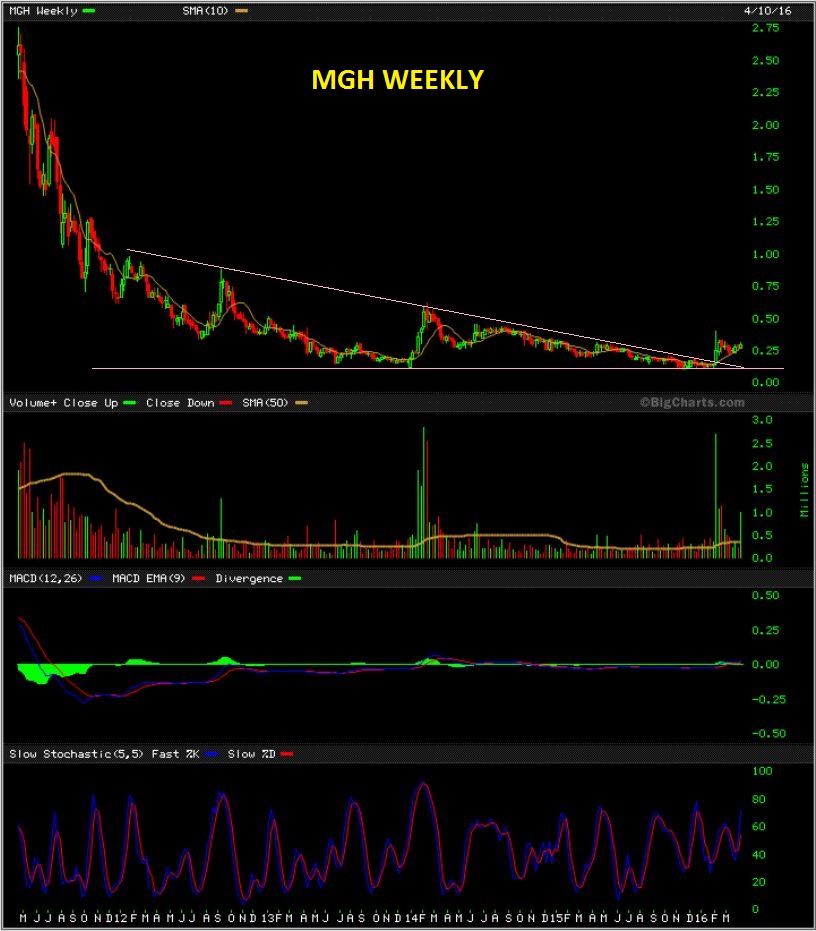
P.S. For traders, Interesting set ups in Miners right now are EGI, GFI, MGH, TRX, HMY, NSU (?). I got stopped out of NSU last week.
MGH – Posted April 18 as a nice set up. It has starting to move higher.
This was one of my BAA recommendations April 19th. It hit $0.38 Friday and the target is around $0.40, but it might actually continue to run if Gold is breaking out for real. If you took this as a trade, you may want to sell some near $0.40? 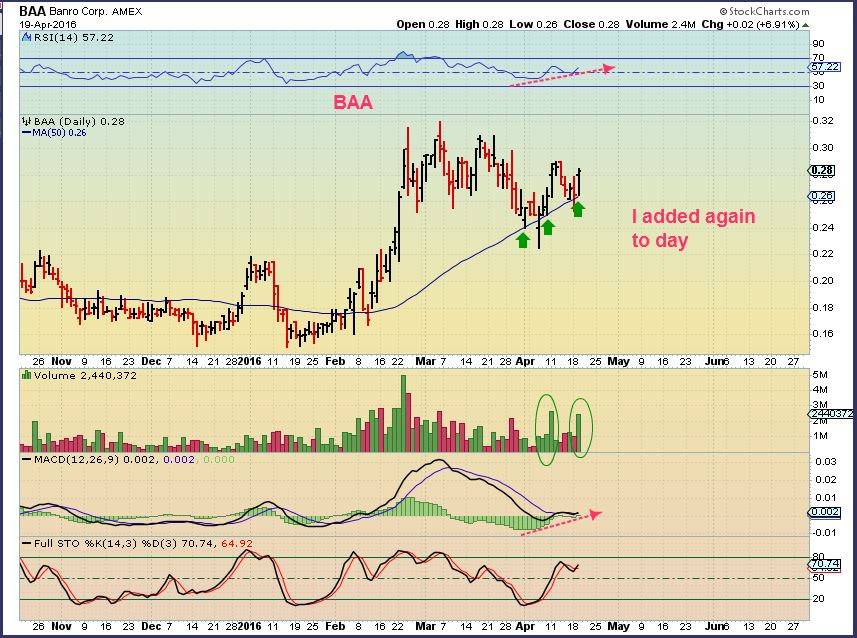
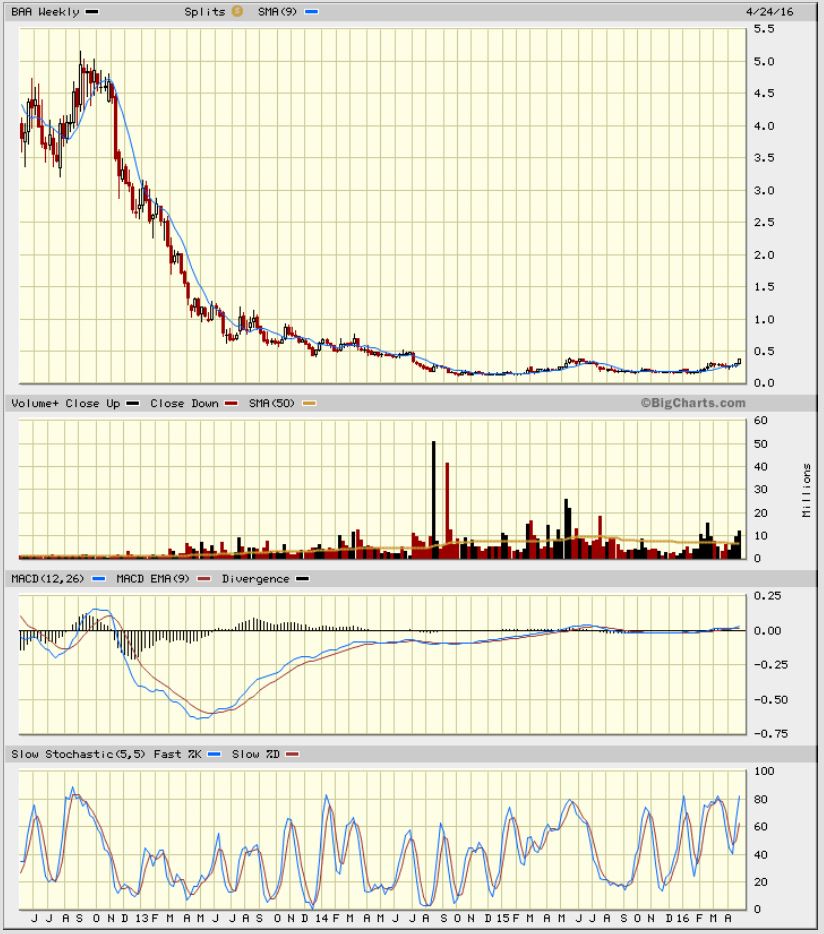
As a core position, which I own it since $0.15, BAA looks very promising in the longer term if you can ride the wiggles. That goes for the TGD trade too.
Energy stocks that have interesting charts CIE ( I recommended this 3 weeks in a row – lol. Sideways so far). MEMP, EVEP, BAS, SDRl, etc. I also like the charts of HBM, VALE, CLF, AA, CENX, etc as mentioned in other reports. Some have popped & pulled back. Many are waiting for LGCY to pull back or flag. THAT was a superstar in short time. 🙂 I will discus more in the weekly reports.


5 Star report! Thanks for getting to us CF traders on Sunday evening. Have a great one this week.
Thank You Shermo-
I’m playing GOLDS bullishness down a bit. That was a pretty real looking Push Friday, but Many miners look extended, so it could be one of those head fakes. Over all- this has been a real bullish run out of the lows .
As for an earlier report, Thank My wife- I’ll pass it on 🙂
Just a heads up on earnings. I have some conflicting dates from different sources. I will list earliest. May 2: SGY, EMES May 3 : ARP May 4 : CRK, WTI, RIG, HL May 7 : SID May 9: OAS, HK, SN, MUX
Alex, what is your view of EMES and ARP now?
Yes, it’s a busy time in Energy earnings. The good news is
1. Many have run up so much since last earnings, that a pull back wont do much damage
2. A lot of the badness has been baked into the cake.
As long as they have a cut the fat plan and debt reduction or something, they seem to do ok.
ARP is a huge base, looks promising.
EMES is sketchy. Over sold , so maybe near lows. Light volume selling, but earnings can sell this off quickly if they Miss.
Hi Alex – Excellent report as always. I should have listened to you and just sold half of miners. I ended up selling all of it. I really hope we get a pull back so e can jump back in
I know that you had mentioned that you will decide on CJES end of day Friday. I sold half my position in Friday. I am trying to decide if I should sell the rest on Monday or is there a chance it will blast higher ? Thanks Alex
Well GOLDSA, to be honest, I sold 1/2 of mine, and then continued to lightened up further as they climbed, so I do have a core position, and with new miners set ups – I have been trading them, but some that I sold on the way up (MUX, TAHO, SWC, CDE, AG, etc & of course NUGT) – I am out of.
I need a pullback too, but my other trades in Energy & Commodities have replaced the pain of missing the rest of that move. Trades of LGCY, CLF, HBM, BCEI, etc).
CJES is still in that base, but it was looking too ‘neutral’, like it could go either way. Thinking about that, so I sold it and added to HBM again, since HBM had earnings released and I have liked that trade from $3. I expect $6.
What I liked about CJES was that it went from Under $1 to $2.50 in a few days , then built a base. It could blast higher, but I got fidgety on that one.
Thank you Alex. Appreciate your perspective. I also ended up adding more HBM in Friday after I sold the half CJES. I also have positions in FCX and VALE. Thanks
Alex, In previous reports, you have a target of $2.40 for $NATGAS, is this still valid?? Thanks.
Hey Rob! How are ya?
yes, I have $2.42 if it can blast above the 200sma
Hey Alex! I’m okay. Just working like a dog and trading a bit. Made some money on an 2x oil ETF. Got out Friday morning. Happy with my return but am thinking of putting some $$$ in Natgas. Not sure just yet though
luv your top picture – great and fun
just like the weekend report a killer
Thanks Ray! 🙂
Guert, you still holding on there, buddy? IBB looks set to open higher. A continues lower move from here would be bad news and back into the lower consolidation zone.
Hello Alex – wanted to get your thoughts on URRE and DNN (uranium miners). With the reversal in commodities, wondering if these will be good stocks for long term hold. Thanks for your insights!!
Hell DJD,
I was trading some uranium stocks, and I liked DNN. I think that as long as it stays above th 50sma, it looks to be recovering and trending =higher now. URRE Iam not interested in personally yet, it just did a 1:12 split and seems to be trying to put in a base right now.
UEC & URG seem to be basing too, which means the entire sector may start moving higher in the future, and they could do as the Energy & Miners have. Right now I’m not in Uraniums, but they are shaping up.
Good report, nice charts on your thoughts about gold cycle timing. I’m waiting for the ICL to buy a few miners but seeing gold run up day after day has tested my patience. Having nice gains in energy certainly helps with the frustration part. : )
I hear ya CS, Miners have been very strong and steady, but they’ll pull back eventually.
I’ve been trading some Miners, but I love the somewhat sustained moves in CDE, AG, GPL, MUX, etc when you can just buy & hold and sit back and enjoy the ride. I missed the last part of those runs. Miners have done excellent.
I’m thinking that some of the commodity picks can do something similar, and some of the energy are too. They wont all take off as explosively right across the board, they are more individually driven by earnings X , ZEUS, and a few Steel stocks moved at a nice angle, while AKS didnt.
FCX looks ready to run straight up to $20, so some good set ups are still forming.
Alex, good report, thanks. I wanted to ask you about the General Markets connection to commodities and energy stocks. It appears to me that the general markets are starting to roll over. IF that happens will it drag down the commodity stocks that we are in? This may be a rocky week if so.
I just see consolidation in the general markets at this point.
My charts look good for the commodities, so I just use the charts. I trade by the charts. They usually tell me when things are weakening, but the drops in commodities have been healthy at this point.
The thing that worries me, is I’ve been in miners before and watched them sell off with GOLD going higher. All because the market corrected.
Right there with you, Bill. But from memory those are usually when we have really strong panic pullbacks in the market versus some back and forth consolidation style pullbacks. But yeah, lived through that beating before. Wondering if I didn’t already miss the chance to walk off with my energy profits. Hope this pig didn’t live his money on the table too long.
If anybody owns GDXJ, it’s going through a name change, and symbol change as well, I believe. So if you don’t see it reflected in your holdings, it should be adjusted by tomorrow. Just a little FYI… 🙂 Other than that, looks like consolidation time in our stocks!
Did we just get a BUY pullback on LGCY?
LGCY was down 16% Today, no back at -9%. Touched the 8ema and now looking better.
BOOM- Recommended near $6 last month, up about 70 % so far .
I did not take that trade due to average daily volume being lighter than I like. ( Then the volume picked up) :- )
I took it, Alex, and for me up 42%. Thank you very much.
Nice Edward!
I was really hoping someone did, that was a nice base that it formed. My original price target was $11 , and then maybe some consolidation like it did at $9.
. I used to trade JOY & BOOM together and did well with them years ago.
I thought that it had more volume though.
I thought I’d mention it not as a chest beating exercise but to encourage a farmer, like yourself, who likes to see the seeds he plants bear fruit. I remember you mentioning at the time of your history with both securities and I compliantly purchased both.
Yes, I am happy to hear that , And JOY is doing very well too : )
For JOY, that may have just broken above an inverse H&S pattern. I’d expect more upside after this consolidation. They already released earnings on March 3 ( So watch for the next possible around June 3 ?) , and they added a dividend in April, so seems to be doing OK at this point. Earnings were loer but in line with expectations .
http://www.marketwatch.com/story/joy-global-incdeclares-quarterly-dividend-of-001-per-share-2016-03-03?siteid=bigcharts&dist=bigcharts
Lucky me! SPRT up another 16% Today, I’m back in the green! Just got upgraded, not sure why?
We had several very supportive and positive news story in Massachusetts about a drug that they offer for treatment for Duchenne muscular dystrophy , a disease that is fatal in children. That was the drug that the FDA said had not been tested enough to get approval.
Oddly, of all of the children that took the drug in the test phase, not one side affect was found, and their lives were improved physically and extended by the treatment. The number of those tested was low ( 130 people ) and so the FDA felt more testing was needed and thinks that the study cannot prove effectiveness. The news stories were of outrage that local children suffering from this disease are denied the treatment, when the test children showed great improvement with no side affects.
SO – It is likely that this drug will be approved, the set back possibly was exaggerated in the stock price.
All of that being said….chart-wise, that may have been an abandoned baby when it capitulated
Here is one of the stories.
http://www.marketwatch.com/story/massachusetts-governor-sending-top-aide-to-support-duchenne-drug-approval-2016-04-24?siteid=bigcharts&dist=bigcharts
Thanks Alex!
BCEI may be backtesting the earlier breakout. I missed out on the initial move but will be adding here.
I agree ( Refresh) . I bought this in the base and I sold 1/2 and held the rest.
I cant tell if it wants to test the break out down at $3, or the 10 sma around the current price ( 13 sma is on the chart attached) .
Volume on this selling looks half of what it was during the break out . So far, so good.
I forgot to add the chart ( refresh)
/
Good candidate to add to tomorrow’s watchlist, eh? One other thing I am finally learning – not all in every time. Still have cash I can deploy. Or maybe it’s time to back out and let energy rest.
Good morning, Alex !
I bought CJES & EVEP Thursday after seeing your good information on them
Bad timing, of course
Would you hold or fold here?
I don’t mind taking a loss and I don’t mind holding thru a downdraft – just not sure which is the best course of action here
thanks!
Hi Cal,
So EVEP broke out and looked good, and I believe that in Thurrsdays report I recommended buying the back test if it did that. Today it could be back testing, so at this point I would have made it a buy , with a stop tight below, or it may just be a false break out and drop back into the base. I think it looks good though ( REFRESH)
Earnings is to be released on May 10 next week, so that should be kept in mind,
CJES is still just going sideways and did not break out as expected. In Thursdays report, it looked ready to go. It looks ok, but it didn’t have the follow through for a break out. The volume today is light and that is good, but again, it may just go sideways? So its kind of neutral, less bullish than Thursday.
I own it too, and may just let it go back to cash and look for something else. If it breaks out, it should run well from that base, but it also may be dead money for a bit.
Thanks for sharing your thoughts on these, Alex
Although it appears to be sitting on fair support here, I don’t think the sellers have dried up yet, hope I’m wrong but closed at almost the low of the day,on pretty strong selling volume, and if oil sells off again tomorrow, we could see $2.45 area and hope that holds, and if so, is more than just a bounce, Next support below that before bottom of range is 50 D MA , which hasn’t been much support in the recent past for this stock, so not a lot of hope there. BUT,, We could even get a bounce from here back to the $2.85 range also. who knows, I’m leaning towards more downside, but really depends on OIL ,either way, I’m in it with ya, underwater as well, and will be watching this one,
Cal, right there with you, brother. Oops!! The good news is I was scaling in. Only 1/2 in EVEP and pennies in CJES. EVEP is right on the 13SMA, 50 day is another .25 below. Loses that and I’ll just eat the loss. Might add if she looks good this week and maybe still exit before earnings.
Why I didn`t buy TRX friday. I bot MGH PPP GFI and NG friday morning any thoughts??? suggestions))???? thank you
They are green.
yes, they are green in my portfolio. I am watching EGI and GSS
Yes, I was watching those too, last week. GSS looks like a nice consolidation so far . I listed some at the end of todays report, but I feel like they are on borrowed time before a normal correction. .
So I have been trading Miners for their individual set ups , but didnt want to own too much, since things are extended in other areas . I mentioned TRX in the report, it started showing life last Thursday. I also mentioned MGH April 18th as a set up . I had bought NSU and got stopped out, now its imporoving again.
I sold my DRD for a small gain WAY too early, but still had BAA, TGD trades at the time,
GFI was breaking out and seems like it wants to go too, it has a $6ish target if it doesn’t get caught in a pullback of the sector. I dont own it yet, but I am watching it.
Its a tricky sector at this stage of the game, just stay frosty ( Alert) 🙂
thank you Alex, I missed February and March. yes the sector is tricky now.
Also LODE may have more upside, but earnings are this Thursday
For long term investors, as Rob mentioned @ 1.5 week ago, HBM warrants available, still good price, excellent leverage. Small purchases as kicker to an HBM position could prove lucrative.
Symbol: HBM/WS
CLNE acting well. Kinda just hugging the 50 sma from under. Don’t like the fact that it’s under the 50, but with the sea of red in energy today, this one has held steady. Earnings due May 5th.
Thats Thursday, good to know
For what it’s worth – Commodity stocks green , there may be more
GMO, NCQ, BOOM, TMST, X, ZEUS, PLUG, MTL, WRN….and as I write CLF & VALE just joined in.
Alex, how healthy is UNG appearing to you?
backtesting 50sma & d/t line… (and gap closing?)
USO also backtest of d/t breakout
Yes, Tagging the 50sma ans oversold. Hopefully that is it.
What an absolute CRAPFEST. Pull up $NATGAS, much stronger chart than UNG. The @$$ clowns that put together the UNG ETF are criminals, man.
interesting watching the action today – GUY has little overhead affecting it and seems to be moving easily in the right direction.
I didn’t comment on this earlier, I thought that maybe someone else who owns it or follows it should, but I did look at the chart. Very nice
Good Morning Alex : Today in WL are PLG ( Diamond Pattern) and JGW. What do you think about them. Thank you in advance. Regards from Germany
$ugaz down 14% good entry?
idk, did you jump in? I think we might have a good inventory report on gas this week. I didn’t like the action today. A cent below 20-day, MACD crossed lower, avg volume. But was bigger drop than I expected. Decent chance oil rout hurt sister has as well. I’m waiting.
HK cup & handle forming?
(4 hour chart)
refresh!
possibly.
$1.15 is good area for entry (or re-entry for me)
good call…low of the day
lookn pretty hott
Thanks
sillyman….;)
good to see you & billybob back with the double act.
We went to counseling… Giggle 😉
Sorry, were you talking to me or Bill?
😉
I had it labeled inverse H&S , but that formation fullfilled the target height without breaking out : (
.
( refresh)
.
It is languishing. Still bullish in the set up, still boring in the progress – lol
so if it was C&H, the handle would be more shallow & without the plunge?
It can be viewed as a cup & handle, as you have seen it. . I think one of the best cup & handle is a round bottom one, with a handle slanting far less than 50% of the height of the cup. More sideways . In fact, if it drops below 50%, it is technically supposed to be negated i think.
Yours above is still acceptable .
The inverse H&S has more of a shake out view, where that first dip was undercut and may have shaken out early arrivals. Basically, what you pointed out is acceptable as a cup & handle, I was just giving the other view :).
ok sweet.. still game on then 🙂
LABU hammered nicely of the 50ma area. Maybe bios are finally ready to join the party. Bios have traditionally rallied in May/June.
Back up over the 270 spt zone on IBB. Has a chance to make it back to top end of range, 285 now.
Bill – SRPT back at $18.
Excellent for you, but what a ride! 🙂
FDA to investors: ” Just kidding! We might approve still. Oh, and sorry for erasing $400M in market cap. No hard feelings, guys!”
My charts hit me so hard! It’s Hammer Time!
*REFRESH*