
APRIL 26 – Smooth Sailing?
Whenever we as traders get really really comfortable with our trades and trading, I think it is always a good idea to go back and shake things up a bit, just to keep us on our toes. Since not a lot has changed on the charts from the weekend report through Mondays trading day – I wanted to focus on trading and ‘trade set ups’.
Since January we have been rotating trading Precious Metals, Energy / Oil , NATGAS, and the CRB (commodities ) as they have been coming out of their recent lows. We have seen some pretty special moves and very special gains. I am hearing of trading accounts being up 50% , 70% , even doubling and tripling – no joke!
I don’t want to be the party pooper or rain on such a good parade  , but I do want to help us focus on a slightly different possibility. It has to do with expectations, and possible reality. Let me take you there.
.
THE CRB 2009 LOWS
I wanted to go back and look at how the Trading was after the 2008 crash. This is not the same footprint, so I am NOT saying “this is how it will be”. I am saying, lets see if we can learn anything that might affect our trades going forward.
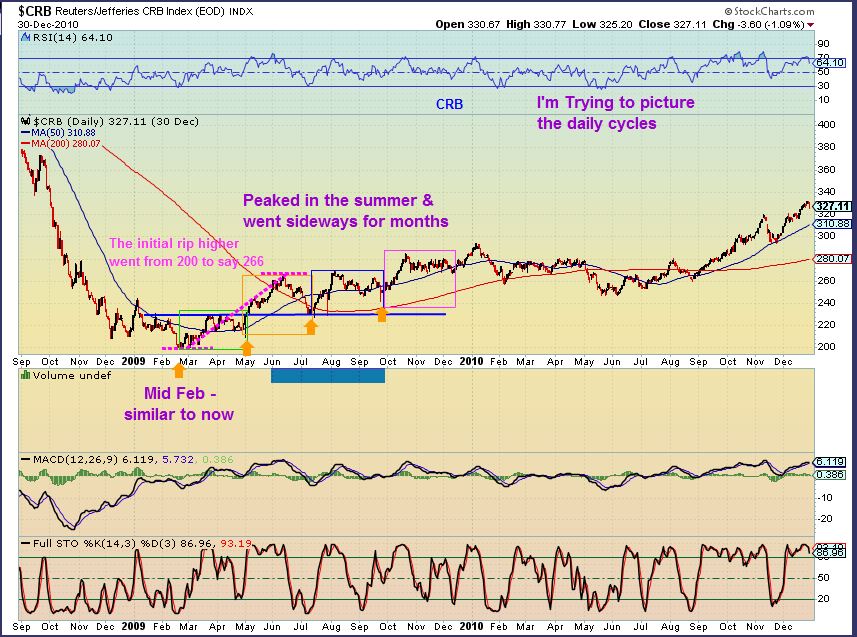
CRB 2009 – First glance, excellent! A move Roughly from 200 to 266 in 4 months. (The CRB just double bottomed in Jan and Feb 2016, so we are now about 2- 3 months into our move off of the lows, hint hint).
.
1. What I see was that the first run higher and the 2nd run higher were excellent. Green Box & Orange Box. After the 2nd run it was time to SELL the top again, because we see a big drop into July lows ( 3rd Orange arrow).
.
2. The 3rd run (blue box) was also great at first, but kind of double topped and the CRB went sideways. It then made new highs on the 4th run, and then sideways to down for almost a year. Good to know. NOW IS THE TIME TO MAKE MONEY.
.
OK ALEX – How does that affect me now?
.
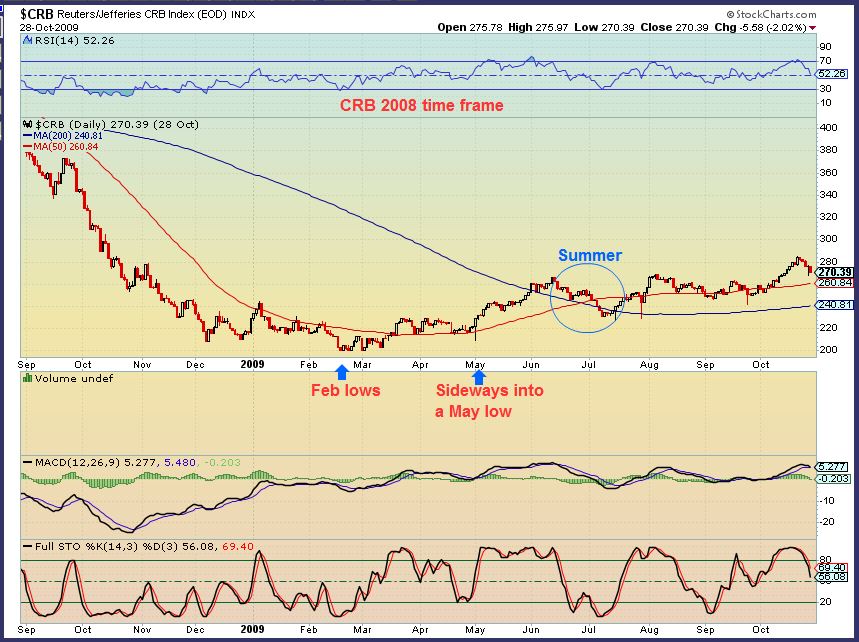
CRB 2009 – Zoom in. I just want to focus on the first run higher Feb to May lows, and the second run. The 2nd run topped in early June ( “Sell in May and go away” ). Side point: One thing that I note is that the CRB got above the 50sma and rode it in the first run. Got above the 200sma and then rode it down in the 2nd run. That’s just a side point.
.
Where are we now with our current CRB run?
.
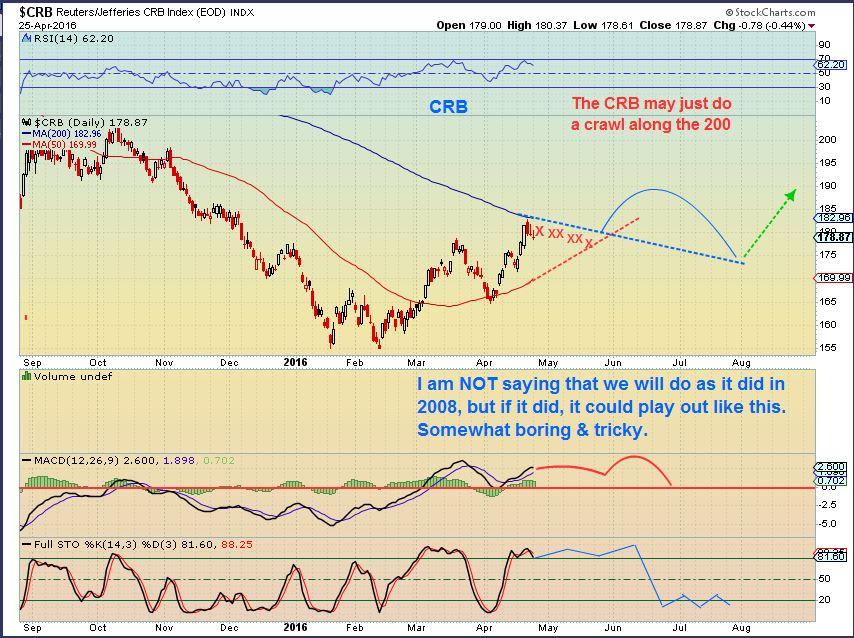
CRB – Nice run from the double bottom lows and through the 50sma. A back test to the 50sma and now a run to that 200sma. We could run along under it as our stocks pull back ( Vale, CLF, etc) , or break through and run, and then drop back onto it later. So , might we drop this summer too? I DO NOT KNOW, but That might affect your trading. If we get way too comfortable with our trades, we may miss our exit to lock in profit. I want to keep my emotions in check by looking at the bullish and semi- bearish side.
.
SO LETS REVIEW A COMMODITY STOCK OR 2 IN THE 2009 RUN
.
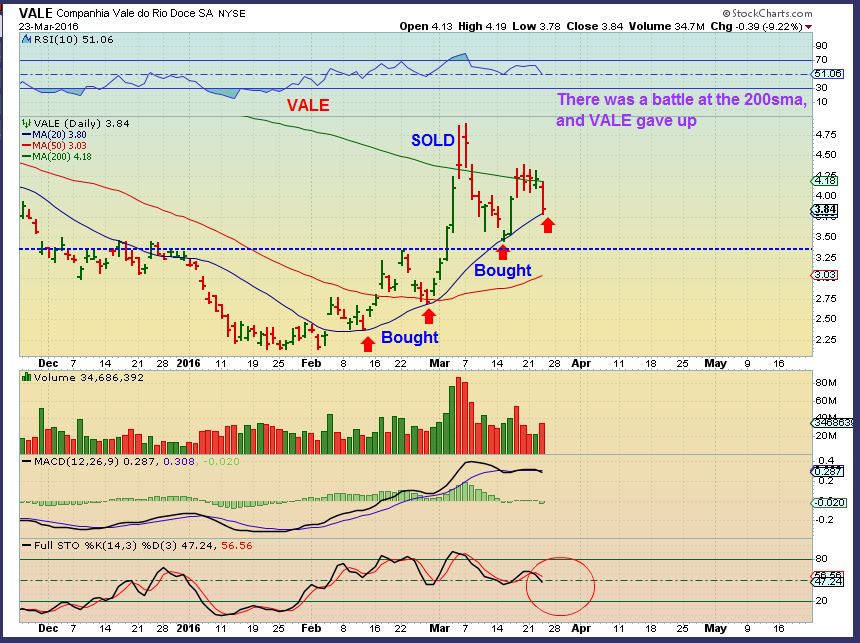
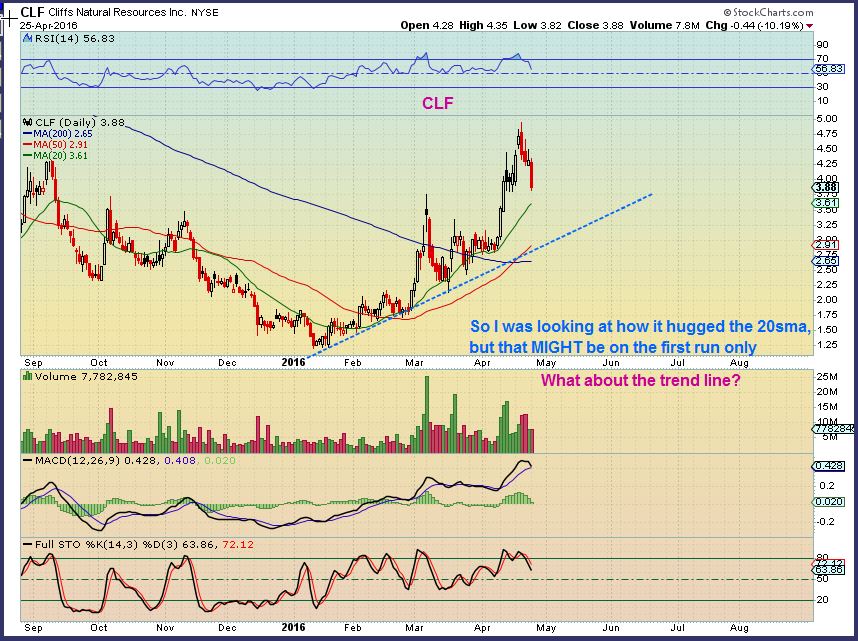
I have talked about the VALE and CLF run of 2016 – running up along the 20sma in the first run. I kept buying it there. This is what I mean, my chart from March 23rd report, just notice that 20sma…
I wanted to go back and see if that was happening in the 2009 run up
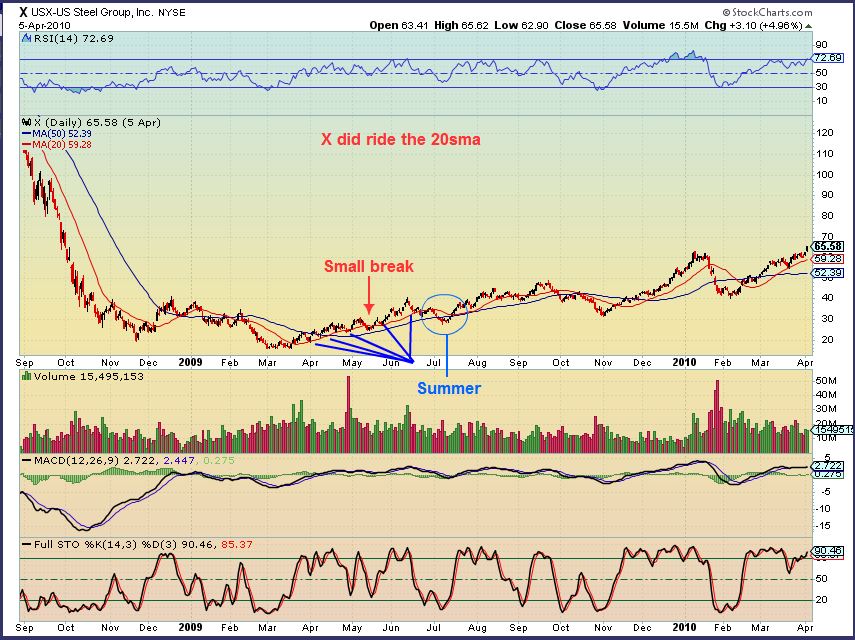
X – It ran along the 20sma ( red line) in the first leg up March through April, BUT ON THE PULL BACK, IT ALMOST TAGGED THE 50sma, BREAKING BELOW THE 20SMA briefly. We are in the pullback now. I thought you should know this. It MIGHT affect your trading ( I’ll explain).
You can see that in the big picture, it didn’t matter, the 2nd run into June highs made up for it. In real time though, people get nervous when they own a stock and see this.
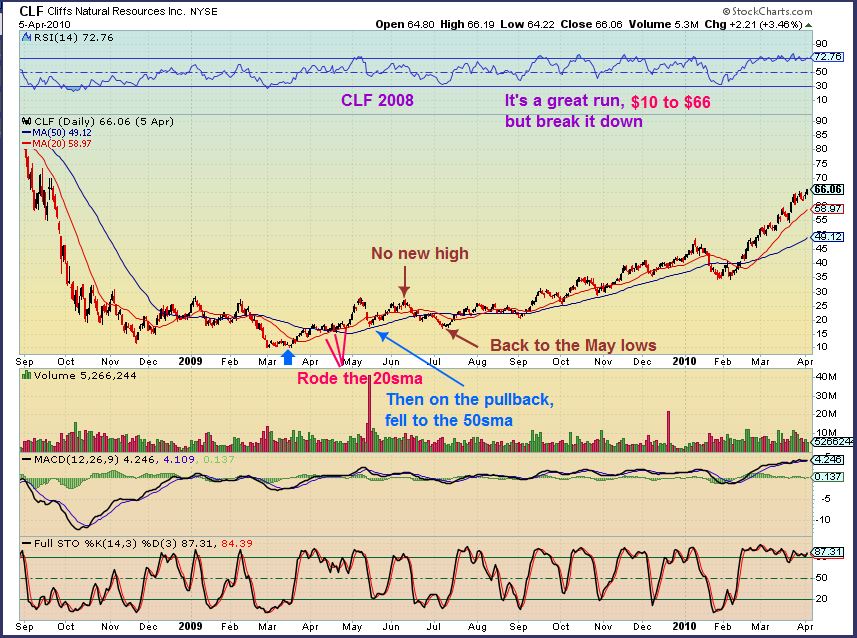
What about CLF 2009? Oooh – It rode the 20sma higher in the 1stt run. It SURGED HIGHER ( we saw all of that in 2016 too), and then dropped THROUGH the 20sma and onto the 50sma. The next surge into summer did NOT make a new high. July made scary lows, then lift off again! $16 to $66+. So the wiggles dont matter in the LONG RUN, but I know I get emails and people get ( let me say curious) if it doesn’t play out as expected.
.
SO – ENTER THE CURRENT TRADE SET UPS
.
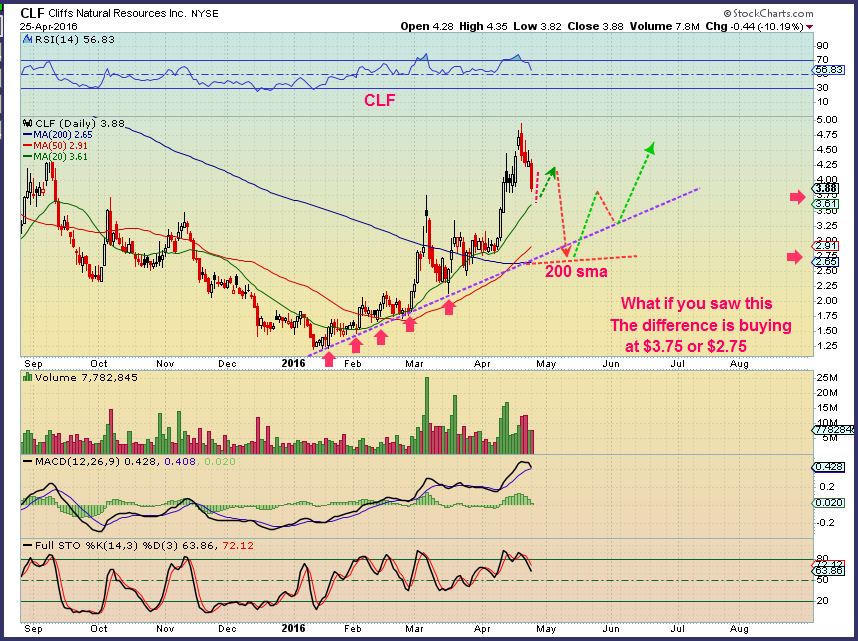
CLF – My last report said that I was watching the 20sma for a possible re-entry. MAYBE NOW I would try a starter position, knowing that this can drop to the 50sma IF it did what we saw in 2009?
-Do you see the difference between BUYING at the 20sma, and Buying at the 50sma? $ 3.60 and $2.90.
CLF – This is just my current “what if ? ” View. NOT A PREDICTION. ”What if ” we bought a bounce at the 20sma, and went “All in!” at $4.00 Then it drops to $2.75 ?  We might give our current profits back ( for a little bit anyway).
.
VALE – SAME IDEA. It dropped to support after the 1st run (Black horizontal line) .
-
Current support is a gap fill
-
That drop would tag the trend line (magenta)
-
That area is also the 50sma
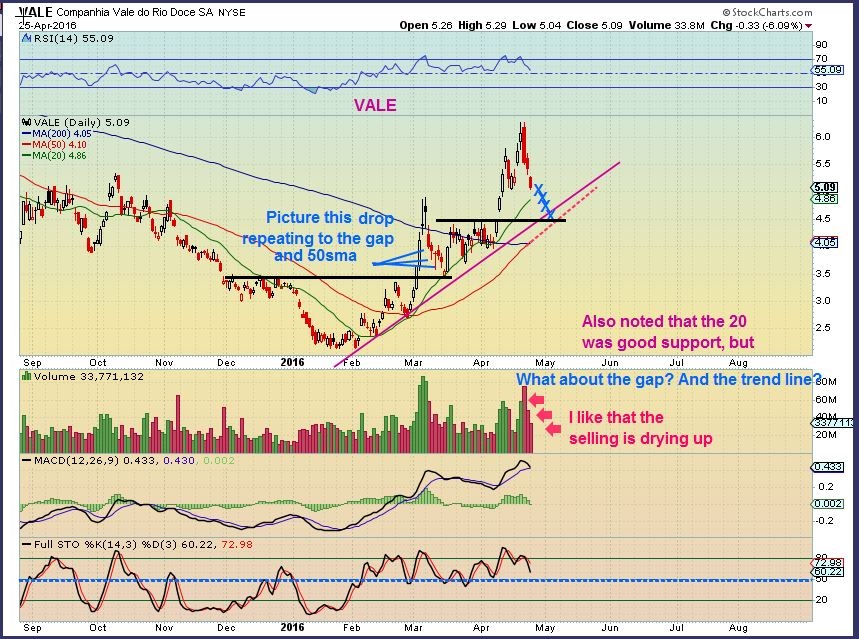
SO Todays lesson was simply about trading. Do you want to start a short term position as a bit smaller now, and add if it dips a bit more to the 50sma? If you are accumulating positions for a 3 year plan, to avoid capitol gains tax and you are “Buying here and holding until it hits $66 again “, you can ease into the pullbacks wherever you are comfortable. Time will replace any short term losses, if the commodity bull has returned ( I think the lows are in). For those looking for the best entry to trade now and sell into the Summer? It may be a little bit more calculated, a little more work and each stock may act differently. In the past, sometimes I nail perfect entries , other times I am off a bit. In doing my research, I think I would have been off by just buying at the 20 sma.
In addition : Often it takes real patience to trade well. If VALE turned higher tomorrow and ran up 30 cents, we might think ” I need to get in, it’s taking off ! The pullback is done“. Scroll back up and look at the last CLF chart. It happens. It is through experience and practice that you will get better. 
.
Please re-read the weekend report if you need to know my thoughts on the markets.
I hope this was helpful, have a great Tuesday!
.
~ALEX
.
Amazing how the moving averages really do seem to affect price 🙂


Hope everyone got out of SRPT last week. Continued issues with FDA approval, just got cut in half. Again. Never hold a failing biotech hoping for future approval. It’s just not worth it.
Cason, I got stuck. Trading was halted Yesterday, couldn’t get out. Should have sold Friday. Lesson learned. ETFs the way to go. LABU, BIB, etc.
Yes, as mentioned in prior reports , I had that happen to me years ago.
Now I usually have small positions and multiple positions at any time in Biotech or Miners just in case of surprises, but Biotech has always had a tough time with the FDA regulations / approvals, etc. They just get cut in half. I’ve seen Miners get hurt with flooding or an earthquake and only drop 20%, and then recover.
I honestly hate biotech, but the IBB does look like a really nice base. ETF is a good way to go, or a small basket of good set ups.
Alex or Bill… how looks XBI or LABU this morning.
Friends…. thanks a lot.
Friends…. thanks a lot.
CF still likes the chart but we can’t get a full breakout. So, I’m playing the rails – lower and upper bounds. I had it last week and sold Friday – I had profits in a 3x ETF and wanted to book them. But I still like IBB here so I wanted to just lower my overall cost basis. Got back in this afternoon.
Dear friend Cason….. thank-you again for your encourage response.
I’m still in XBI and LABU. It does me good to know some friends become valuable for me. Cason…. it’s bedtime for me (EST)
Im a little worried
Hey Bill, I wasn’t picking on you. Sorry that you got stuck – that’s a terrible feeling when they halt your trading.
Anyway, so my story – last year I was trading CLDN and it went straight up at first – I sold out and booked solid profits, like $10/share. But I got all fancy and was trading back in on a small pullback. I didn’t check the FDA schedule. It started falling before but I just thought it was a pullback from overbought. Nope. They missed Milestone 1 and it went down 80% in one day, from like $20+ to $3/share. I watched it for 3 days with no recovery. I got on StockTwits afterwards and saw a lot of folks thinking – this is on sale, we should buy. I tried to warn folks that it was dead money and if you rode it down you were better off taking the loss and writing off against your taxes then trying to dump money in for a recovery. It’s at $1 today. It sucked, but I sold and then it was over.
No problem Cason. I took a chance. I could have got out on Friday. I also new this meeting was scheduled for the 25th. I spread my positions out so this doesn’t hurt too much.
I see some more masterpiece charting in this report CF!…..fantastic outlook on reality….much appreciated.
Thank You Shermo, I was just looking over my current idea on re-entering VALE & CLF and I always do extra research. Thought it was important to share that here.
Remember VALE earnings are April 28th.
Excellent report Alex! Thank you for teaching us how to be better traders! I did buy very small starter positions in VALE and HBM yesterday. They look close but not quite yet ready to me.
Hey CS
Like we see in the 2009, in the next run, buying a starter position in this area should be fine. Also you can add near the 50sma if it goes there and your $-cost-average will lower. Just make sure that it is acting correctly, not bleeding down on huge volume. I was looking to start one if it tagged the 20sma, then I did some research and took note of a drop toward the 50sma as possible too.
Also I own HBM and it looks like a cup/handle so far
What is this called? , SRPT prices get cut after hrs due to FDA and someone says “I need to keep my job and look smart, so I will call it after the fact and later everyone will think I called it later ”
.
refresh
.
Brilliant!
thanks Alex. Last week i was about to buy. Luckily your reply is not favourable. I din’t get in. So shocking…within a days cuts into half.
Hey Siva, Are you the one that asked me about getting into it last week?
– I remember that someone did ask me about buying it and I said I wouldn’t touch it. Then it went higher and I thought that the person who asked me would be upset. Glad you stayed out.
Yes, Alex. I am the one asked your opinion last week. After your reply … i thought “there is always another better trade”. Thanks
Yes, Even when I miss the really good ones, there is always another trade 🙂
Dear Alex, any thought about GASL. Currently i am having significant position.
GASL is a 3x etf.
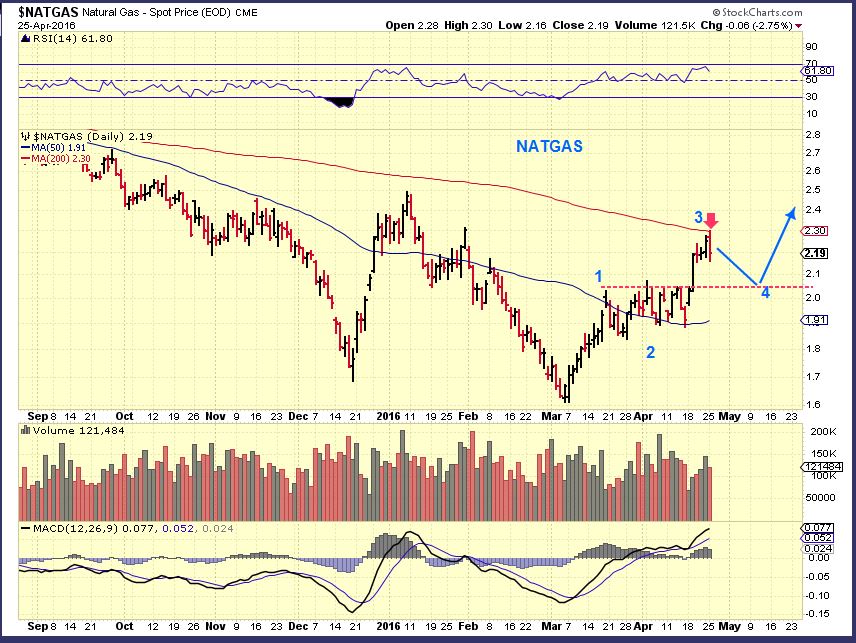
We are no longer at the lows in NATGAS & I usually only buy it at the lows, and allow it to run based on NATGAS, even though it doesnt follow it exactly. . It has run from $22 to $40. If I was holding it from that run, I would definitively have taken a lot off of the table.
Especially when I saw NATGAS tag the 200sma, I would have sold more than 1/2. Being a 3x etf, I would have sold maybe all of it .
I cannot tell what it will do from here, but NATGAS should drop away from that 200sma
EDIT: NATGAS is down today, GASL is up. It doesnt follow NATGAS, but I play it based on OIL & NATGAS
Alex.. which is the best chart to follow if you wish to trade natty…. UNG or $NATGAS?
the 200 sma on UNG bears no relation to its counterpart in $NATGAS.
I haven’t found UNG reliable for tracking Natty in the past
TCK had earnings yesterday and popped higher. That is good news to have that behind us and see a positive reaction, but I do think that TCK is a bit extended, so I wouldn’t enter here.
MU — excellent base and excellent volume as it looks to be breaking from that base
Does look good, MU 5 star rated, and making money. So it passes the FA test also.
hi Alex.. any thoughts on EPE? .. looks in a good poised position .. already bought some, may add more on a b/o
It looks good, but you cant tell how long it will consolidate. I think it is dealing with buyers back last Sept thru Dec that are selling at break even any chance they get. Eventually that selling will exhaust and this should push higher. That 1st run was pretty spectacular.
Alex,
do you know what happened to TGB, down 10%, is it a reaction to FCX earnings? or is there something else we do not know?
Light volume so far, and it does usually mover both higher and lower in 6-8% daily swings
I Watch the 34 sma with this one.
Good Morning All – nice to be here – seems like a happy group of traders! Alex just as a bit of a check up while I am getting going, I have positions in the these miners and am wondering if you see any glaring issues with them. – SVM.TO, TAHO, CDE, GUY, K.TO, BAA.
Hi (Can I just call you ) Byram?
Nice to have you here, and I assume that you got my chart in last nights comments?
Very nice run in the miners : ) GUY, CDE, SVM, etc looked great
I do not know all of the fundamentals for each Miner above , the only glaring issue is that I do expect a pullback soon, going into May. Is this a core position? If you can withstand some drawdown, they should be fine on the next run higher. So far Miners have resisted any major deep corrections or pullbacks though. ( So If this is a core position, I like it. I like BAA , TAHO, SVM, and CDE ) .
Hi Alex – my first name is Ron. I guess you could call this a core position. I use rules and therefore got kicked out of some of the holdings a few weeks ago when things went sideways. I am trying to stick to stocks that have an angle of attack – nothing trading flat if I can help It. I hear you that we might get a correction, but I’m just going to stick with these, and if we get a pullback to where my stop loss rules kick in then I could sell some of them.
In regards to a correction, I keep a close eye on the USD index as well, trying to figure out what’s going on with it, and I just noticed what might be the start of a recognizable trend developing. If you have a look at the 2 hour chart of UUP – doesn’t that look like the start of a rounding bottom?
Hi Alex – thought I had sent a reply but don’t see it here. I usually go by RonB on forums, but call me what you like. Anyhow, yes it is a core position, but I keep a pretty tight set of rules and ended up selling some of them a few weeks ago when commodities swooned.
Do you see some things in the charts that are telling you of a pullback coming up?
SO – commodities flipped to green from red. VALE flipped right at the 20sma. So a starter position could have been placed to make sure one had skin in the game just in case that is all they do.
ORIG is blasting off on mega volume today!
I had some ORIG…sold it a week or so ago, started to get back in yesterday….argh, guess I should have!!
That one I didnt have on my list. I like the weekly chart. It formed a small base, but there is hardly any resistance on the way back up
Hallo. I am in Germany i am new Here. I am watching PPP. any sugestion? thank you
Hello Aurelio – welcome to Chartfreak, glad to have you here
I can give you my opinion on PPP.
I used to really like PPP , I used to own it a long time ago and it did really well ( 5 yrs ago?) but it really struggled a lot and didnt perform well during this Rally when most other Miners were rocketing higher and higher. PPP is at THE lows.
For that reason, I think it needs to prove itself. It may stay here for a while. It does look like it may be a double bottom, but I dont see any proof that it really wants to move off of this bottom yet. It really needs some Buyers to come in.
If & When it recovers, it will probably play catch up, but right now the thing that I would look at is that on a 5 yr chart, it is at the lows. If Gold pulls back or they have bad news, and those lows get broken, What happens? I think that it can fall even deeper.
Thank you. I have in portfolio: PLUG YHOO HIMX and 70 % CASH
Regards from Germany
There is some litigation too…shareholders got lawyers involved. Check some news on it.
OIL just moved back up over $44, so Energy stocks seem to be responding after a tepid morning.
LGCY leading the way strong!
Last year, I had a pretty rough drawdown when I got the brilliant idea of trading 3x etf’s in the 1 hour charts. Was doing excellent with dailies, so after hearing from Bill and Cason here, I swore off any timeframe less than a daily chart. I have stayed with the dailies, but last few days, I went back to 1 hr charts to look for clues as to time entries/exits better. I am NOT A DAY TRADER, and don’t wish to be either. But the clarity that I’m seeing going through my positions in the 1 hr chart is incredible. I am analyzing 1 hr tf, with the 140 period sma (=20 day), and 350 period sma (=50 day). Martin Pring’s suggested setting for 1hr chart is 65,90,12, so I’m analyzing macd using that setting. What this does is slow down the ups/downs and reflects a trend. Vale and Clf turned today right on that 140 period sma. CLNE has been hugging it’s 350 period (50 day) also. I have CCI also at 140. Definately getting more acquainted with the 1hr chart. Day traders maybe use different set-ups, but, again, i’m not trying to trade every up & down, just looking for a better entry/exit. Alex, Bill, do you guys use the hour charts at all???
I ahould add that last year, the ma’s that I was using in the hourly charts were the same 20, 50, 200 periods that I use in dailies. THAT was why I got killed. The ma’s i was following were TOO fast, not to mention macd and cci were set too fast also, for someone who is not a *day trader* per se.
When I get what looks like a buy sett up on my daily, I always flip to 30 minute and 15 minutes to see if I see signs of a mini pull back coming If I do, I wait and try to enter lower.
I use a whole variety of things to gauge whether a better entry may come along, but again, those time frames mean that the pullback could just be a 10 minute dip – something like that.
I do it out of habit really. Not to save me 10 or 20 cents on my $10.00 entry, but as a challenge. 🙂
Yeah, I don’t think i would make it that far. There are just too may timeframes really. But definately paying attention to the 1 hr for *signals*. Thank you Alex!
Peter,
I use the daily chart to look for a trend and a favorable stock. I then move to the 15 min chart to choose an entry price. Look at RSI and %R on different scales for oversold entry points. I did buy CLF today based on the bounce of the MA on the daily chart. But most of all I just follow CF. I don’t have the experience or time to sift through everything he goes through. I picked up BCEI, HBM, and MU based on his recommendation. I do look at the charts, and I liked what I saw.
I’ll be doing the same, but will wait until the 1hr chart confirms the move in Alex’s charts. Will let you guys know how it goes!
maybe we just should hand over our account information to CF and have him place the orders
this way we have more time to go fishing or so, or watching Disney movies : )
https://uploads.disquscdn.com/images/641ec9f6eb68de57265b6a4aa1ca28b1d123e68edd7f5066e011a6fa4d43dd99.gif
Yeah, but….I want to go outside and play too ( or watch Disney if its raining).
no play outside in rain.. make mud pies… yeaaaahhhh!!
*I’ll watch u .. eat them.
*ahhh .. rain and mud… reminds me of a story…. say .. did I ever tell ya about the time I ….
oh, nevermind…
My sister and I did that as kids with my Dads cement.
That didnt go over too well with my Mothers dishes.
You could automate it!
Pretty much same here. I build a watchlist from CF then use the daily and support and resistance and moving averages to decide a basic price area to target. Then when I am going to enter a 3x, I’ll switch to an intra-day: 5 to 15 minutes, watching MACD, etc. I am certainly not as good as CF – I can’t spot the moves before it happens like he does. And I certainly don’t have the time even if I could.
Nice – thanks for sharing Peter and glad that is working for you. Yeah, I tried to get fancy and day trade and I just can’t do it. I didn’t have my rules set up correctly for that and I didn’t have the time during the day for that level of babysitting. Becoming more patient and not always ‘having to have a position’ and ‘letting it come to me’ as really helped immensely. If I’m waiting and don’t get it then I just have to go find something else. I stated most of it below, but similar to Bill I use intraday for my entry and sometimes exit. I’ll try some of your mods tomorrow – thanks!
Good evening Cason! Honestly, it’s something that i’m fiddling around with only. Still, i use the same parameters basically as a daily, the 20 & 50 sma’s , so technically, the daily chart will still basically give you the same info. Like you, I don’t have time to trade in & out in lower timeframes, and I’m not gonna try either! Doesn’t fit my personality. Moves too quick for me. I will still be making moves off of the dailies. I have found that to be the best way to neutralize my worst enemy: me.
Apparently the EMAIL ALERT didn’t go out? I need to send one out, so please excuse the inconvenience
Hey Alex – I don’t think I get any emails at all…? Do you send them out periodically?
Daily. They should be going to whatever email address you signed up with. When you sign up and insert your email address, we only use that to alert you when a new report is posted. An alert also goes out on Twitter here
http://buff.ly/23YOQ24
I have 2 Twitter accounts, and that one only posts the alerts for when I post a report.
Hm, ok, I checked back a number of days in my junk mail and still don’t see anything….hm, wonder what could be happening…..no idea where else to look….?
Do you have more than 1 email address? Sometimes people give us one when they sign up, but they dont use that one often.
I get emails each time you post.
No, it should be going to the one I’ve been checking…but….I just sent you a note to change it to a different email anyway – so maybe that will solve the problem. 🙂 🙂
OK – Will do 🙂
I never got a EMAIL ALERT, do you have my email?????????????
It went out late today ( I had to trigger it 10 minutes ago) there was a problem with the service. They usually go out as soon as I post a report.
You should have received one now.
yes, thankyou, I just received it
I just looked for your email, but it must be under another name. Glad you got it, it should come regularly as I post reports.
Dear Alex….
Two charts I’m looking this morning FCX and XBI, are they still bullish looking?
Where is the support line Alex?
Thank-you my dear.
Gt.
FCX bounced right off of the 20sma. If it closed green by the end of the day, I think that would be a bullish reversal.
XBI and XBB remain in a sideways move, they lack follow through to their break above that base, but they aren’t bearish. Maybe somewhat neutral. If you look at my prior reports charts, it is fine so far.
If you own LABU, it decays under those consolidations.
.
Refresh for the IBB chart. The red box is the base, above that is still fine.
Alex, what looks to be a hammer forming on the daily CLF chart near the bottom of the 5 RSI channel looks interesting. Nice bounce slightly above the 20 SMA area. Recency bias risk aside, there has been some decent opportunity there. I might be a bit early but CLF definitely has my attention
I agree
Possible Bull Flag on HBM daily, along with that cup & handle?
Hope so…got in yesterday.
The price Popped right when I wrote that . Now it looks like it may be breaking out of a bull flag with strong volume . Even better : )
PACD has that look today
PETER : (Refresh this page for a chart)
Per our other discussion. Say I wanted to add to HBM because I like what I see today. I would look at it this way and say, “Maybe I can get this lower on the lower trend line. It is overbought on that 5 minute chart.” SO I would try to buy a dip.
Click the chart to zoom in
.
But it also may stay strong and just go sideways until that trend line meets it and overbought is neutralized.
.
But it has a good chance to drop some and that’s the buy.
damn….sexyAs HE double Ell …
phewwwww… im loving these charts.. I literally type in a ticker.. and when the chart comes up… say…
W .. O .. W …
CF, what would be your read on the WPX chart? I entered around 8ish, a bit unsure where this chart is going (a good problem to have lol!) Thanks!
Tough call. Im neutral at this point. It has had a nice run, and could go higher, but without any strong signs of strength, it could do anything.
I know WPX hasn’t wowed anybody like LGCY, but it plays great defense. It doesn’t get clobbered 30-40% in pullbacks. Pull the chart back up – higher lows constantly, working up slowly. Instead of getting fancy, I’m just holding this one. Up 25%
Robert I am considering IPI any thoughts?
It really got hammered for some reason, but has leveled off. You could enter with a tightish stop, but it kind of looks like it could go either way at this point. Not a bad set up, but it may be a rough ride. It could easily drop to $1 and still be fine
thanks, I have a strong stomach for pullbacks if I like the fundamentals
Check out AA – It broke out and then dropped down to ‘test’ that break out and reversed back to run higher. Its textbook.
nice
Hey Thomas – fancy meeting you here!! RonB
Ha Hey Ron, I’m surprised to see you here but I really shouldn’t be 🙂
Still holding but haven’t added 2nd half yet as price mvmt hasn’t been that great overall to necessitate more exposure.
I almost got bored and dropped it like Bill but decided to hang around a little longer.
Could you provide a quick update on IBB, RPTP, and BAC?
I’m up on all those positions but am thinking of selling them today.
I sold them and sold TLT and added to commodity or energy stocks. Completely full on energy & commodity stocks and flat on gold & silver stocks. I feel pretty nervous with this positioning but at least I have a tons of profits for padding.
Oh , I missed this question , sorry. I got caught up in the thread higher up.
I did do an update on IBB below replying to Geurt, BAC is at recent highs.
I think you’ll do well with the new commodity positioning in time
Sorry JT.
Not only AA, but CENX & FCX have put in nice reversals today and FCX had earnings release.
VALE reversed earlier as well. I got my add this morning!
Anybody watching/holding CENX today???
come on CLF. been waiting all day.
Are you waiting for launch or drop for a better entry?
I ask because with almost all commodities reversing higher ( AA, CENX, FCX, HBM, even CLF) it may be that they will start a steeper incline.
I want to get CLF lower, near $3.50 if possible, but a smaller starter position just to have some skin in the game may help
Also BOUNCE and then a drop would cause it to hit the trend line higher up, if you were waiting for the trend line..
ah! Im long since yesterday $4.04. I forgot I had a buy limit price and I got filled yesterday. Just 2k shares. I think we’ll go higher from there.
In a couple of weeks you’ll probably be pretty happy it filled : )
I started a small position today , I like all of the set ups in these commodities.
$3.70 low Today may have been it. Almost tagged the 20sma
When I replied, I didnt see your chart yet. They dont appear unless the reader refreshed, I just did that now. 🙂
Not much mvmt today. I added yesterday. Probably a few cents early but I was watching and couldn’t wait any longer!
RAY mentioned CLD yesterday, and Isaid that I had charts for the weekend report and left them out. I decided to put them in last nights report, and I was on a different computer so I forgot again. I have a wkly and daily – they look good.
They will be in tonights and it is moving nicely today.
Nice eye , Ray
My lord SVMLF. what a daily chart!!!!!!
wow… like those african miners..sweetness
Almost any Silver stock. Look at AG, GPL, PAAS, EXK, so nice. Although EXK was a tad more shaky on the run higher. SVMLF was pretty smooth.
Regarding SILVER. we’re days away from a couple days of limit up. once the roof is popped. we’re heading higher.
Gotta love it.
CLNE ??? Dog with fleas???
my target for SILVER. (refresh for weekly charts)
Dear Silver, I need a larger position in you and your miner friends. Please actually do a real pullback so that I can buy some before you hit Frenchie’s target. Sincerely,
CF Members
Hey all, new subscriber, just wanted to say what an amazing job Alex does with this service and charting. Alex, whats your opinion on GGB? Picked some up at $1.92 today and seems to really likes to run the 20d MA as you point out. I think there is quite a bit of upside.,,,and MGH,? been in since .28 and rode the last drawdown and considered buying more thinking it may go down to .20 but never did. Not a lot of volume either which I usually try to avoid,
Hey Miller – Thx
I was watching GGB today, i do like it. It put in a nice reversal today. I was hoping for a gap fill, but I think that may be good enough.
MGH I covered last week, I’ll put it in the report tonight again, but Miners could pull back ( I’ve been saying that for a while as a warning, but they are defiant, and I have been trading them ) 🙂
Right on, Thank you, and yeah you have been trading them very very well too, LGCY was a great call among many Ive seen you make so far, I thought it would pull back to trendline and never took a trade,(prior to my subscription),one of my flaws but Ive already learned a few things about my entries just from reading all your past reports. Ive been waiting for GGB to hit $1.92 for over a week now to enter, that one worked.
ISNT THAT AMAZING! Patience in those situations is tough, but that was a nice trade entry ! Congrats
Alex,
Biggest single constituent of CRB is crude oil, definitely energy-focused. Since we have such long daily cycles in crude was expecting that we had more time to hold our energy plays. Should we be looking and starting to sell out of our energy positions already – 1/2 with a trailing stop?
In other news: sold LABU for profit Friday, added back 1/2 today. Add CLF yesterday and VALE this morning.
how many of ya’ll trade options?
Only a few of us. I do. Ken does as well. They haven’t been kind to me recently so trading them a little less frequently right now.
Some rough earnings updates AH yesterday- APPL, CMG, TWTR all disappoint and set for large gaps down. X looked ok last night on huge but expected loss.
API comes in with unexpected draw (-1.1M, draw on gas, distallates but build at Cushing) pushing oil up overnight. Govt data at 1030. Fed releases at 2 PM!!