
Not Quite Finished Yet
The Markets continue moving along, but in some cases we are not quite where we wand to be yet. Lets review…
.
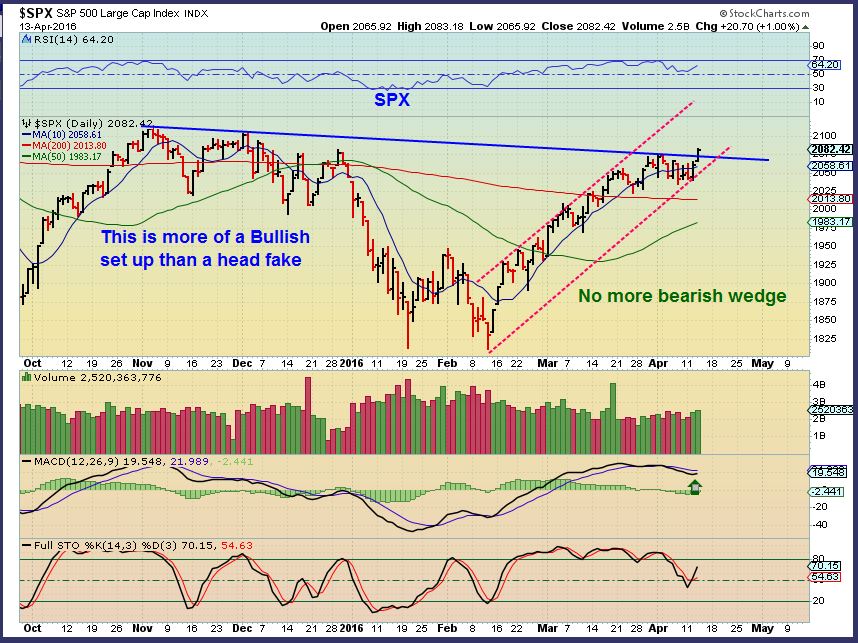
This was the SPX in Thursday mornings report.
Now lets look at the Big Picture as of Fridays close
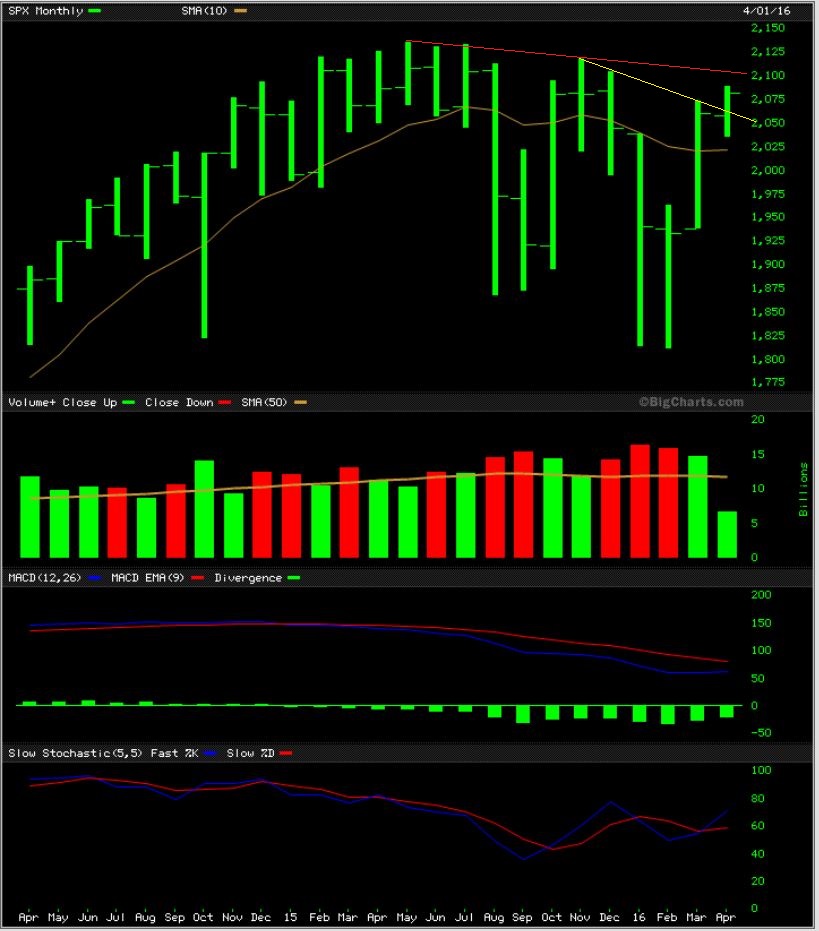
SPX MONTHLY – The Monthly is still making progress and only 1/2 complete. I mentioned the Quarterly bullish chart at the weekend report for the end of March, so this is looking at follow through.
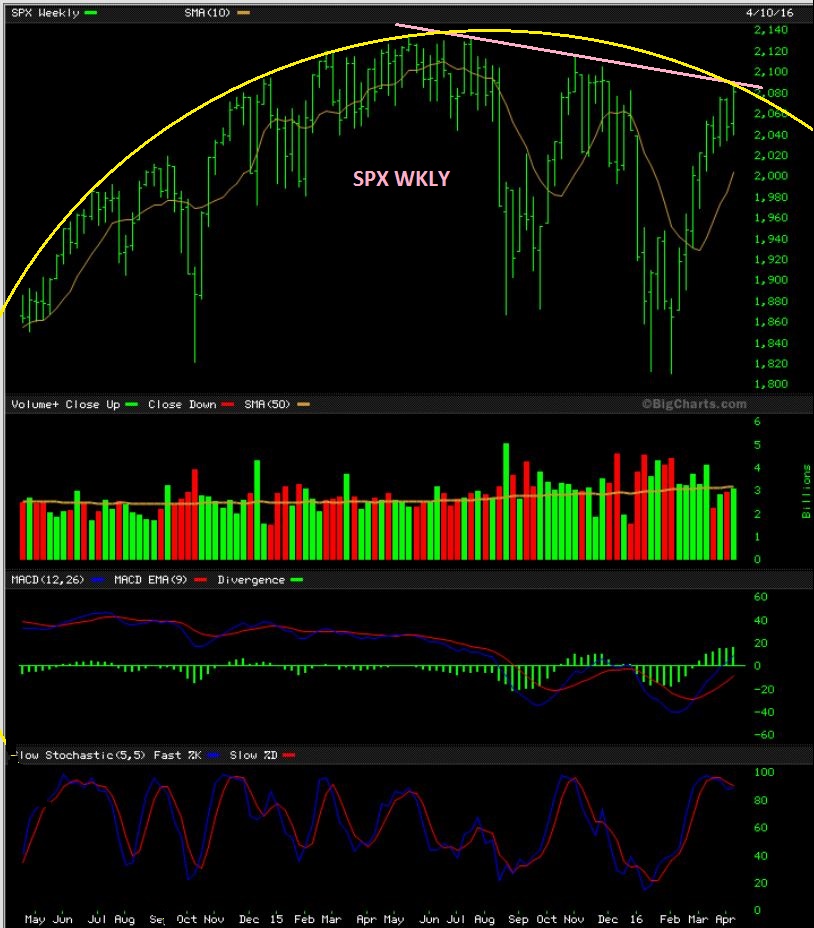
SPX WKLY – This is an unfinished picture. If we just go sideways for weeks, the energy could deplete. If we surge higher, we’re seeing a possible break free from the rounding top scenario. We see a rounding top formation, but that will be done away with if the markets can continue higher. Note the Pink trend line too. The markets are overbought, but they can stay that way, we need to see how things play out. The old saying used to be “Sell in May and go away”.
At the end of 2015, I called for a market drop or crash. I mentioned recently that many things that I had pointed out in my December reports as bearish ( HYG, JNK, BKX, RUT, TRANNIES, Bear Wedges, etc ) have improved after that drop and the recent rally. Lets continue to monitor things now.
.
BKX – My Jan chart showed am important green trend line. Price would need to hold $60, but it didn’t.
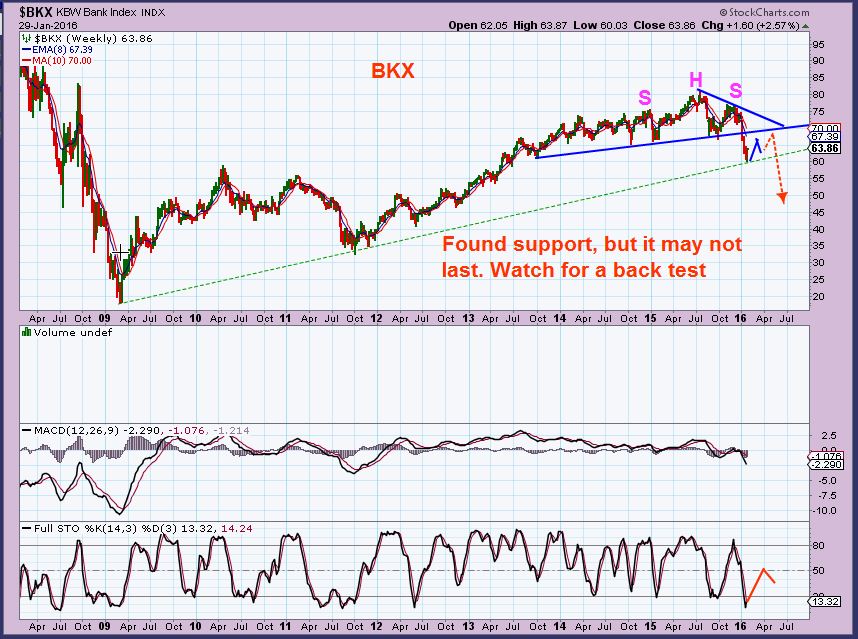
Feb 16 – Then I noticed a possible completion of the drop in a 1-2-3-4-5 move, after breaking the $60 & recovering.
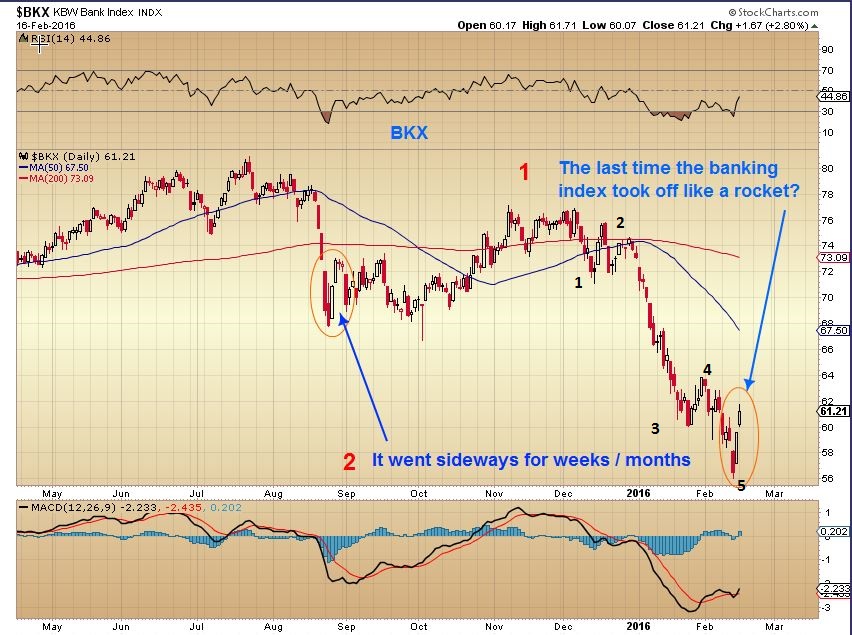
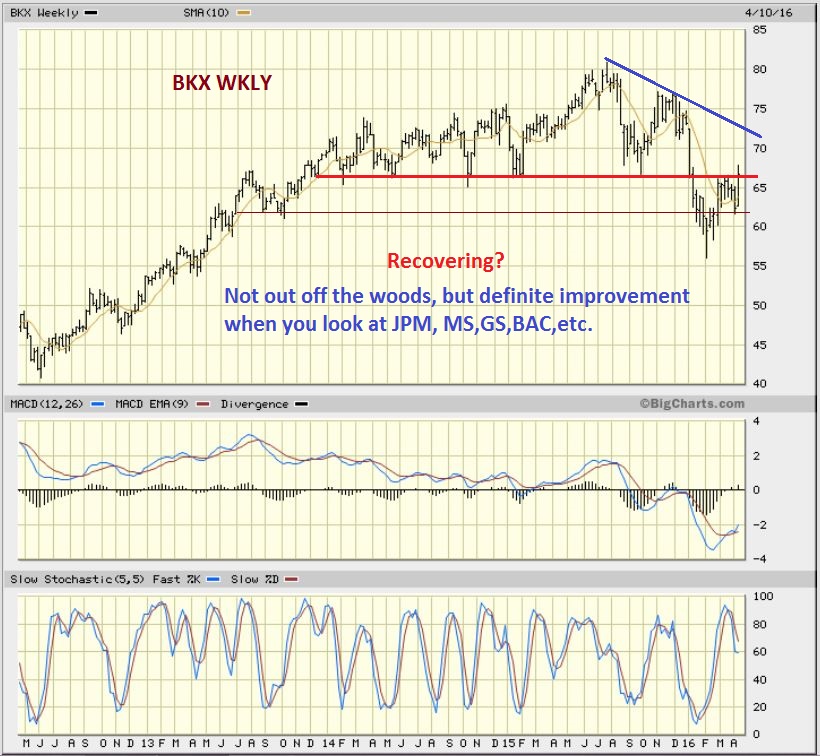
BKX 2 months later – So we see the BKX near 67, even recovering the red line break down. Charts of Banks look good, as mentioned in last weeks report. The big picture remains unfinished, but we’ve seen improvement as time moved forward. This is rather neutral.
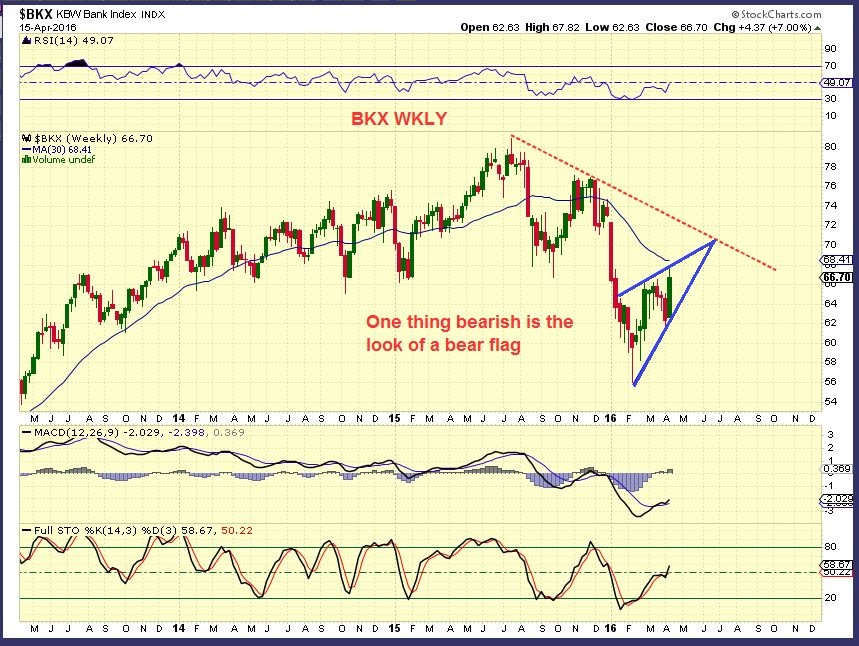
BKX WKLY – One bearish thing would be if the Banks lose some steam as time goes on, this is possibly a bear wedge forming. ( “Sell in May and go away?”) .
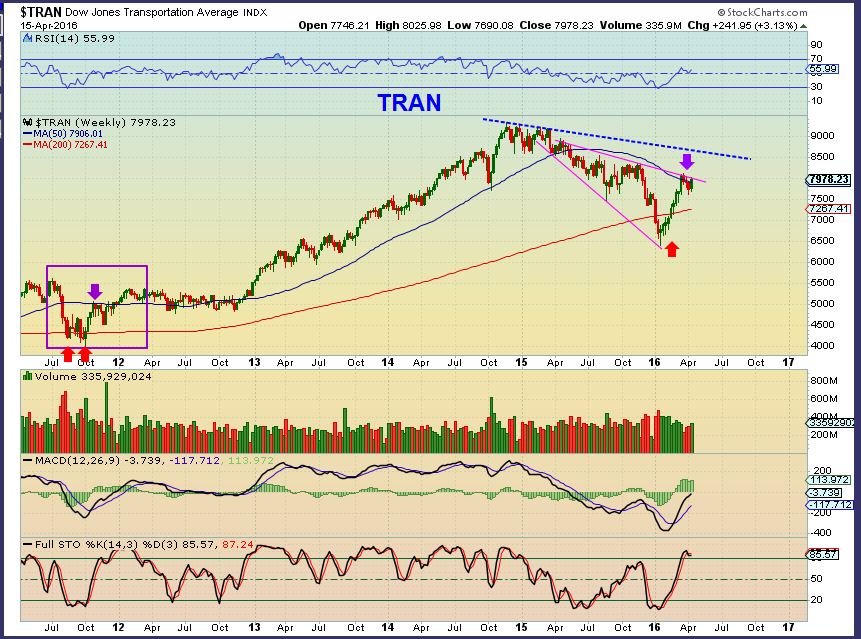
TRAN WKLY – Again we see improvement in the TRANNIES, but the BIG picture is unclear. This does have more of a bullish look to it, but it is NOT back near its highs like the SPX is..
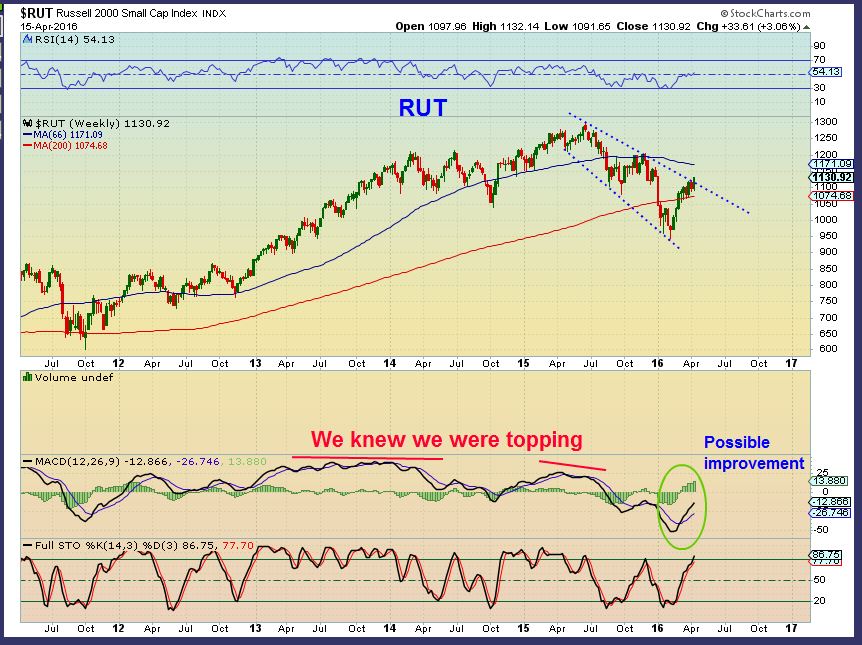
RUT— Also needs more time. Look at this chart. Did you notice that price has actually been here for 2 years.
SUMMARY: I show these views to track the future possibilities. In the recent bull market run, the SPX NEEDED a 10% correction or more to change sentiment and slow things down. The above charts all show that we got a good correction in the first 3 months of 2016. Now we need to continue to monitor if we are going to continue the bull and break to new highs? Or will the markets roll over? There are theories as to how the markets act during an election year, or we also have the saying- “So goes January, So goes the markets” for that year. These sayings are based on historical performance, so we do keep them in mind, but the markets can do anything. At this point I would NOT being shorting the market.
.
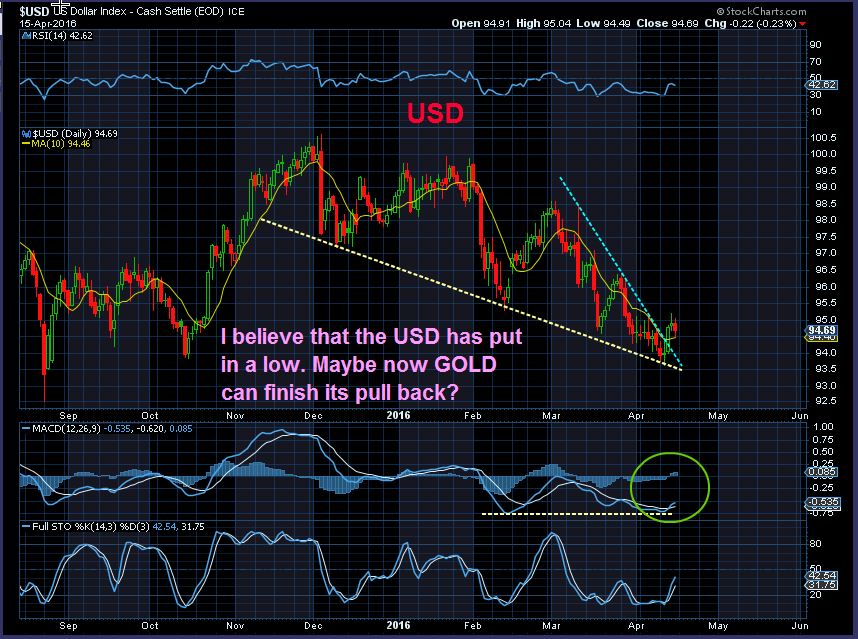
The Dollar looks ready to rally, that may affect things too. The markets were able to run higher last year when the dollar rallied, Gold struggled.
.
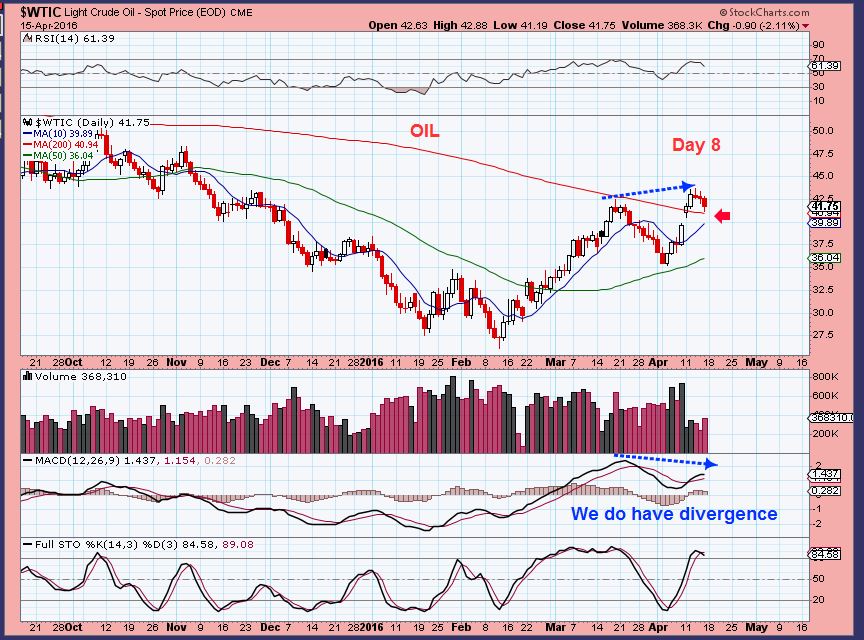
OIL April 15- For the first time in years, Oil closed above the 200sma and it remained above the 200 sma all week. friday was day 8 of this daily cycle. We still have a gap below that may want to fill. I’m watching the 50sma and 10 sma for short term support. This weekend was the big meeting for Oil, and Oil is selling off on Sunday night to $39. The divergence warns of weakness, watch the GAP, and then the 50sma. Also remember that when OIL sold off for 9 days in a row, some Energy stocks held up. We’ll watch for that.
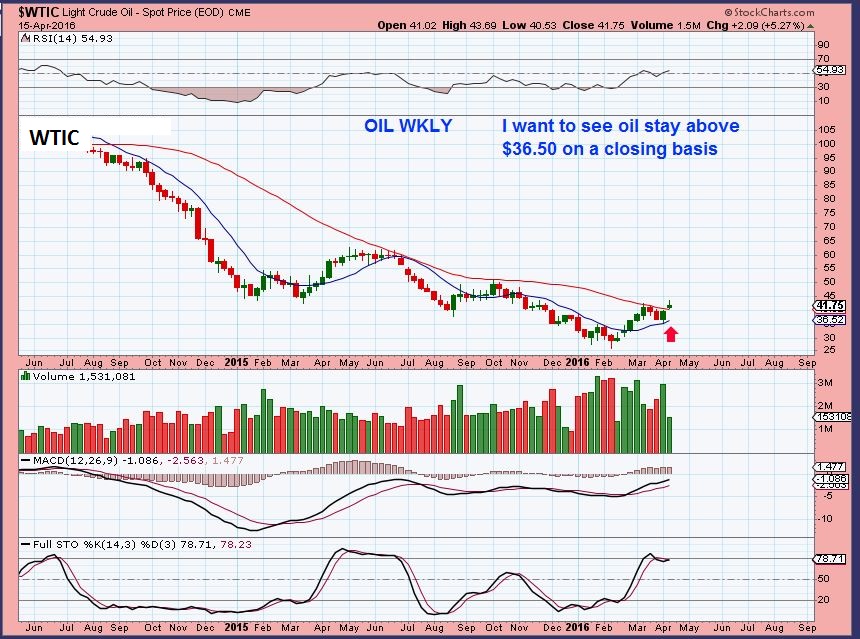
OIL WKLY – I do not want Oil to fall below $36.50 on a wkly close. It is basically the 50sma on a daily. I also would rather that it holds the 200 sma on a daily, but a quick drop & gap fill and recovery all in 1 week on the above chart would work too.
XLE WKLY – The XLE never dropped to the lower trend line. It remains a bullish set up, but I do hate climbing on lighter and lighter volume.
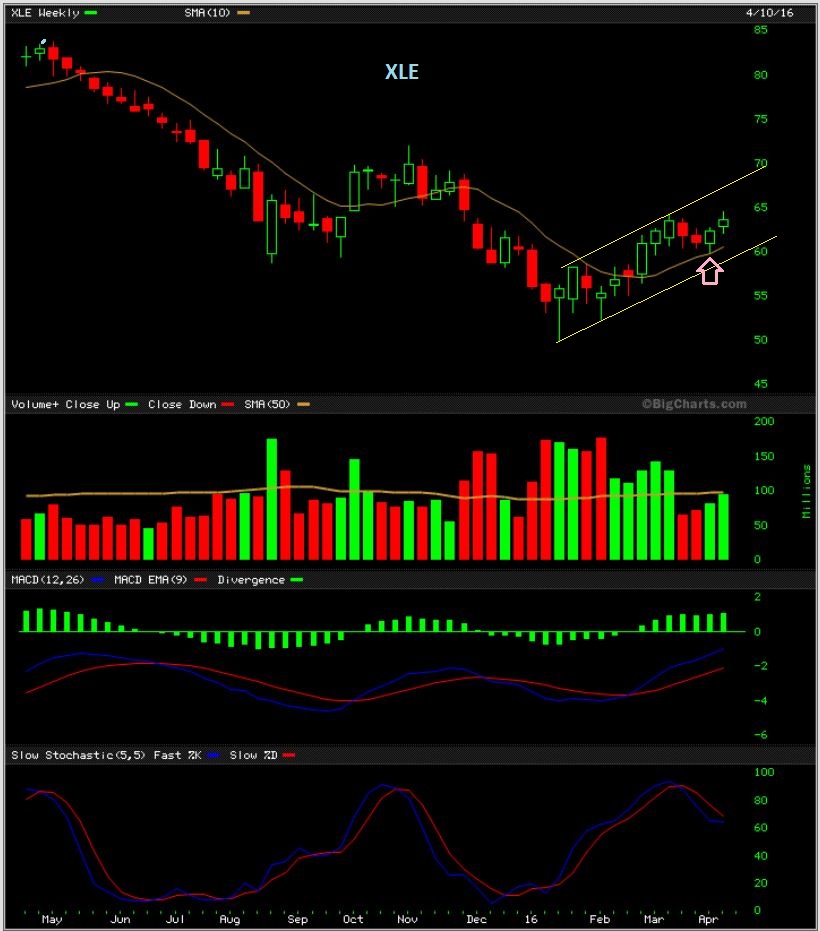
OIL and therefore ENERGY are early in their daily cycles, so I expect more upside. Individual companies can be risky, so I have suggested smaller positions and a small basket if possible, or you can use ETFs, unless you have done your due diligence and are confident in the fundamentals of the company. I have posted charts of Energy companies that are acting very well. See last Fridays report.
.
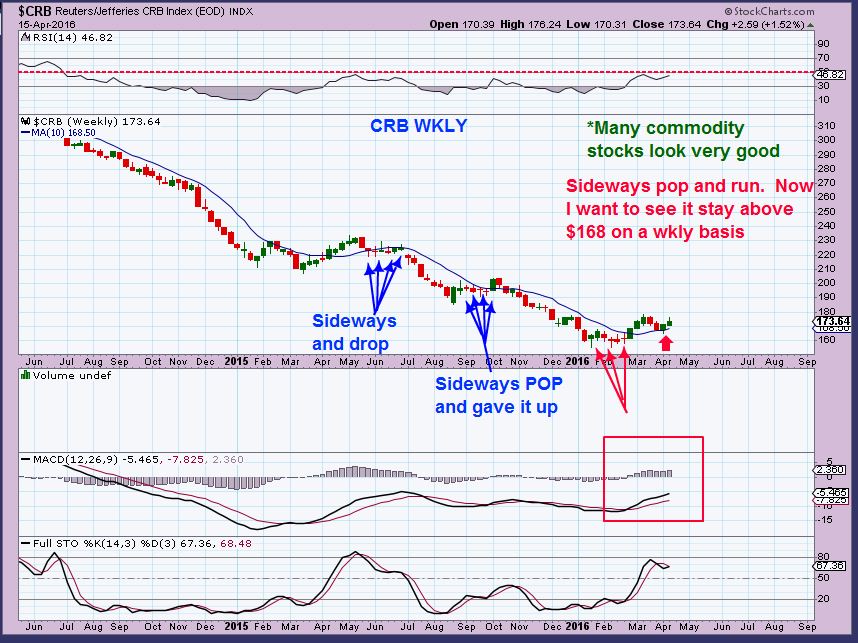
SO MANY of our Commodity stocks charts that were mentioned here ( CLF, VALE, AA, AKS, CENX, SID, STLD, ZEUS, ETC. ) are bullishly set up and some wont pull back when we want them too, so keep that in mind as we look at the CRB.
.
CRB – It looks good holding the 10 ma on a wkly basis.
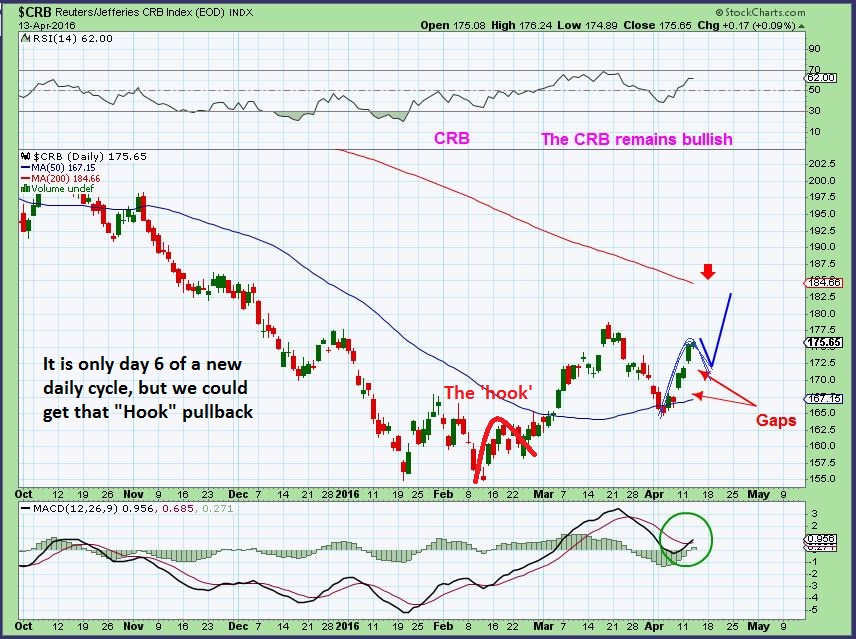
CRB DAILY – I posted this chart showing ‘gaps’ . We did ‘hook’ down and fill the top gap at 172.35 on day 8. It could drop further or that may be enough, the picture is unfinished, but many here want to buy a pullback, so we’ll keep an eye on it.
.
Sidenote: See prior reports at the end of last week. We are waiting for a pullback in some commodity stocks like VALE and CLF, yet others like CENX and AA may be nearing a point where they break from their recent consolidations.
.
GOLD, SILVER , & MINERS
.
SO MUCH TO SAY.
I’ve called for a pullback in Gold, and we actually have been getting one, but it is more of a slow motion sideways move for 2 month!
.
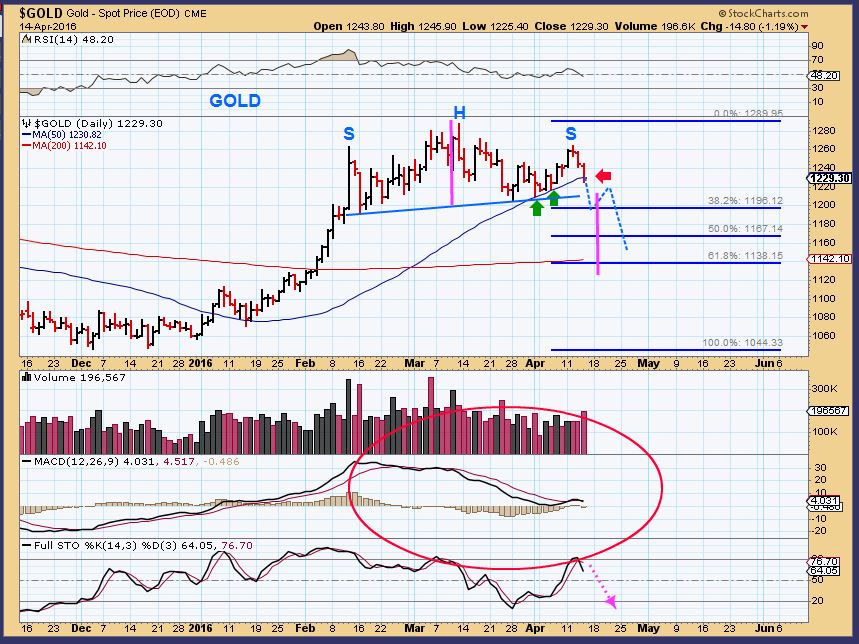
GOLD #1 – You can see that sideways move here (and my expectations). This was GOLD April 14th. PLEASE NOTE the 200sma and the FIB #’s as possible targets. If we are patient, we may have a good entry point coming up in the near future. NOTE ALSO that the 200sma is turning up ;). By May the 200sma could be closer to the 50% FIb.
Weak MACD and Overbought.
As this pullback has taken place, Miners ( especially individual ones) have done their own thing. Some still breaking out higher to new highs. Anyone who owns a core position has been very happy. Anyone waiting for a pullback to buy are not happy.
.
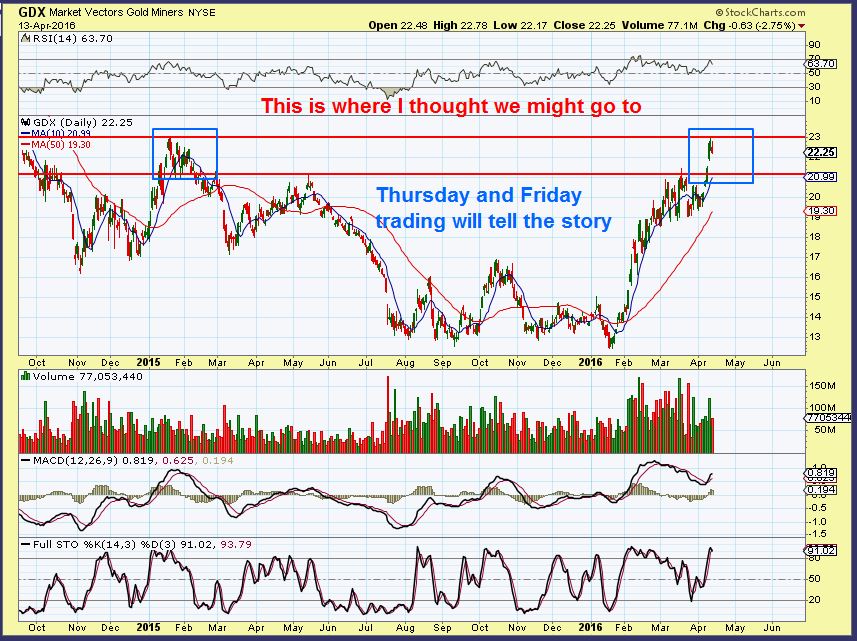
So this was GDX April 13 – now a pullback, since Gold has been?
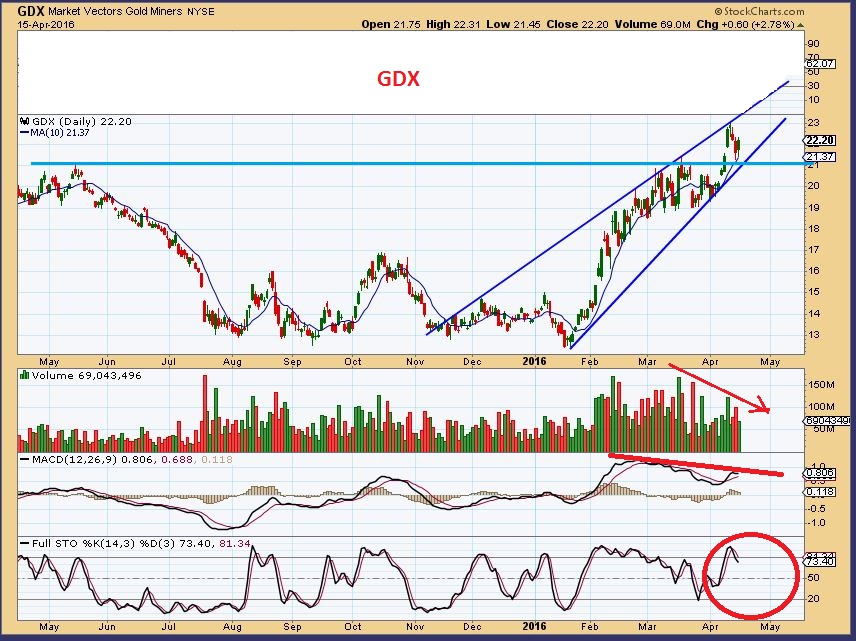
This was GDX Friday, it did pullback for 2 days, but as of Friday it still looks bullish – ugh.
GDX – This Friday shot looks a bit more like it might be topping after falling back down to 1 support level that formerly acted as resistance. It is overbought and shows weakness in the MACD and other areas.
.
SO I AM STILL THINKING THAT THIS PULLBACK,
THIS SELLING, IS STILL NOT QUITE FINISHED.
.
If we are on Day 10 of Golds Daily Cycle ( And I cant exactly tell where we are with such a strong sideways move, but it looks like 10 or 13), we have another 2 weeks of possible downside. It can pick up or escalate as the selling takes hold, or it can keep going sideways under accumulation. Either way, a buying opportunity for the next INTERMEDIATE CYCLE should be nearing.
.
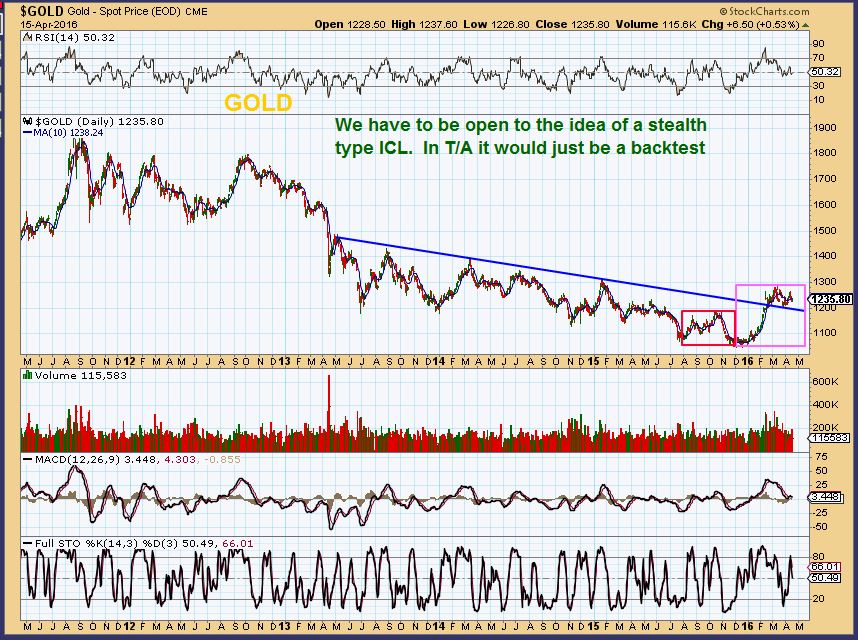
GOLD #2 as of Friday – I mentioned this before and it is still remaining a possibility. A sideways chop , POP & DROP, could continue as time goes on, relieving overbought. It would be just a back test. No MAJOR deep pullback.
.
AND MINERS? – Yes, they too may just Chop , POP & DROP , in a sideways consolidation move. That is what we are seeing so far. Look at the XAU in 1993 coming out of a low. I have shown this before to point out such sideways consolidations. For 6 months out of the lows, it was choppy & sideways and gradually higher and higher. It actually ran higher for 8- 9 months before a significant looking drop back to the 200sma.
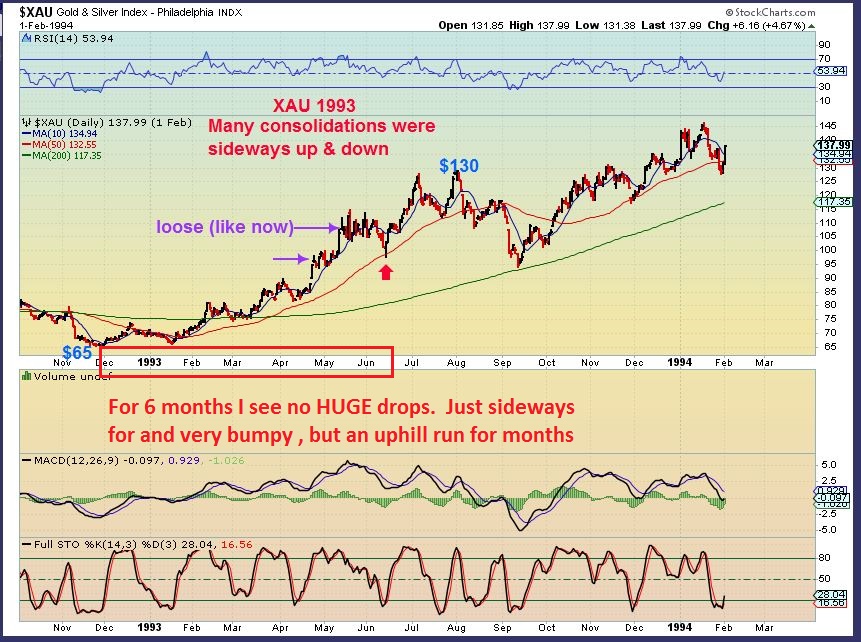
The above chart is why I mentioned months ago in JAN and FEB, that if you are going to start a core position, you may want to only ‘partially’ sell on the way up and hold some for longer term.
.
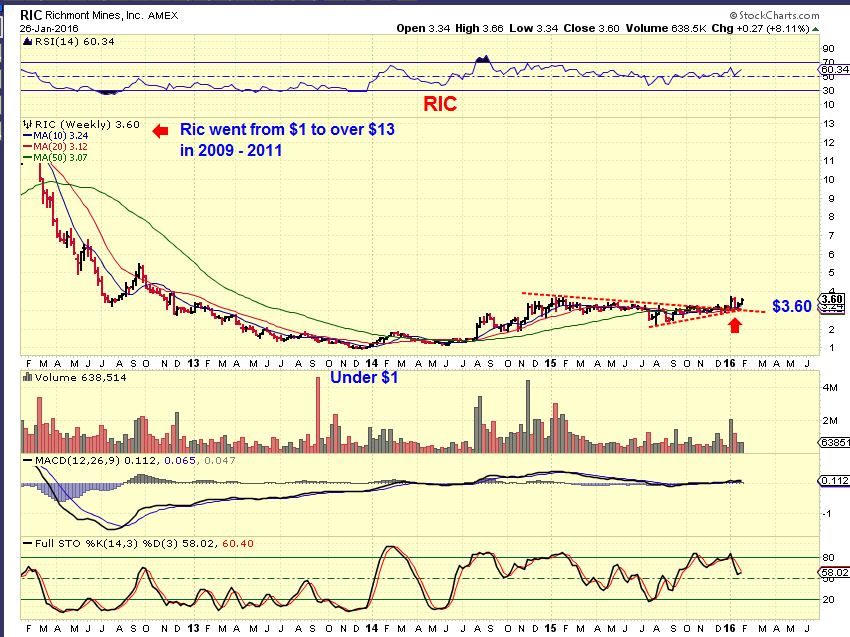
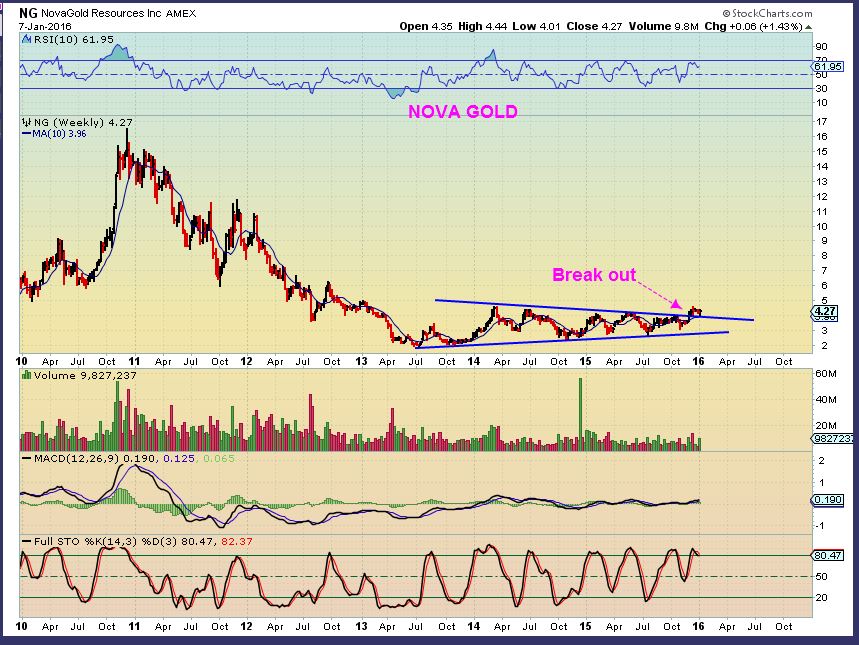
I pointed out in January that some Miners bottomed LONG AGO. They bottomed YEARS AGO. I showed NG, RIC, LSG ( Now purchased by TAHO), and a few others. Huge bases were already in place and the lows were never revisited, so I said that they could be safe to buy & hold as core positions if things remain bullish. They have remained Very Bullish so far 🙂
.
So for some of the newer readers: At this point, I want to revisit those charts from Jan again, and maybe a few new ones, and again discuss this idea of a core position. That idea was based on certain Miners looking like they already bottomed …
.
RIC – Actually bottomed in 2013. A Huge base was forming.
.
NG – Bottomed 2013 & was breaking out already.
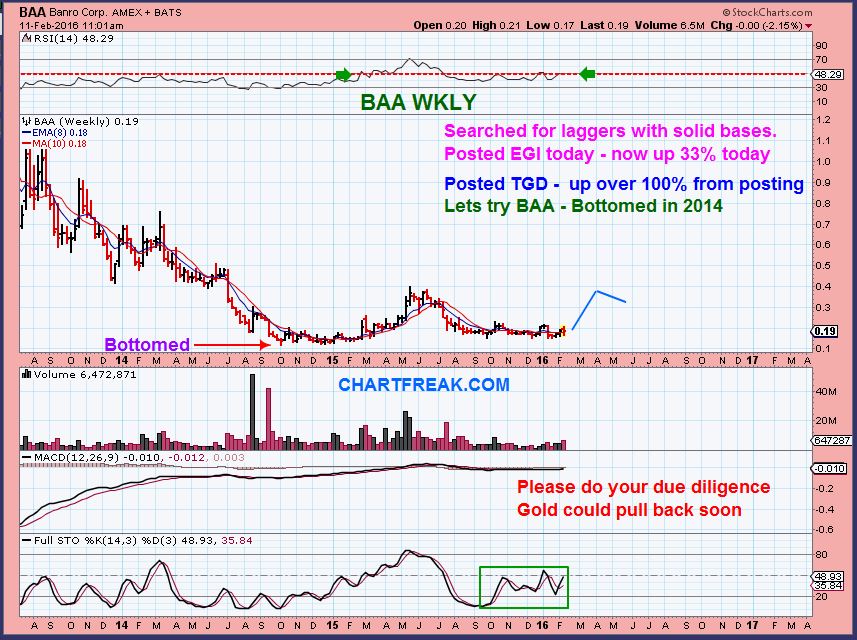
BAA– Bottomed in 2014& formed another base.
.
Then I had been pointing out the various buys in TGD from 10cents, then 12& 13 cents to add, and onward.
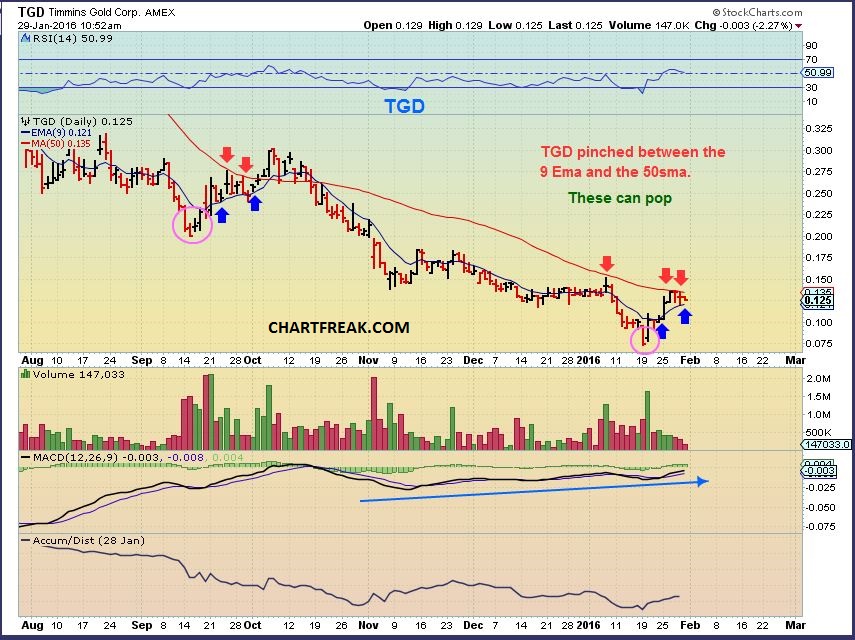
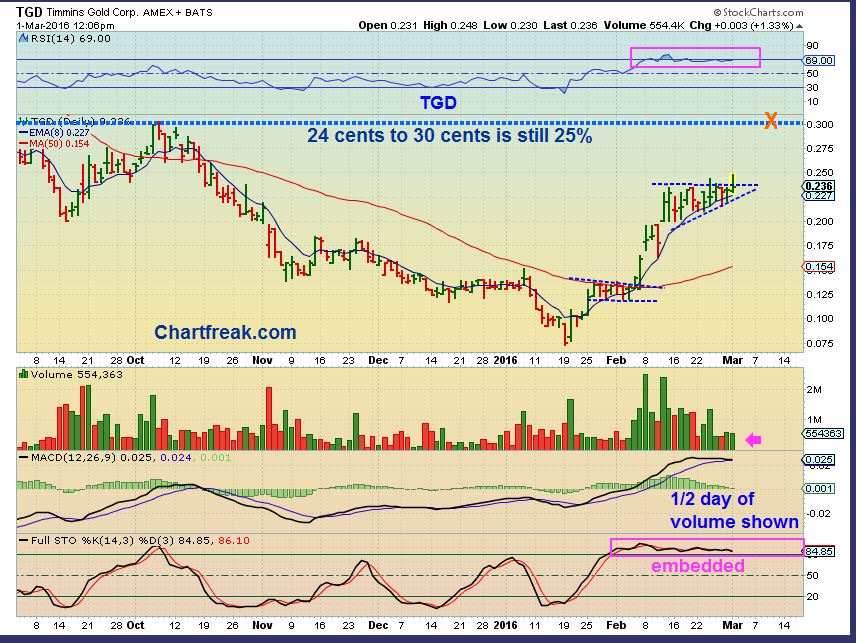
TGD even got to 23 cents, yet a run to 30 cents was still 25%. This was becoming a good candidate for a core position too. It was acting strongly, that 50sma was rising.
.
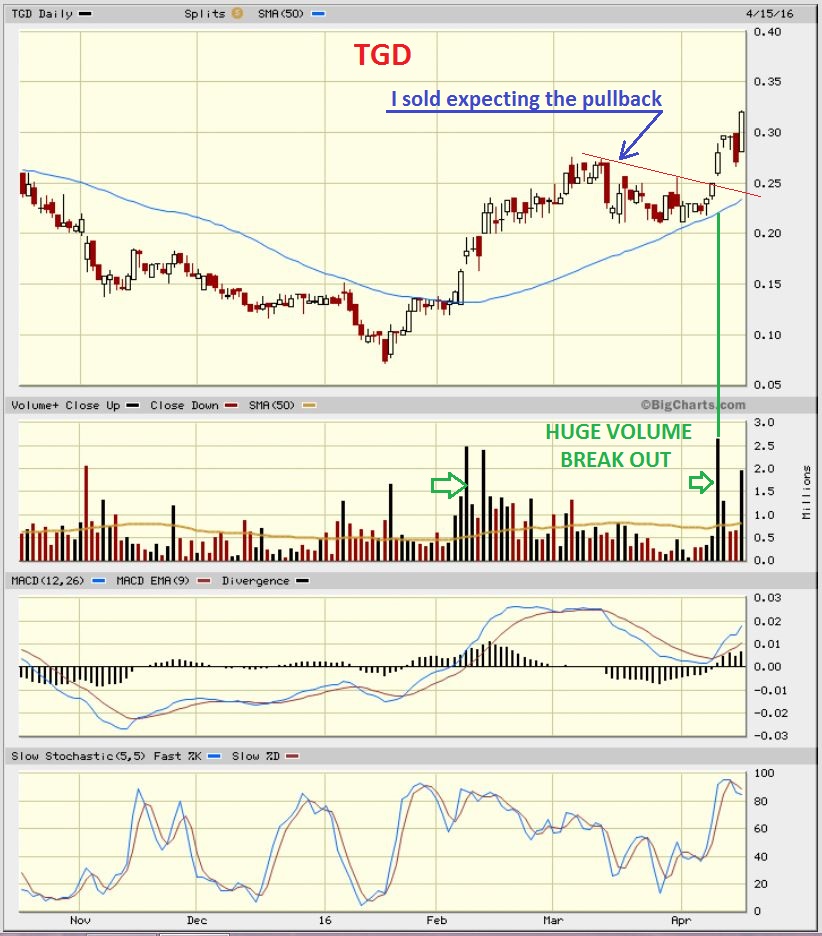
TGD is NOW at 32 cents. It did pop from that 23 cents to 27 cents, but then dropped. I sold that large drop and it dropped to the 50sma near 21 cents and recovered. It then moved higher for the last 2 weeks, and Broke higher on strong volume. It is now 32 cents. These Juniors are acting strongly and possibly being accumulated. As a ‘trader” I bought the large volume break above the trend line higher , so I ended up re-buying TGD higher than where I sold it. Oh Well. Lets step back and look at TGD’s Big Picture.
.
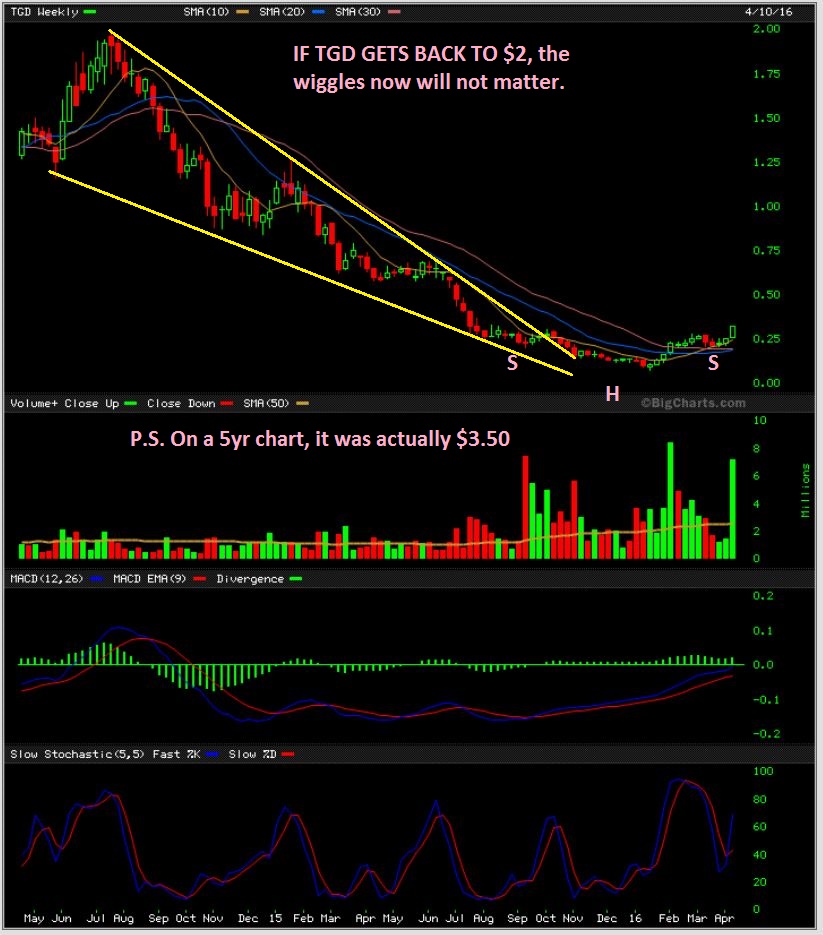
TGD – Again , have we re-entered the BULL market? After looking at some of the long term weekly charts, I see real nice potential for core positions. I love this set up longer term. A CORE position in TGD could pay off nicely over time, whether you bought it at 10cents, 13 cents, 20 cents, maybe even 50 cents in the future.
.
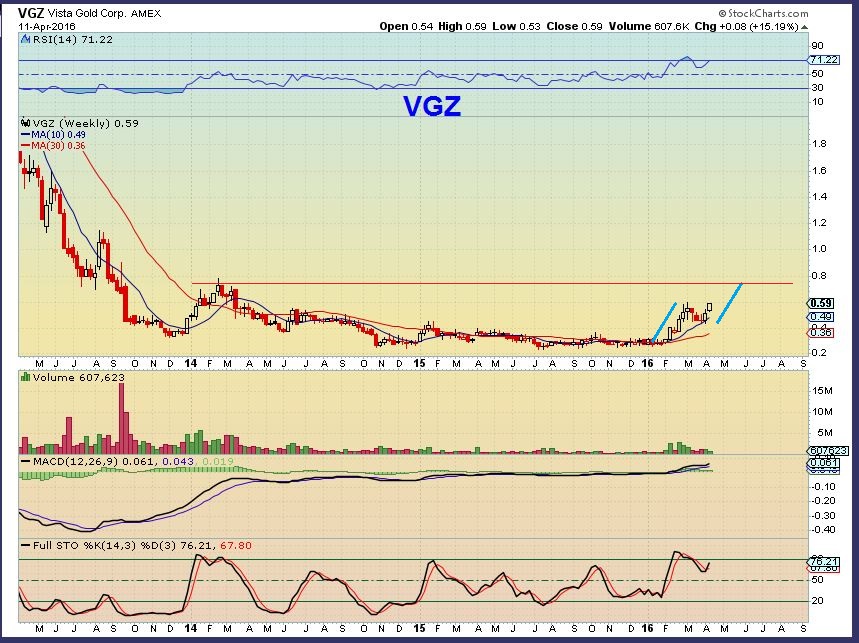
I grabbed this weekly chart on April 11 for a friend. We are expecting a pullback in Gold & miners, but look how bullish these juniors were set up . I mentioned 2 Fridays ago a possible theory that since GOLD BOTTOMED DEC 3, And MINERS Bottomed over a month later in Mid January, Miners could still run higher before their next correction. So again, as a ‘trader’ I bought the set ups in TGD and VGZ as short term trades (and I missed AUMN and GSS) . They all Popped and now some may just go to ‘core’ holdings.
So I just wanted to add 2 more of those LONG TERM charts again, to show that many Miners look to be bottoming for the next phase of this bull market. A much stronger phase. This way, whether this pull back ends with a sideways move or a good drop in the next couple of weeks, I think it will be a Great Buy!
.
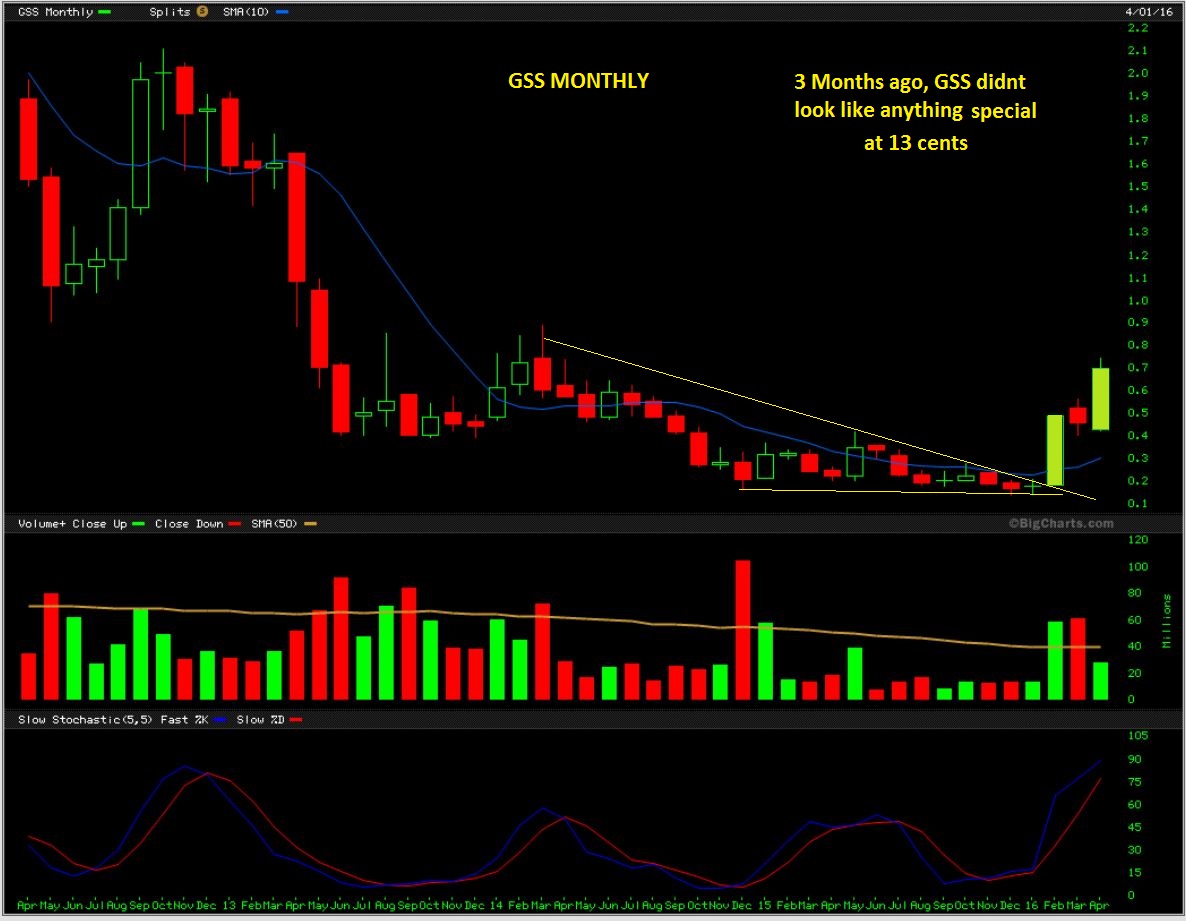
GSS Monthly is another great example- I missed this one recently. 13 cents to 74 cents.
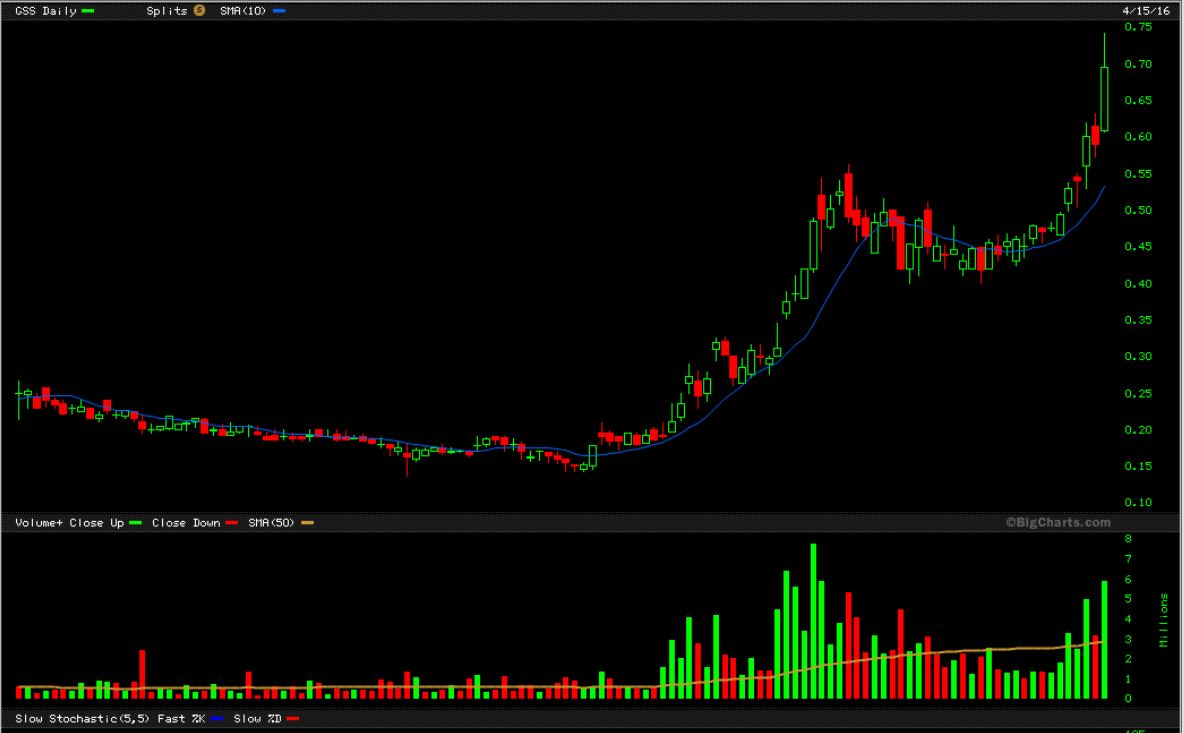
GSS DAILY – Suddenly it is acting perfectly. It breaks from a base, goes sideways, runs higher, consolidates, runs higher and forms a large cup while Gold is due for a pullback. The last 10-15 days it almost doubled 🙂
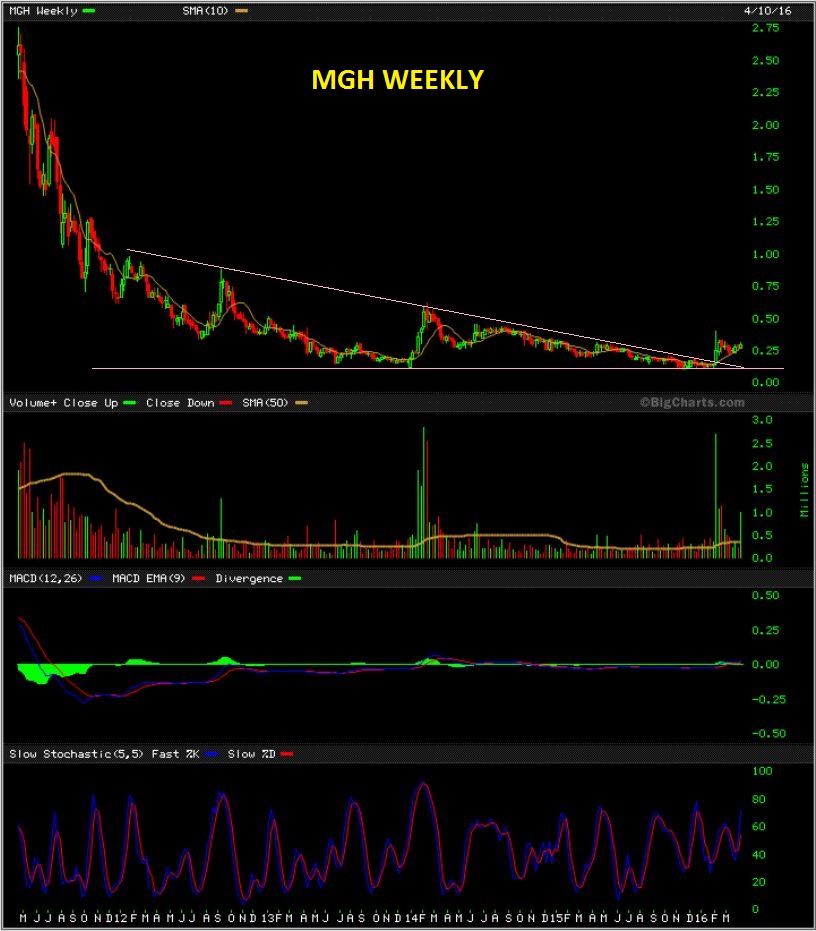
Many of these weekly charts are acting like Long bases that could become very bullish. These are low price stocks, but not Over the counter Bulletin Board stocks. See 5 year weekly charts AUMN, MGN, XRA, and MGH.
.
MGH – This is impressive and this is possibly the least impressive of the 4 mentioned above.
.
As you know, in my reports I have been focusing on long ideas in Energy & Energy stocks, Biotech is still bullish as shown in Fridays report ( many may want to use more of the ETF s to avoid risk, traders can trade stocks mentioned here), and Commodities have been acting correctly as pointed out in last weeks report. I will continue to look for low risk trade set ups and share them in the weekday reports. I do still expect a pullback in Precious Metals. I’m only personally trading the set ups that I see using Technical analysis, but I cant recommend them here, since they are not low risk and need to be babysat with a pull back due in Gold.
.
I hope all had a great weekend, and now we can see what this coming week has in store. I will discuss trades as they present themselves during the weekday reports.
.


Thanks for the great work Alex! Trying to exercise patience here but it’s a tough one…
I know Deshy –
The ones you want to pull back take off higher, and the ones expected to add to gains linger or drop. Is That the definition of patience or frustration 🙂
🙂
CF, do you think the failure of the OPEC meeting Sunday will severely hurt oil, or will it be just another temporary news hit and not really change the above view of WTIC?
It could be setting the lower trend-line of the uptrend, but it is far too early to know.
I wouldn’t expect it to be more than a knee jerk reaction. It hasn’t changed too much. It means for now things stay the same, the talks on freezing production ended. It doesn’t mean they are going to open up production to a greater degree.
Thanks for the answer…I see my holdings bouncing back already. I’m not used oil and its long cycle. Looks like some buyers took advantage of the lows to buy.
Good morning everyone! Quick FYI: A few names of interest reporting earnings this week. SWN and BAS, along with SLB, that might move energy/oil some. NEM also, so miners might also see some movement.
Thanks for the reminder. I have SWN and I think their earnings are April 21.
Thx for contributing that in advance Peter
Yeah, BAS is on Wed after the close. Meant to share some others last week and got side-tracked. again. 😛
Thanks Alex, nice work. Looks like the USD is starting a new run up. Historically is there any correlation with the energy stocks?
Hi Bill, I had a chart in last weekends report pointing it out in recent times.
April 10th?
I thought so, but maybe it was 2 weeks ago? Time flies 🙂
I just didn’t have time to look it up for you right now, I trade more in the early morning sell offs if charts set up for me.
XLE, looks inverse most of the time, but not always.
Yes, To me it was kind of depending on where it was in the cycle count.
Oil is early in its count and I do expect higher prices, despite the USD. We’ll see
Energy stocks look to be moving higher. Might even be a good day. Buying opportunity this morning.
That’s right, who else bought energy today?
Wanted to share this for gold holders: from Bloomberg April 13th:
“Deutsche Bank AG has reached settlements in lawsuits over allegations it manipulated gold and silver prices, lawyers for traders of the commodities said in court filings.”
CLF is showing off again
I can see CLF going to $4.75, but its so overbought right now, its tough to buy into here.
CPST could be breaking out of its base!
Bill…. I saw your nice comments for me, it touch my heart you were missing me.
Lately was quite busy in my clinic, and some private things were going on.
My I’m still alive and read the reports from Alex.
B.T.W. you always helped us greatly with charts and your thoughts.
Again… thanks for your ‘missing’ Geurt.
All the best Bill.
Voor uw gesondheid Geurt!
Nice to see some Dutch words Bill.
Do you speak (still) Dutch?
Dank u wel !
No Dutch, Some German. I have a Dutch friend who is trying to teach me some.
In a few reports last week, I pointed out several ENERGY stocks that doid NOT sell off when oil sold off for 9 straight days. Watch them today
ERF, SWN, SN, SM, MRO, etc
Watch how they react to Oils drop. I see a few dropped and went green so far. It may have been a buy the dip opportunity.
The weekly chart for the USD does not look bullish to me at all? Looks like it wants to go lower. IMHO
SGSVF ( SABINA) is one of the Miners that I mentioned quite a while ago that I thought was a great company, but the volume was too low for me to invest in.
Kind of regret that today : )
BUY THE DIPS, SELL THE RIPS 🙂
Got into LGCY this morning. 🙂
Sweet! I added too, but after much hesitancy. it was at $1.03 when I first saw it, jumped in after it passed $1.10.
Also grabbed ERF, since it didnt sell off when Oil did for that 9 day period.
ANd that CPST…that base was broken days ago & it looks like it has no resistance $4 and beyond ( It was a 1 for 20 split, so it really is a 10 cent stock ). I didnt buy, but I do think it will fly.
LGCY is working out nicely for us.
SZYM lining up nicely on all my time frames (D/4H/2H/1H/30m) .. will it pop?
up 7.43% today, what are you waiting for? Nice support at the 35dma
what am i waiting for?.. a break & rip above previous (recent) high @ 2.20
Sector moving higher, get on the bus
crossed wires here Bill.. im already onboard & waiting for it to take me on a trip
Got it! I thought you were looking to buy.
going back to your earlier pick…im liking the way URRE is at last shaping up…
finally got its 5th wave done (??)
… fell from 1798.80 high (in 2007) down to currently 2.12
gotta be worth a small wager
Their earnings are May 10. They have been doing a lot to restructure. Have shareholder approval to do reverse split, don’t know if they plan to do so. Just recently nailed down financing. I own some.
thx nancy..
they did a reverse split on march 8th, i think?
price plummeted briefly that day, before taking off higher
Refresh – Recommended this 1 week ago today, hit $5 today.
Also recommended and bought AA – NOT moving as well, still sideways and only about 25 cents above my buy. Reminds me of CLF & VALE riding this consolidation. 🙂
.
I have CRUDE back above $40, a gap fill and reversal back higher.
Many energy stocks will follow or have lead the recovery back up.
So early in OILS daily cycle, this was and remains a buying opportunity in my opinion.
WG for example, not green yet, but still down 10 cents. the chatr is nice .
F.W.I.W. – TCK is breaking out – it was at one time a $60+ stock.
.
I had recommended it a few times, but then I warned on APRIL 7th that this could be a H&S forming, since it had a high volume drop with it… It fooled me.
It reversed from the H&S pattern and negated it, I recanted 2 days later saying that it recovered. This stock moves nicely and looks good here ( refresh)
/.
You should go back and see what it did in 2009 recovery . $2.80 to $65 in 2 yrs!
.
TCK, omg, chart of the day.
Alex, remember when I showed you this a couple of weeks ago. You mentioned that the right shoulder will take a month to complete. A month is approaching. Does price look like it’s consolidating sideways and ready to explode higher, to resume an inverse head and shoulders? I am NOT invested in this.
Hi Rob
I do remember and I do think that time is completing the right shoulder.
If you are looking to buy you can do it a few different ways ( I do not know anything about this company and when earnings may come out, plus it looks like Biotech which do have individual risk, that having been said )…
Most technicians wait for a break out to ‘prove itself’ – You could buy a partial position to get in early and set a stop below the 50sma if you can withstand that kind of a loss. Or just wait for the break out.
The 200 and 50sma are aligned nicely and both have curled up, so it is a constructive consolidation.
Thanks, Alex! Not sure if I will buy, but just observing for now.
AT – Energy stock is trying to break out from its recent consolidation. It DID break out from a downward sloping flag type pattern today, similar to a downward sloping ‘handle’ on a cup & Handle
SHIPPERS – picking it up again…
TOO, GNK, EGLE, GSL, HERO, GLBS, FTK
Some of these charts look great. I was just looking at SALT
They do.
I have been watching many of these for weeks. I really love the 1 yr chart of Hero ( posted in a prior report as a buy , but I didnt buy it).
What happened in November to HERO?
It emerged from bankruptcy, debt was eliminated and new shares were issued.
Anybody follow me on the CPST trade? LOL, this is great.
guys, I like ECA (daily). Some calls fuel from last week. I can see $8.
look at flag on 2h.
chart
Hi Alex….
Did you saw today TGD? (Cad. TMM)
Hi Guert,
I sure did ( I still own it from a trade that I took recently). I have it as an A-B-C up on a weekly, 1st price target 41 cents.
Updated my energy charts Sunday night and went ahead and set limit buys in case they came back to the 10-SMA or 13 SMA for support. Based on the non-decision at Doha, we saw oil selling off hard over night, which was setting up an early morning buy. So, set it and forget it. Limit hit by just a few cents! Then reversed higher. Added to OAS and WPX. I love the chart of WPX and it refuses to sell down. Will try to post one tomorrow.
Wpx Energy Inc is an independent natural gas and oil exploration and production company engaged in the exploitation and development of long-life unconventional properties. Whatever that means?
The chart does look good. Morningstar rates it 3 star? I see the net income is negative, so its not making $$$