
Get Your Ducks In A Row
I cannot believe how nicely these markets are getting their ducks all lined up in a row. This report is going to be as long as a weekend report! You may even be a little surprised to see what I am about to show you…
.
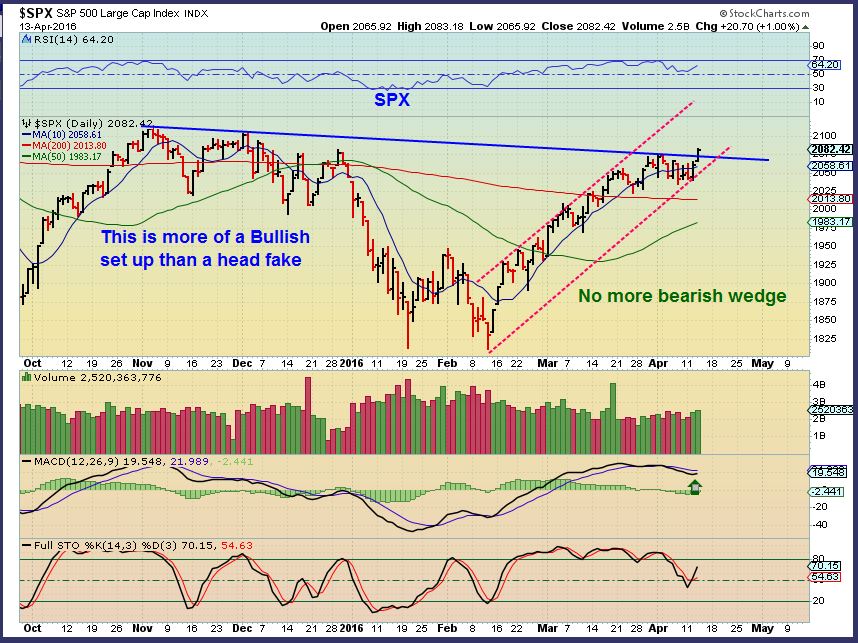
SPX – Tuesday I pointed out that the wedge had resolved itself.
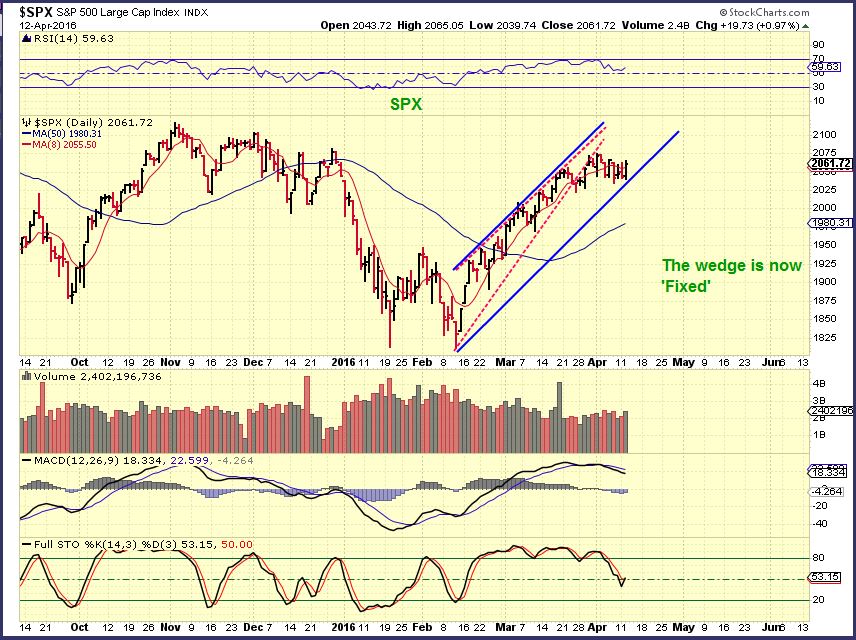
Break out
Due to the length of this report, I’m going to be brief in my explanations…
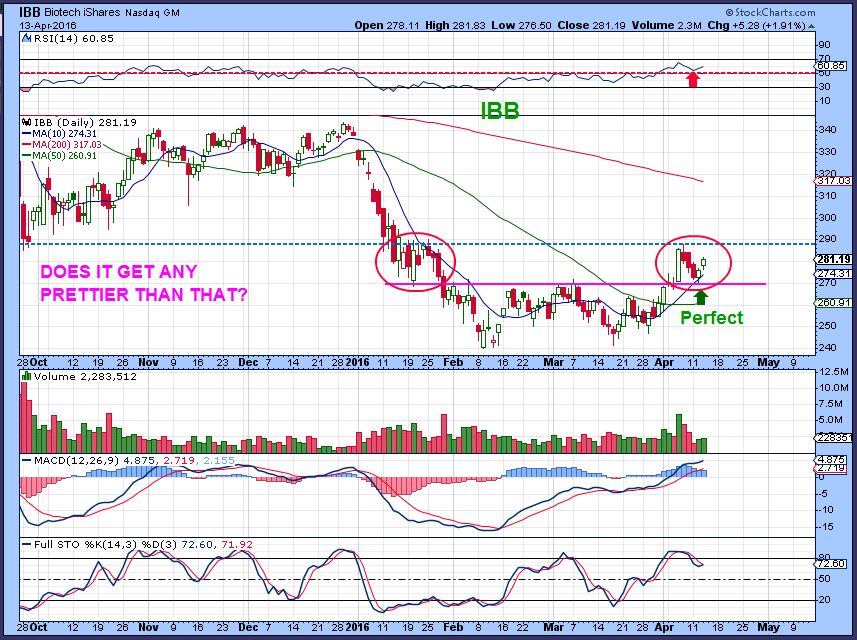
IBB- The pullback would be a buying opportunity
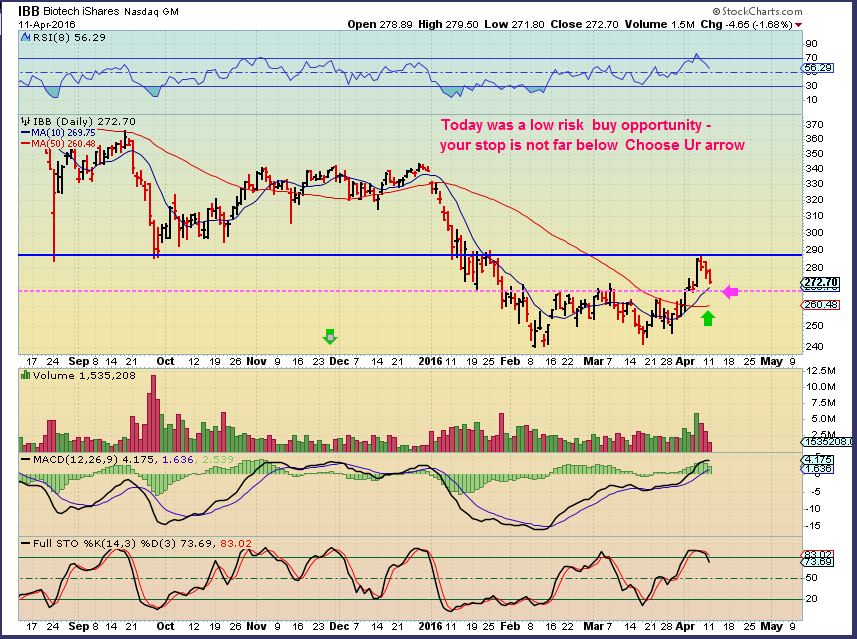
IBB – It was a buying opp, we see the reversal. Many Biotech stocks look like great set ups again.
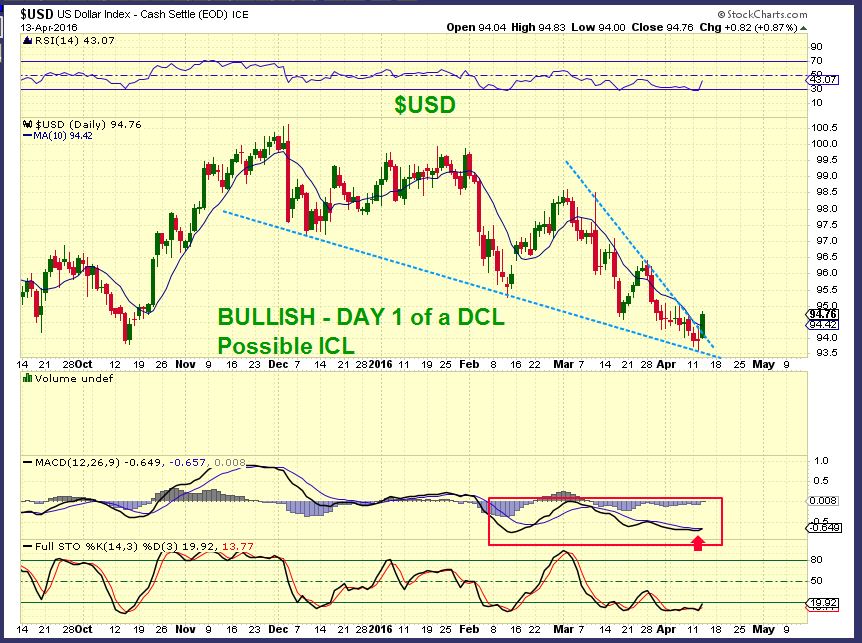
The USD – Bottomed and is likely the ICL. A bullish wedge break out means the dollar is going higher ( Gold finally drop to its ICL?).
NOW For more ducks lining up…
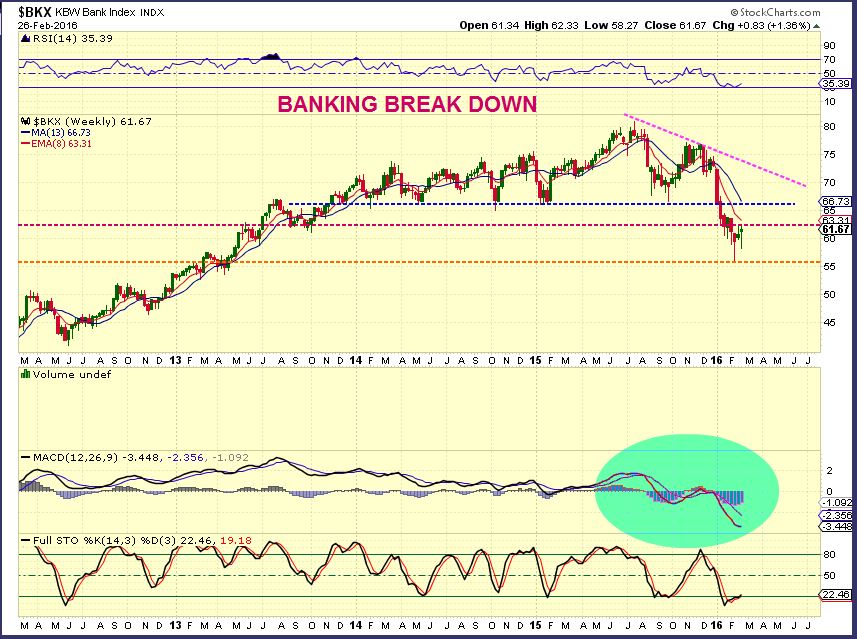
If you were a reader here, you recall me saying that the BANKS were breaking down, and that would be bad for the markets trying to recover and resume the bull Run.
.
BKX- This was my Feb 26th chart showing resistance at $62 and $66.
BKX – Breaking above $62 and $66 with conviction. This chart is bullish in many ways, but Is it real?
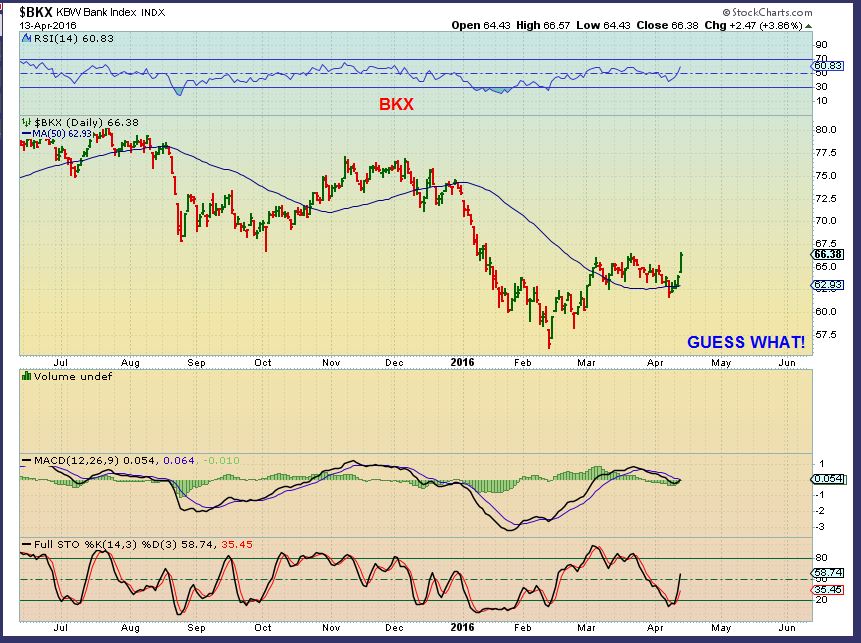
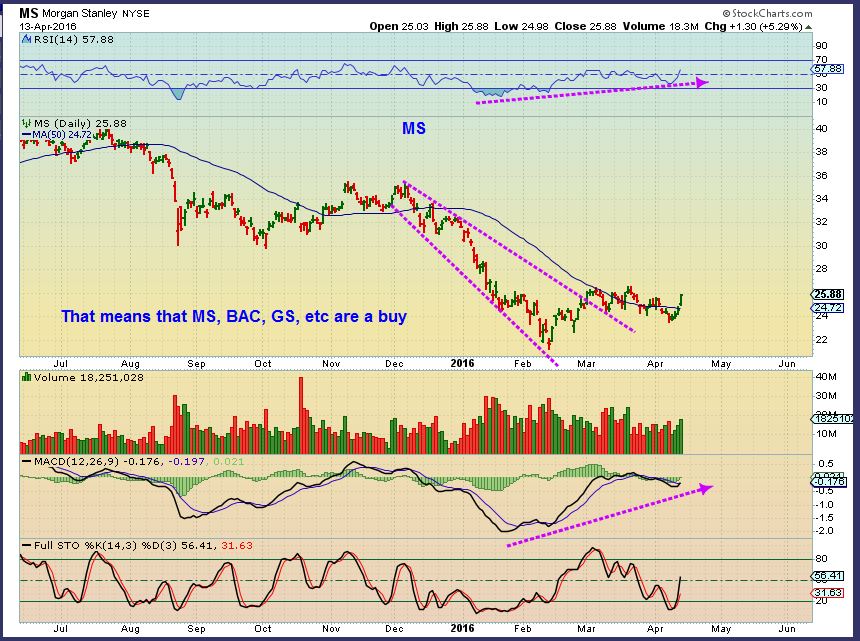
Yes, because JPM, MS, GS, BAC, etc ALL look strong and breaking higher. BANKS ARE RECOVERING.
.
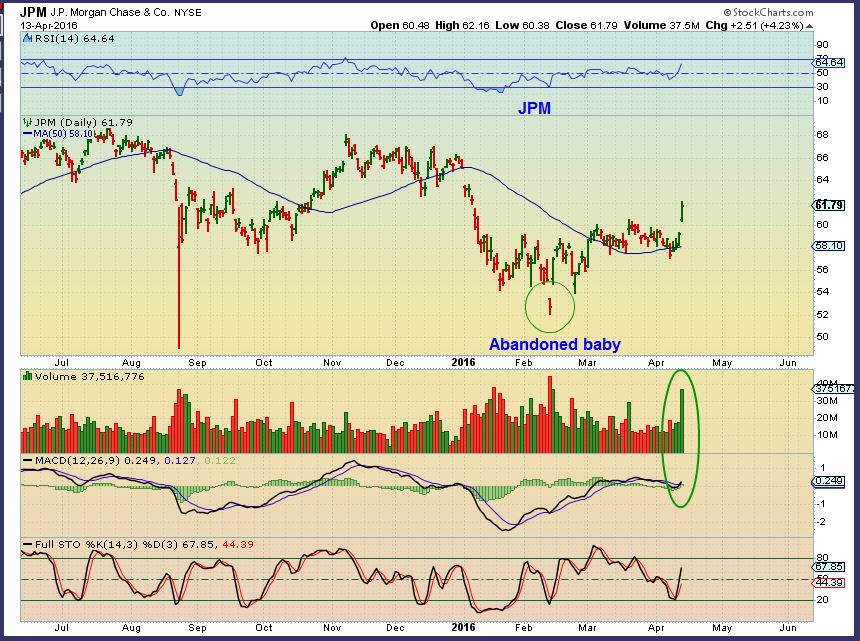
JPM – Huge volume and a very bullish chart.
Morgan Stanley – This is a Bullish chart ready to break out. These bank stocks are now another sector that looks like a Buy.
I will cover more in the weekend report, but I showed how the other weaknesses evident in the markets were a threat to the longer term Bull Mkt. Now we are seeing sector after sector recover. If you have been here since Dec, you may recall me saying that various areas like the $TRAN, $NYA, JNK, HYG, etc. had broken down severely. They are all recovering, so step by step we are seeing progress at this point.
.
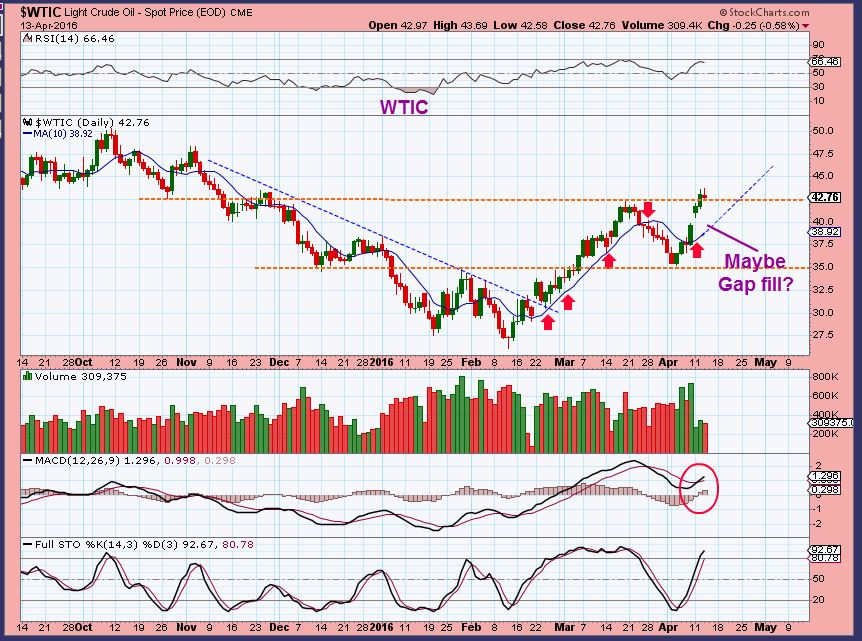
WTIC – day 6 of a new daily cycle and Energy stocks are again rocketing higher.
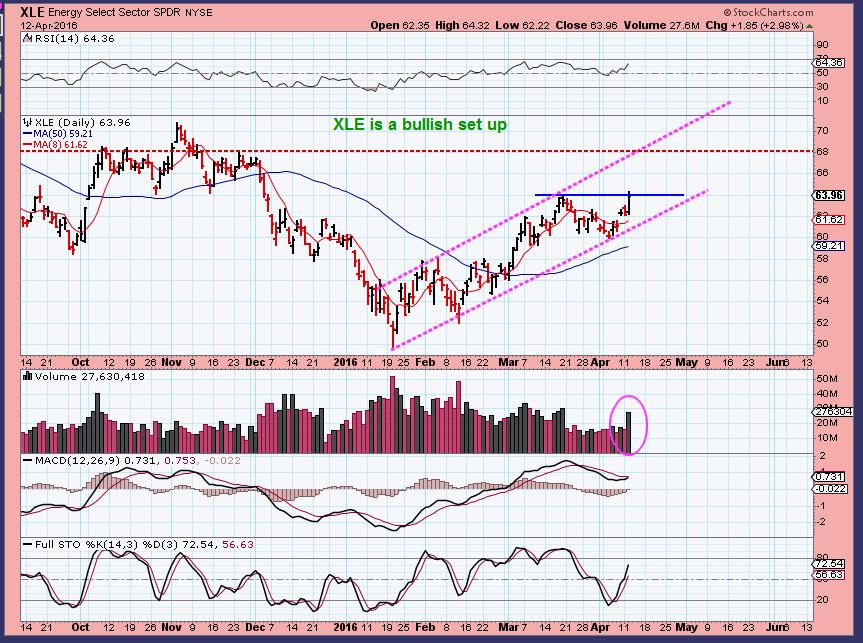
XLE – I was watching for a trendline break this weekend. Above 63 is a start. Wednesday the XLE broke over 64.
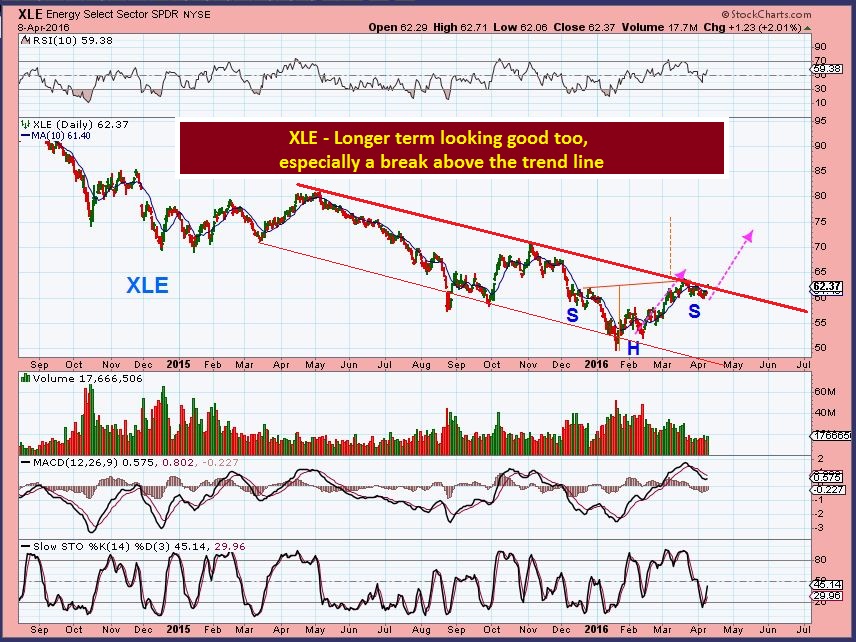
My chart from Tuesday, the XLE went a bit higher.
.
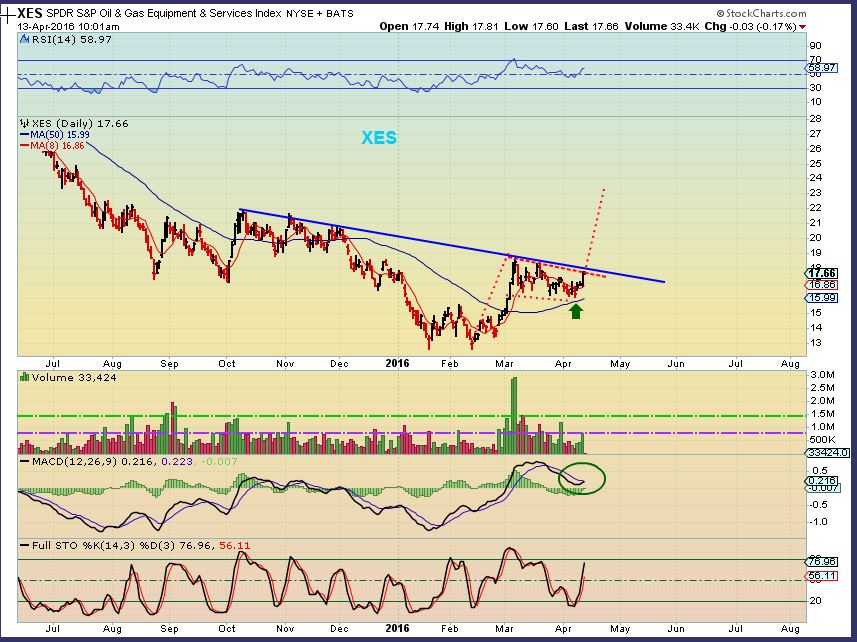
XES – Oil & Gas equipment. I was asked about the XES yesterday morning, so I drew this up at 10 a.m. It hit a high of 18.09.
 .
.
CRB – April 8 wkly
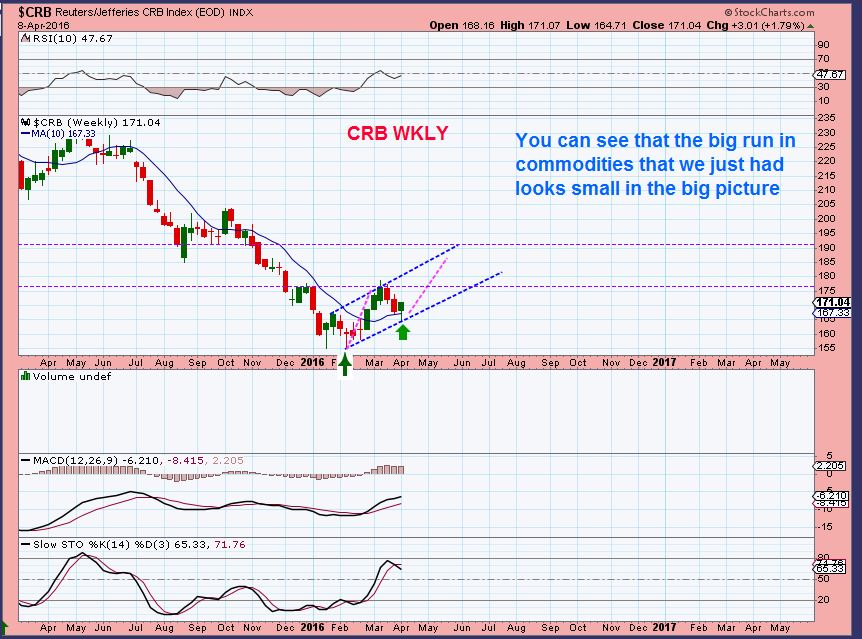
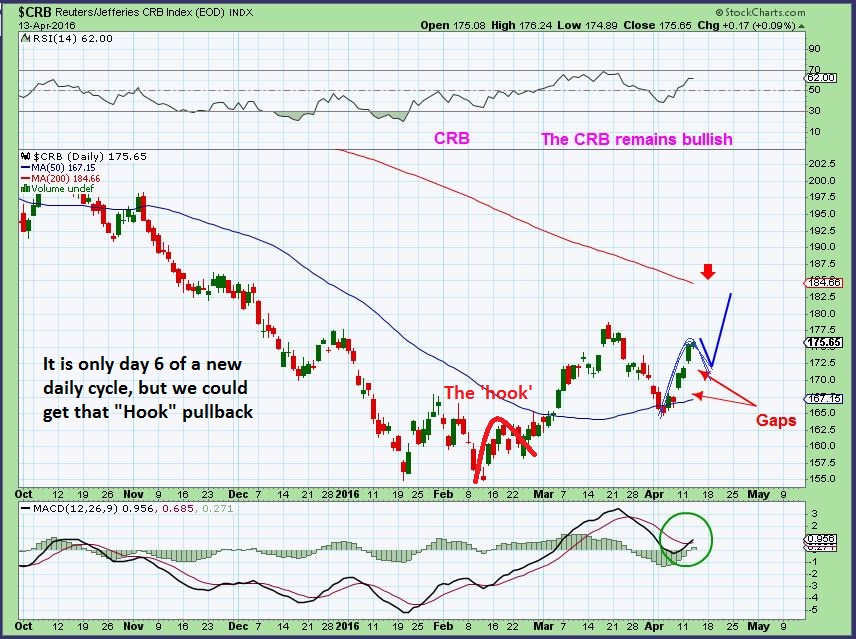
The CRB is only on day 6 of a new daily cycle. Our CLF , SID,X, AKS, FCX, , VALE, etc have rocketed in those few days. We could get a pullback and then higher price again.
.
GOLD, SILVER, MINERS CONUNDRUM
Are the Ducks lining up in a row here? Perhaps so.
.
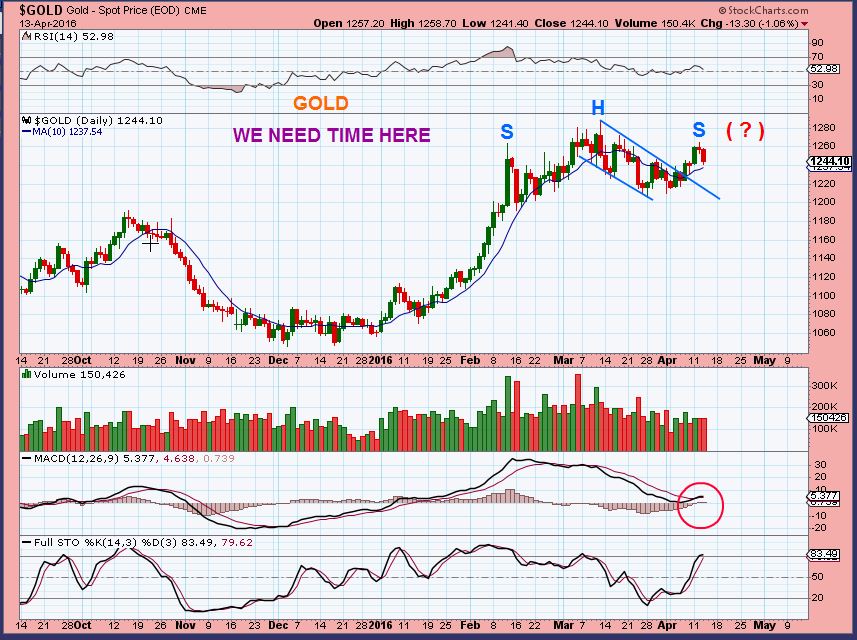
Gold – From last week (April 7) I mentioned that due to the “Timing”, Gold is getting late and could Pop & Drop into an ICL. It could just run away, since MINERS looked to be doing that, but then I mentioned that MINERS were earlier in their ‘timing’. With the USD putting in an ICL, Golds drop to an ICL may happen.
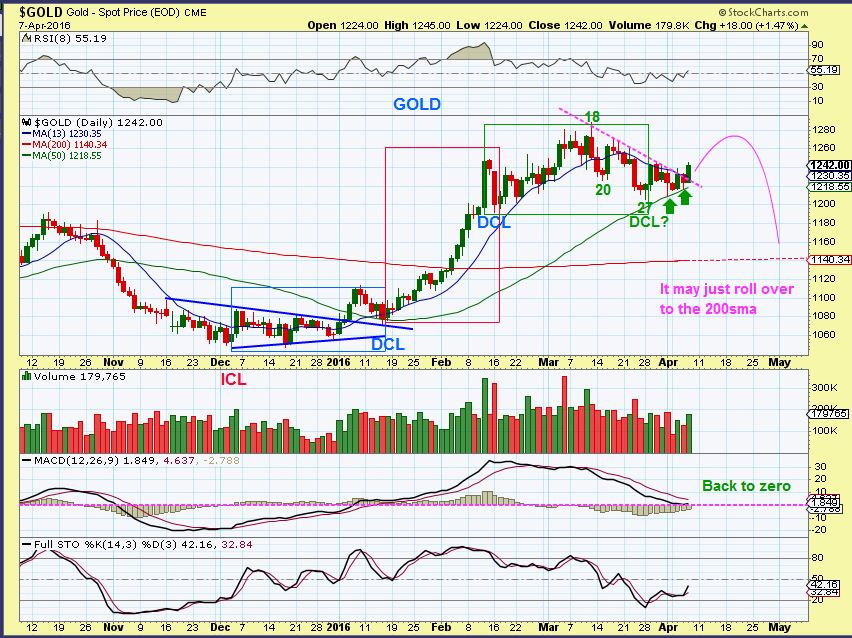
GOLD WEDNESDAY – More time needed, but the 200sma is down near $1140. Proceed with caution for now .
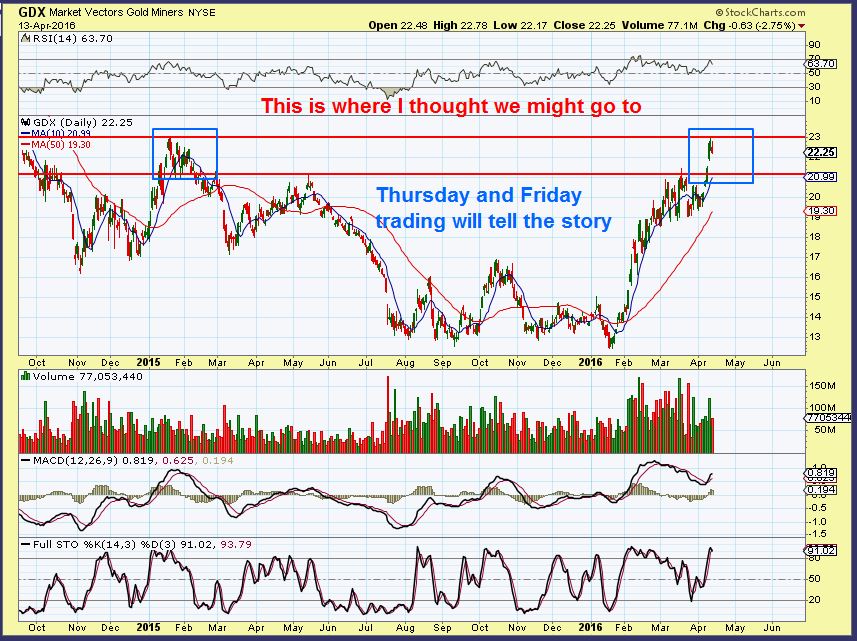
GDX – I pointed out last week with this chart that Miners were earlier in their timing ( They bottomed as shown in JANUARY, Gold bottomed DEC 3). So they could run to 23, while gold Pops or meanders.
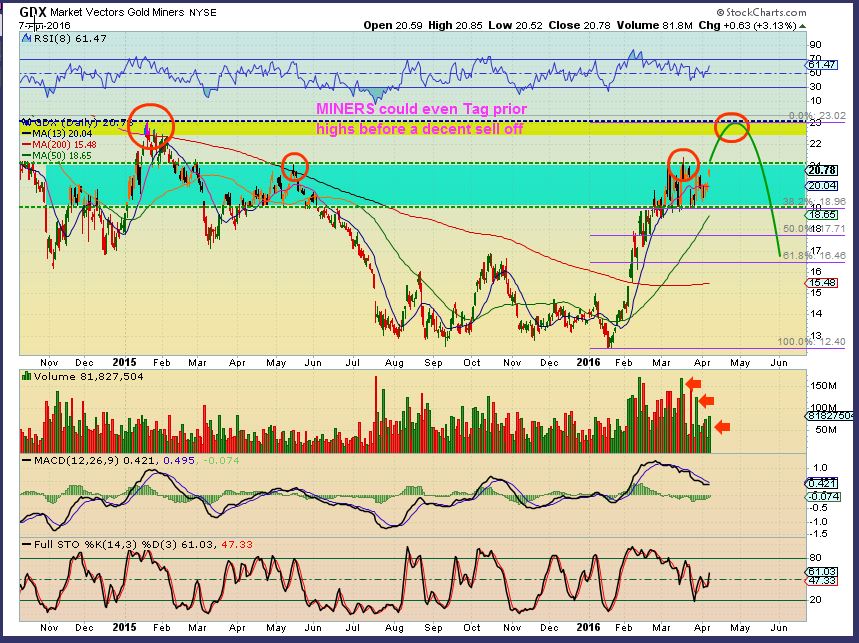
GDX – They have done just that. Is that it?
So many Miners have had EXCELLENT runs higher out of the lows. Wouldn’t we LOVE a pullback to re-enter those trades? We could be about to get a multi week pullback, but will it drop deeply or just go sideways like it has been? Time will tell, but this will be a nice buying opportunity.
.
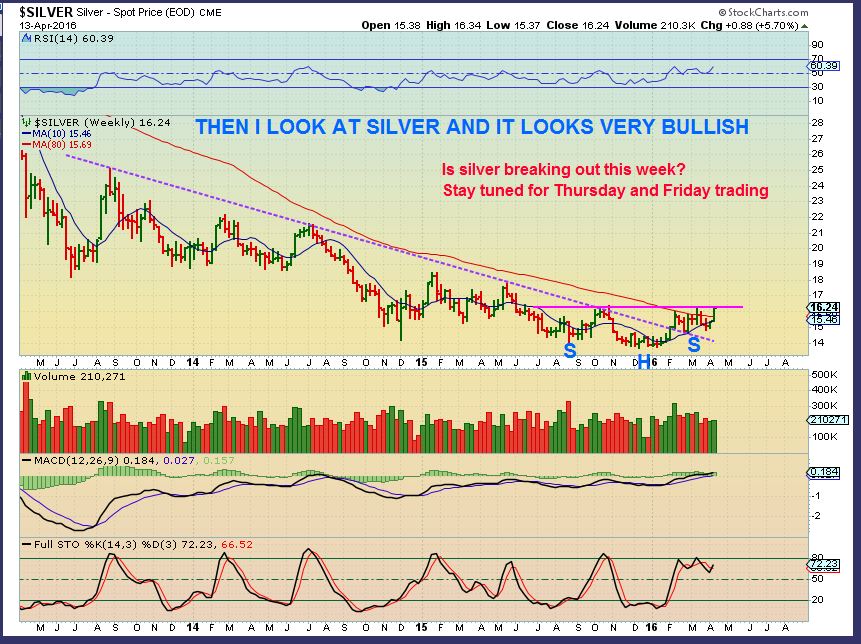
BUT THEN I LOOK AT SILVER
SILVER WKLY– This looks like it wants to break out from a strong base. Silver stocks didnt wait around, they ran very strongly. Take a look at AG or CDE if you need proof! So will silver break out while Gold pulls back? Will Miners pull back if Silver breaks out? Conundrum. My guess is that Silver continues sideways for 2 more weeks. (Or a break and back test?).
.
SO it seems like ALL of the Ducks are lining up in a row. I will cover this in the weekend report, but it looks like 2016 is going to continue to be a GREAT year of trading, with so many sectors participating.
.
At this point, let me take some time to review a few things and then end this report. That will leave us with Thursday and friday to watch how the above areas continue to unfold. The next 2 days will be important for that break out in the SPX, NASDAQ, DOW, and how the TRANNIES, BANKS, etc continue on. Also important is what the ENERGY, CRB, and Precious Metals and Miners sectors do Thursday & Friday.
POSSIBILITIES-
.
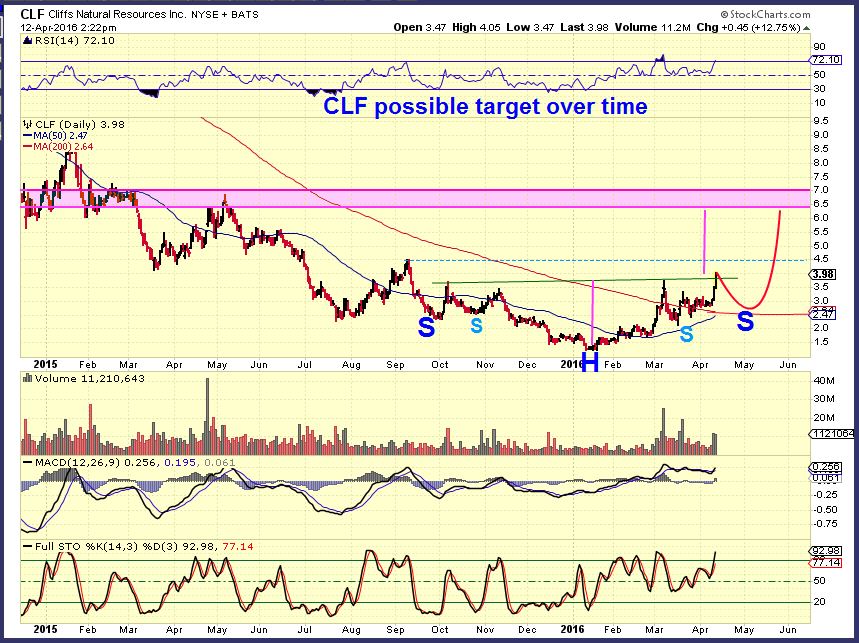
CLF – So we obviously have a strong move and this was as of April 12. I had it for yesterdays report, but yesterdays report I had to spend a lot of time answering questions on ‘SELLING’, so this move in CLF is actually at the blue dotted line now. IF we get that ‘Hook’ move in the CRB, this could pullback , but only being Day 6 on Commodities, I think that it can run to the $6 ish area.
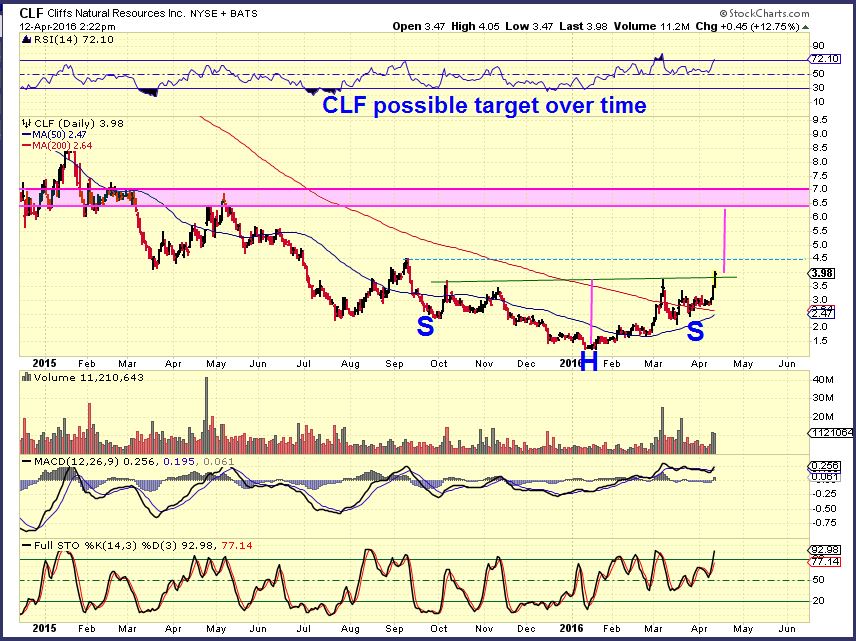
Then I drew a possible pull back to tag the 200sma, but this was less likely. If we get that Hook move, maybe the break out yesterday tags or back tests that Green neck line shown here.
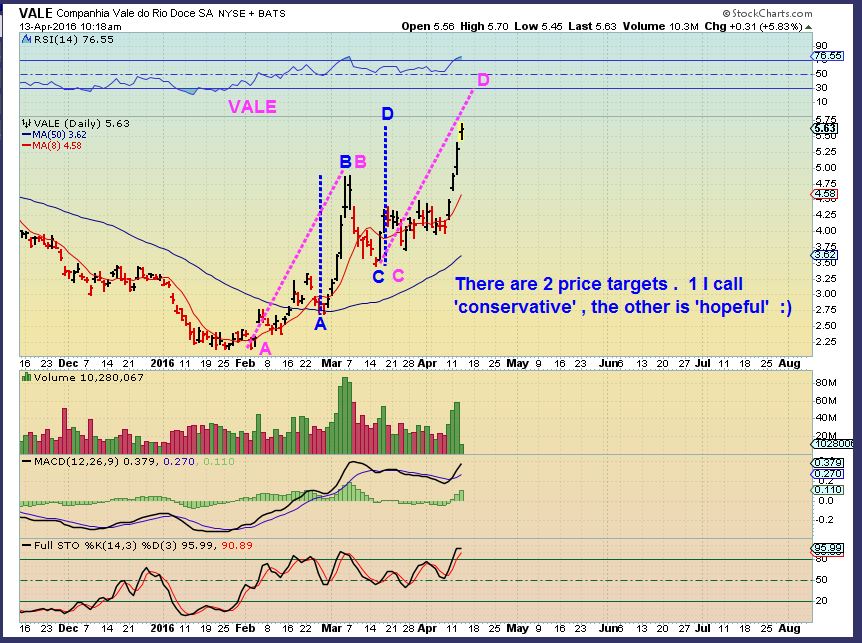
VALE – I posted this yesterday after 10 a.m. in the comments section to show 2 price projections. A conservative one takes ‘A‘ from the straight up move in February. A stronger one takes ‘A‘ from the entire move. One leads to yesterdays highs, the other over $6. Both are valid .
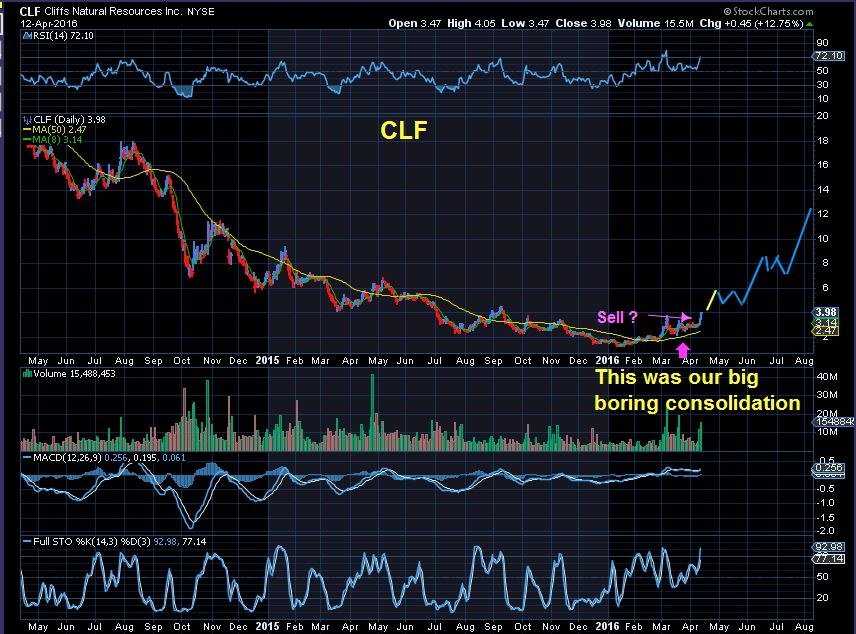
As I showed yesterday- THESE are actually looking like longer term BUY & HOLD possibilities too. One day, I think that we will look back and we will not believe that CLF was above $1, and we were nervous when it dipped from $4 to $3.50!! 🙂 CLF was $100 in 2011, and that was after three 2:1 splits!!
.
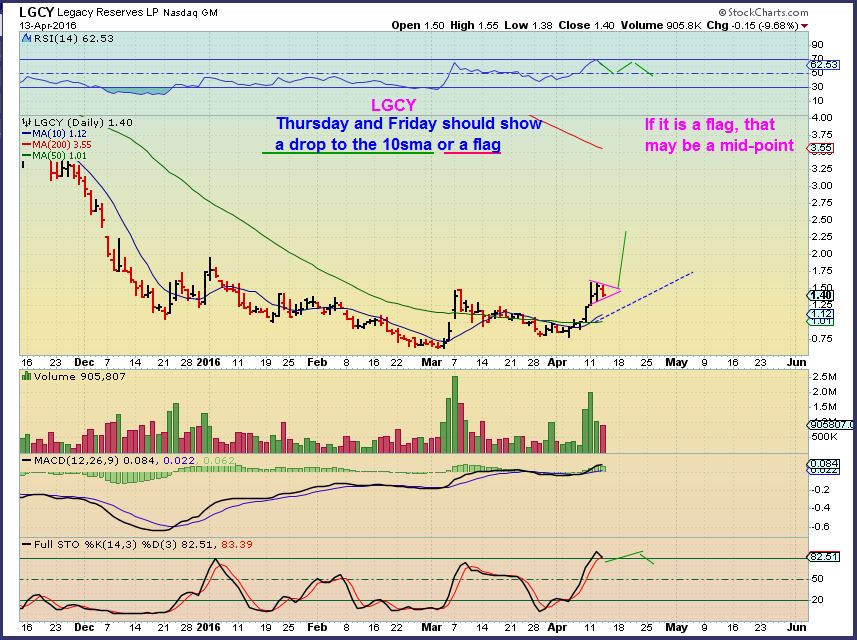
LGCY – Energy stocks rocketed higher this week too, and some pulled back Wednesday. So looking at LGCY and a few others, , it may drop to the 10sma after such an explosive move, OR, it may just be a bull flag before an even more explosive move. Thursday and Friday trading will reveal that.
.
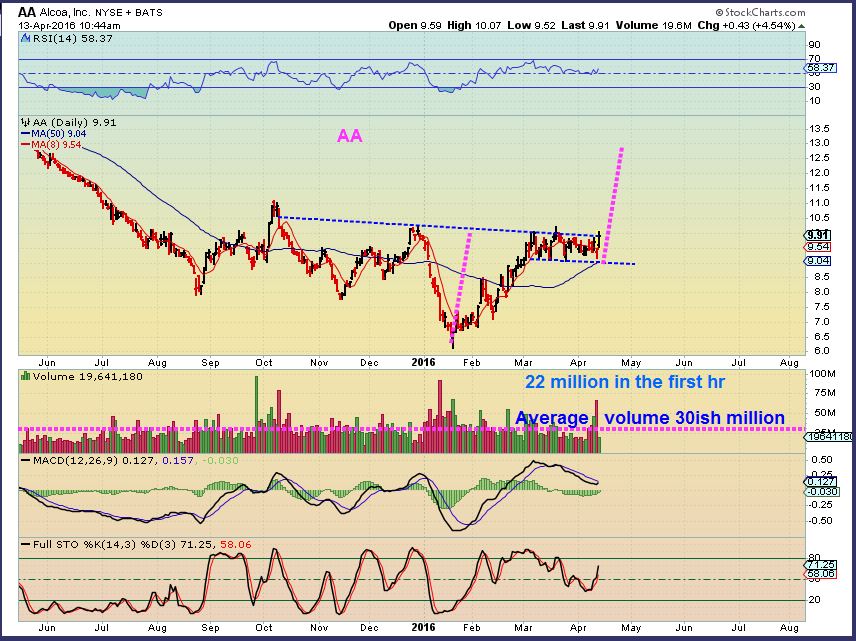
AA – Earnings came out and AA dropped quickly, then recovered yesterday.Day 6 of the CRBs daily cycle may see this break out. Volume was swelling on the buying side yesterday. Large Inverse H&S?
 .
.
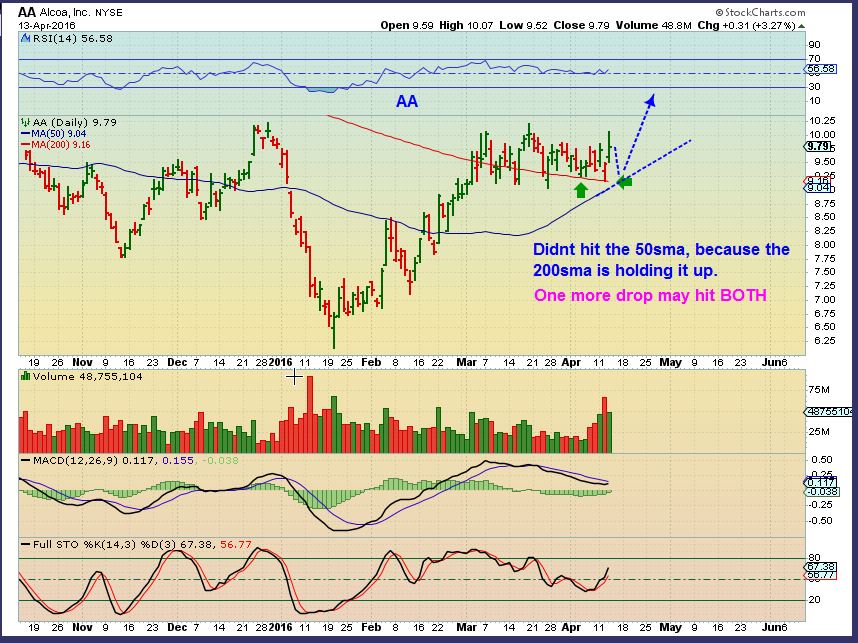
SO a ‘fake out drop’ at earnings? A run higher? I entered AA at the close yesterday with a partial position. I MAY BE EARLY if this consolidation continues, so I will add on a dip.
I looked at this mid day and thought, ” It held at the 200sma, but never quite tagged the 50sma yet and may do so on another dip. I will start a position and add on the 50sma or on a break out higher to complete my position.”
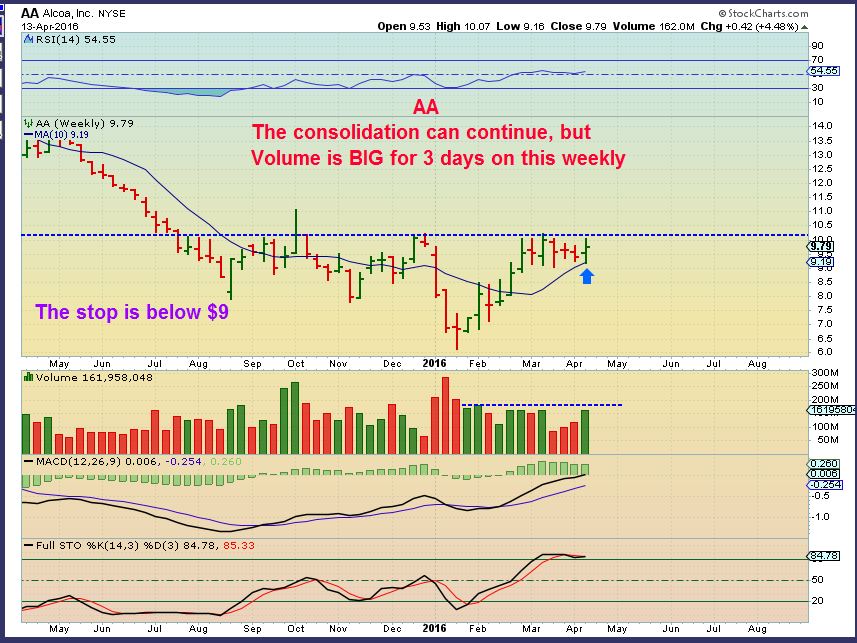
AA WLY – This could go sideways, most traders wait for the break out to buy. Put this on your watch-list? Or just Buy with a stop like I have, but if the consolidation continues, it could get boring.
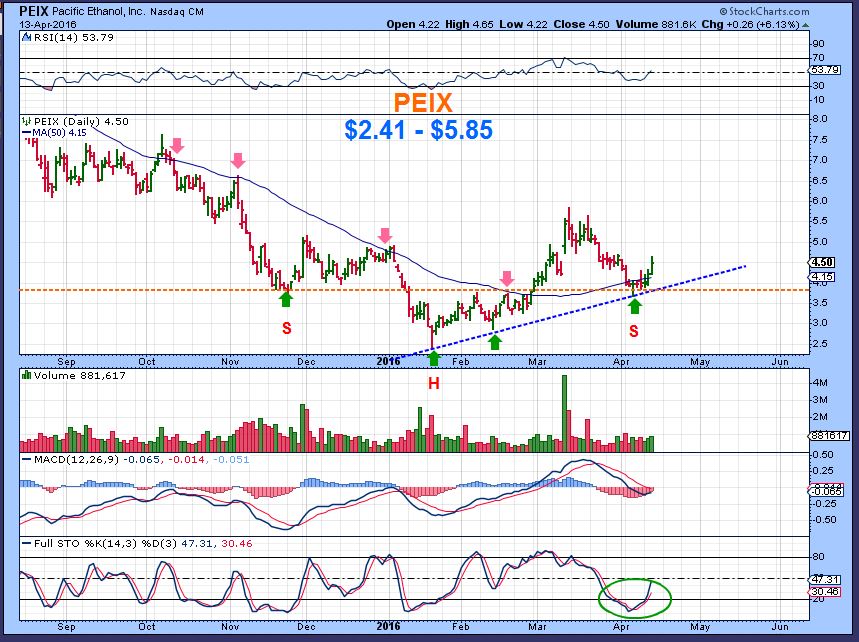
PEIX – This is starting to act correctly again (energy). It could be bought here with a stop below recent support. A move higher also breaks a downtrend line (not shown) and that could be bought.
.
You may recall that I mentioned a while back that I used to trade JOY ( JOYG at the time) and BOOM in the past. They were well known stocks . I posted the chart below showing that they also looked to be setting up bullishly.
.
MATERIALS – JOY & BOOM
JOY WKLY MARCH 28 – BREAKING OUT ON A WKLY, $10 to almost $20, then back to $15.
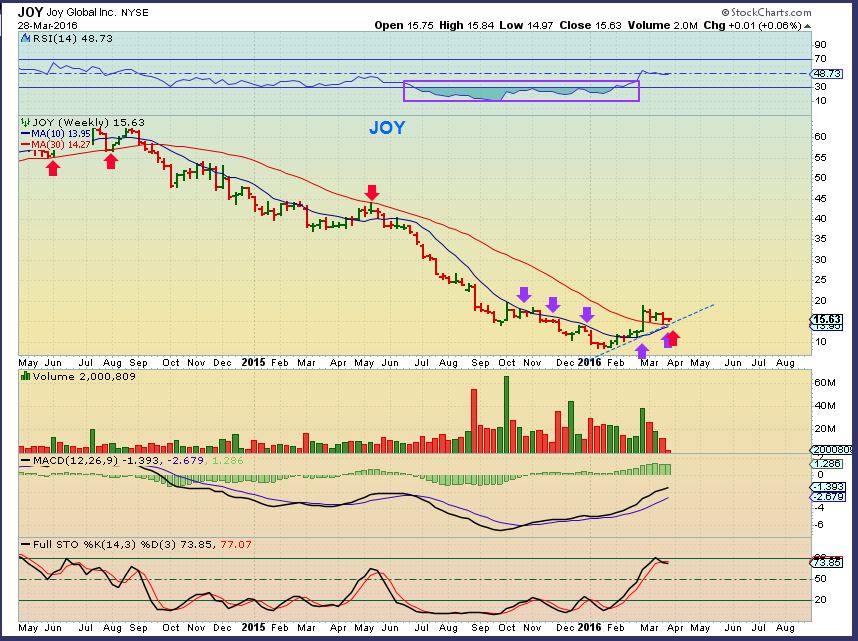
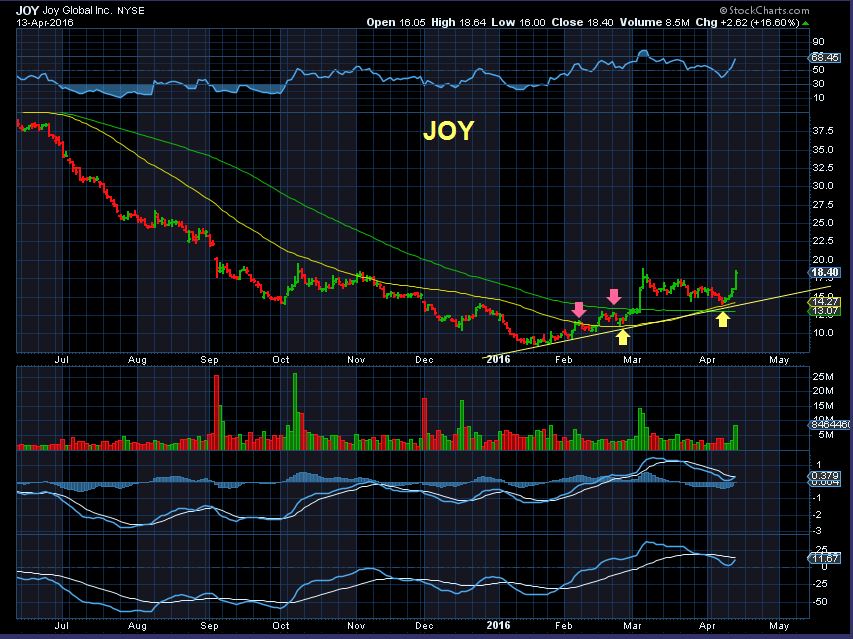
It continues to POP – I missed that Buy at $15, but it is now a large inverse H&S base. This should go on a watch list, this looks to also be recovering. JOY was $100 in 2011 , and that was also after a couple of splits ( not reverse splits).
.
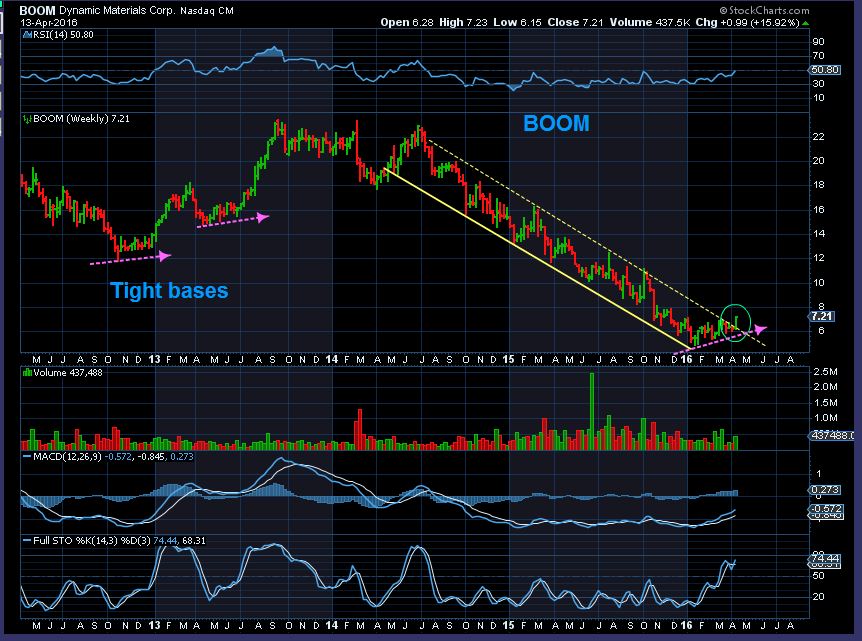
BOOM– My 2 march 17 charts, setting up bullishly at the bottom.
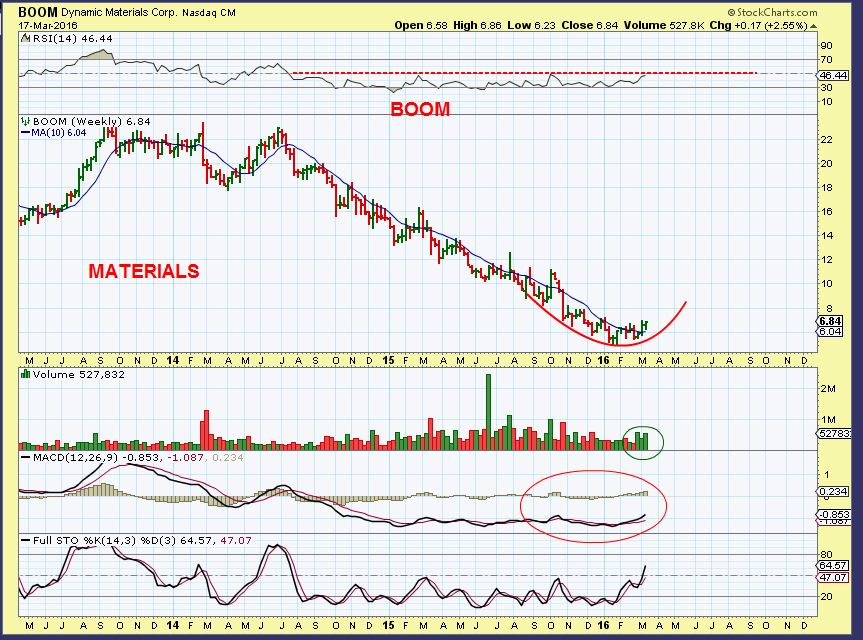
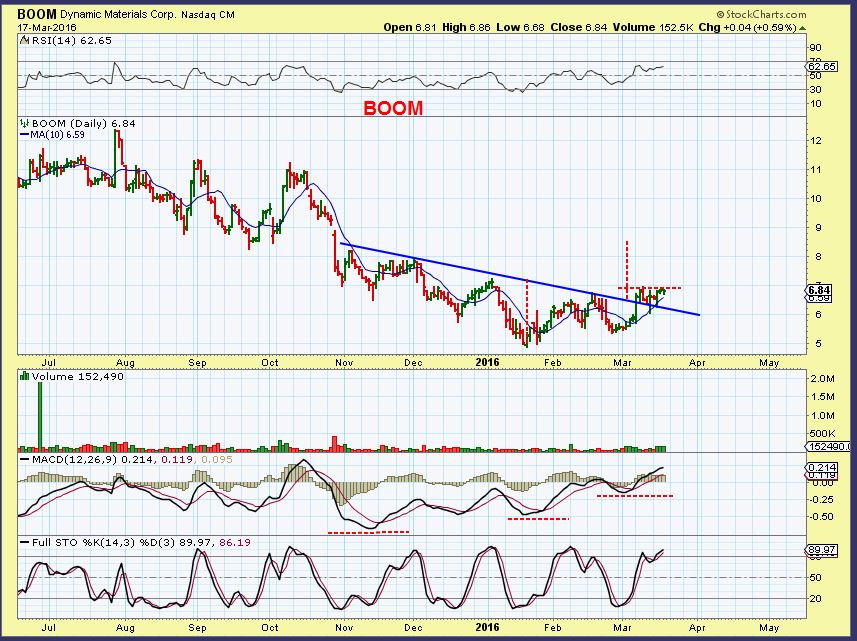
Wednesday BOOM popped 15%, breaking out of a long term down trend & tight base. So there are signs of life all over the commodity sector.
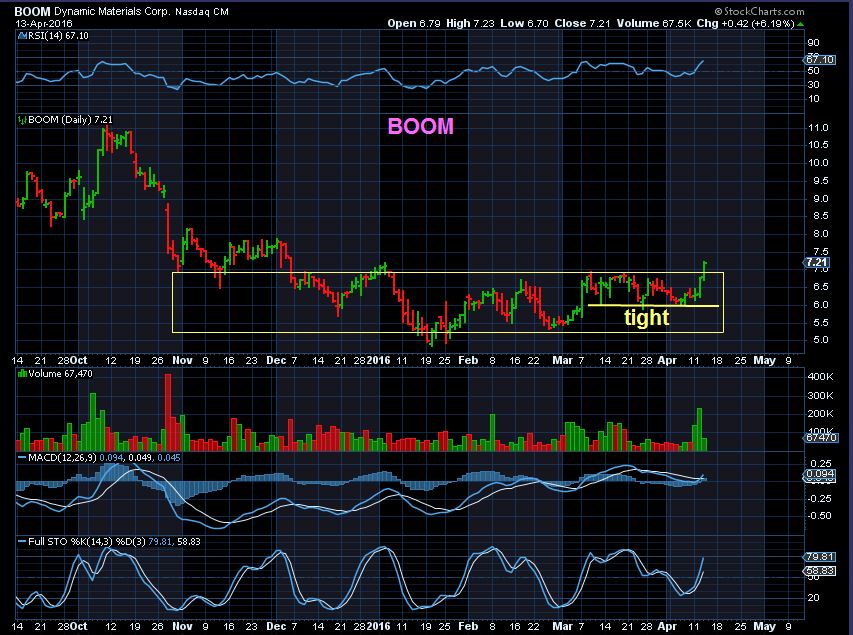
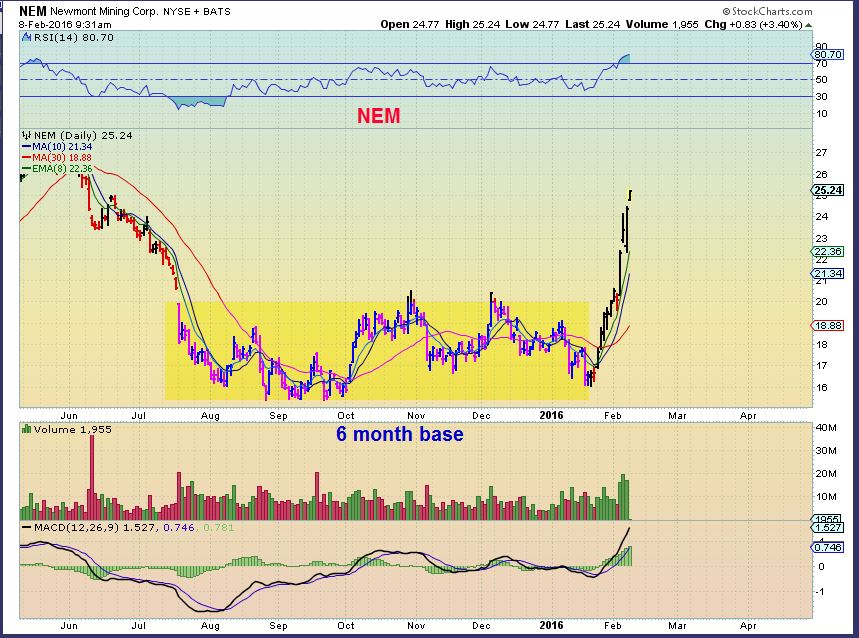
BOOM CLOSE UP – Yesterday was a break from the base. I love these bases when they finally break out, we can start getting recovery moves longer term. You know how ABX, NEM shot out of their bases once they got going ( see below) .
NEM base example: It ran to 431 eventually.
.
So the markets are threatening to break out to new highs. Do I see good set ups after the recent sell off / correction from Jan to March? Yes, I see some great set ups in stocks that remain in an uptrend , and I see bases from HUGE sell offs starting to really look like they could provide strong gains going forward. Lets look at 3 examples of once loved companies stocks ( There are many) that got crushed in…
TECH –
.
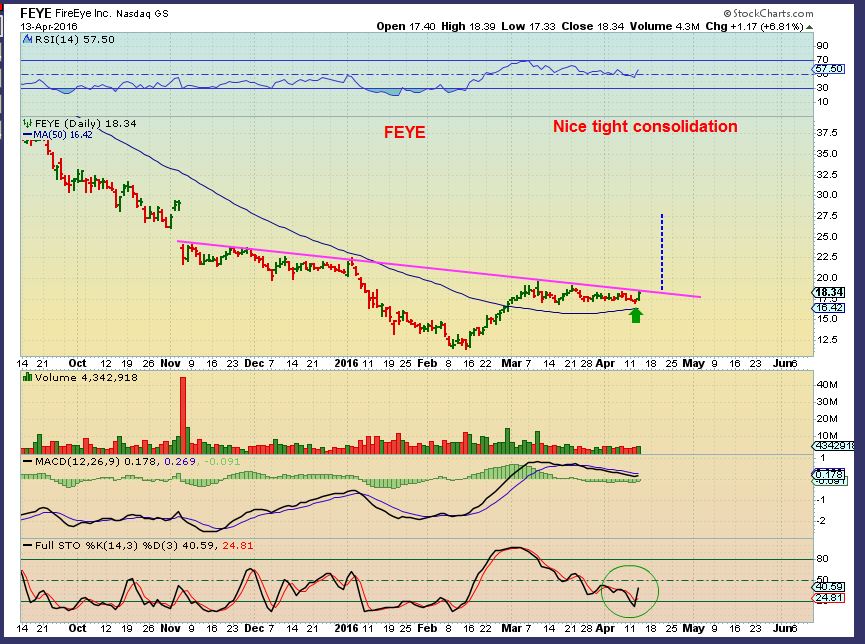
FEYE – Wow $55 to $12, then back to $20 and a tight sideways base above the 50sma. Tag the 50 in more sideways or break out? Either could be a buy if the markets remain healthy.
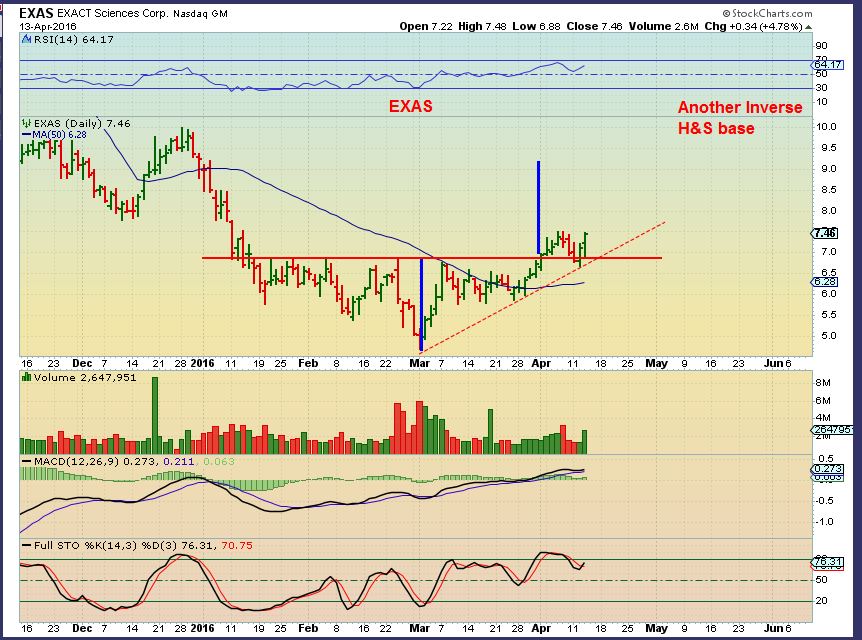
EXAS – Inverse H&S break out. This is a buy for traders.
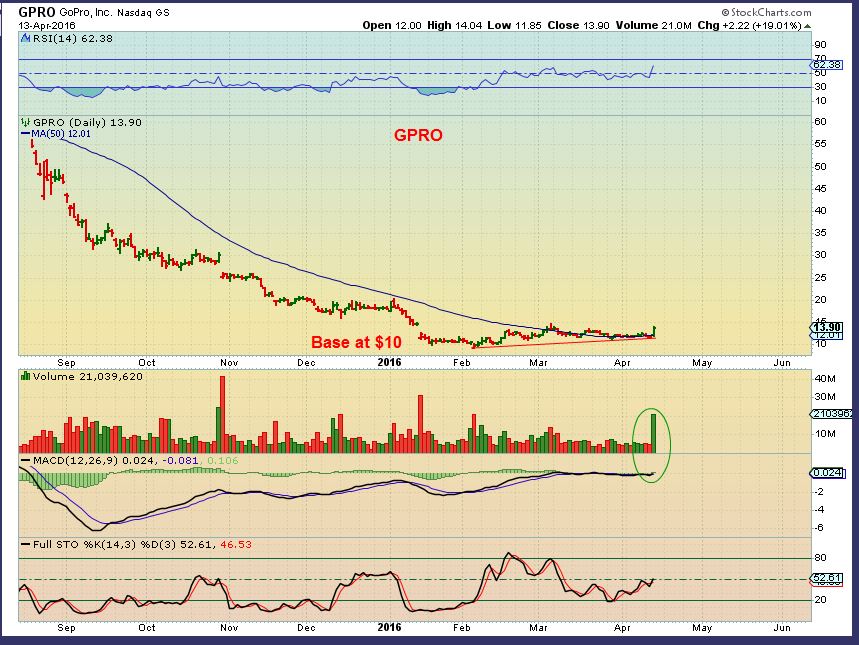
GRPN – Much loved, then hated. 20% POP yesterday in a very tight long base above the 50sma.
So you can see that there looks to be many ducks all lining up in a row, and many trade opportunities seem to be presenting themselves in sector after sector. I will cover this more in the weekend report late Sunday or early Monday morning. For now, I think this lengthy report covers trading today and unless there is some huge change, this covers Friday too. I may or may not put out a small report tomorrow morning, it depends on if I see any really good chart set ups.
.
Thanks for being here!
.
~ALEX
.
TRADERS & CHART LOVERS MAY FIND THESE CHARTS INTERESTING looking for set ups, pullbacks, etc –
Shippers – NM, DRYS, DSX, FTK, TNK, etc .
BIOTECH – IDRA, MDGN, ZIOP, ETC.
TECH – TWTR, FEYE, CY, LSCC, ETC.
ENERGY – GLF, LGCY, OAS, HK, BAS, PEIX, DQ, AXAS? WTI, NOG, LPI, , MANY MANY more
.
COMMODITY – FCX, TCK, AA, CENX, Etc .
.
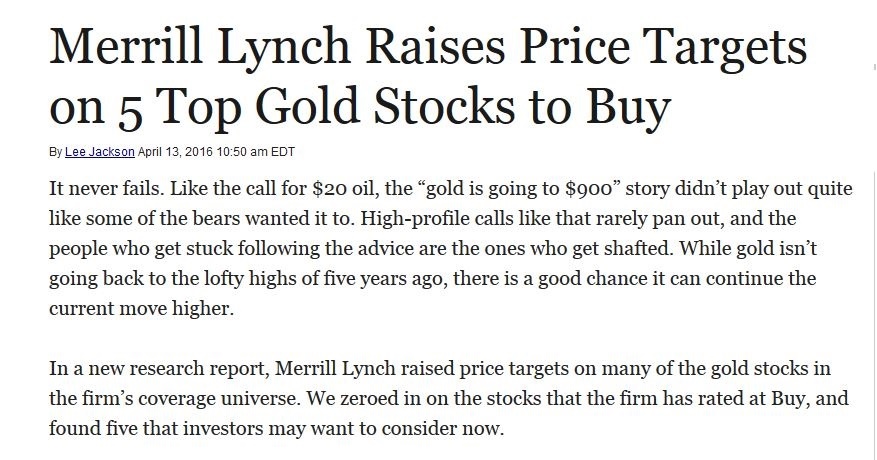
CLASSIC – Recently Many banks and wealth management divisions ( Merrill Lynch is one of Bank of Americas) were calling for $800- $900 Gold and “SELL” Miners RIGHT AT THE LOWS.
I thought that the clip below was a interesting. They upgraded GG, AEM, etc, after the run higher, So it MUST be time for a pullback now 
.


Nice, it’s like two weekend reports on 1 week! I bought the IBB reversal, let’s see that stick (I was a tad early), still with energy and 1/2 CLF and VALE, now also AA. I noticed FEYE yesterday, thanks for going into tech as well, might be worth checking out HACK (FEYE is a member of that ETF), but I have charted it yet today. GL all.
Thx for another great report! Maybe everyone else knew this all ready but the opening of EXXI today (down 75%) suggest caution for “BUY and HOLD” in energy just yet. I suspect there’s more to come out of the woodwork over the next several weeks/months (I think you all ready mentioned this in one of the reports)?
Hi Deshy,
Yes, that is exactly why I said that we should own a basket. EXXI had a bankruptcy announcement, and they are not the only ones, wont be the last.
It is good to dig into the fundamentals of the recent earnings on any that one plans on holding for a while
( Where is ken : ) – He has mentioned that he doesnt like the debt burden in some Energy and it is true. When OIL was high price, some Oil companies took out huge loans for growth, more rigs, more this and that- then the crash in price left them in debt. An OIL price recovery will help some companies, but for right now it is tough times for some. )
Thanks for that report…a real learning experience, hand holding, and good care for your people…thanks CF!
Thanks Nancy – I thought you’d be sleeping after that late Kobe Game ; – )
Great report Alex, especially appreciate your thoughts on CLF and VALE. I missed the runup on CLF and hope for a chance to buy some on a dip. Sold my VALE yesterday too and would also like to buy more on a (hopeful) dip.
Thanks CS , I would love & hate a dip : )
I did sell 1/2 yesterday , and looking at CENX and AA – they have had a nice pullback / consolidation and may be next.
Then I could take those gains and buy a dip on CLF & VALE – like a juggler 🙂
Getting in a quicky before the day gets crazy……BAC reports ER tomorrow before the bell
I think it was this morning C.
BAC has 40 million in the first 1/2 hr and is breaking out.
Banks are back.
yes you are right. Bank stocks are showing little life.
Really ducks in a row… unable to choose where to invest…
just waiting for miner’s pullback
That is smart- I think Miners will give you a good run up again, once they settle back down.
Oops, thought today was Wed:) i bought BAC and BCS back on 3/18 (posted the trade here) — held through the dip and meant to keep track of ER (Vale,
CLF, and CHK had me totally distracted)
Embarrassed to say but bought and held by using chart and gut instincts.. Not sure if that is an appropriate way to trade 🙂
just in BAC @13.77 looking for better opening tomorrow.
DDD again
Got upgraded at UBS I think. Price tgt $26
Alex, take a look at CPST, Big base on that one, looks to be breaking out, volume going up. They make turbines for the energy sector
I am familiar with capstone, and I wish I saw that in the base. That chart looks great, the base is excellent, but I cant tell what the best way to enter it would be. On a 1 month it has run up too much . I’d need a pullback, and dont know if they will get one.
AA is working out – sold all the rest of my Vale for a pullback
SOMEONE came on here and told us that they took a SUNE trade . They wanted 22 cents to 40 cents pop I think,
SUNE just hit 70 cents.
Very Risky. Like buying EXXI
there goes that CPST and the volume is huge!
Not holding up?
Anyone for coal? 😛
What do you guys think of this chart?
ticker?
Omitted on purpose! What do you think of the chart? Refresh
If it’s not JDST or DUST, it looks exactly like it!!! Looks bullish if you ask me. It actually looks a lot like JNUG right before it took off.
Looks good doesn’t it!
Anyone with physical gold or silver might want to throw some numbers around and maybe hedge some with these.
It’s DUST. But one thing we forget with volume, it was $20 during the lower volume and now $2 so the same amount of $$ spent is 10x the volume. These decay so fast some forget that part on the volume. Man, JDST and DUST will both have to split, doesn’t matter if miners pull back or not.
Have you seen SXE?
WAs 0.60 3 weeks ago.
Today 2.23. Almost 400%
Because I sold it! You are welcome
I sold it too, small profit.
I like the way CLF is holding up today , but I think that VALE & SID have a date with their gaps .
Mentioned below that I sold all of my Vale near the open ,and bought AA yesterday. Still have 1/2 my CLF.
Interesting thought on VALE Alex. I’m thinking that the 10 Day SMA might be an interesting area to start rebuilding my position in VALE.
Yes, maybe. There is a gap down at $3.50 and the 10sma is in that area
I was thinking the same after charting tonight. Thanks for sharing. I still have a 1/2 position.
BBEP.. think it died
Bad news about its financing …I sold out pre-market at a little loss. POO. I had already played that one once for a win fortunately.
Yeah there are in trouble. I’ve quit trading under $1 energy. I had traded SFY and GDP last year. Oops! Can’t barely get a nickel for them now. Even with oil up some, some of debt no honest man can pay.
Alex, does natty still look good to you? (UNG?) I made the mistake of looking at too many comments on ST- which is messin’ with my mind. I looked at your chart two days ago – but I only have access to a phone so I can’t zoom in and get a good read.
Sorry Crystal, I had walked away for the day.
NATTY still looks ok to me, even though it is down. Its above the 50sma and is in a sideways consolidation at this point.
Energy Sector down Today?
He’s either napping or out cavorting with Maria…
we need one of those batman searchlights to shine into the sky
Because I don’t have anything better to do since waiting for energy to go up…..:)
LOL… ha ha
your young padawan is progressing.. the apprentice will one day become the master
Lol…just what we need..more marias!!!
hahahahaha!
You know, OIL isn’t really getting hit hard, neither is the stock market. I’m a little surprised to see all the energy stocks tanking.
yeah .. i got spanked today..
(energy was bad too)
Maybe this? Where IS Maria?????……
HA HA HA… ohhhh myyyyy gawwwddddd ….
*oooo .. I like it ;o)
😉
.. and Crystal, since you werent around here last time i posted this…
its overdue an appearance
REFRESH!
Hinies!
Or this……
whats he reading?.. my eyesight is going to crap
50 Shades of Grey
lol.. Alex mustve actually posed for that pic then?
I wonder if his little bat ears are burning ….
.orrr ..errr ummm.. never mind…
C’mon Maria,, “what happens in Vegas..er, CF…….” 😉
Giggle…. the beast lives in all of us… hahahah
What a crazy thread this turned out to be! LOL!
LOL!!! I’ve been around people who put their hands down their pants all day!
wait.. What?
and pick their nose and fight and cry. I teach little ones 🙂
little blighters…
can’t smack them into line these days either.. not like we used to get.. didnt do me any harm..(apart from posting catwoman spank pics on chartfreak .com)
I have a feeling we are going to smacked back into line today too….:) naughty, naughty
Wait…wait… u hangout with chartfreak?
He he he
Does he walk around with his pants around his ankles for 5 minutes after he goes pee-pee too?
giggle … hmm .. I actually have often wondered that myself over these past few years……
lol.. i almost used the Maria-to-Bill punchline… ‘you got a webcam in my office?’.. but i have more self-respect than that 😀
HA!!!!
Not sure what to make of natty?
i bought UNG yesterday.. but lightened up at close today, fearing a gap down tomorrow.
thought we were all clear to go, but doesnt look like its out of the woods yet
In the same boat..sort of… It’s one of my losing trades I’m trying to average down on…..
Decided to buy at the end today. And have a stop loss in place.
you probably bought mine then.. glad to have been of assistance.
no doubt my selling will cause a gap up
REFRESH – This is how I see it.
It is still o.k., but showing caution is fine whenever the 50sma is still pointing downward.
,
volume was a tad heavy too.
.
Thanks!
Its all the bankruptcies. EXXI and BTU. Gone. Did you see BBEP, done 30% in sympathy. I know that yesterday was a great day and oil still looks good. But that is why I said I just wasn’t messing with the under $1 stocks right now. CRK has been a real dog as well. But REXX and LGCY have been awesome.
Check out WPX and OAS – some of these slightly larger companies don’t pull back as much when the hook comes out; feel safer with that in my basket.
Had to get propane for the grill! And stack some wood that I split ysterday, get a couple of groceries, do a few other things on my ‘to do ‘ list.
(…Otherwise known as my better halfs list ) 🙂
We thought you were out plowing the back 40
That’s tomorrow
One more post (this one’s serious) look at the volume on LGCY today (still holding)
Use just the 10sma, so far ok, but if we get a bounce tomorrow and you lighten up, you might feel better?
A-N-D – …Go re-read the LGCY chart in the report 🙂
Thanks ! (And for not putting me in time out)
Bill!!! What the heck do we make of RIG today???
I bought RIG with the anticipation of holding it for a while. It has strong fundementals and I doubt we will get any bad news about it. Same with PACD. So, although a big dip Today I won’t be selling. Still in the money, for now.
thats what the batphone is for
Let’s pitch in an buy him this
.. Maria would love that .. 🙂
Alternative scenario SOG!
i was thinking..,,, Alex, maybe not so much
sorry Crystal.. my replies probably seem totally incoherent… i didnt know you had posted the gifs (they dont automatically show up without renewing the page)
so you gotta remember to say …. REFRESH!
i know my replies are usually incoherent.. but this time i have the gif excuse
Well.. I though you meant… Alex, not so much I that he wouldn’t object to the “restriction”
LoL..
this place is getting sleazy
I’ve had a long day …..lol
Daddy issss NOT gonna be happy with us…
Spankings for us ..
*goody goody….
WOW- I walked away for a couple of hours and retruned to refresh the page and see 40 more comments and what…. 7 new GIFS. I would guess someone ‘chatty and giffy’ is back
No …..SOG and I are having fun….
Oh- I’m working my way down, my apologies to Maria ( thats a 1st) . lol
.. i cannnnnnt HEAAARRRRR youuuu ….
come again?
yeah ,, Maria – stitched up like a kipper
she never posted even one gif
Well….when you’re hot…..we better stop….I think “Daddy’s Home”
s’ok.. the day is done.. whole new blank sheet to scrawl comments in tomorrow
True that!
Lol.. im on my cell…it’s difficult
No excuses girlfriend,
So am I! (I need to go make dinner or else I’ll really be in trouble)
Rut roe… daddys homeeeee….
Quick.. run and hide!!
My 10 yr old niece just asked if she can scroll through the page today, and read all the happy comments like yesterday. …is the coast clear for her fawn like innocent eyes?
haha.. does she like batman?
You. Need. A. Moderator. 🙂
Wellll.. it ISSSS thirsty Thursday. ..
Maria.. how do you fancy a job as moderator?
you can be our ‘man’ on the inside
Ohhh.. you well know I’d be more than happy to step up and take one for the team….
oh i know … buttt … what about about the moderator bit?
Smirk… im there
So cute. My kids see me on the laptop at night and are like “oh, he’s doing ChartFreak. Again” and then roll their eyes. Any time I look at anything financial, it’s ChartFreak to them!
… that’s so cute cason…
Show them the Chartreak Lion Logo – Kids will think your financials are related to Tony The Tiger and Lion King, and they’ll be happy 🙂
how old are they cason….?
soo cute… 😉
*mine … albeit a lil older.. roll their eyes and say “.. o brother.. mom’s flirting with her stockboyfriends again…”
ha ha ha
#TRUE
5, 7 (almost 8), and 10. But I can’t get any of them into charting yet. I do tell them that Dad’s CF time is IMPORTANT!
aww.. cute .. enjoy!
don’t feel bad .. I’m 0 for 3 in my house.. sigh … BUTTTT .. I do have my niece’s ear… she is a little minime .. (poor thing I know)
… pretty sure she may have ‘the fever’ … ;o)
Alex, great work last 2 days. I did something few trading commodities did today – made money. I got BAS and AA (both up) with my CLF and VALE sales (still have half but will just look to add). Then I went in DUST pre-market when I saw gold come back up from overnight lows to kiss the short-term trendline good night.
Anyone else still in IBB/LABU? I bought LABU back this week on the reversal. A little nervous over the weekend. Bill, you’re still in biotech, right?
Good morning Cason! Still holding Bio’s, but not LABU. Holding XBI may calls.
GL, man. Options have not been kind to me recently.
How come???
I think *holding* LABU is riskier than playing thru options. Just give yourself a least 1-2 months in the exp date, not calls expiring today! I move in and out the same way I would stocks.
I can’t get my exits right with options recently. Instead of stopping out, I keep thinking I’ve got 2-3 weeks still for the move to come alive. Then by the time to realize the breakdown, they’re gone worthless. I just need a better exit strategy. The good news is I have defined risk and don’t buy over what I can afford to lose with options. Hard to know if you should buy more or cut bate. Much easier with stocks b/c the time dimension is gone.
I took half off LABU…..
I should have a new report around 8 a.m.
I decided that you all need a clean slate to write on ; )
Ok great! https://uploads.disquscdn.com/images/1b359cc67c96b6c0d45f893ea92b6d1ea274aa5008460ea8d8a86faa7a275281.jpg
Sorry – proof reading . Try for 8:35 🙂