
Starting Gun
This weekend report will be slightly different from past weekend reports. I usually like to cover “Everything” in my weekend reports. I want this report to focus more on what I think could be important at this moment, and less on everything else. We will discuss the meaning of the Starting Gun too, but if you’ve been here for a while, I would imagine that you know exactly what I am talking about.
.
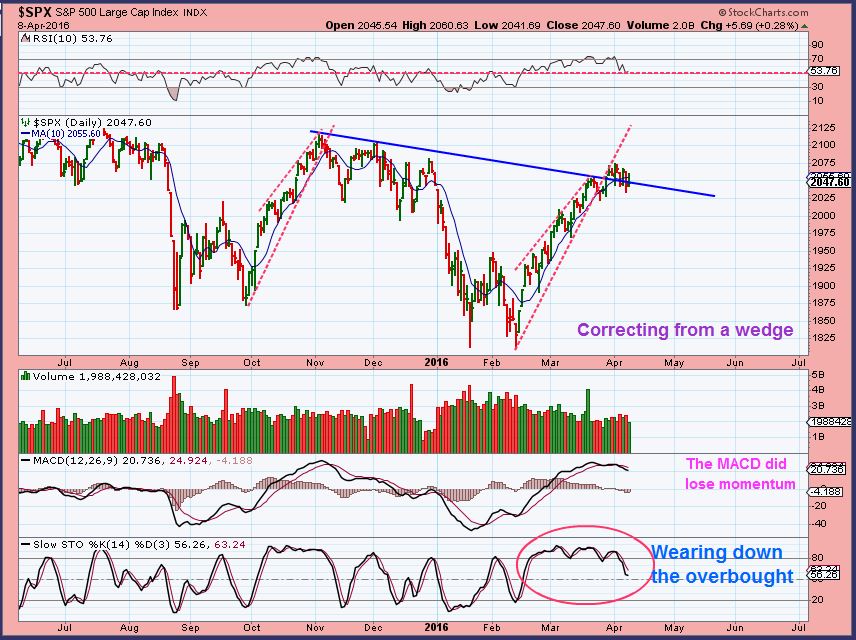
SPX – Less important right now to my current trading. See Fridays report for thoughts on the SPX.
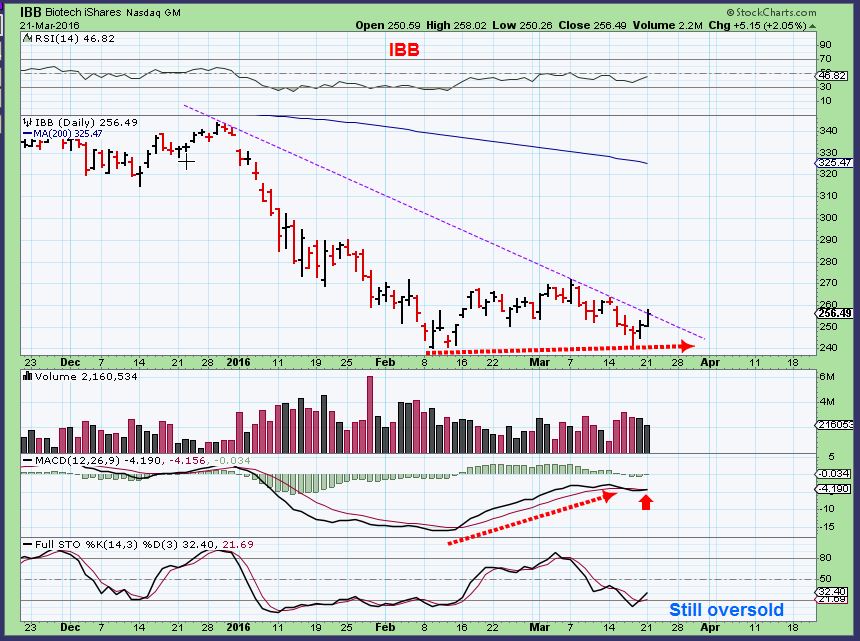
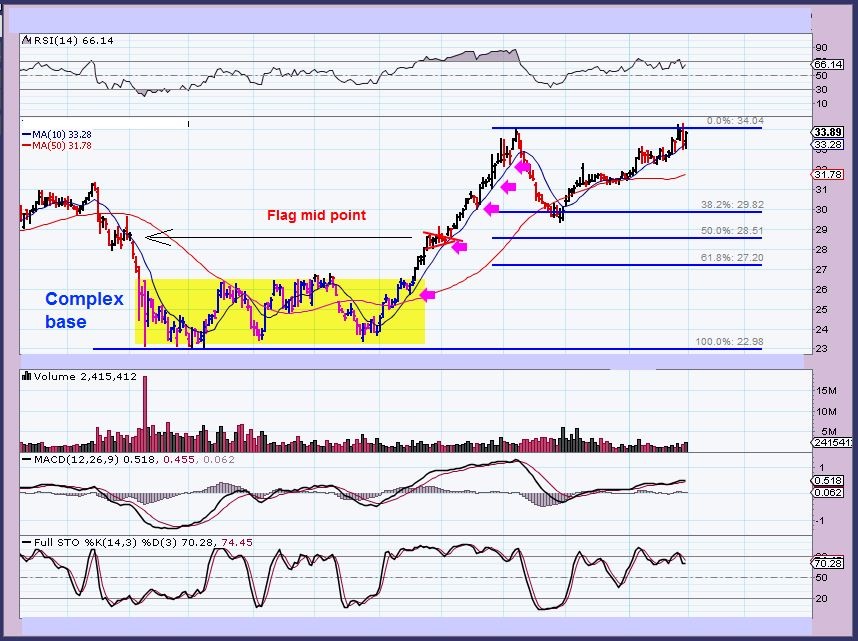
IBB – We’ve been watching the Biotechs bottoming . They broke out recently.
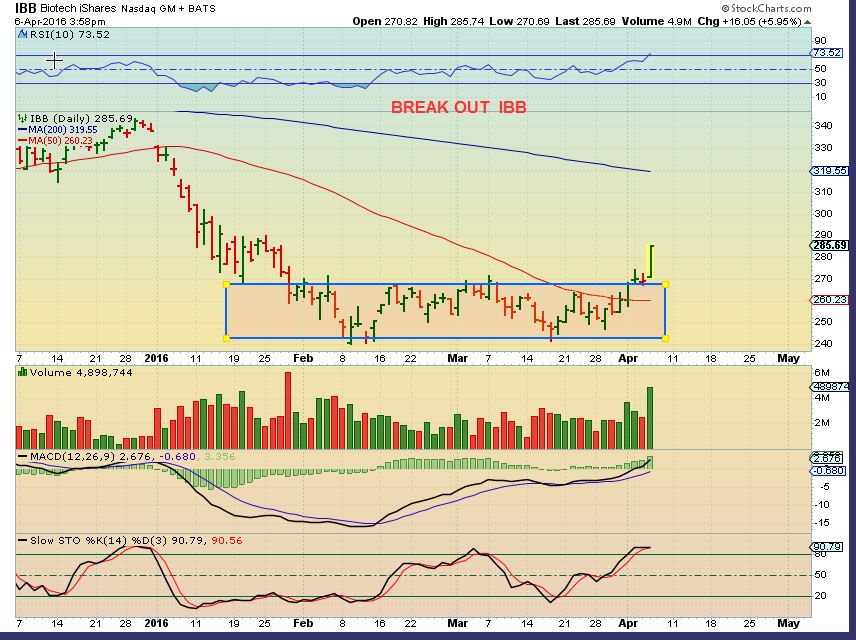
IBB March 21= double bottom base
Nice break out (But notice the resistance on the left. Were there buyers there hoping to sell at break even?).
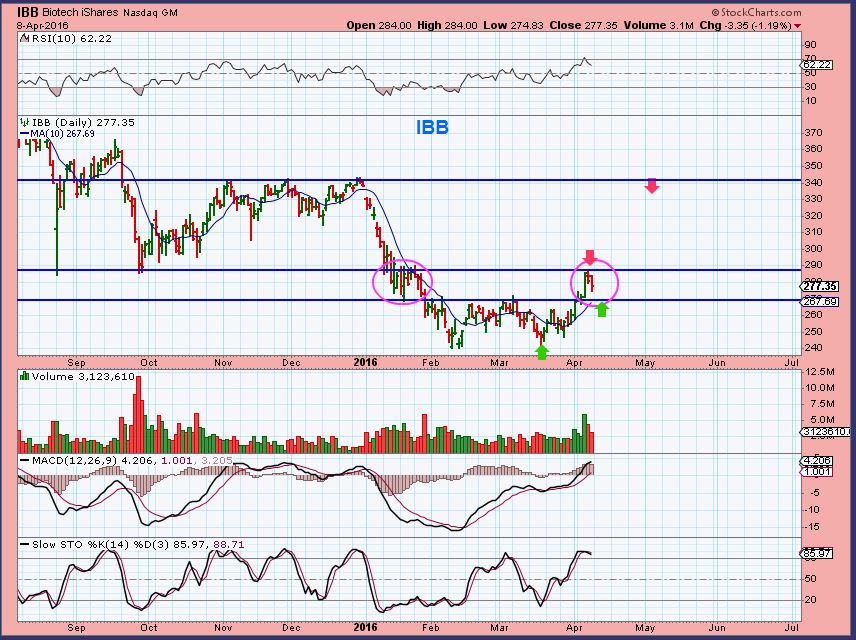
IBB WKLY – Apparently so, sellers may be present, but I expect this to go higher when they are out of the way. Thats a nice base. Support is now near $270-$275, The saying is “Buy the dips , sell the rips”.
.
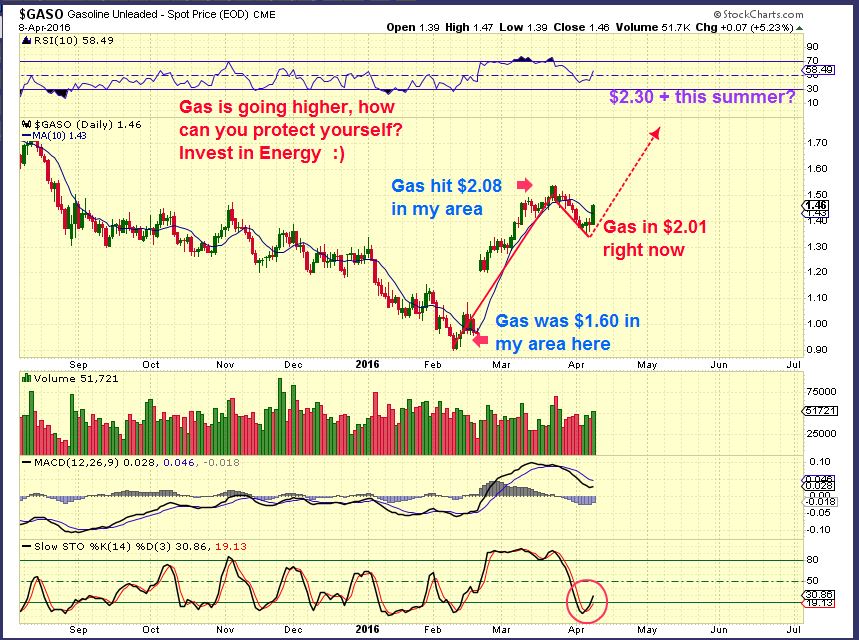
GASO – This is the price of gasoline PRE-TAX! Yes, you really do pay that much in tax at the pumps.
.
LESSON #1 : Has Gasoline gone up in your neighborhood since the beginning of the year? I check this chart weekly. It tells me that Gas may be $2.50 at the pumps this summer, maybe more? Invest in Energy and you may not care as much.
WTIC April 7 chart – Likely a DCL on day 36 because I mentioned that Oil sold off for 9 straight days and energy stocks were holding up.
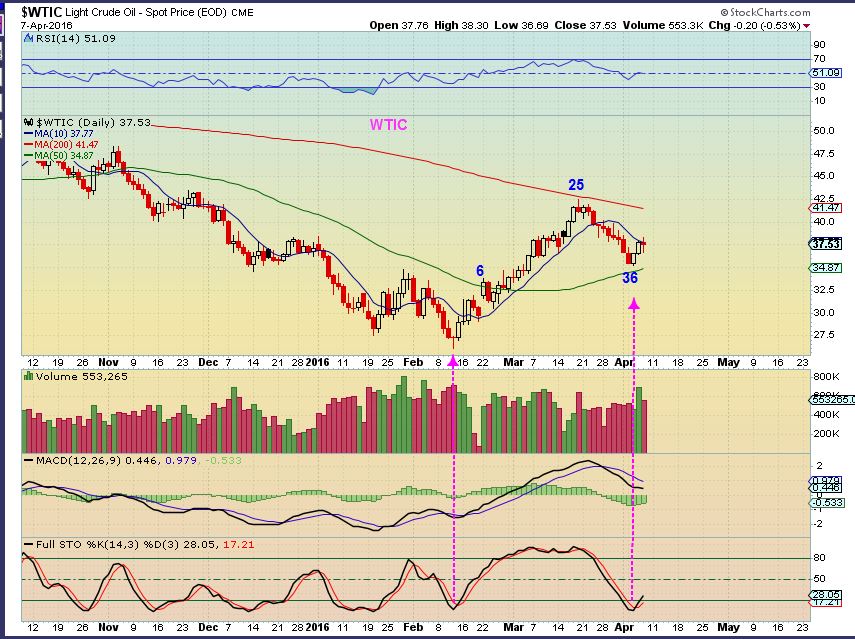
WTIC – The DCL is in place with follow through. I Notice that Oil paused below the 50sma around day 4-7. We are currently on day 4. Will this may pause or just break through the 200sma? Even if you see a pause, I am bullish on Oil.
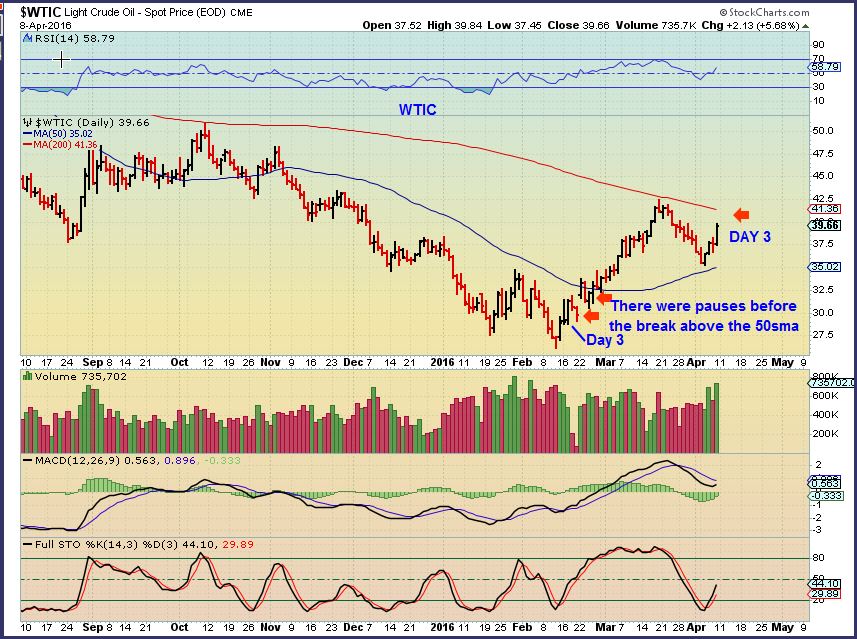
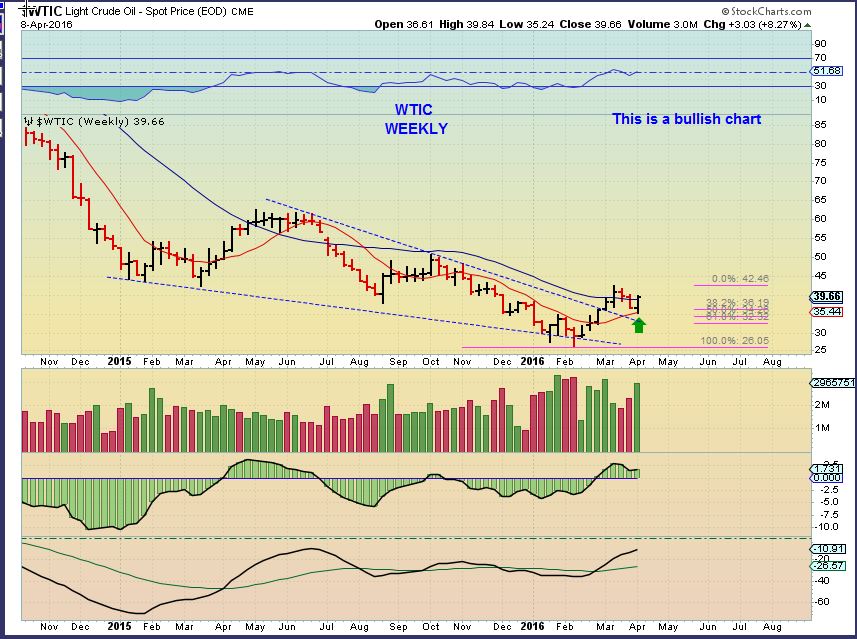
WTIC WKLY – I love the set up on the weekly. Oil should trade above $44 soon. Poor Gartman. 🙂
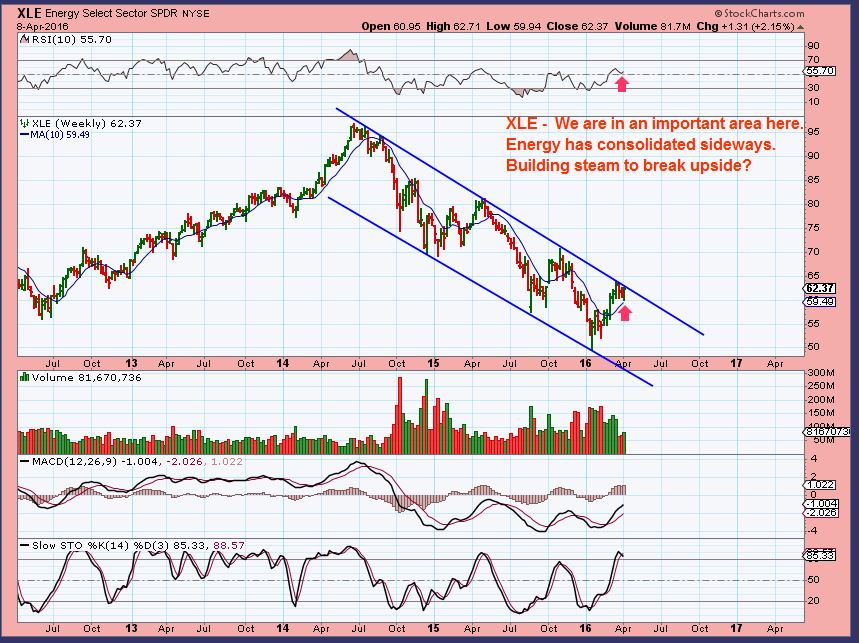
XLE– Energy stocks are still in a downtrend, but we are looking at OIL and GOLD and The CRB and The Miners, etc as likely putting in a long term bottom. So we are anticipating a break out. Energy Stocks exploded Friday (Yay!). More on that later.
.
I listed a number of charts in one of Last weeks report. Please see ( Maybe Wednesday or Thursdays) those reports for ideas. I believe they are all doing well.
This was LGCY on April 1st. A trend line break would be good ( Over $1).
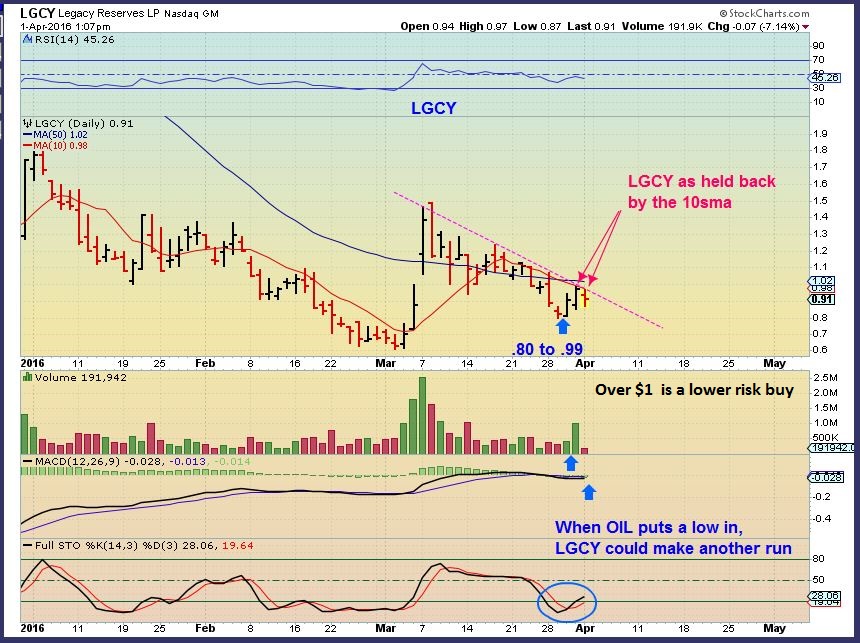
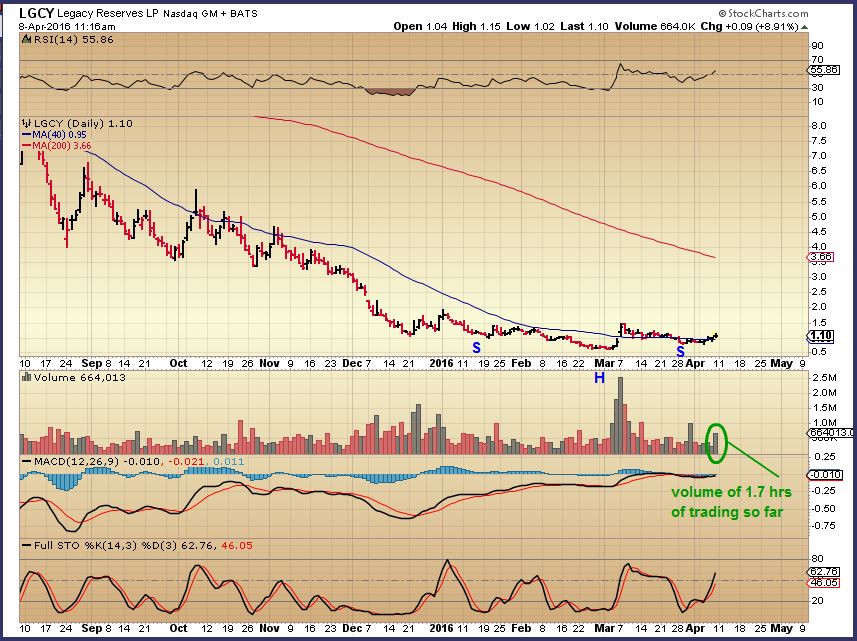
I posted this in the comments as a buy Friday morning. Yes, it was up 7%, but it can run A LOT Higher so I just added to my position. Some of these Energy stocks will likely double again. It closed up 22%. If LGCY pulls back Monday, it could provide a nice entry too.
.
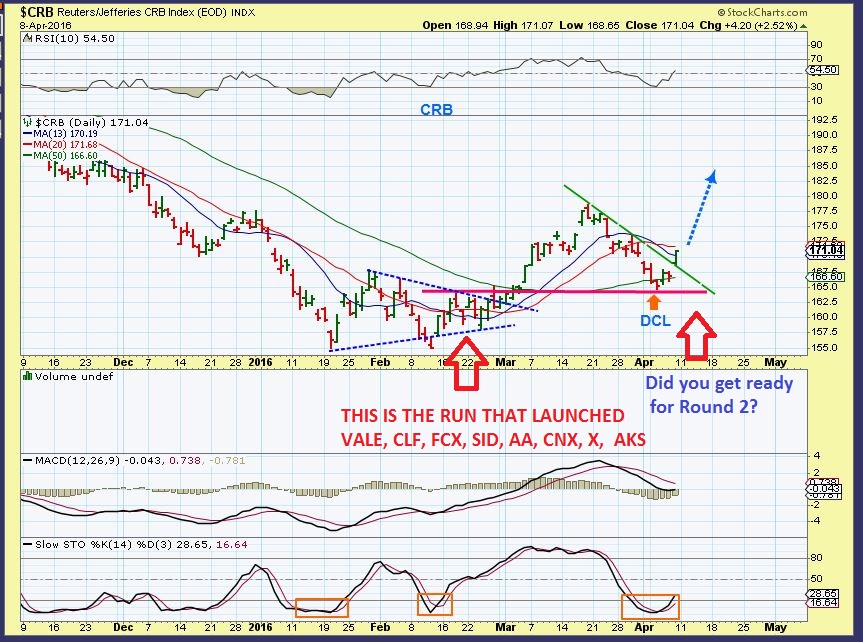
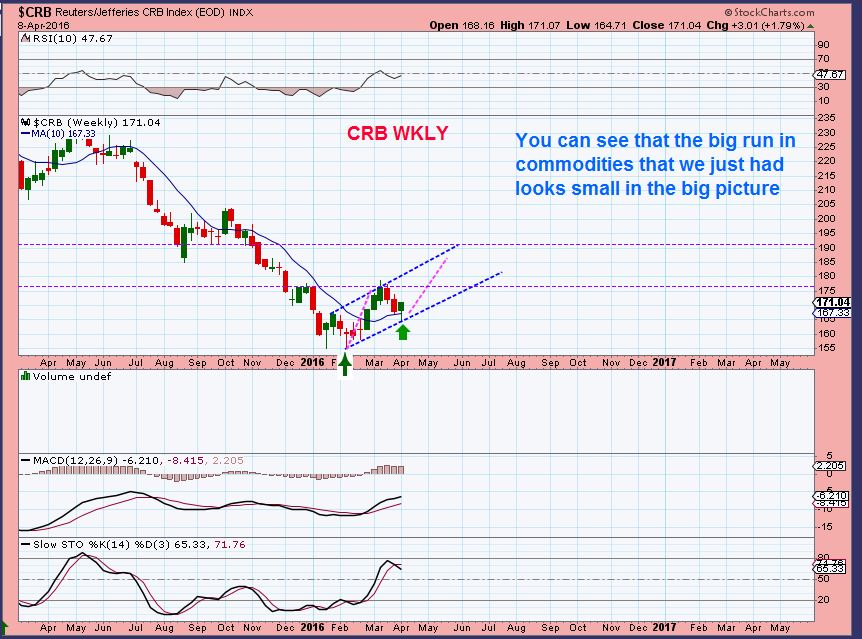
I wanted to show this CRB chart. I know it looks a bit crowded, but I did this for a reason. This is the CRB base area.
First – That small run in February through March is what launched X, CENX, AKS, CLF, etc etc . This looks ready for round 2.
Please Notice the Blue Triangle, the back test, Break out of the green Line.
Second – Do you remember me repeatedly ( if you have been a subscriber since January) pointing out that blue triangle base area in Gold on this chart for example? Look at the above chart of The CRB base, compare it with this Gold charts base. VERY SIMILAR? See the Triangle – break out – BACK-TEST.
This came next for GOLD after the triangle break out and back test. What did Miners do when GOLD RAMPED UP?
MINERS did this on a Weekly basis.
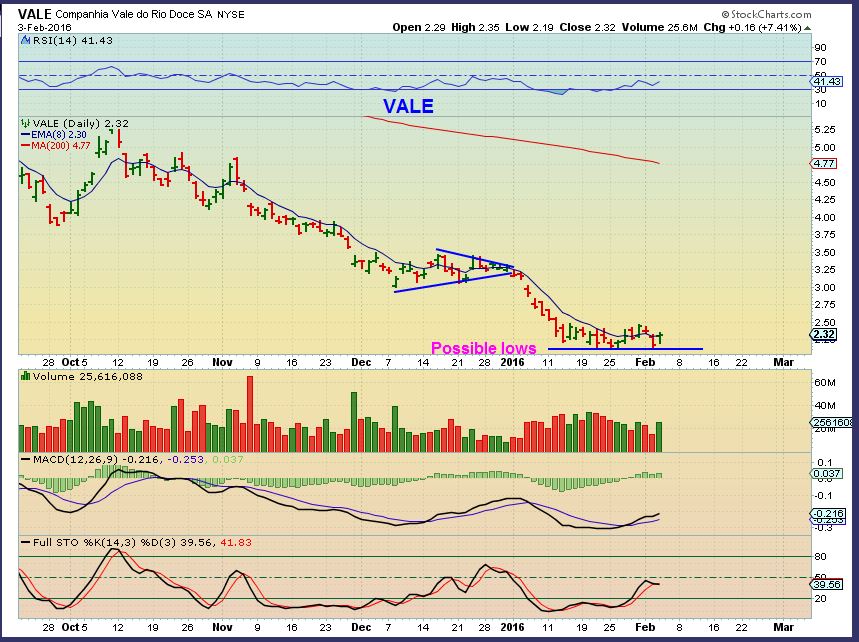
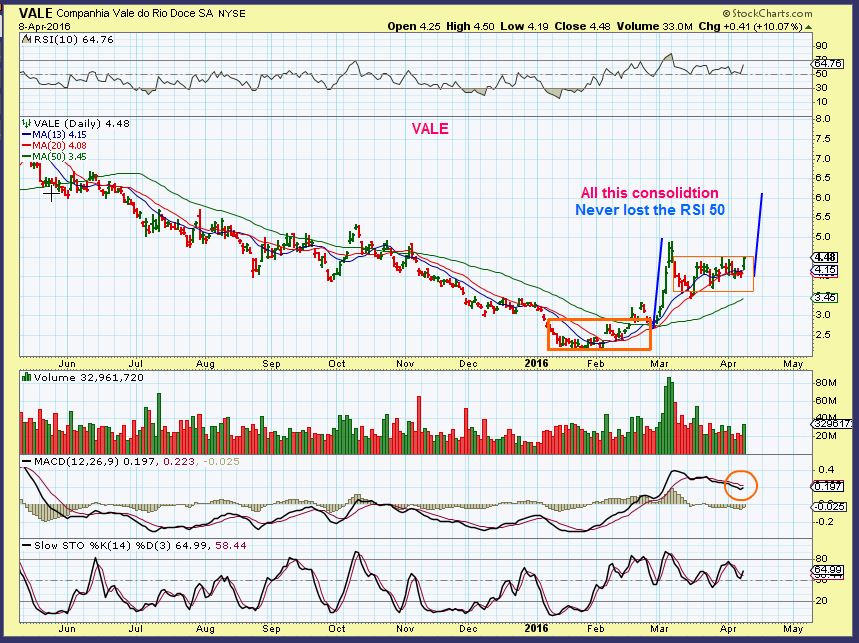
I cannot guarantee that our commodity stocks will RAMP like that, but dont you think that we should be invested in the upside probabilities? THAT is why I have been pushing the consolidations in VALE, CLF, SID, etc etc as Bullish, and encouraging us to buy the pullback and ride out the consolidations as boring as that may be. Now I think Friday we may have seen the starting gun fire across Energy & Commodities.
.
Were you sick of me posting a chart every single day for VALE & CLF? Me too 🙂, but it may pay off. I looked in my folder, I have 44 charts of vale – lol. Lets take a look at the slide show minus about 36 charts.
.
VALE BASE- Buy a break out or buy there with a tight stop.
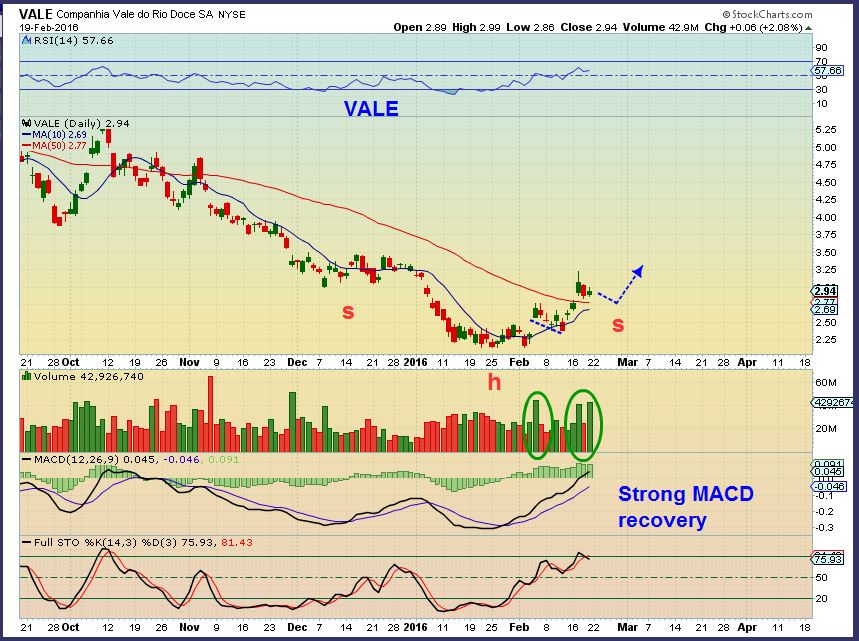
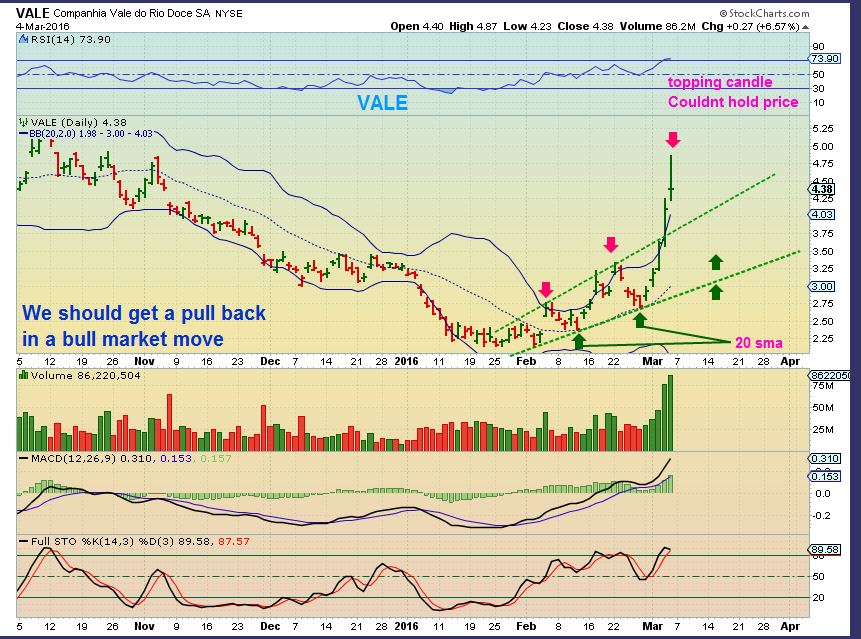
MARH 4th – I SAID THAT WE MAY SEE THIS. It may bore you to tears, but it is bullish if we do.
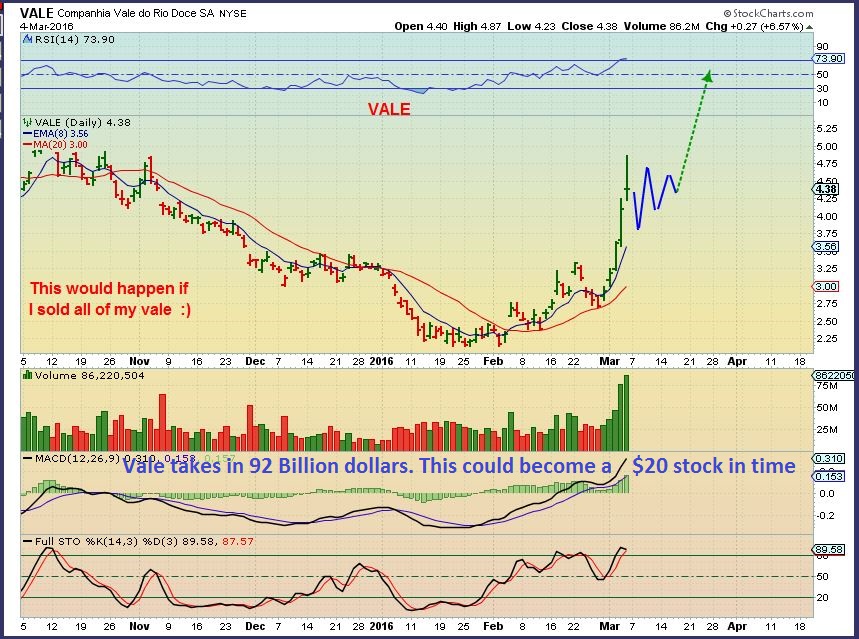
APRIL 5th – We do see that – and – WE ARE BORED TO TEARS! 
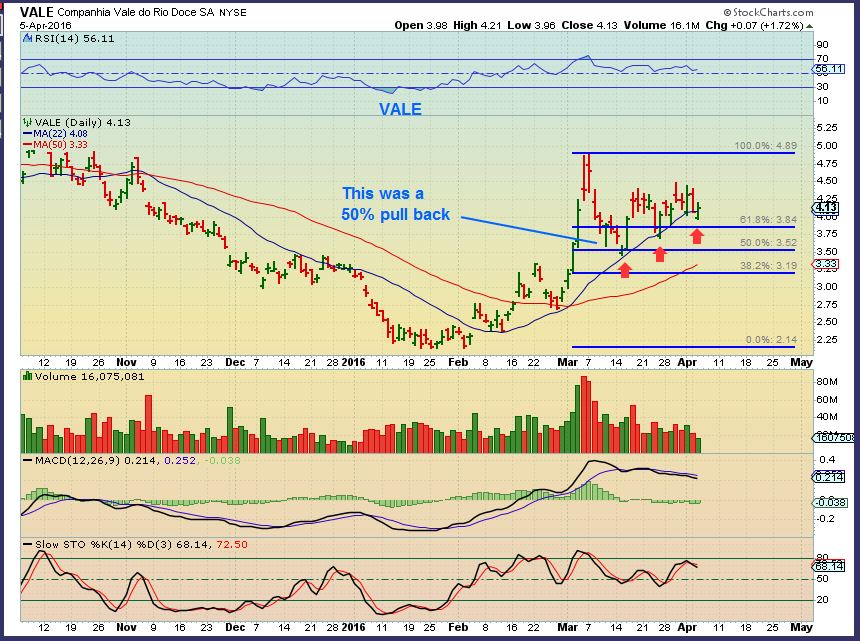
NOW – This may be it. Base -Run – Base – Run. The CRB is breaking out and VALE popped 10%. The starting gun for the 2nd leg of the race may have just sounded, are you ready?
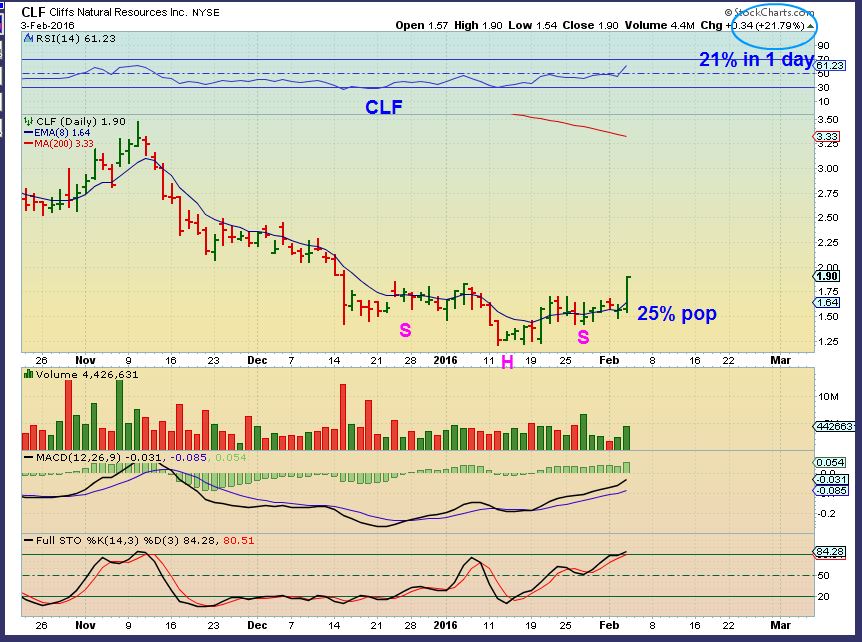
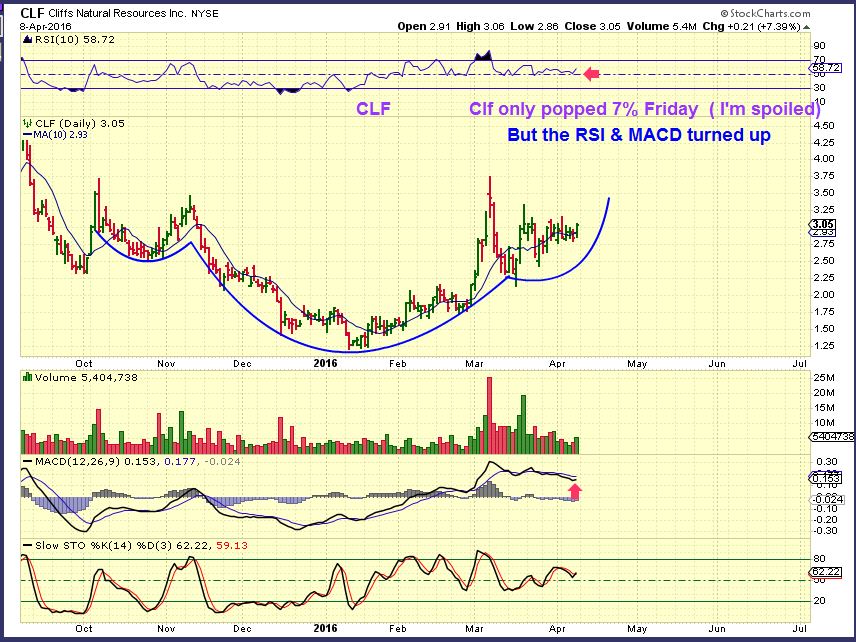
CLF – We bought the inverse H&S. What a bargain for CLF, near $1.50
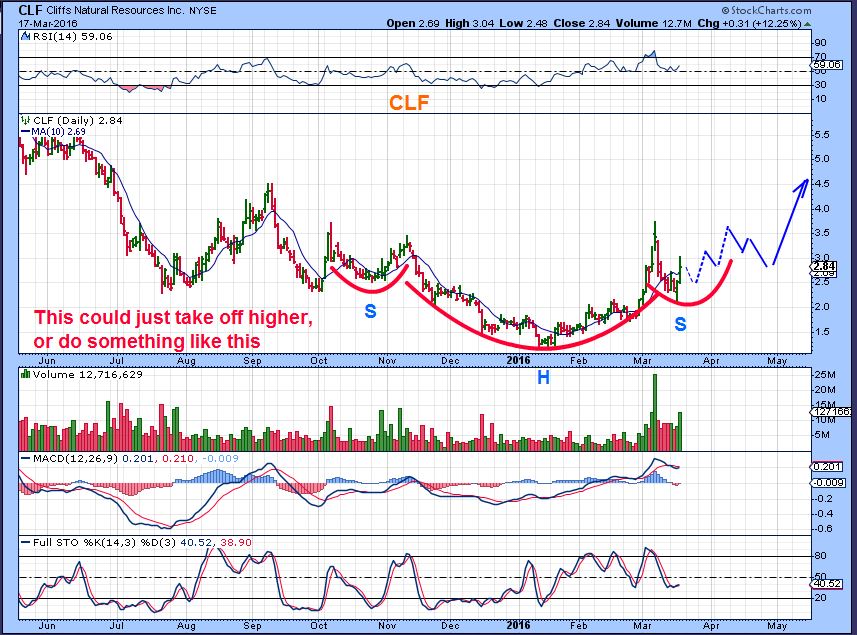
CLF – March 17 Almost $3 , but look at the Bigger picture. I expected a possible consolidation and yes- It will bore us to tears. 
CLF – April 6th – We got an up-trending consolidation. I posted this last week.
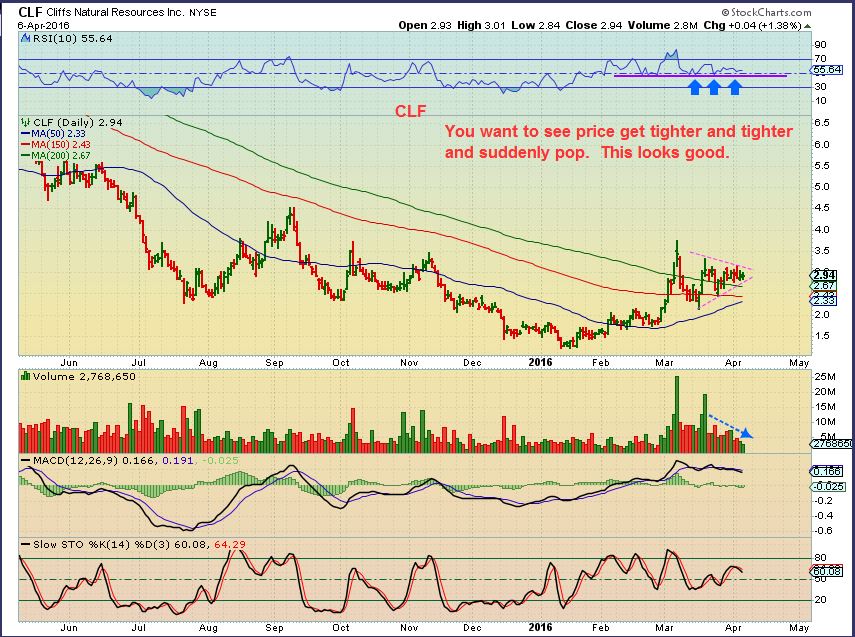
CLF right now – IF we are about to get our run higher in Commodities, I expect this to join in. You did NOT miss this one by any means.
CRB WKLY –
.
GOLD & MINERS
.
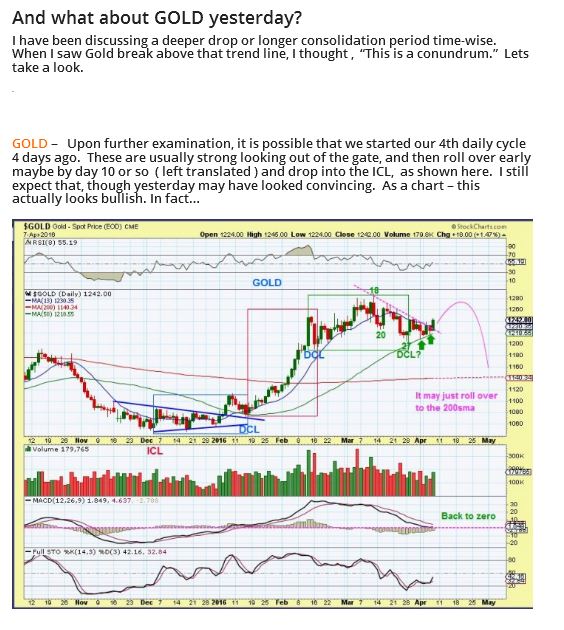
I had an idea of what may be happening in GOLD & MINERS and posted that Friday. I will copy it here, but if clicking on this chart doesn’t enlarge it enough, you’ll have to go back to Fridays report and read what I see for GOLD & MINERS as a possibility at this point.
.
GOLD –
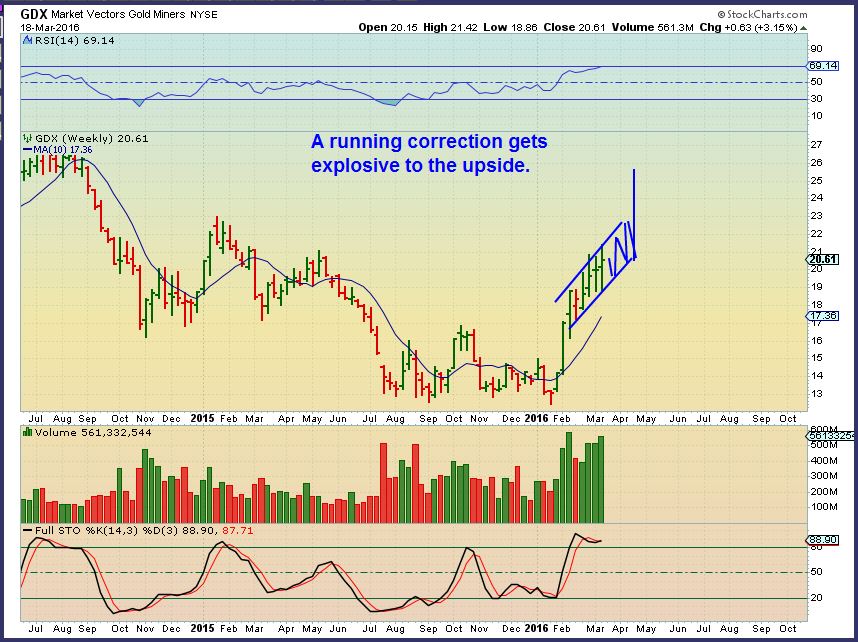
 GDX
GDX
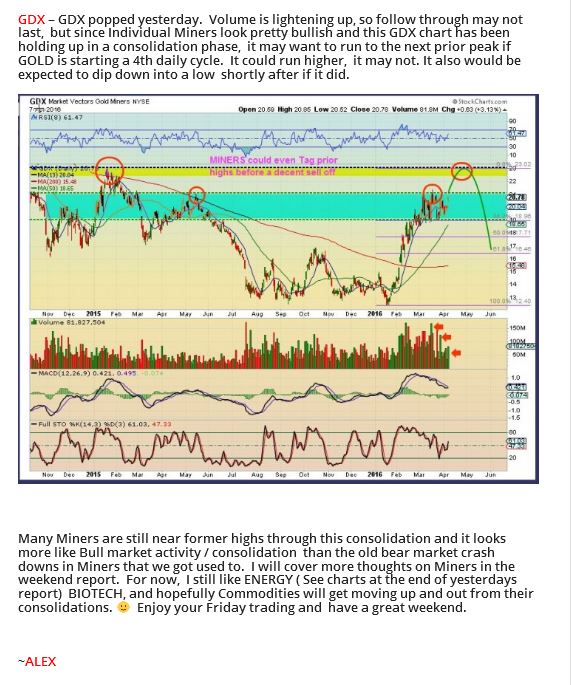
So the above was from Thursday night/ Friday mornings report. I still feel that way. SO a TRADER may want to try to trade Miners, some look very good, but risks are there too. Lets discuss.
.
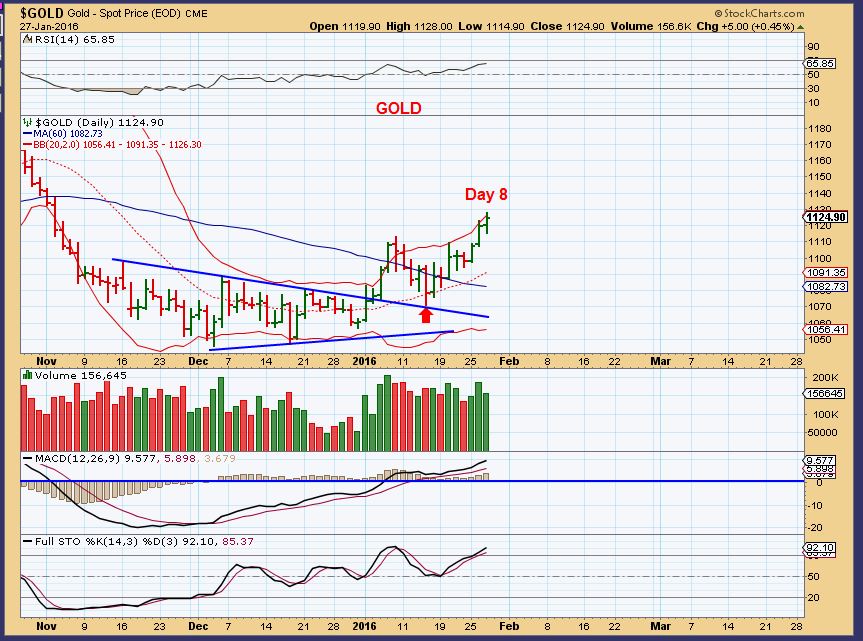
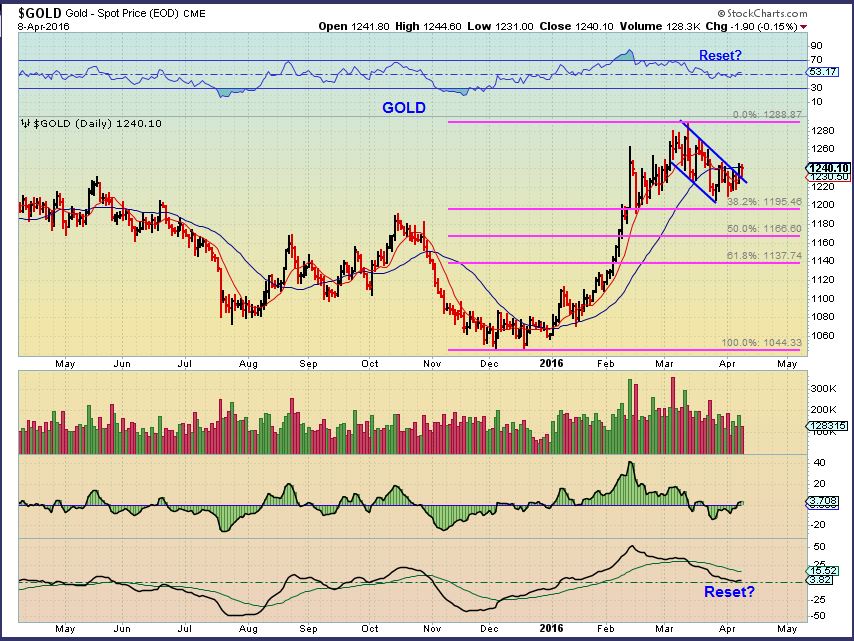
GOLD – If Gold is starting a 4th daily cycle, they usually roll over quickly, like by day 8 – 12ish. We are there now. So…
Gold was down $1.90 Friday, but…
GDX – Miners still shot higher. SO I will point out 2 thoughts here…
-
See the chart below for the OLD FALSE BREAK OUT TRICK. If Gold rolls over, it could drag Miners back down.
-
OR are MINERS acting like the commodity stocks and are going to run higher as Gold bounces around before the expected dip?
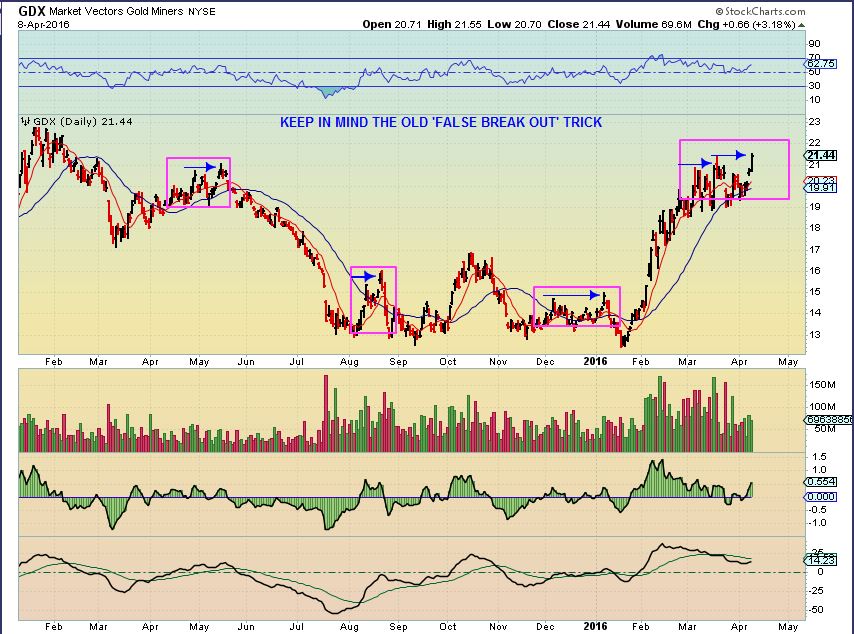
I can’t know which of the above ( or another idea) will play out at this point. GDX I see Weak volume, an open gap, prior head fakes, I tend to think there wont be solid follow through for long here (yet anyway).
.
Repeat: MANY INDIVIDUAL MINERS charts are bullish looking after a consolidation phase, but they can still POP & DROP, so it is hard to know what to recommend in this area. Continue with Patience or enter at own risk with a stop? Other than a small core in Miners, I am active in Energy and Commodities for now. As a ‘Trader’, I may try a trade or two with Miners, but I really hope to buy a pull back. We’ll see. You, the reader, may choose for yourself, based on your style and risk appetite. USE STOPS & even raise them if you do buy any Miners. The good news is that the recent action in Miners looks very bullish looking for the future of the Precious Metals sector.
–
1. I have already posted charts on ENERGY STOCKS in last weeks reports.
2. I have already posted Commodity charts endlessly ( Vale, SID, CLF, etc) .
3. So let me show you some BULLISH Set ups in Miners that I actually drew up over a week ago. They remain valid. Again, I hesitated to share them with GOLD close to a 4th daily cycle and a drop into an ICL, but lets look at a few bullishly set up Miners.
.
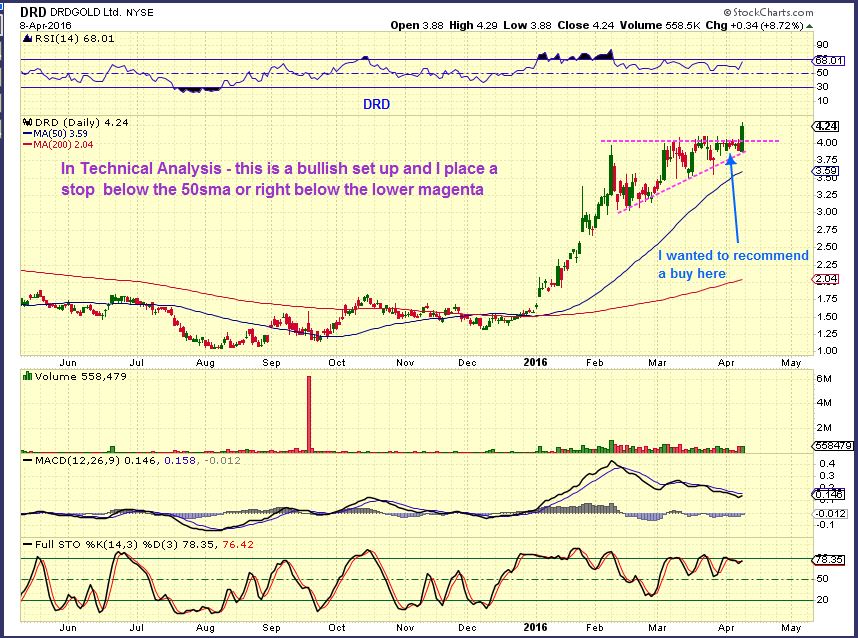
DRD– Strictly using T/A , this would be a BUY with a close stop. I watched this set up and wanted to buy it last week, but I didn’t because of the cycle count in Gold . This could still run very strongly, notice that it did all last Dec and Early January, when GDX sold off.
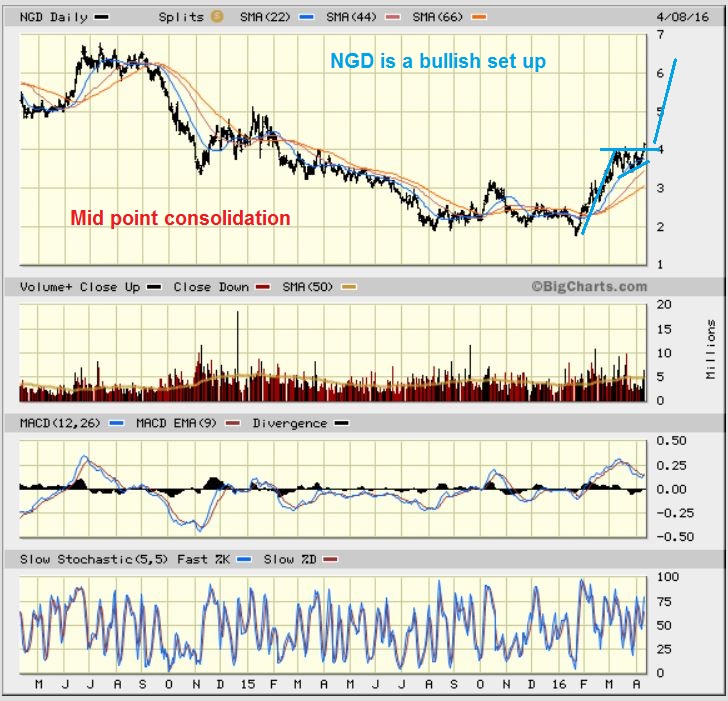
NGD – This is another bullish set up that usually acts like a mid-point consolidation. It ran from $2 to $4, goes sideways and the ‘buy the dip’ crowd waits, and then it runs away again , leaving people behind. Is that happening now? Coming out of a severe Bear Mkt, it is possible.
.
Do you remember when I used this chart in a Mid Feb report? I was mentioned that many Miners formed a “Complex Base” and they can move relentlessly higher. I was pointing out these ‘mid point corrections’. The 2nd leg equals the first legs length, and the REAL pull back drops back to the sideways consolidation, or roughly 50%. I will show you this in some Miners currently.
A week ago I posted this for us, also to point out sideways type consolidations in Miners. I followed this with the weekly chart below it.
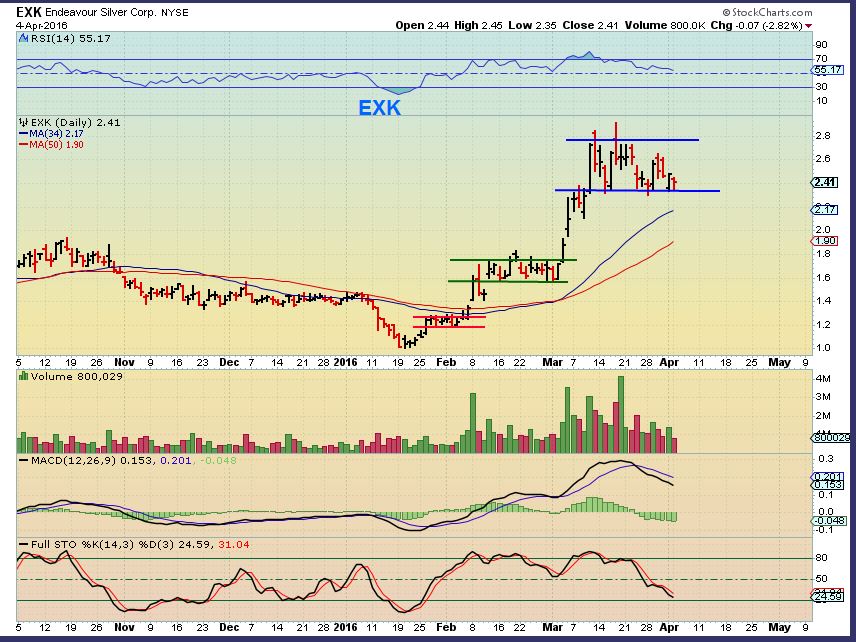
Not a huge pullback, but a flag pattern. Mid-point consolidation? $2 would’ve be a ‘gift’, because it may not happen.
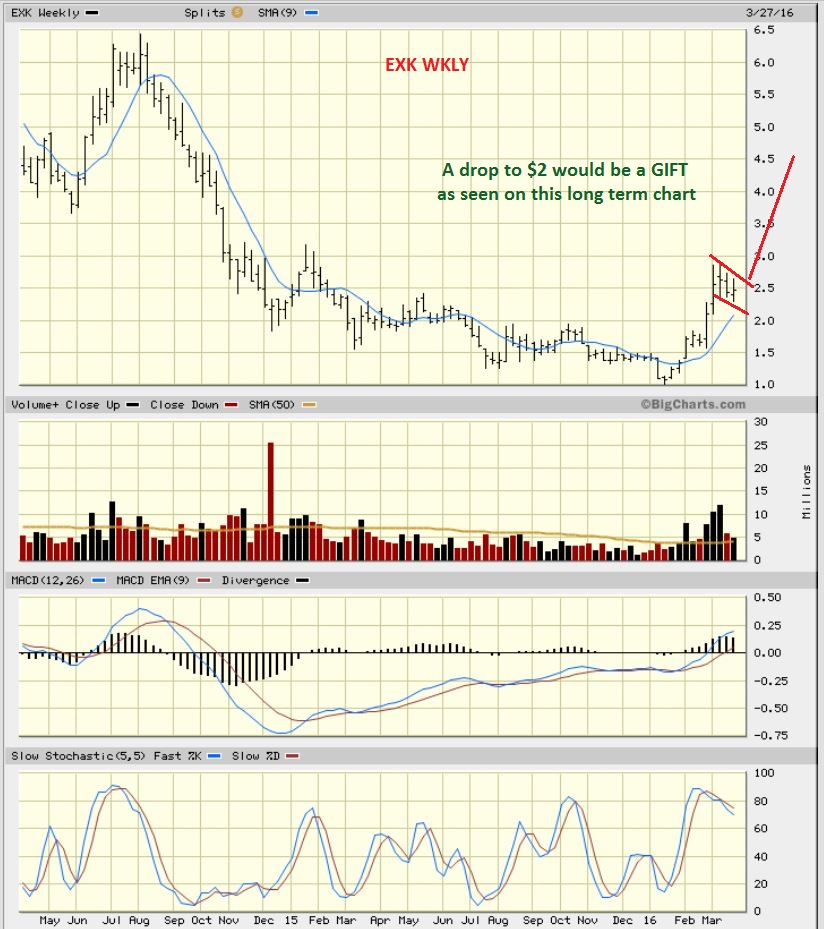
SO EXK didnt drop to $2 , instead it ran higher last week. Miners are staying strong and could continue to run higher. If they do the Pop & Drop , they may play the E.W. route with a a-b-c when Gold drops. Use Caution.
Repeat: Miners have bullish set ups, but IF YOU BUY MINERS, you need to use stops in case we get that drop in Gold and Miners follow. Here are More charts that I drew up over a week ago, and decided not to share them, with Gold ready to drop. They are playing out bullishly so far.
.
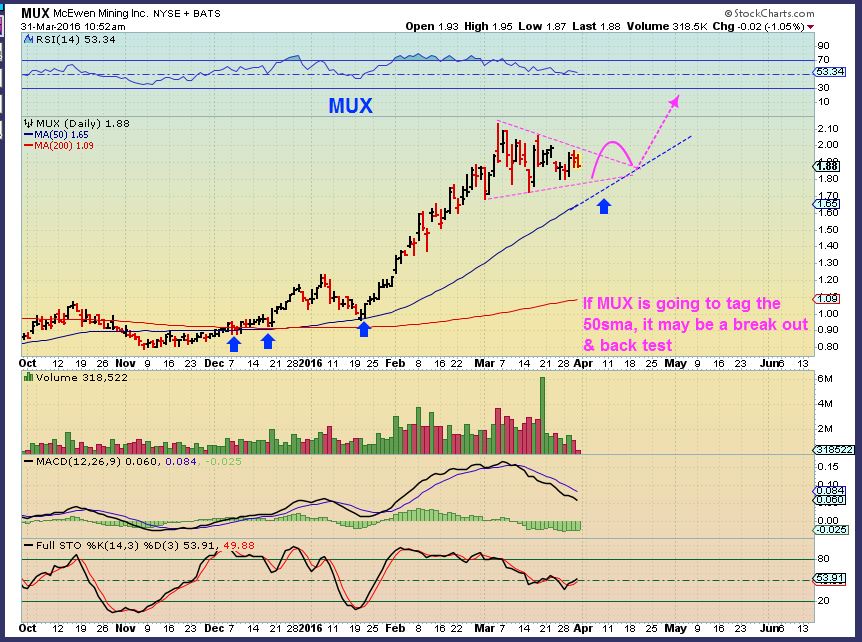
I liked MUX forming this triangle flag over a week ago. It was $1.88. I expected a tag of the 50sma when Gold drops, but I thought that this looked strong and maybe it would just go sideways in this flag.
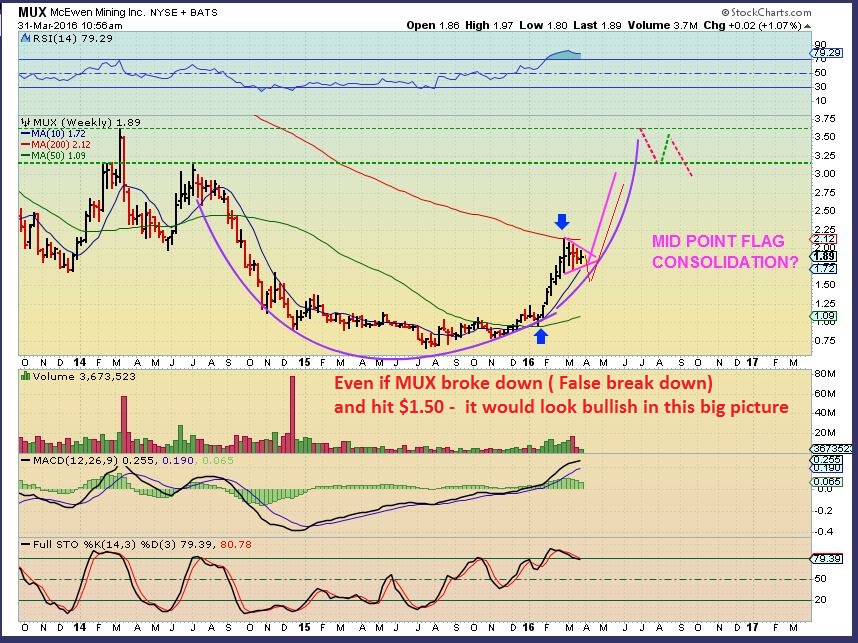
And the weekly – A mid point flag? Or a false break down first, then a run higher.
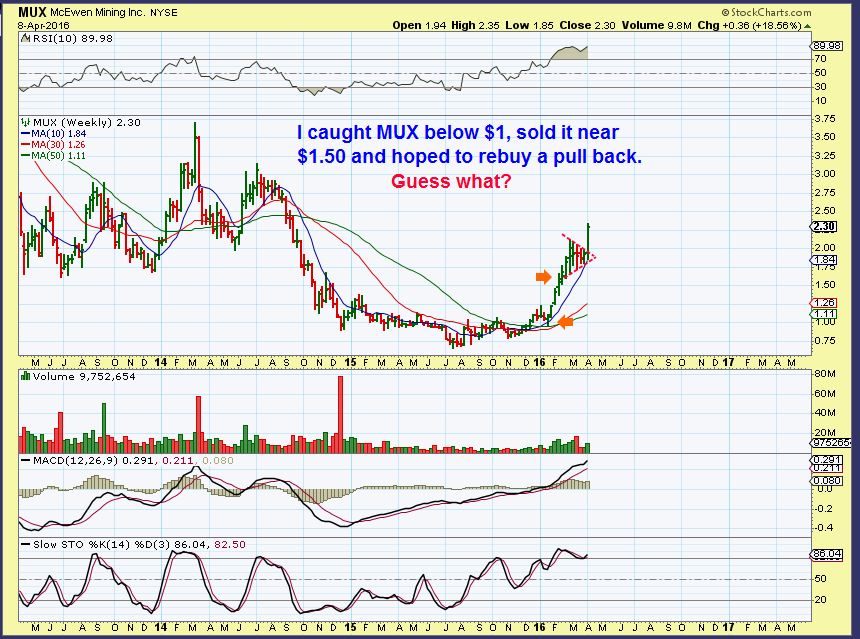
This is what happened to MUX this week . I missed it 🙁
.
AG – Another sideways consolidation after a strong run, and I thought that maybe sideways would continue instead of a drop with Gold. They were showing up everywhere.
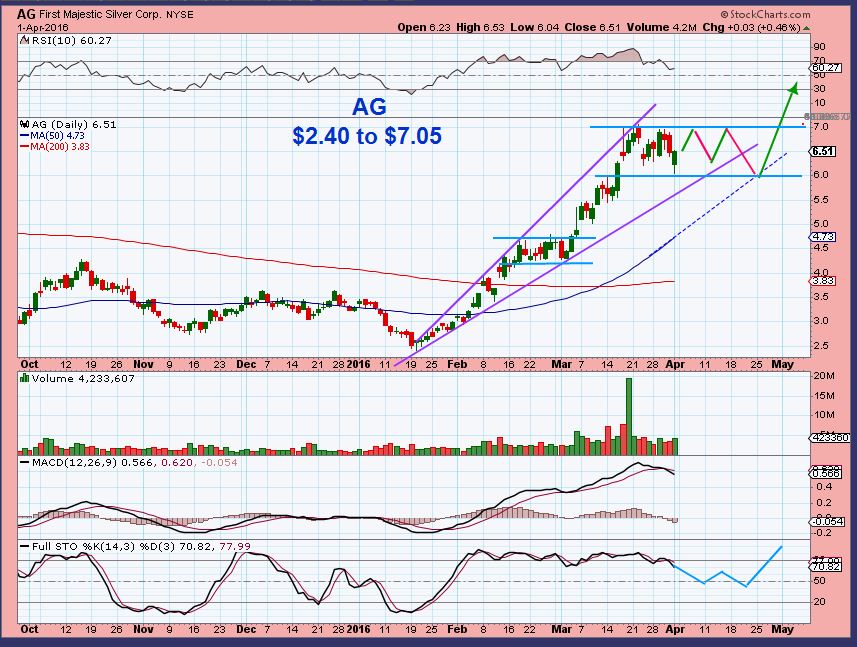
And the weekly was …
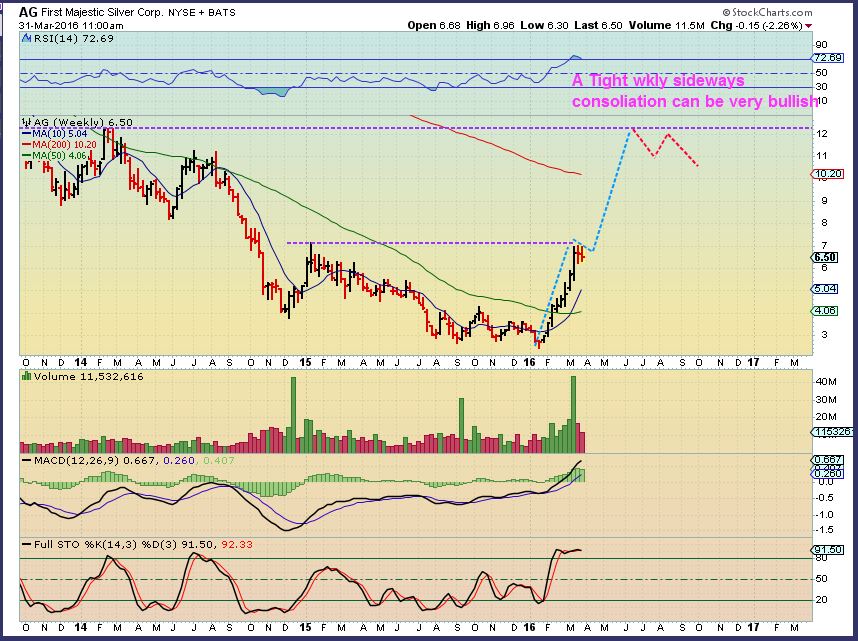
AG – AG did not break out last week, but I am watching it for a trade. It has the same set up as the others that popped, but it needs to be watched and stops in place if it starts to run.Trailing stop if it gets going.
.
So for the Miners, Traders can Take a look at – AGI, DRD, AXU, AUMN, AUY, XRA, AAU (WOW) , MUX, AGI, SA,
GPL – Just getting ready? SAND? SWC? IAG? AGI? GORO?
.
CONCLUSION:
I’m just going to conclude this report by saying that ENERGY STOCKS are breaking out, and the last time we rode these stocks, the gains were huge! Some doubled and more. I shared a list in last weeks report, andyou can look back at that report last wednesday or Thursday or
you can look at SWN, OAS, EMES, BBG, LPI, ECA, SYRG, AXAS, REXX, CIE, ERF, SN, SM, WTI, for some energy ideas.
Commodities ( The CRB) looks to be ready to run higher for round 2 also. We saw break out action in VALE , SID, etc.
CLF – Looks like it is JUST getting started if you didn’t buy my recommendations and want to try one .
And as for MINERS? They have good looking consolidations and set ups, but I have to consider them riskier due to GOLDS CYCLE TIMING. OIL is right ‘timing -wise’ , The CRB is right ‘timing -wise’ and the IBB looks good too. They would be the lower risk trade areas.
.
I Hope you all had a great Friday and weekend, I think this week could be a good one too.
.
~ALEX
.
P.S. If I have time Monday morning Pre-market, I will release a very small separate report with a couple/ few current set ups or developing trades. They will be Energy & Shippers. I see some Bullish Shipping charts.
No time to proof read this for typos, please forgive, I want to just release this early


Thanks so much for getting this out early, I appreciate your hard work! Gives me time to study up tonight some before in the morning! 🙂
I hope it helps. I think we are just starting another run higher in a few areas, so having some skin in the game is key.
Hopefully our consolidation – like watching paint dry – phase is over 🙂
:o) awesome dawson…
… when I read “i am bullish on oil” … dang.. the clouds opened, the sun rays blasted through & there was a loud singing in my ears …. HOLY… I’ve been waiting 44444 evvvvv Err to hear those words…
giddyUp!! ;o)
Thank you chartfreak 😉
44 charts of Vale…… L.. o .. L
have a prosperous week all ………………………………..
Yeah, as soon as I saw ‘Starting Gun’ I knew EXACTLY what he meant!
Those OIL daily cycles take forever! But yes, the current set up looks really good, especially when the Enrgy stocks all start holding up and then that friday blast 🙂
And yes, I looked at Vale charts from prior reports and in some cases I was putting them in every daily report. I was hoping to walk people through the set up to keep them on board, but it was probably more like , ” A watched pot never boils” for some – lol
Hi Alex. Great report. I have a Canadian resource company that has an interesting long-term chart that seems to be breaking out now. Curious as to your thoughts. It is POU.TO and went from $65 to $3 and is currently $6.70. I’m not sure if it’s even listed on an American exchange. It is paramount RESOURCES, not to be mistaken for paramount gold. How does the chart of POU.TO look to you? Thanks!!!
Wow Rob, That could be a winner. I checked to see if that price was based on a reverse Stock split, and it’s not.
That weekly chart looks great and the daily does too. I will attach the wkly here. These attempt to return to former highs when conditions go from bearish to bullish.
Due diligence needed for their fundamentals, but this is set up rather nicely. Nice catch!
Thanks, Alex!
Thoughts on E.W. for VALE? Could this be Minor 5 of Wave (major) 1? Imagine that CLF and friends (CRB) would likely align similar.
Yes , but the set up could have ‘5’ a lot higher in my opinion ( $5.50+) . This consolidation phase can add fuel to the fire.
Alex, any thoughts on TLT or Bonds in general? TLT topped when S&P bottomed on Feb 11. But has moved UP WITH S&P last two weeks. Sorry – didn’t save chart to post (and too late to re-create). But $SPX:TLT will do the trick.
It has remained bullish. I think it is going to drop soon, it is losing a bit of short term momentum. Maybe to the 50sma, then it should try to make a run for the highs.
Wow that report is a lot of BANG for the buck! for the record, I have LGCY, CLF, VALE, SWN, TK, SN, AG, AGI and EMES (4.98…. Close to that crucial $5. . Thanks for all those suggestions – “fully loaded”
That is a great little basket of stocks if you ask me. I wish you the best ( I own a few of those too 🙂
You just may have outwitted the big bad wolf market 🙂 Are we out of the woods?
I like very much how you worked out the individual stocks in the report.
It’s a great help for building up a nice portfolio for the next year.
Thanks
Thanks B.T.
And I’m sure that you know that whether it’s Oil or Gold stocks, the individual companies can have set backs, so a basket is best.
Never put your egg…
😉
Learnt the lesson.
Exactly ( And I’ve found a few seemingly good ones crack on me too)
Everyone over here knows that I posted a second report about an hr ago, right? : )
If you look at a chart of CLF side by side with VALE, it looks like VALE last Friday ( 1 day behind) 🙂
Good morning everyone!!! Pertinent info to all here at CF! Big buyer of EEM (emerging markets) showing up today. 30,000 calls of EEM bought this a.m. Bodes very well for metals/energy. Let’s see if the big money in calls is right. 😉