
Going Forward
Lets discuss what I think we are going to see going forward from here. Just like we have seen in the past, it will NOT be a straight move in one direction, I expect volatility along the way. The above picture helps us to see what to expect 🙂
.
SPX– After a nice multi week rally, I have been saying that we are due for a pull back. I do not think that the 3 day pull back that we got is all that we will get, even though that was a reversal candle on Thursday. We are at resistance for 1 thing, and …
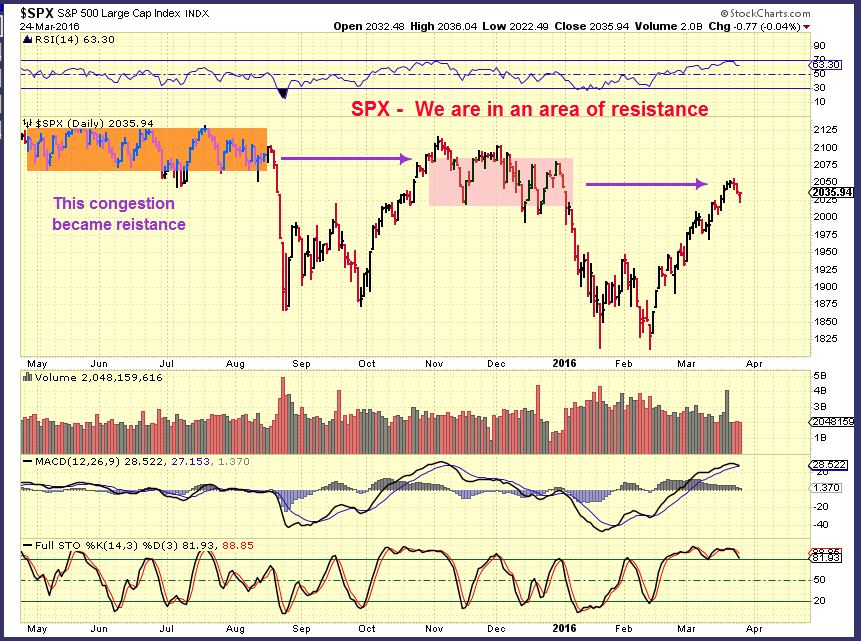
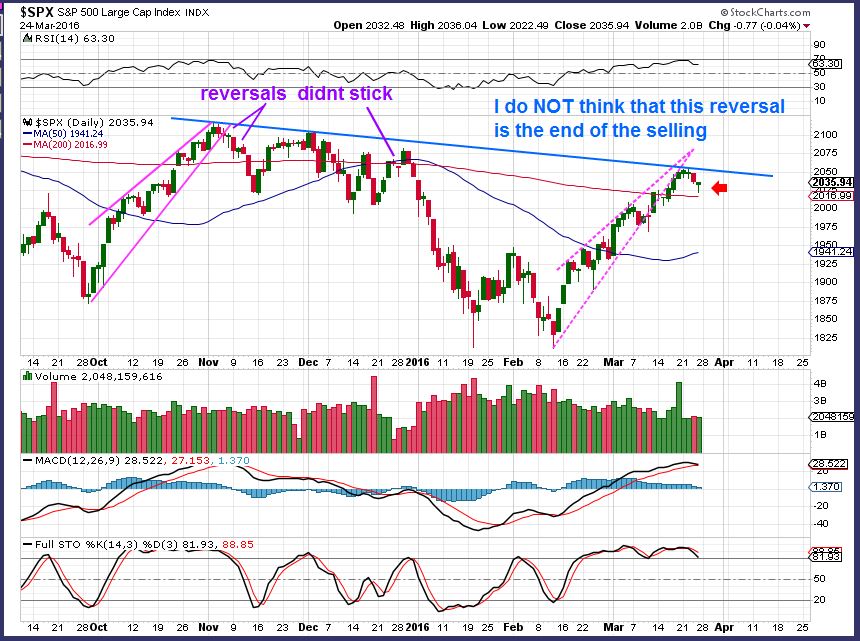
SPX 3-24 – Here I am showing that at prior topping areas, we have had reversal candles too, so Thursdays reversal may not last.
March 22 using this chart I mentioned that the VIX in the 12-14 area has lead to prior top readings.
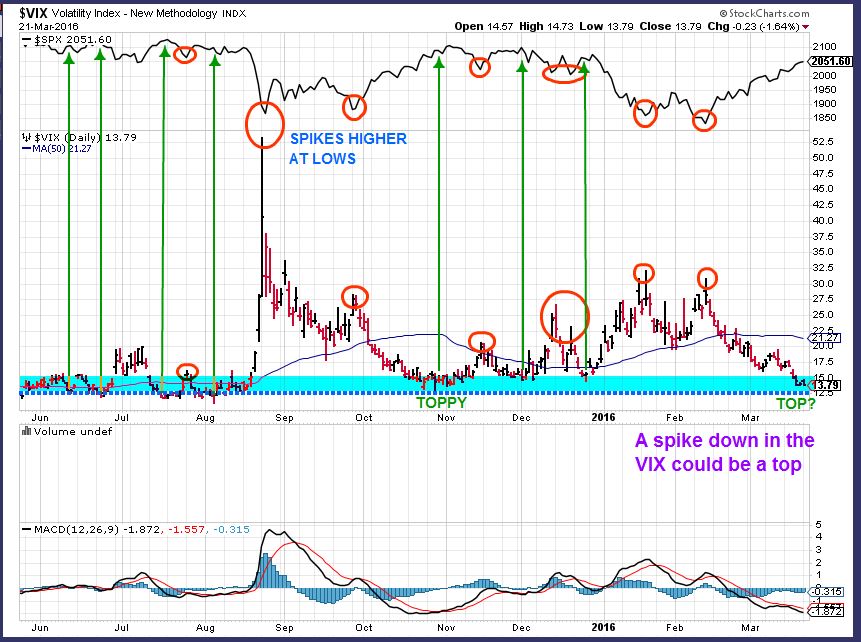
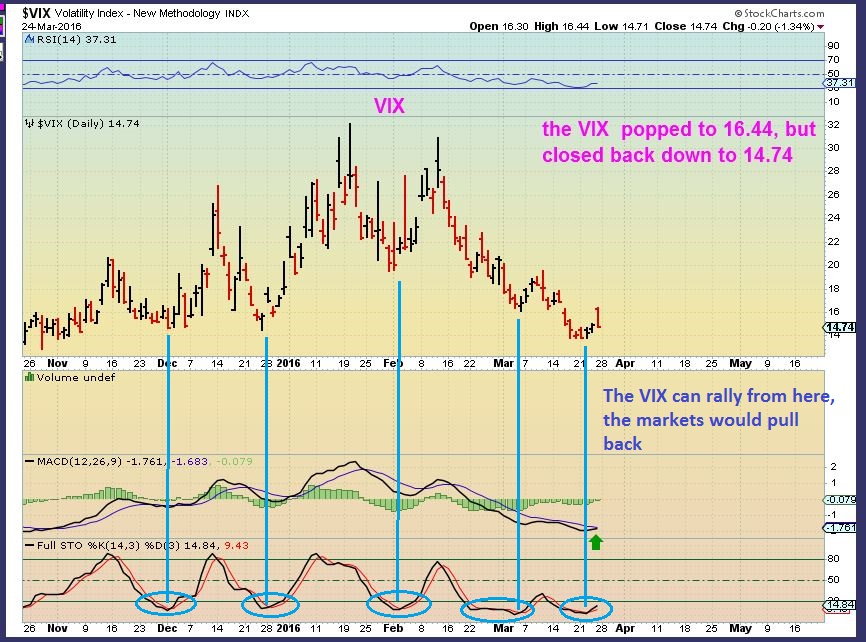
The VIX popped and the markets dropped. Interestingly, The Vix quickly dropped back to the 14 area again. Maybe we’ll see a market bounce early this week and then it continues down as the VIX rises. I have other indicators also saying that the SPX is toppy and still needs to pull back further.
SPX WKLY – So at this point in the big picture, we still have a round top in place. I do expect a pull back into a dcl, and then another run at the highs- lets see how that plays out.
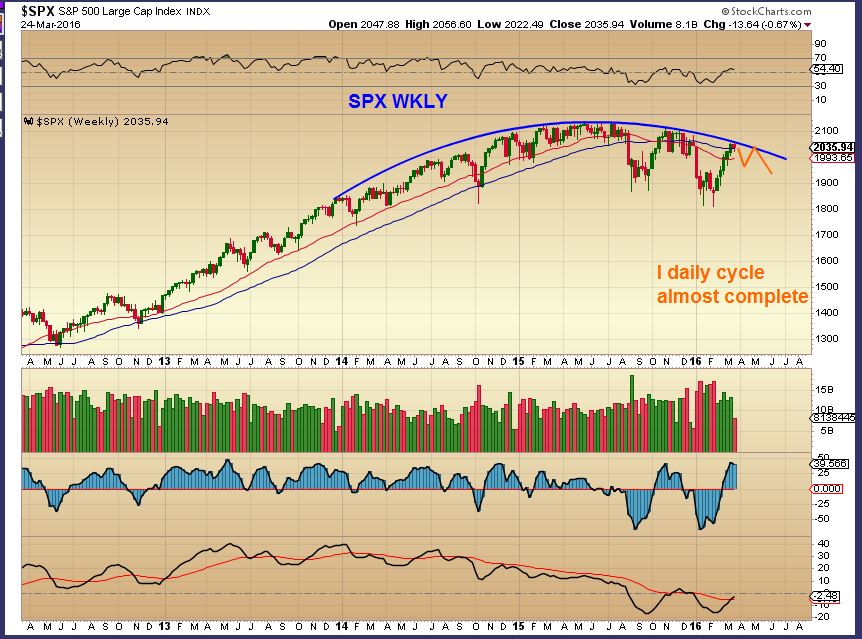
I have discussed the possible longer term views in other weekend reports and we now find ourselves at that topping area again. Topping and dropping? Or back at the top and breaking out after a correction. At this point, we need more time.
.
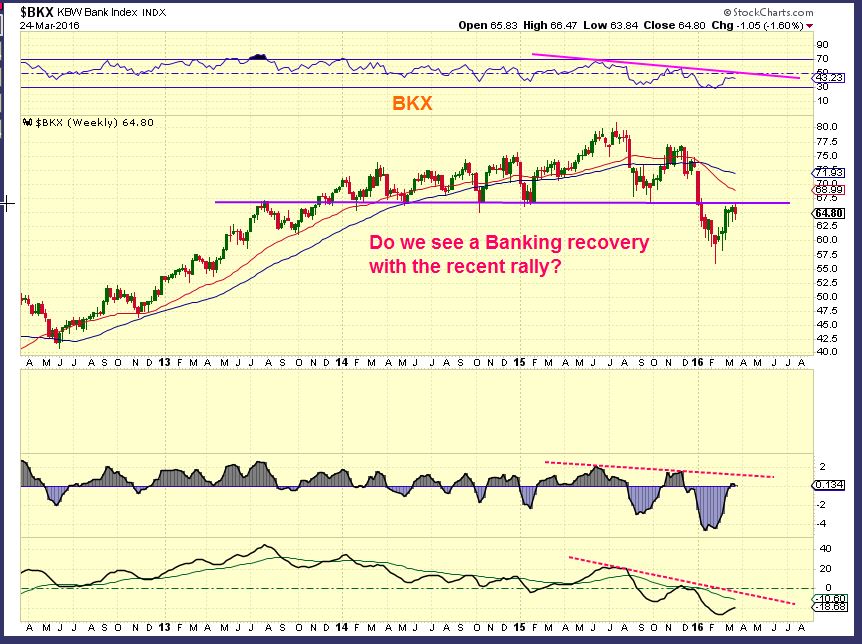
For the Big Picture – I did point out that BANKS broke down and I would think that they should recover if the Bull mkts are to resume. SO I said we would watch this area.
BKX WKLY – So far, we cannot say that this is a strong recovery in Banking.
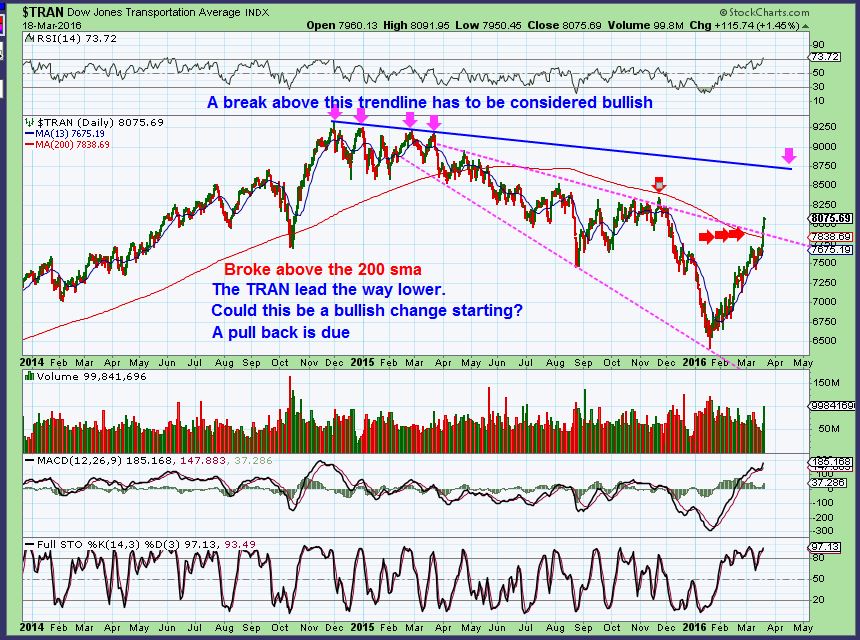
The TRAN did lead the markets lower. It does look much improved. This was my march 20 chart
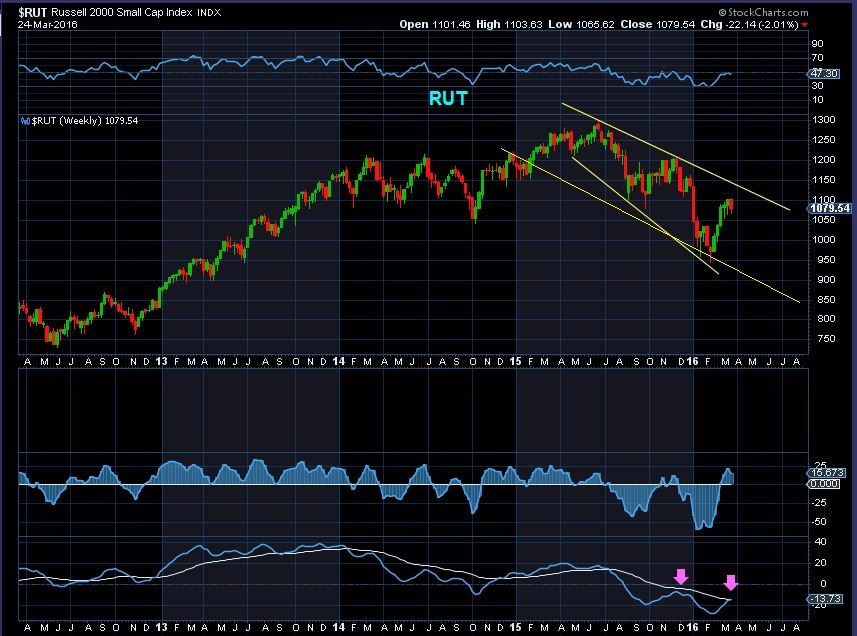
The RUT could be a bullish pattern if I make it a wedge as shown. It also may just be a channel dropping lower. I expected the rally when we were at the lows, but at this point we still see a pattern of lower highs and lower lows. Lets give it a little more time. ‘Time will tell’ going forward.
The USD – I am watching it for a bounce here, but I really dont have much to say about it.
.
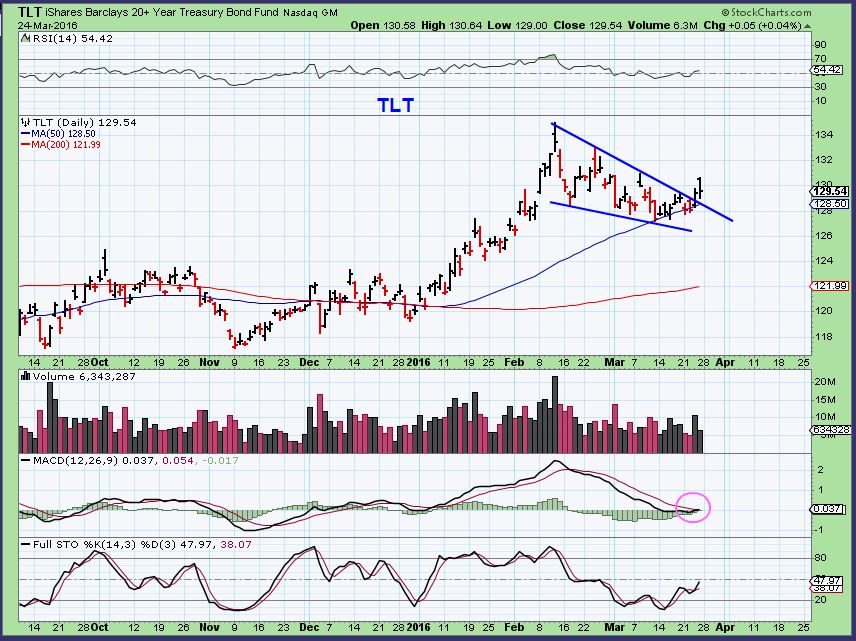
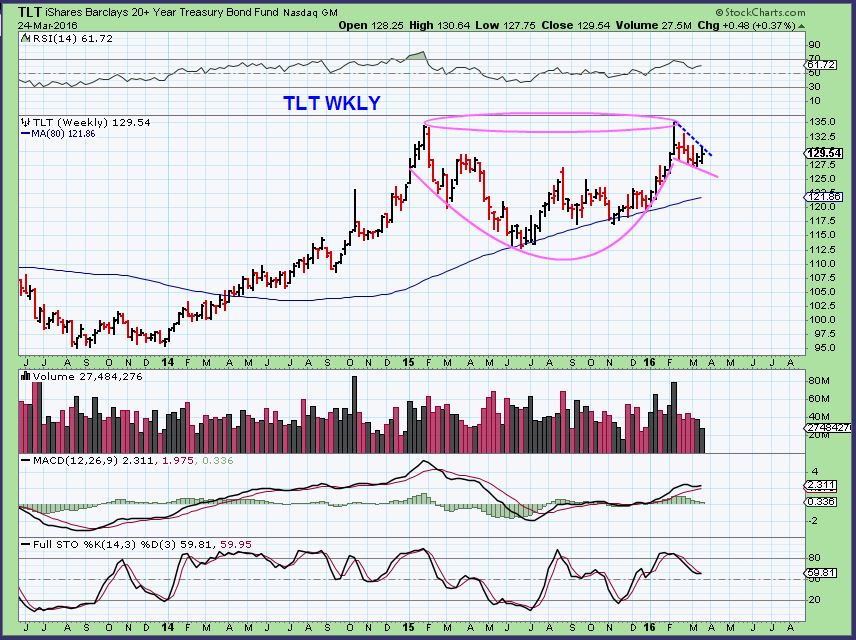
TLT – If the markets pull back, money could flow into Bonds, and as mentioned last week. The TLT looks bullish to me. We know that the SPX dropped almost all of January & into February, look what the TLT did in Jan and Feb.
TLT WKLY
.
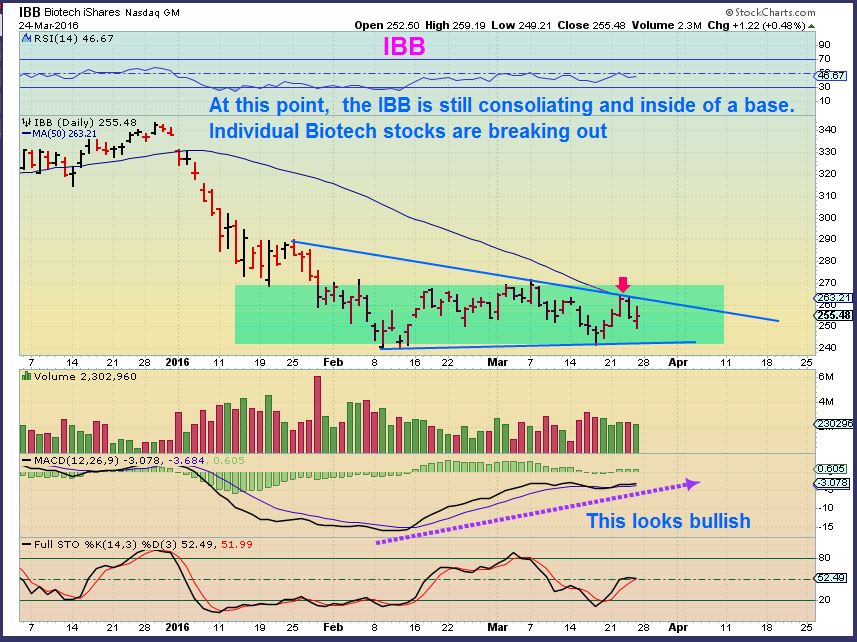
ODDLY – After saying all of that, BIOTECH still looks bullishly set up. It is forming a base and really looks like it wants to break out higher soon.
IBB– Please excuse the typo. Apparently sometimes we call consolidating ‘ consoliating’ in New England. That MACD does not look like it wants to break lower.
.
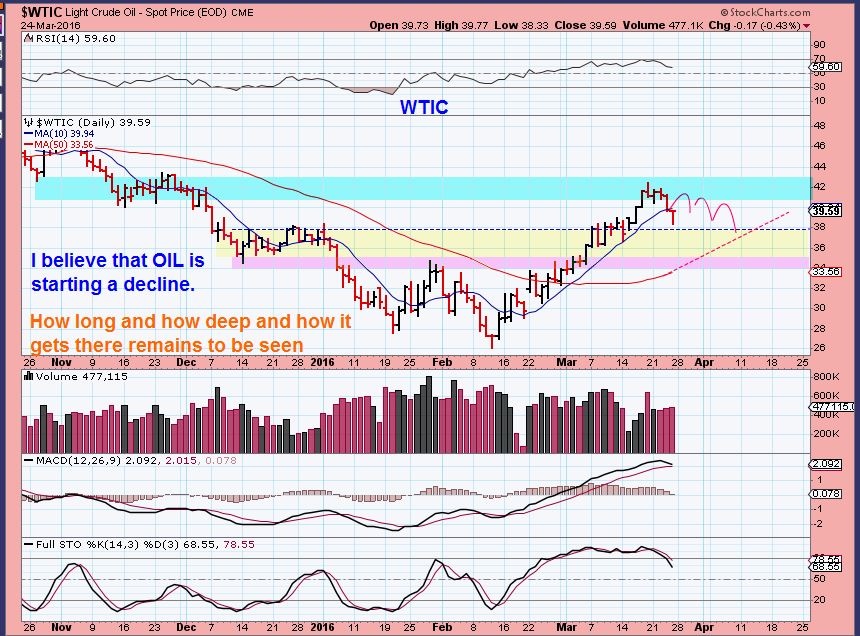
This is the hard part with OIL. Using Cycles : Oils daily cycle can be 30 days long from low to low, or they can be 38 days, or they can be 45 days, etc. You get the point? They are unreliable using cycles to me. So that being said…
WTIC DAILY – Oil is on day 29. It could…
1. Put in a low here
2. Bounce sideways and find a low, as shown
3. Drop to the 50sma soon? I do see support zones that may hold Oils price from dipping too far.
WTIC WKLY #1 – This looks rather bearish at resistance, but if OIL has put in a bear market low, THE LOWS would be in, so Oil would dip into a dcl and then break above this resistance…
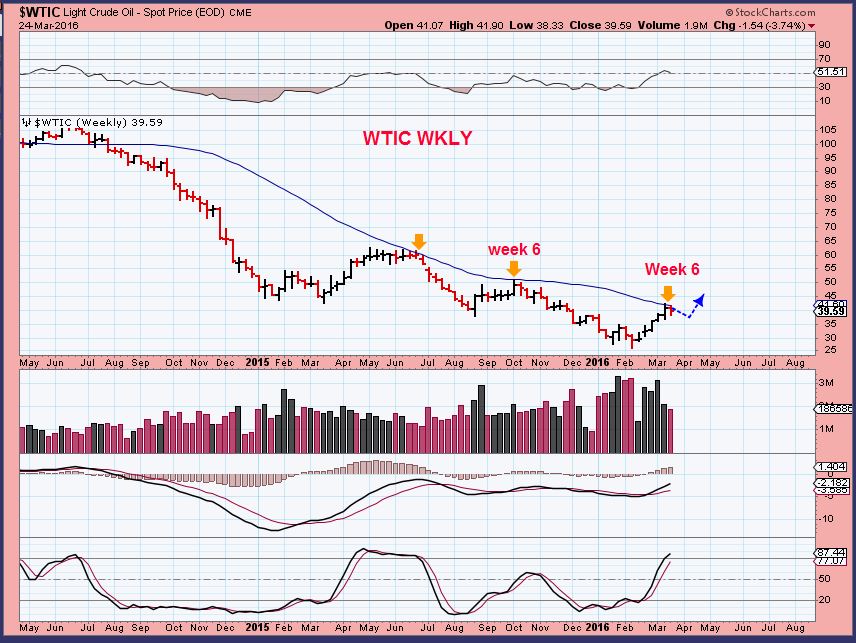
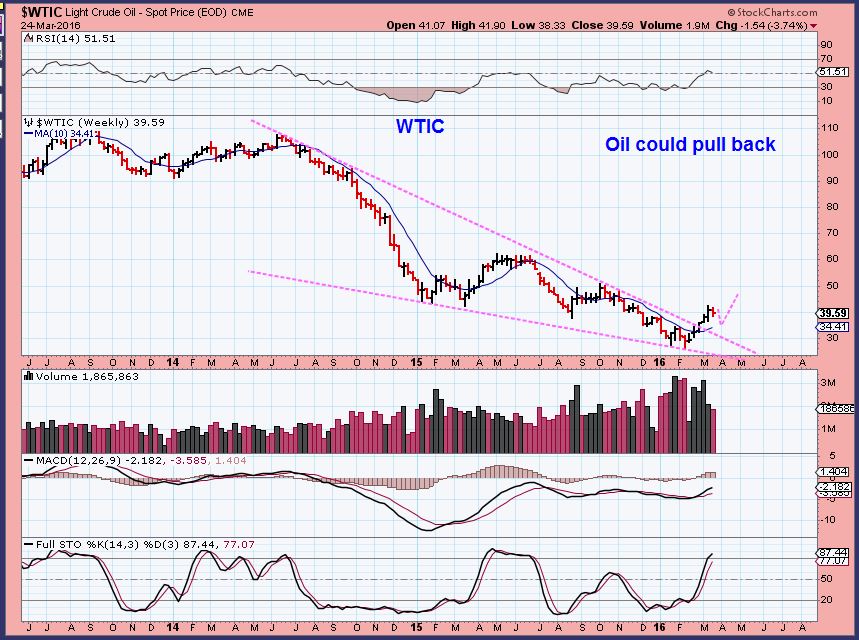
WTIC WKLY #2 – So this is a more bullish view. A falling wedge break out and possible back test to the $34 area, on the dcl.
.
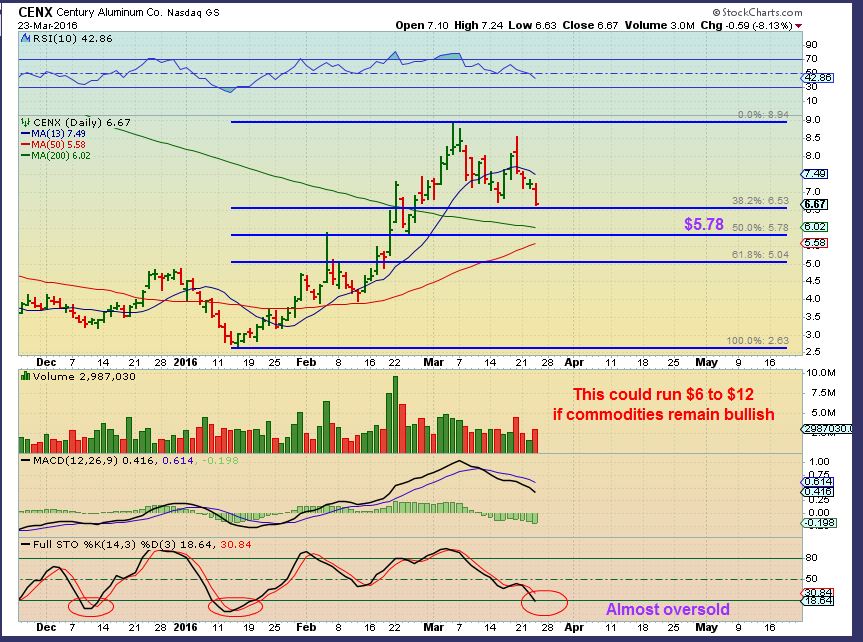
I briefly discussed in a recent reports some of the commodity stocks on our radar. They are consolidating recent gains.
.
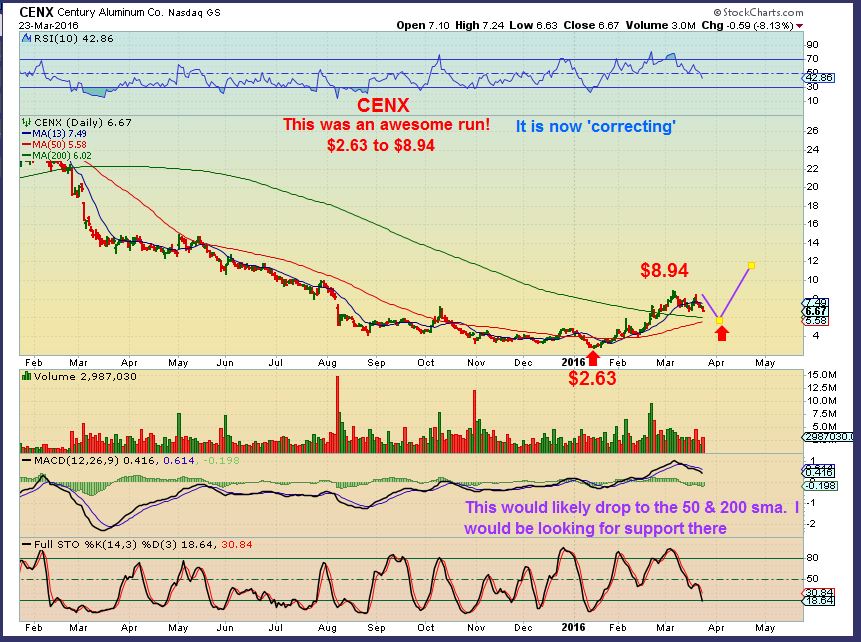
For example I showed in these 2 charts that CENX is consolidating recent gains. Pulling back to various support areas.
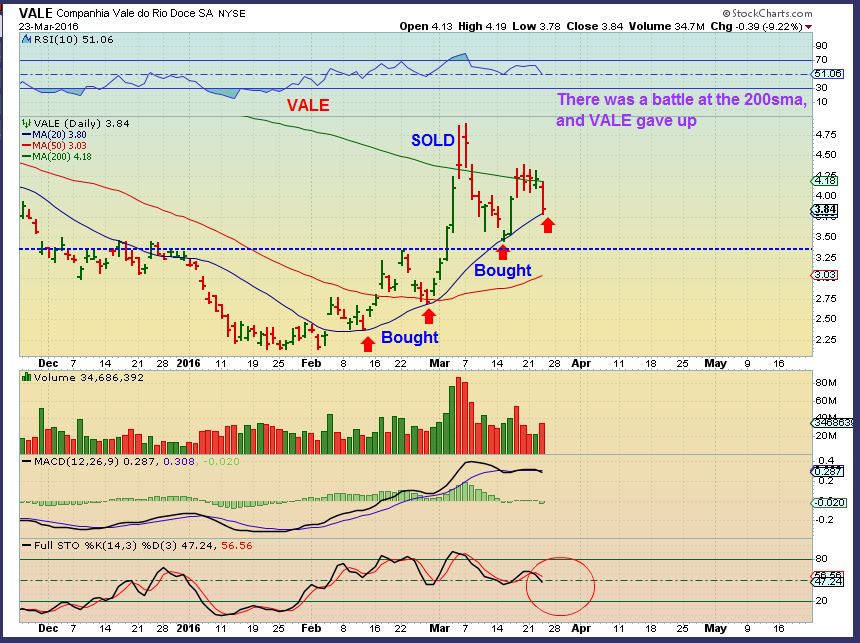
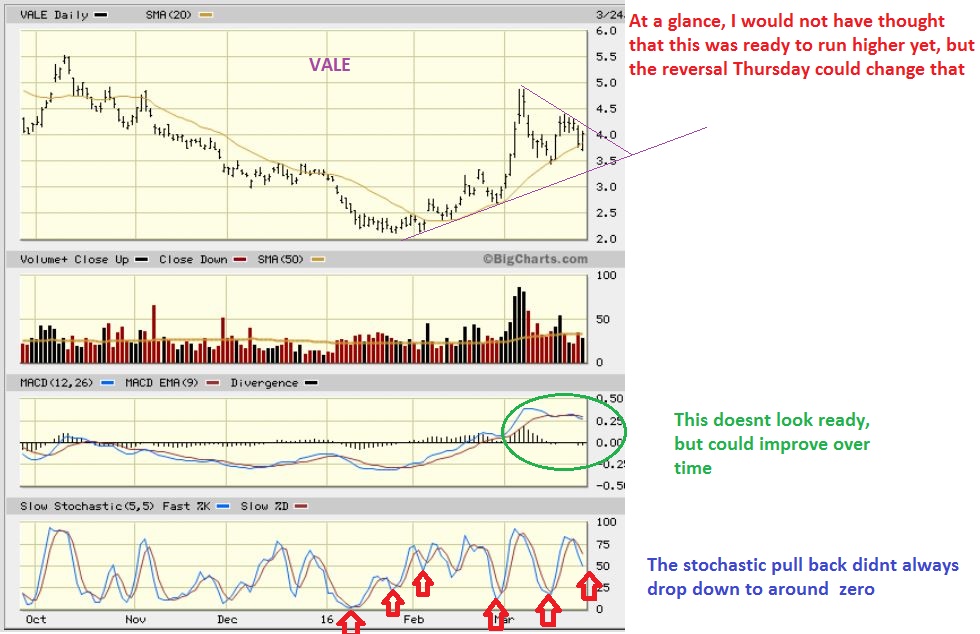
I had this Vale chart in Thursdays report.
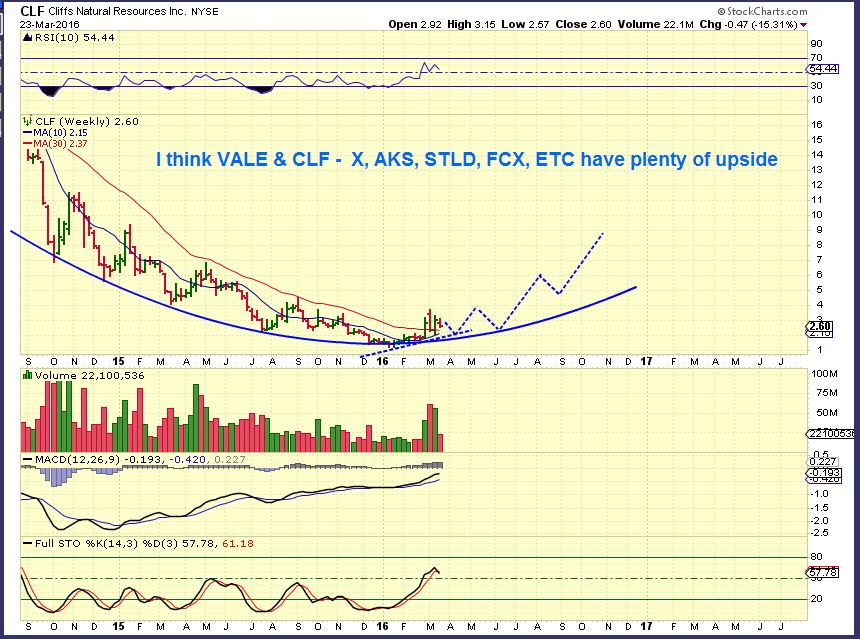
And CLF, etc. If Commodities have put in their bear mkt bottom, these could become BUY & HOLD as time goes on. SO we would want to watch the CRB CHART too.
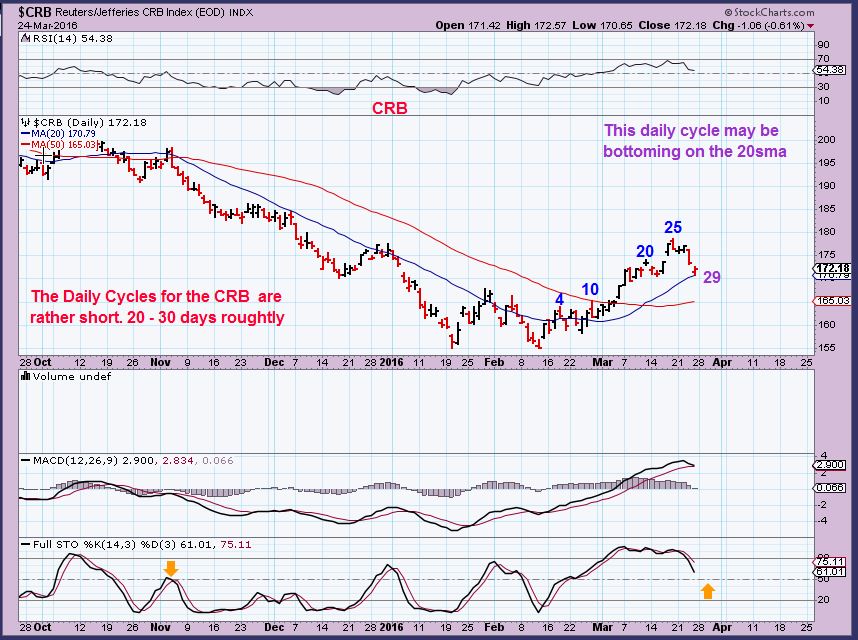
CRB DAILY – The cycle counts on the CRB tend to be under 30 days, so we are in the area for the CRB to put in its DCL (Daily Cycle low). A week ago I thought that it would pull back to the 50sma, but this may be it. Read the chart.
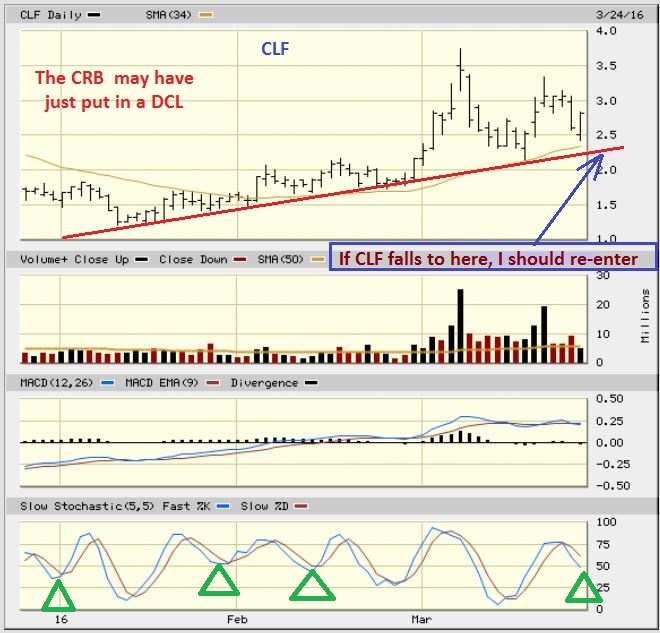
SO I also mentioned that I had a trailing stop on part of my CLF position and got stopped out around $2.75 area Wednesday. Thursday saw a reversal and CLF moved higher. I may have been shaken out 
I’m going to be watching how Commodity stocks act on Monday & Tuesday. That was a pretty nice looking reversal in CLF, VALE, and check out AKS. The CRB is due for a low.
.
Gold has begun the anticipated pull back. There is plenty of time for this to drop, so even if it BOUNCES this week ( oversold bounce) , I will resist thinking that it is a buy.

GDX – Again, topping can take a while, because those that missed the rally are eager to buy the dips. I also think this will drop for a while. Read the chart.
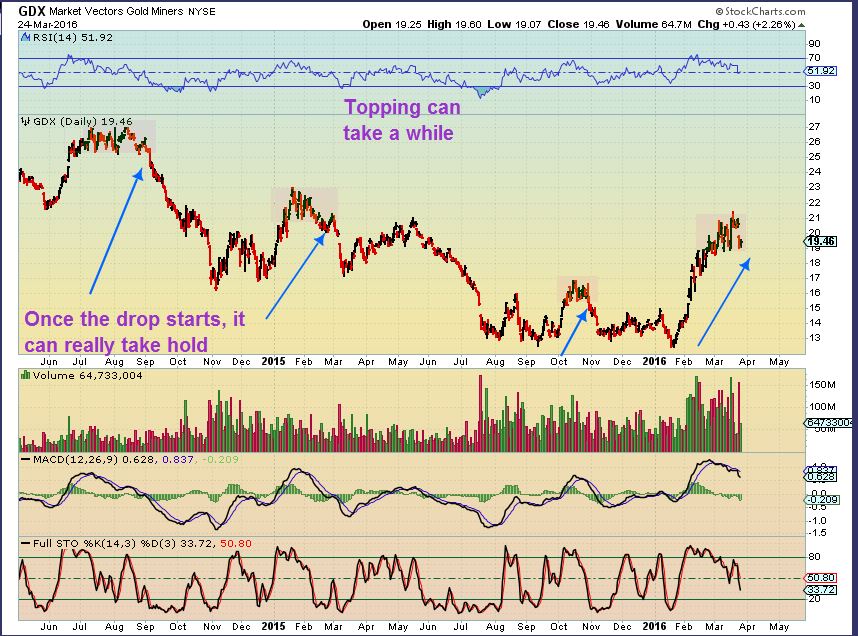
I will monitor the pull back of Gold and Miners in the future reports. For Monday & Tuesday trading, I am interested in watching the IBB and Biotech stocks and the CRB and the commodity stocks that we have been following. They HAVE NOT been following the CRB step by step, but if the CRB just put in a DCL, they may be ready to try to make a move higher. I’ll be watching X, CLF, AKS, VALE, FCX, CENX, AA, ETC . I want to see how they act, because they are in areas where a move higher could begin. This chart from Thursday would be Vale , for example. It didnt reach the support line (Blue dotted) again, but has been reversing at the 20sma. Vale reversed Thursday, but I honestly didnt think it looked ready to resume a rally yet. That is why Monday or maybe Tuesday should be clarifying.
So that’s the weekly wrap up. Expecting a pull back and a little bouncing around in the general markets, so it isnt a good time to recommend buy set ups there. Even shorting could be tricky. I’m watching the COMMODITY and BIOTECH STOCKS ( and maybe some Energy stocks, since Oil can bounce around until day 35 or 40 or 45 ) going forward Monday and Tuesday. Areas to buy may present themselves there.
.
I hope you all had a restful weekend,
.
~ALEX
If I was looking at this chart, I would have thought that it needed more consolidation time. Maybe another drop to that trend line, especially with the MACD crossing down. A RALLY from here would obviously change these things, but it seems early. We’ll see early this week.
.


thanks, as always. I hesitated sharing my research before tomorrow, but since your posting is here…..
As long as WTI cooperates, I would appreciate knowing if you think the timing is ripe now for SDRL. ER was 2/25 with a very solid beat. EPS growth was 84% (Q3 .21 / Q4 .54). PE is .60. Up until 09/2014 SDRL issued dividends $1 per Q. Quite a bit of debt though (Seeking Alpha has a good write up March 3) 2016 looks good in terms of servicing debt, but 2017 is a risk if the oil rebound fails …..
I’m thinking this looks good for a run?
Hi Ms C.
Now this is a tricky one. I kind of like that it fell below the trend line and re-gained it. (refresh)
.
I see the reversal Thursday, and it looks good, but I also do see a bit of a reversal last week that didnt work. Also the 50sma is at $2.60 and I cannot rule out that buyers are waiting to see if it will drop to that area.
So with all the work and research that you did ( That is good stuff -I love that you dug in and researched what the company is about) I would just sum it up with this…
The solid beat on earnings and PE are commendable, but it didnt rally last week as a result of that, so it may not rally this week as a result of that either. Maybe it will rally between now & a future date, so What is it waiting for?
MAYBE it is waiting for Oil to bottom & rally? If that is the case, it could possibly go sideways here until the 50sma catches up. On the chart below (refresh) You’ll see price under the 10sma. I would look for a move above that as a bit of a sign of strength. I dont want to talk you out of a trade that could work, but with the 50sma 70 cents below – I am just a little hesitant that it could go there.
.
So I leave it up to you, and just add that additional thought for consideration 🙂
.
… #InsideChartfreaksHead
… good stuff… i luvit..
Its my favorite part of CF…
thank you.
… reminds me of when i was young.. riding around. In my daddys front pocket sayn… “but.. why daddy.. why?”……….
*welll… it is possible there mighhht be one thing i like better…. (snicker):-)
Great working with a Master! Putting the 50sma in is an important reference. My plan is to scale in with a small order with a 1.5% stop ; if it falls below the 20sma, see what the volume does as it nears the 50sma – (like the NASDAQ
historical charts http://www.nasdaq.com/symbol/sdrl/historical
volume and price action on 3/3 and 3/4 are remarkable)
My charts are over-simplified, but I wanted to show the monthly on this….. Lots of gaps that need to be filled back towards $6.
I think you are absolutely right about what drives this next, if oil drops so could this, so I’ll proceed with caution.
When I am doing my own charts, sometimes the simplest ones stand out the most. I tend to show a few points of interest to show ” a few reasons why” it is or isnt bullish in my reports, rather than draw 3 charts of the same stock with 3 bullish reasons why, but a simple chart is often very clear.
Thx 🙂 I was just posting as your comment came up. PS keepin’ an eye on nat gas this morning–looks promising so far, but it’s still early …..
Oops, oops, forgot to add my chart, (pardon the simplicity)
I’m not seeing any dividend payouts since 2014? Are you sure they are still paying out? Seems to be a good company fundamentally.
She said that
Speed reading, miss read it. My Bad
They were issued up until 9/2014- then ceased. So no guarantees, only unhatched chickens to consider 🙂
Excellent report Alex !
Thanks for keeping us abreast on TLT, which had a SAR buy signal last Thursday……
Hey Ken,
With that reversal Thursday, I wouldn’t be surprised to see ti dip down and back test the trend lone and the 50sma.
It does look good.
Great report, Alex – glad to be a member. I can tell you put a ton of thought and hard work into each and everyone. Thanks.
Ditto.
He most definitely works Hard for us….
Why the capital ‘H’??
Thanks Rob (And Maria), I appreciate that.
Yes, and I put an EXTRA 5 minutes into this one : )
Excellent. . Excellent. .. CF :o)
Especially appreciate the addition of the voice of reason & veteran savvy .
You are a true scout., sentry, mentor …
… bustinBalls with chartfreak &friends… priceless. Wink.
Alex, sorry for a novice question, but since you are saying that the CRB could be moving higher shortly, and you mentioned AA, CENX, VALE etc, am I looking at base metal companies in this sector? I want to buy Canadian companies, would a mining company that focuses on copper be a company to look at for this sector??
Yes Rob,
In the past few weeks, we have been watching/ Trading many of those stocks as they moved off of their lows, and rally, and then Pull back a bit ( you can see the charts on the list that you mentioned above from the report, and add TGB, STLD, SCHN, and so on. Many of those stocks in the metals sector have done well).
So If you find one Canadian and want me to check out the chart, I can do that. You can mention it here, I’ll get it in the morning.
Capstone mining (CS.to) stockcharts. They are a copper miner. Their 3 yr charts is crazy.
Hi Rob,
It does look good and it has acted similar to others. I’ll attach 2 charts. The hard part is that many of these do not look oversold yet on the stochastics, but in strong moves higher, the stochastics can just drop 1/2 way and then resume upward. So an entry is a tough call.
.
If it is a stock that I have been wanting to buy on the pullback (And earnings are already released, etc) I often start a position and add if drops to a downside target .
Refresh for 2 charts , wkly & daily
.
Thanks, Alex. I will keep an eye out for the stock and hopefully it will become more oversold. What does the ‘tight sideways pattern indicate, on the weekly chart? Thanks again!
It is often bullish if that sector is acting bullishly. It isnt selling off after a run higher, it is consolidating sideways and can break out higher
Jinx! (same answer, same time!)
🙂
The high, tight pattern on the weekly looks great! It shows that it held the price from the initial impulse move instead of giving it back. It’s making its next base (for a continued move higher) now at a higher price level. Now, while weekly looks sweet, that doesn’t help you that much with an intra-day entry point. Scaling in likely the appropriate choice. GL.
Clf poised to explode. Love that chart same with cenx
Check out a 5 yr weekly or monthly. Kind of a WOW moment if this fully recovered, but I dont want to get toooooo crazy 🙂
Ibb is killing me! Individuals are breaking out, how much does valiant have to do with this sector?
Top 5 holdings are CELG, BIIB, AMGN, GILD, REGN
I think only GILD and REGN are above thier 50sma, the others are basing under theirs, much like IBB. Still in a base.
Careful…pick up is in LABD..,
Oh f, f, f… I was busy watching NAT
Gas and live crude and SDRL jumped 5% . Not going to chase ….. But crap.
Looks like it may just be a boring Monday. Quite a bit of sideways moving
Yep, I’m bored. Most of Europe was closed which won’t help much. Interesting IWM now on lows and GDX and friends underperforming spot, which hasn’t been the case recently. Spot VIX up btw 6-8% but VXX and other products down, IBB starting to sink again. Nothing much else going on.
Too early to get the shopping cart out on some energy plays? See my post below!
GEVO looks pretty good too, with better volume surging in.
You can buy anything you want if the set up looks low risk.
If you are looking at a stock sitting on its 50sma and it happens to be a 50% retracement, you can buy with a stop right below, but right now OIL is like a wild card. I hate that it has had daily cycles that bottom in 30 days, or 38 days , or 44 days 🙂
If we were on day 44, I would say, The bottom has to be close enough if an energy stock is acting correctly.
Right now its tricky, because if OIL sells off to $32, what will energy stocks do? If it bottoms here on day 30 or 33 this week, energy stocks would likely go higher.
So if you see what looks like a low risk set up & earnings is already out, you know where Oil is and that is a tad bot of a risk factor.
RIG is real attractive to me here at 78.6% retracement. PACD and BAS holding at the 50sma after 61.8% beat downs. NADL recovering off of 61.8% retrace. RIG and PACD have reset their RSI and %R to oversold and are both companies with positive net income.
Double bottom on RIG on the 15min chart. Should at least get a short term pop. $8.97 would be a perfect low risk entry.
BAS looking close, almost ready to add/but but oil wildcard like Alex said. Pretty low volume so far today on pullback. Could accum here with stop below 50 or last Fri low.
I like PACD more, its been beat up more, less room to sell off. RIG moving higher. BAS does have some nice tails on the daily chart. I always jump in to early. Don’t anyone follow me.
I like the disclaimer : )
The funny thing is that at times, jumping in early or jumping in late can get you the same price
I do like the looks of the ones that you mentioned. Some really big moves higher % – wise. I had drawn BAS Thursday morning ( I may have posted it in the comments then?) , but with OIL being so iffy, I didnt post any energy stocks for now. ( I will attach) .
.
That is so true about getting in early and late. Don’t know why my mentality is to jump in early and out early. I do the same on both ends. I want to pick the bottom, and protect the winnings? Hmmm,, I have to work on that. Help me CF!
Bill, Maria could have a field-day with that comment 🙂
Oh, damn! Yes, she will.
Tho are you watching Vale? Bounced off 4.02/4.03 — moving up for now…
Vale is acting well, I already own some from the reversal below at the 20sma ( $3.50ish).
Refresh- Possibly could drop to support again and that rising trend line. If it goes sideways to that trend line, the 50sma may catch up too. I do like the chart.
I will add if it does drop and still looks healthy. I will add a tag on the 50sma if that happens. If it breaks out higher, I may add then too.
Right now I still see this as a healthy consolidation
Sweet 🙂 thanks. Your charts and explanations are really helpful… (Coming from someone who started by “investing” on fundementals- then moved to scalping on the daily with leverage-) charting is harder than it looks!
I started with fundamentals and basic T/A too , but found that I couldn’t even dare to scalp anything based on fundamentals in bear mkt rallies, so I had to look at things differently for bear mkt rallies and bottoms/ bases ( even temporary bottoms).
Vale sitting right on that 10sma right now and moving higher again. Not Bad.
for me, FB was a good scalp or swing. (Though I kept a core) It can trade in a defined range for days… After each close, I’d check the high/low of that day. It used to have a distinct pattern between 2pm and 4pm when it would dip and run (that I attributed to mm,s coming back from lunch -just a guess)
I’d buy 1,000 shares at the low and sell them that day … Or sometimes the next… .
It got boring after awhile and then I got spooked with the big sp500 dips.
Crazy thing tho, it’s still crankin’…,
Anyway, I’m more challenged with gold and oil plays..,.darn tricky. I’m thinking this is a really bumpy road, but the payoff will be worth it if I can just hang..,
Thanks for all your guidance.
Long winded today (sorry. Spring break. Slow market. … 😉
MsC please expand on your FB trade? Intra day, 1 hr chart?
You mean how I used to trade it?
Ya, I see the up channel with moves up and down within the channel. How did you pick the high and low?
Ok– and please Crystal is fine. Kind of regretting the Ms part (Crystal is
such a “hippie” name I thought I needed the ms to be taken seriously)…
Your trading platform should give you the high and low in the quote for the end of the day.
If not, I kind of like to geek out at Nasdaq.com. Type in the FB ticker and then click on the “historical quote” tab.
I haven’t checked out FB in a while… But I am looking now
So it’s at 113 which is high and with the SP500 toppy , I get nervous (but this could have a life of its own)
Anyway it trades within a $2 to $4 high/low spread on any given day. Make a note of the low and the closing price – they are always about $1 apart.
The next day — provided the market conditions are right (no pre fed meeting– spy is acting right- overseas market did okay the day before ). Watch FB – it usually opens higher then will dip lower — when it drops to
$1 below the previous day’s close I’d watch the bid/ask and the volume
If the volume picked up and as it started coming out of the bounce, I’d buy 1,000 shares with a hard mental stop– you can’t put in a physical stop as the mm’s will take that out…
It’s boring to watch and wait, but it’s a bit of an adrenaline rush– and you have to be swift and keep a clear head and place the order.
Over time,
With practice it’s less nerve-wracking 🙂
Okay, Thanks
ALDR – held a conference call this morning to discuss their test trials.
I’d say it went very well 🙂
Alex clf climbing from lows of the day. Going to get interesting.
BWEN is nice today 🙂 getting close to $3. …thinking if it can break $3, not much resistance going to $4?
i like this stock crystal. it got rejected on the $3 but will be watching closely
Daily volume is light on this .. And very little short interest Would not take much to push this higher if volume picked up 🙂
I was noticing BWEN. Nice call
Sorry to be so chatty today… But TK is pushing past resistance right now…if anyone’s watching ……:)
Nix that move … Can’t follow thru today 🙁
Good afternoon, Alex!
Do you have an opinion on EGO – Eldorado Gold? (yes, I’m stuck in miners)
I’m looking to buy for a long-term hold based on fundamentals
They announced earnings last week and the chart seems to give a pretty close stop loss
I’d feel better if gold had already corrected, but as you say, individual miners can do they’re own thing
Hi Cal, I was looking at Fundamentals in miners last week. I liked RIC, TAHO, and GOLD for companies with a positive net income. I always did well with EGO and AUY in the bull market days! Good luck.
Thanks for that, Bill!
TAHO!!! TAHO??? TAHOOOOO? 🙂
I’d watch the 50sma
hi A.. what you making of UNG & USO today?
UNG brokeout the flag, but USO looking an unconvincing grind along the lower TL…
im still in both, so where would you advise a stop?
im working on 9.86ish for USO, and 6.45ish for UNG..but any better ideas welcome.
$neon, its at the bottom of support, watching closely. she can pop anytime