
The Turning Point
It doesn’t matter whether markets are rising or falling, sooner or later, they hit a turning point. We have a lot to discuss this weekend regarding those turning points, so lets dig right in…
.
SPX – Whether we started a bear market or not, I still expected a strong rally when we were at recent lows. It would draw in bulls, but what comes next after 6 weeks higher?
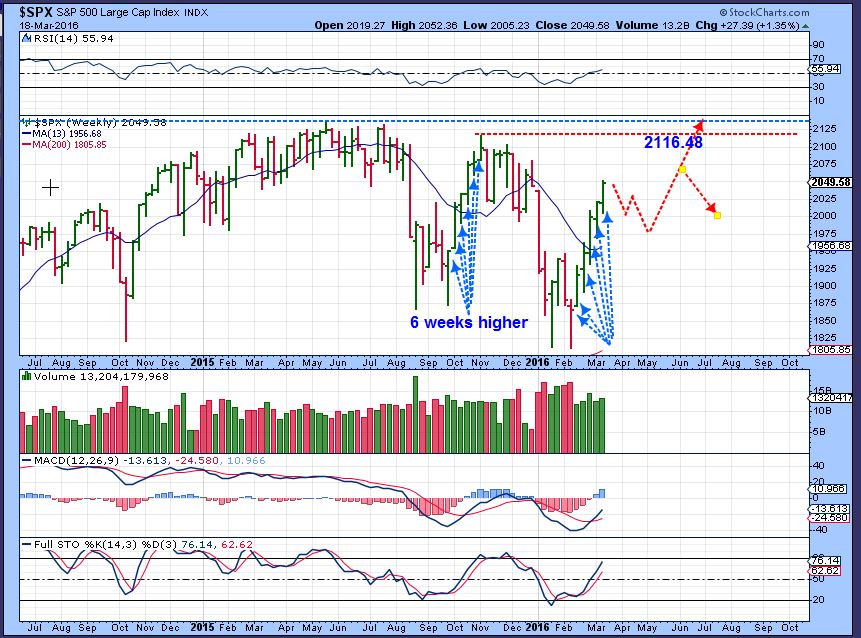
This rally has played out pretty much as expected, but I want to point out some interesting changes in character that could affect future trades / trading.
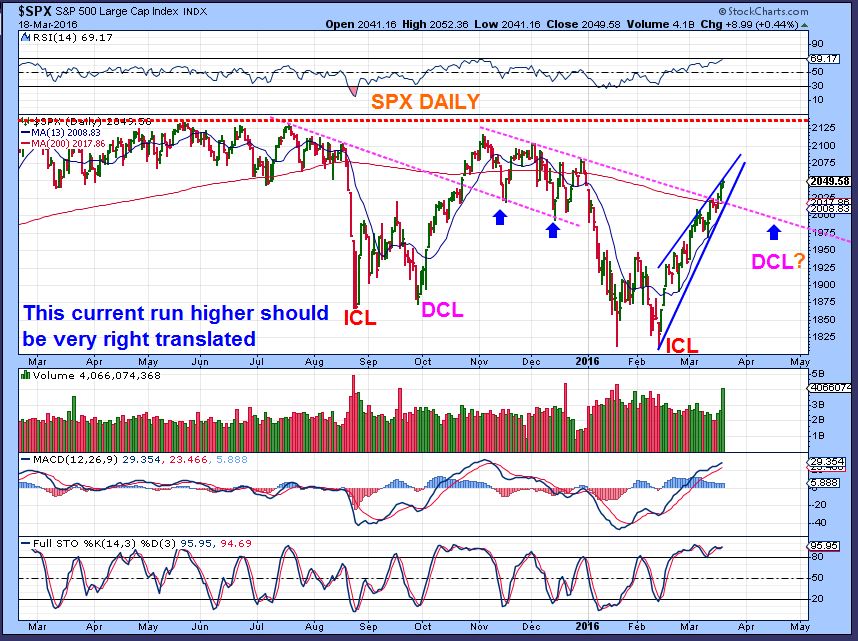
SPX DAILY – Shorter term, this is most likely a right translated first daily cycle on day 25. I’d expect a dip into a dcl, and we have that rising wedge that should assist in the drop.
SO HAS ANYTHING CHANGED IN THE THINGS THAT I LOOK AT NEAR TURNING POINTS ?
.
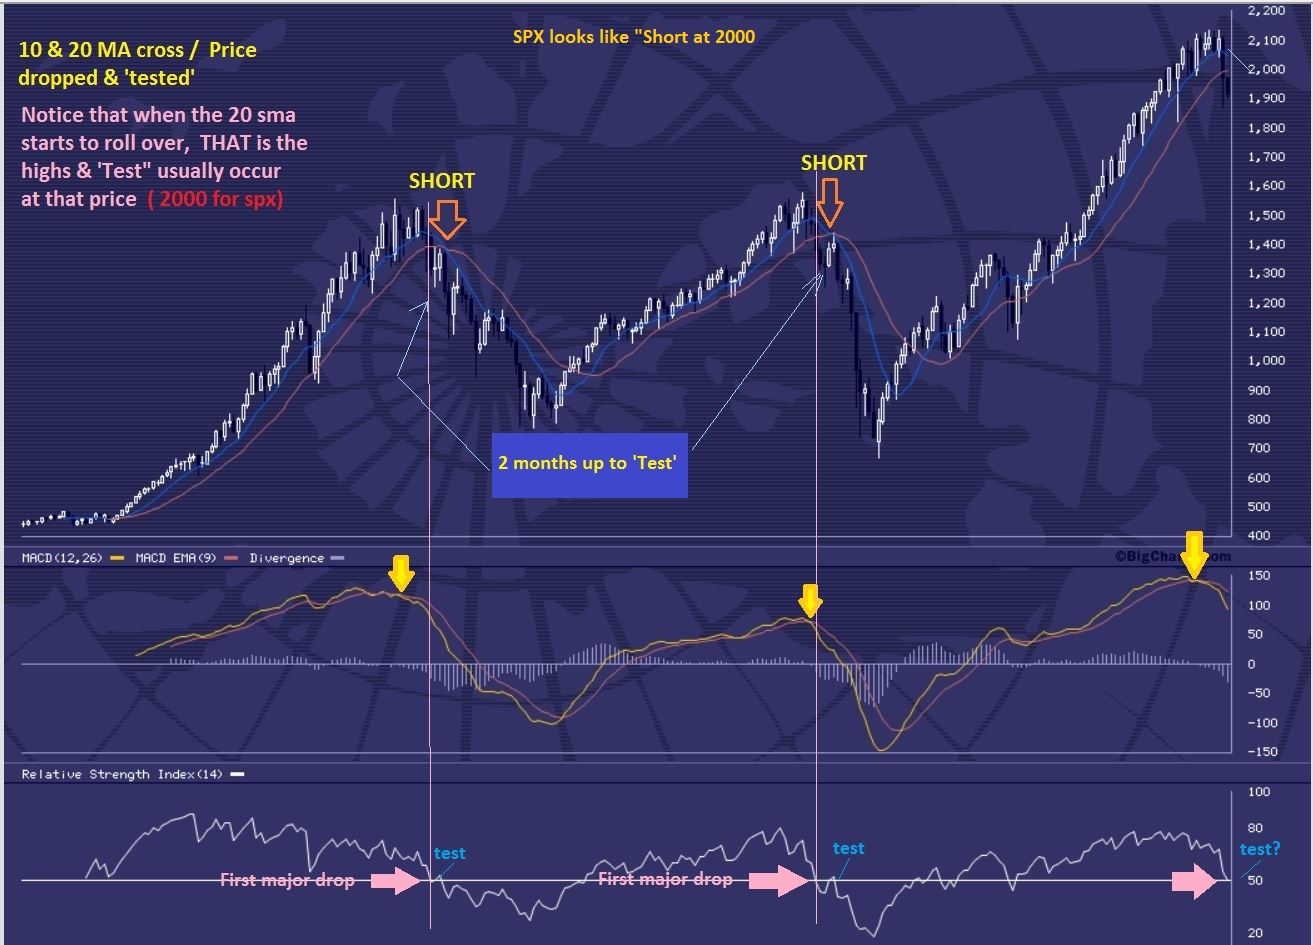
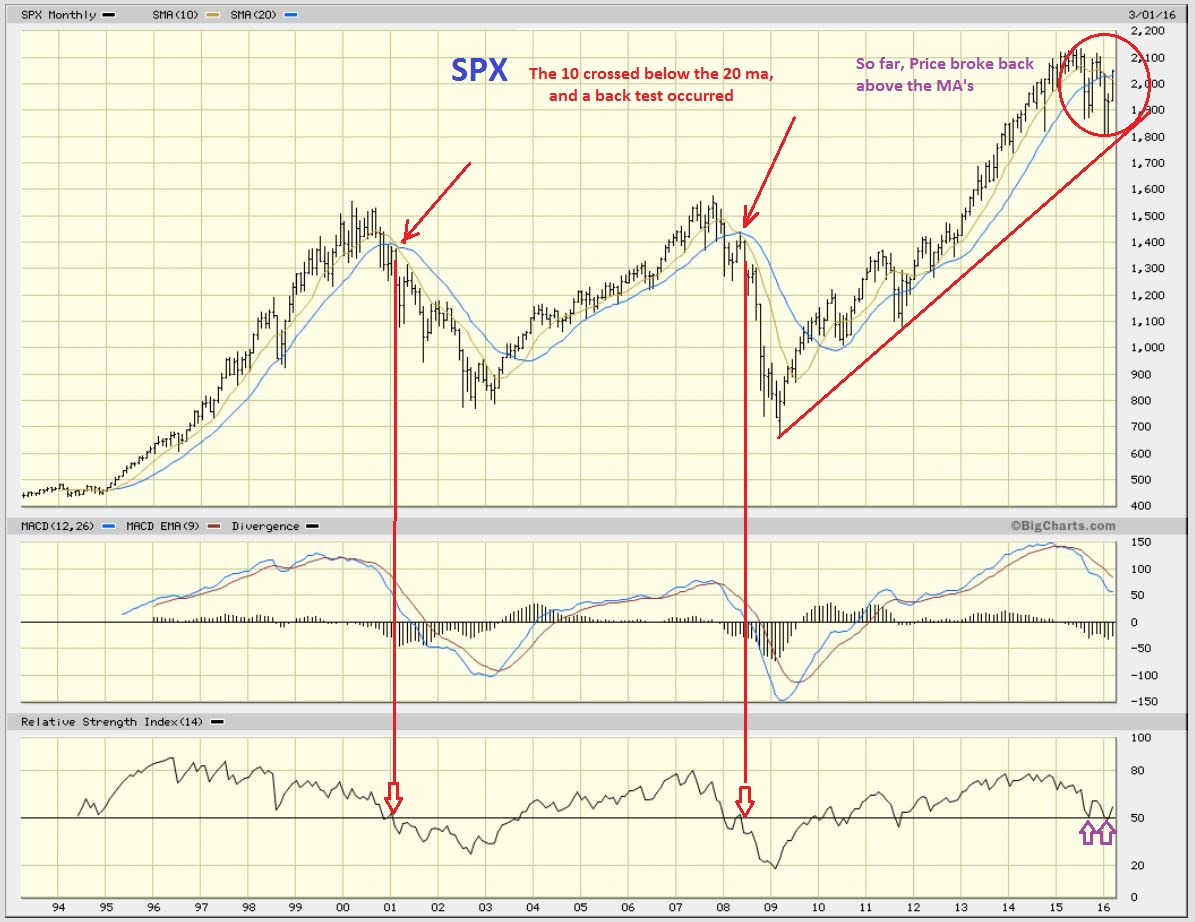
If you have been here for a while, I was saying that the markets had topping action last summer. I pointed out that I expected a serious drop and then I posted this chart (Among others) showing what would be important to watch for.
.
Before we even dropped, I mentioned that at Prior tops, The 10+20 sma turned down, The 10 crossed under the 20. THEN a rally back tested that 20 ma area, and the next drop came. That could be a good place to go ‘short’.
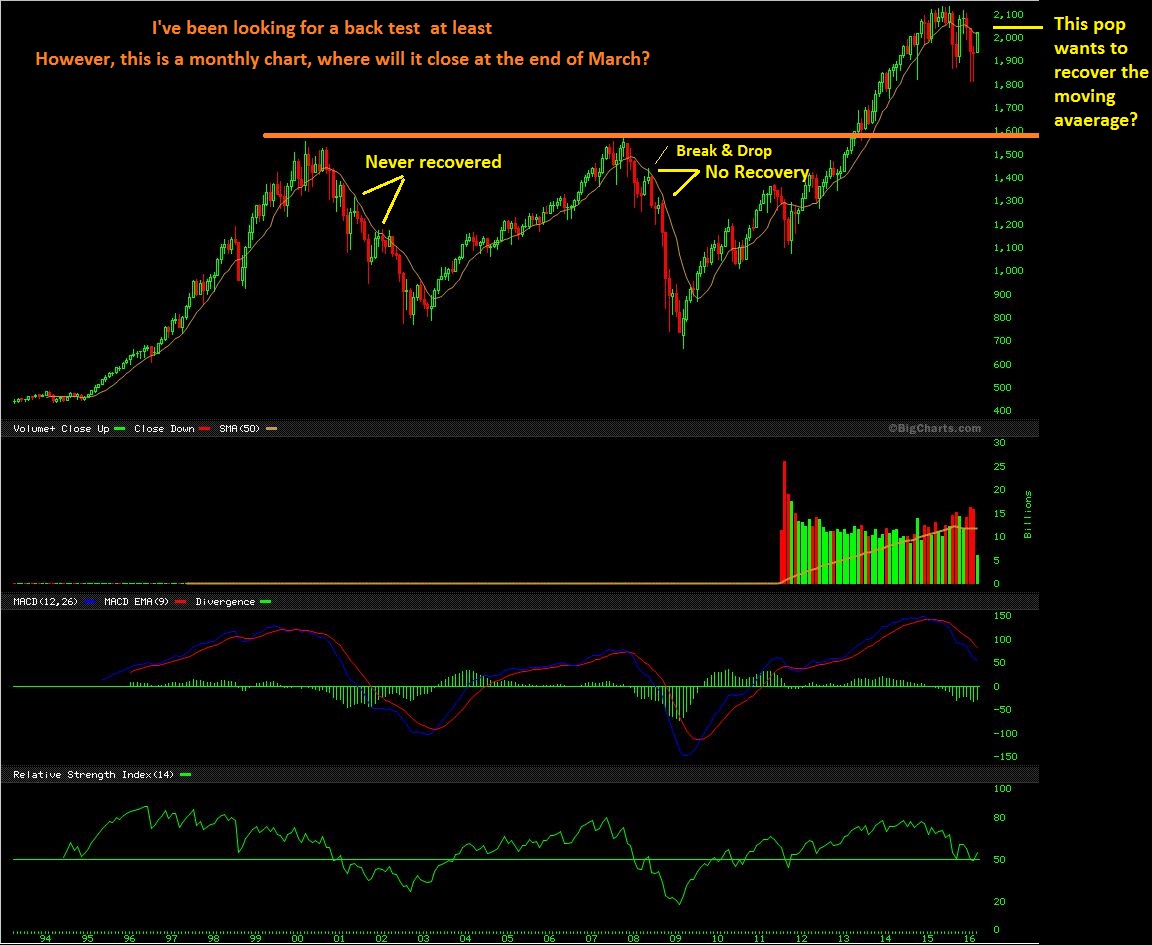
This was last week as we rallied higher, I again was pointing out that where we end at the end of March would be important. It looked like the rally wanted to recover the moving averages. We need to watch that. Lets take an updated look…
Right now, those Moving averages have been recovered in this first daily cycle out of an ICL. THAT DID NOT HAPPEN AT THE 2 PRIOR TOPS. Also the RSI is bouncing off of the 50% line. I said before that it was too early to short the rally in the first daily cycle, and now I am saying be EXTRA cautious even though I expect a dip to a DCL. We need to watch how things unfold here and…
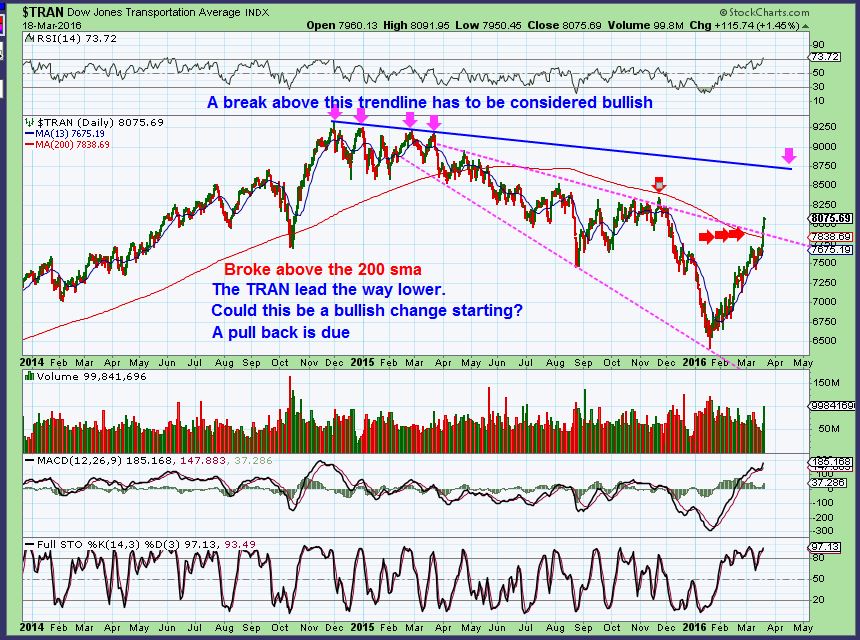
I also pointed out last summer that the TRANNIES were leading the drop. We saw lower lows and lower highs. Now the TRANNIES look to be recovering here, breaking above the 200sma. I see an inverse H&S with follow through. A change in character at the turning points? Stay tuned.
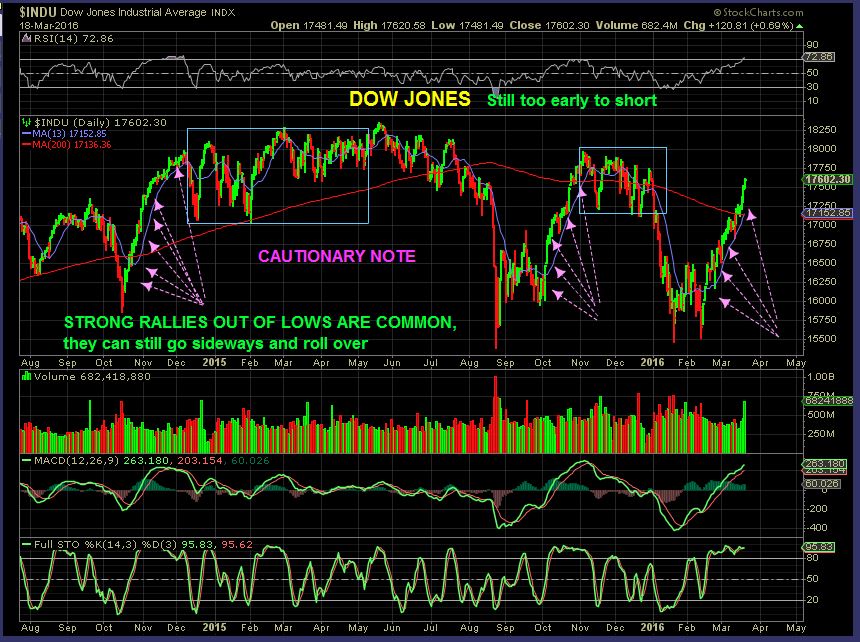
To make a point – I am not just being fooled by a strong rally. This rally doesn’t look much different from those other rallies on the surface, and I remained bearish on those. I am pointing out other differences this time that I see and that need to be monitored with the coming pull back and next daily cycle. And yes, this COULD go sideways and roll over like the others did, but we need to watch it.
.
I looked at some beaten down charts and they have huge upside potential if things turn around. Take a look at a 1 yr chart of the beaten down GPRO, MU, TASR. They could recover if the markets break to new highs 🙂 I already mentioned how the 3-D Printer stocks look to be recovering from their recently hated condition. See DDD, SSYS, VJET, XONE.
.
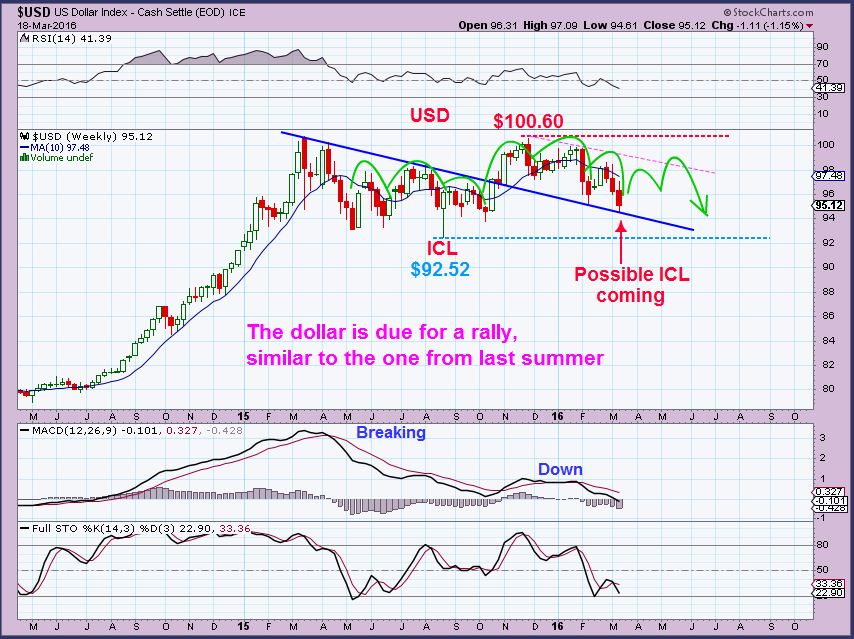
USD – I expected the Fed to finish this drop.
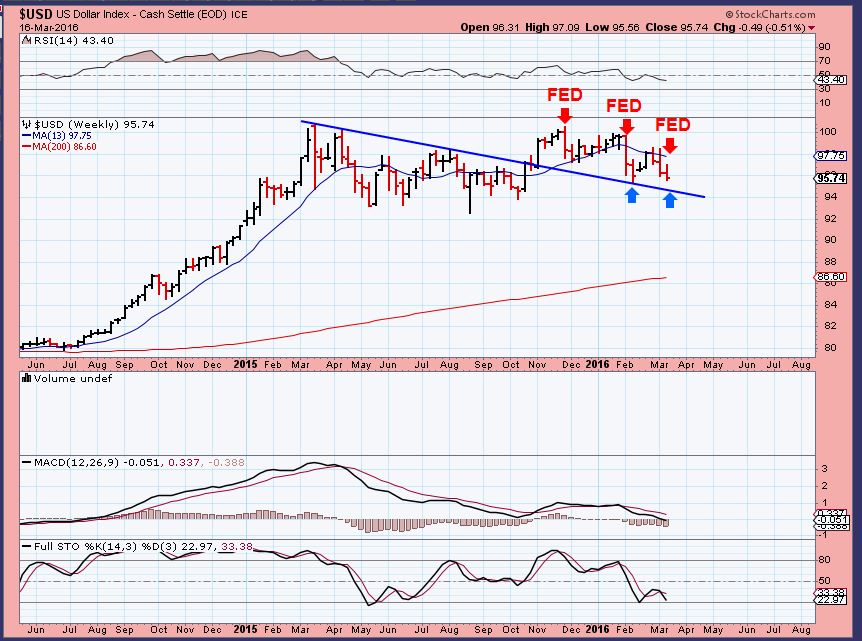
The drop is complete. Now the USD is due for a daily cycle low. It may be a DCL or ICL. I’ll be watching for new highs or breaking down, and that of course will take time.
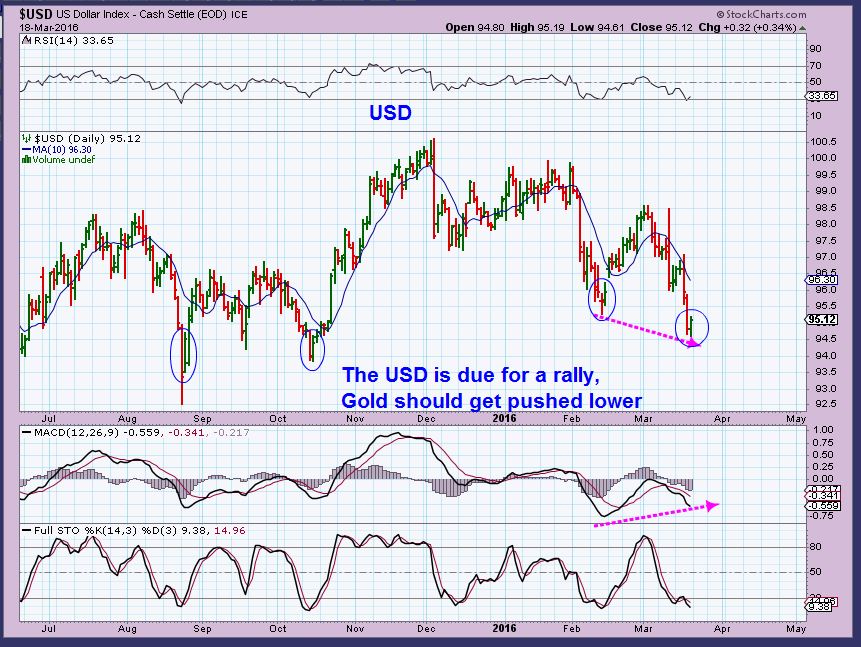
USD DAILY – Divergence and a small reversal that could become the DCL. Gold may finally feel the pressure.
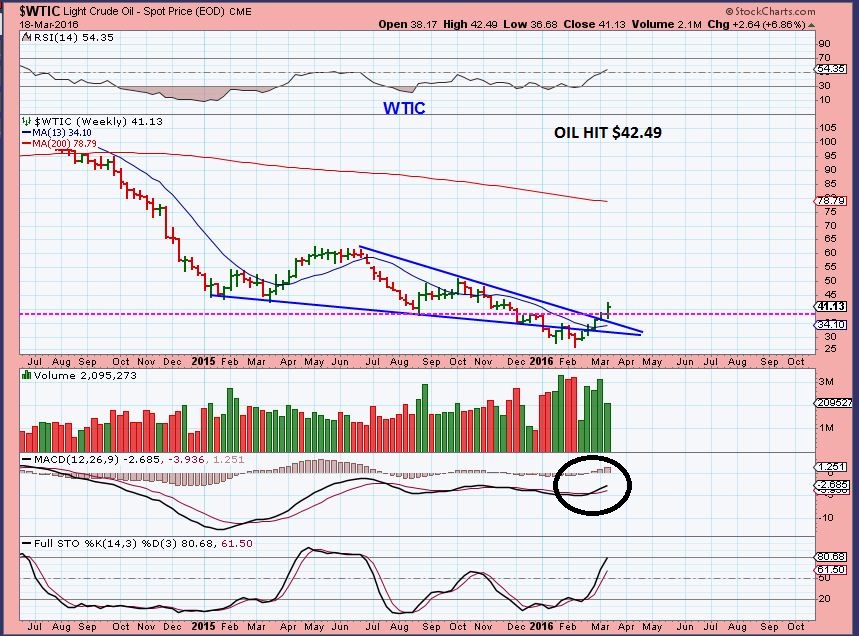
WTIC – Man I hope oil doesn’t hit $44. There’s going to be some big problems if it does! I’ll explain shortly. It did already hit $42.49 Friday! This is recovering from breaking below the lows last August. We also broke from that wedge.
WTIC DAILY – I did point out the break through resistance and the move towards the next resistance area ( $43 ish). Again, I hope this doesn’t close above $44. That could cause some problems!
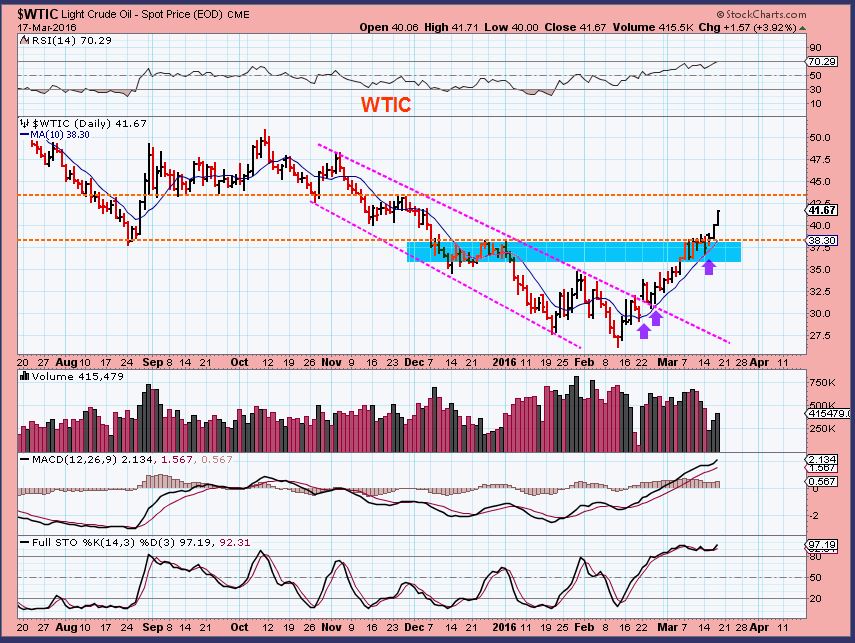
WTIC DAILY – the 200sma has acted like resistance, so OIL may pause here below $44. Boy do I hope it doesn’t just break out to $44, there will be some big trouble if it does! The MACD has swiftly moved higher.
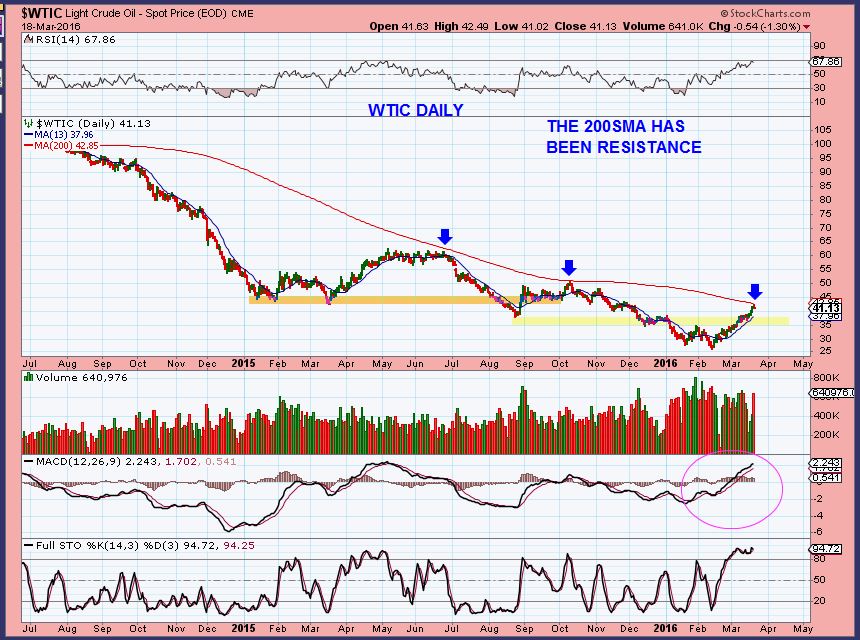
If OIL closes above $44, we may lose one of my favorite contrary indicators. Another one of those guys that loves to make ridiculous calls ahead of time to draw attention to himself. If Crude gets above $44, well, it could signal the end of Gartmans very life.
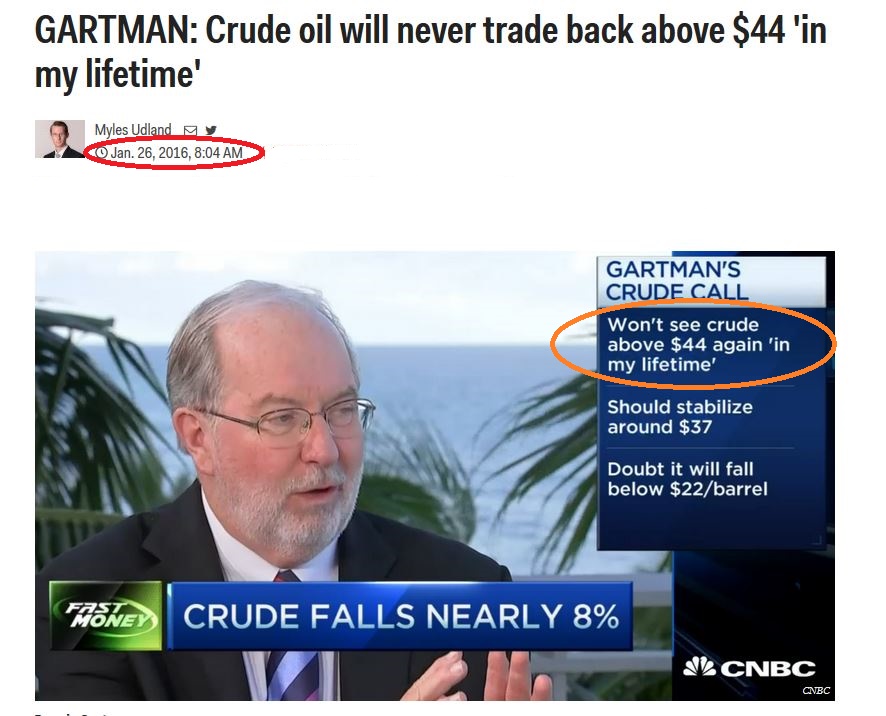
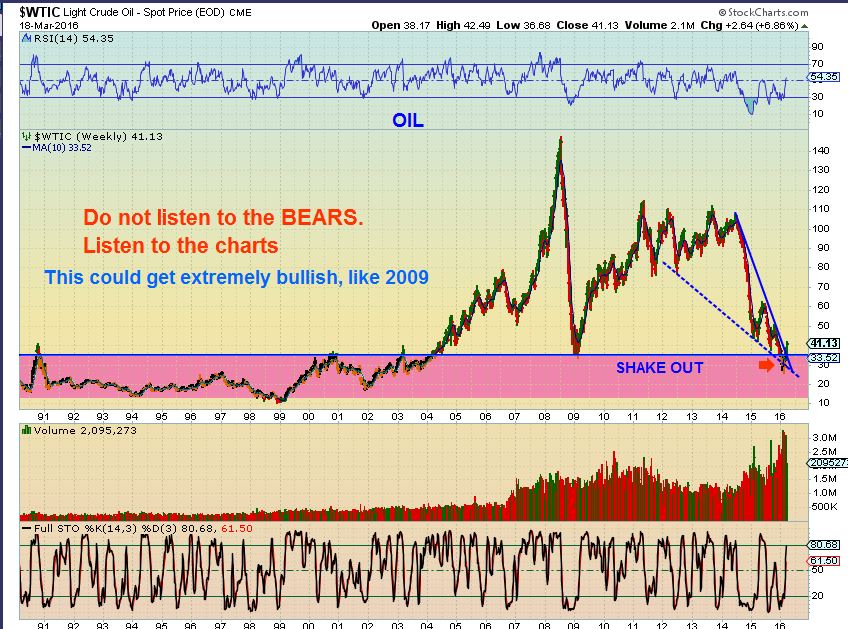
Lastly is OILS BIG PICTURE- Someone being interviewer last week on CNBC said that to bottom out, Oil has to trade at $20’s- $30’s for many months ( to form a base) . This chart says that we have had a v-bottom in the past, so doesn’t that mean that could see it again? We will use the charts as evidence.
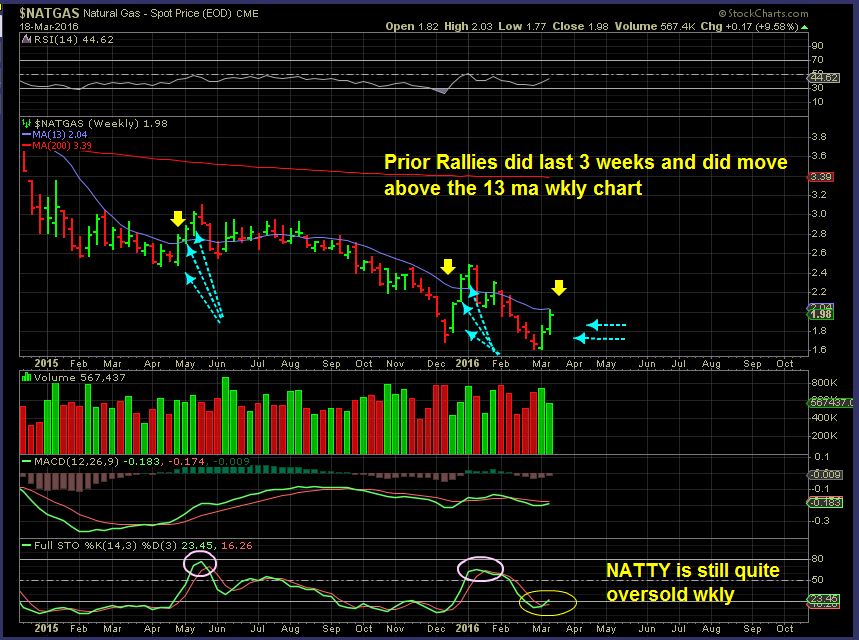
NATTY – Still moving higher. On this March 11th chart, I mentioned that even bear mkt rallies out of lows lasted 3 weeks, so lets expect higher price.
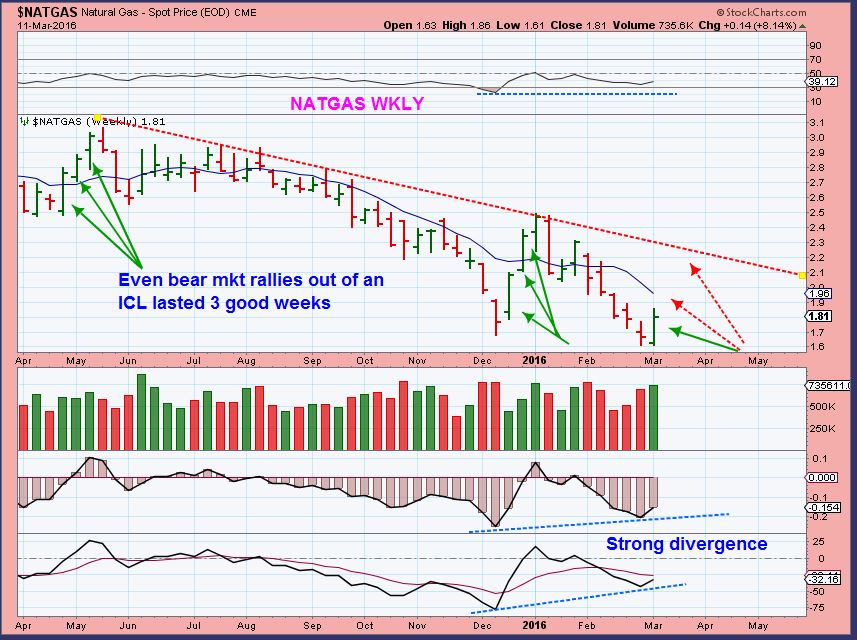
NATTY NOW – We did get another week higher. Maybe we get another, look how oversold it remains on the weekly charts.
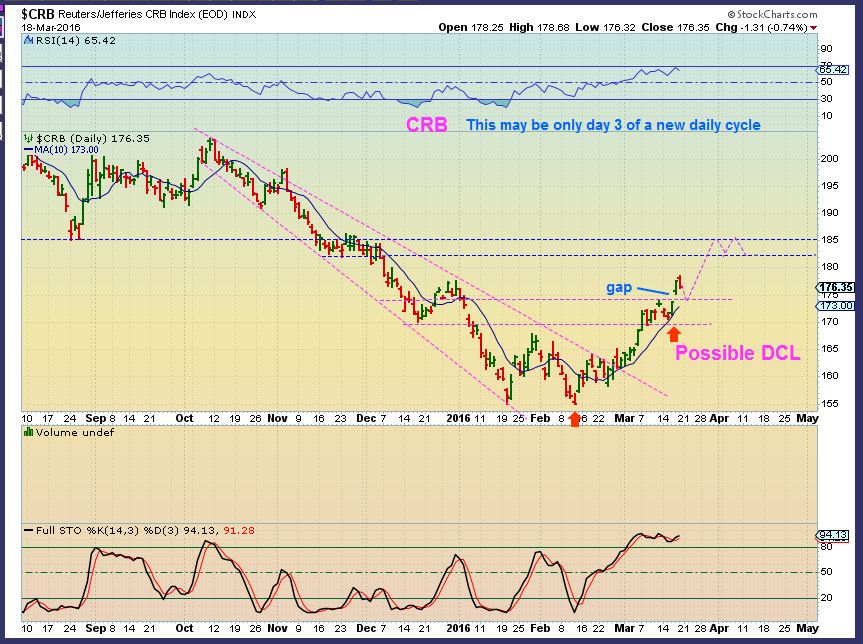
THE CRB – The CRB is in the normal timing to find a dcl ( 20-28 days roughly). We may have just seen it. If Not, a pullback in the markets could have this drop into a dcl, but timing wise it is getting late. The CRB may just ride out the 10sma like Miners did.
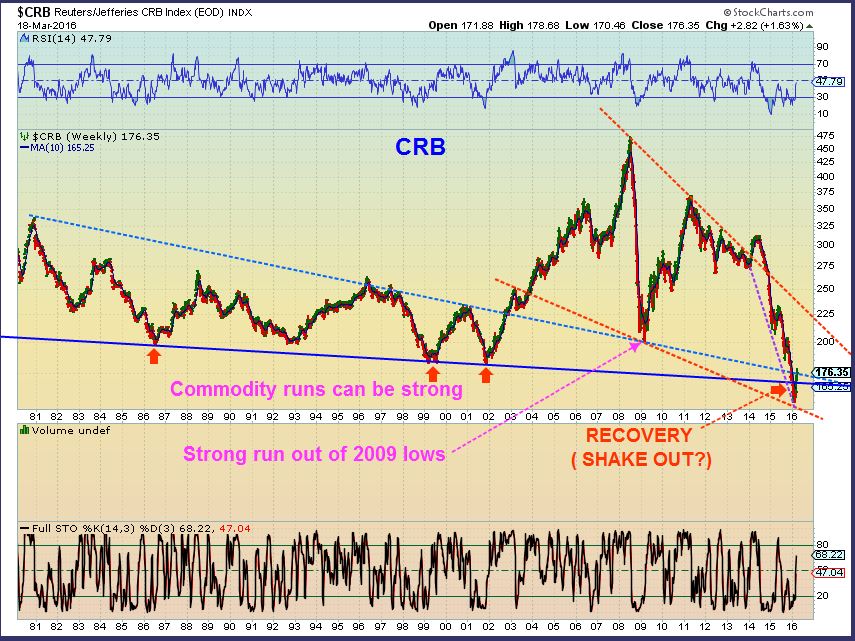
CRB – The Big Picture. The commodity runs out of the lows can be steady and strong. We have been monitoring Steel, Aluminum, iron ore stocks, etc.
GOLD
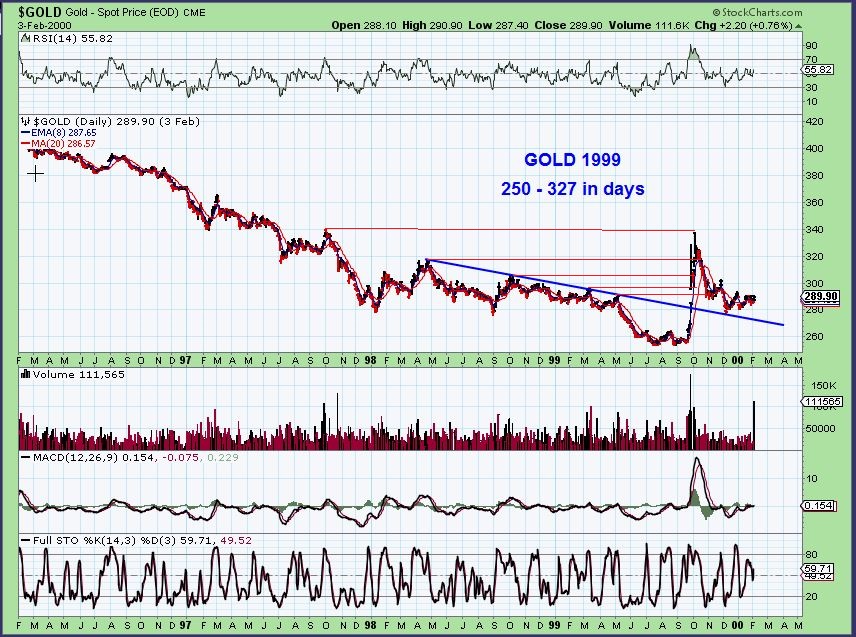
To shatter one illusion, I wanted to post this chart. The Illusion is when someone says , “Gold has run up so fast and strongly out of the lows, that all the dips will be bought by those dying to get it. Gold will only go sideways from here, it will not drop.” GOLD CAN DROP. If the dollar starts to rally out of its lows, Gold can pull back and sentiment toward it can change.
GOLD 1999 Surged out of the lows, breaking prior highs repeatedly. It definitely pulled back.
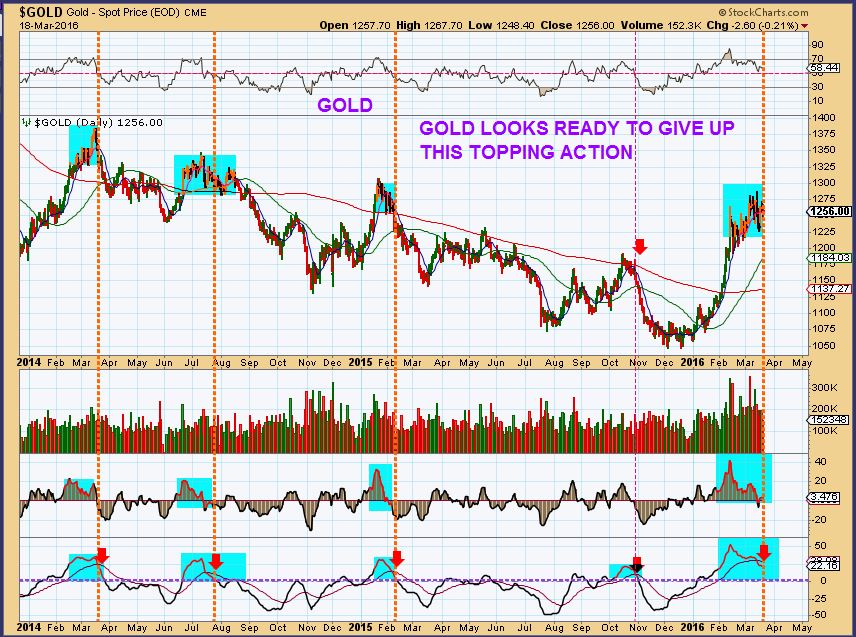
GOLD – Gold finally looks ready to pull back from a topping pattern.
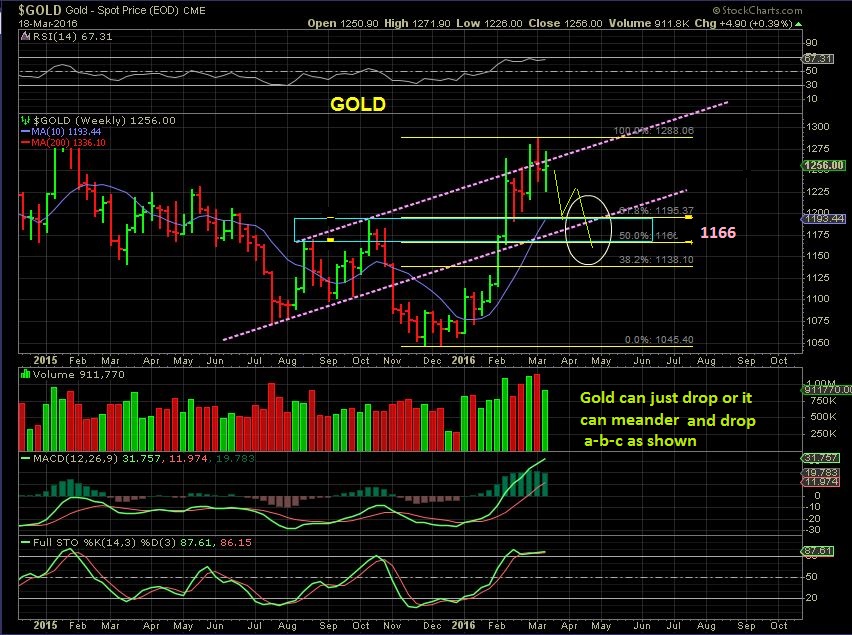
GOLD WKLY – Normal target would be in these areas, but these pull backs can take an entire daily cycle or 2. That’s approximately 30 – 60 days! So it can bounce around seeking out the next daily cycle low.
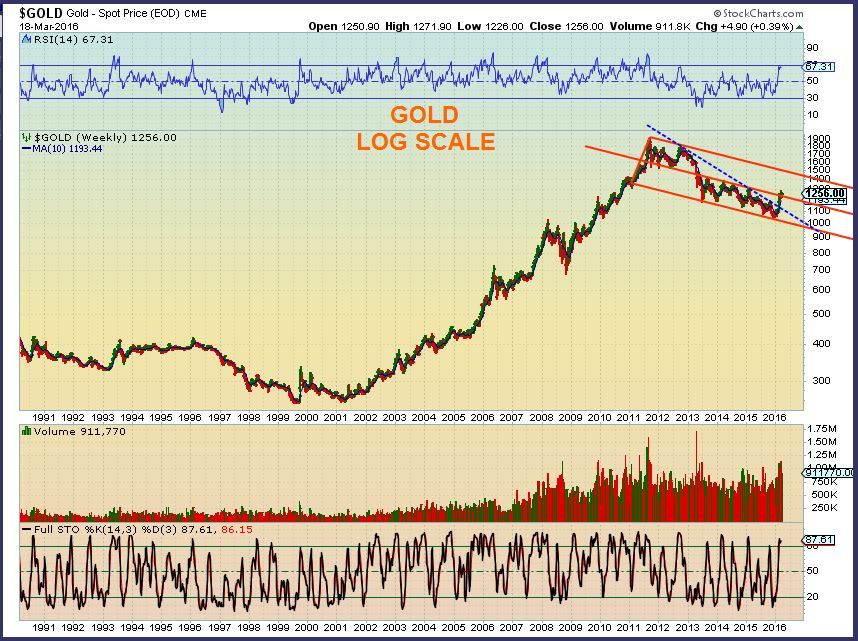
This is a Big Picture Wkly Log Scale of Gold. It has reached overbought, like recent prior runs out of an ICL . The RSI is stronger than other prior runs out of an ICL.
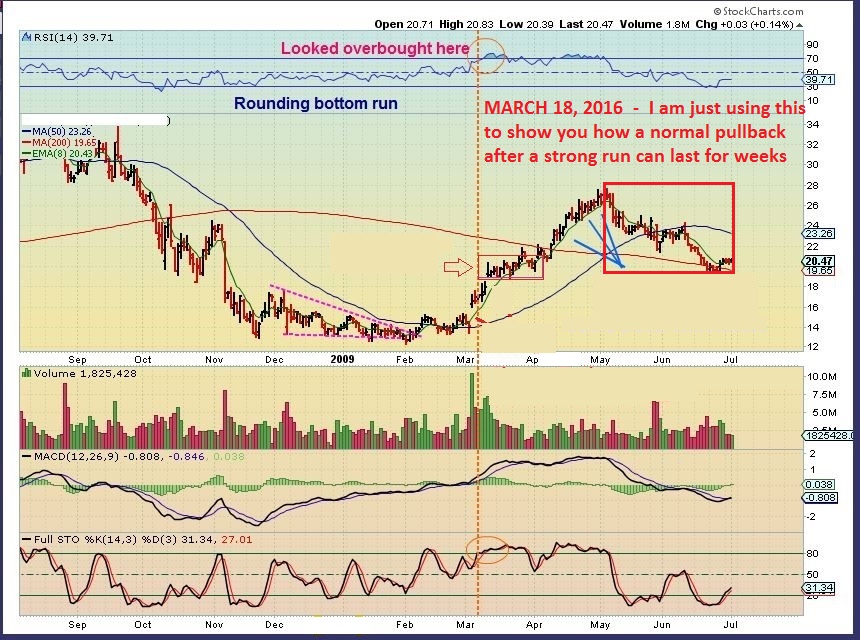
Some may wonder, “HOW COULD A PULLBACK of say 50% last weeks?”
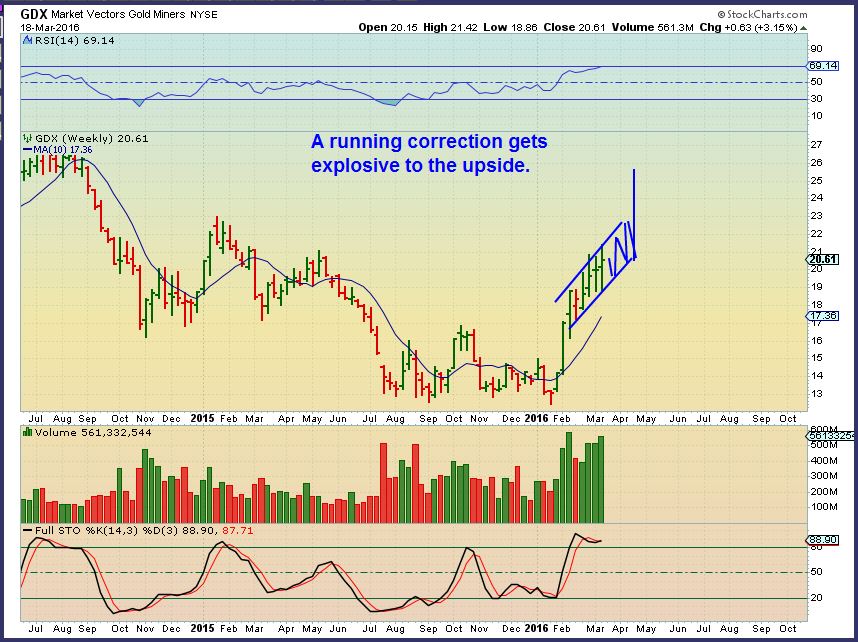
Here is a visual of something very similar to Gold. A triangle wedge / round bottom low. It also had a strong run up hugging the 8 ema for months. Then? A 2 month pull back. It is SO difficult to exercise patience when it drops and pops for weeks like this. Maybe this visual will help.
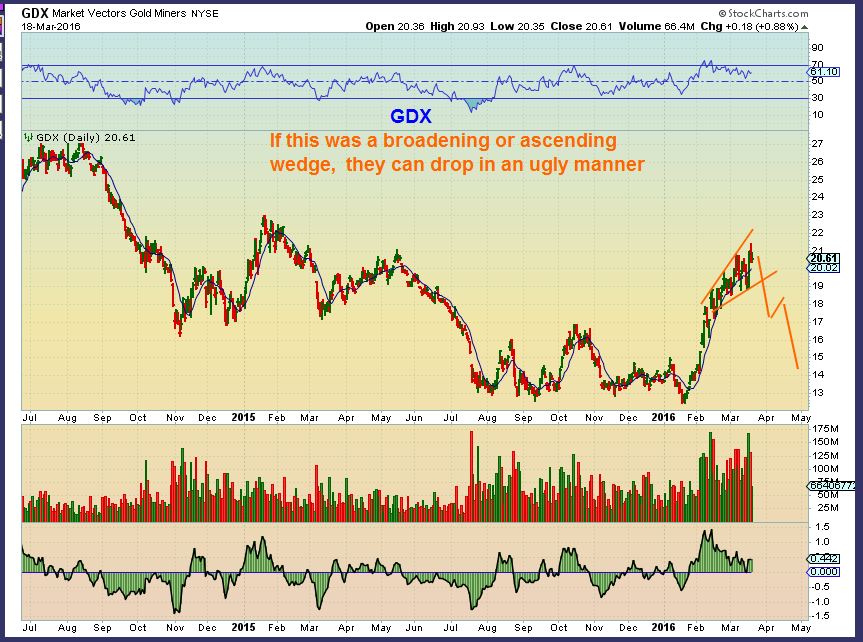
There are 2 ( or more) ways to look at GDX. One is really Bullish, and one calls for a quick drop. I will say that individually, Miners all have excellent looking charts. I do expect a pull back, but I will still show 2 patterns that look like they could have formed here.
A running correction remains bullish with small pullbacks that are continually bought up. Then it pops higher and finally rolls over. Less likely at this point.
This bullhorn pattern breaks down, and I could see this happening if the Dollar rallies and Gold drops. That is not a target, the average pull back area would be around $15-$17, and I will track it as the pull back starts.
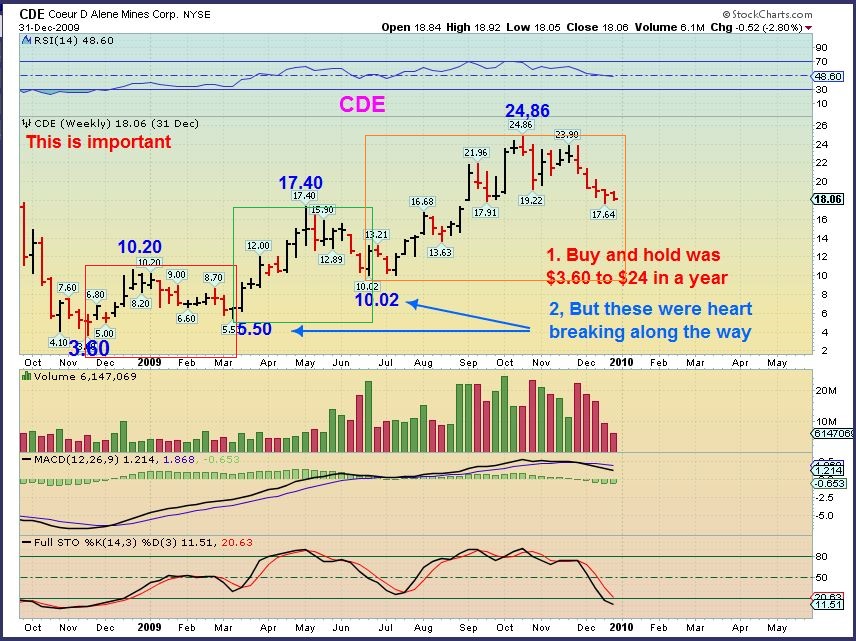
For the sake of learning, lets look at prior bull runs and Miners. You will see that the ride can be both difficult to buy & hold, but also rewarding. A CORE of BUY & HOLD does work if the Bull Mkt has returned.
CDE — At a glance , this is CDE from $3.60 to $24.86 in a year! That’s a winner. Easy to buy & hold, right? Look closely at the dips though, since we may have some dips coming now. Could you have ridden this movement out ?
CDE ROUGHLY – $3 to $10, back to $5! Up to $17! Back to $10 🙁 Then to $24. Rough ride, nice gains over a year though.
.
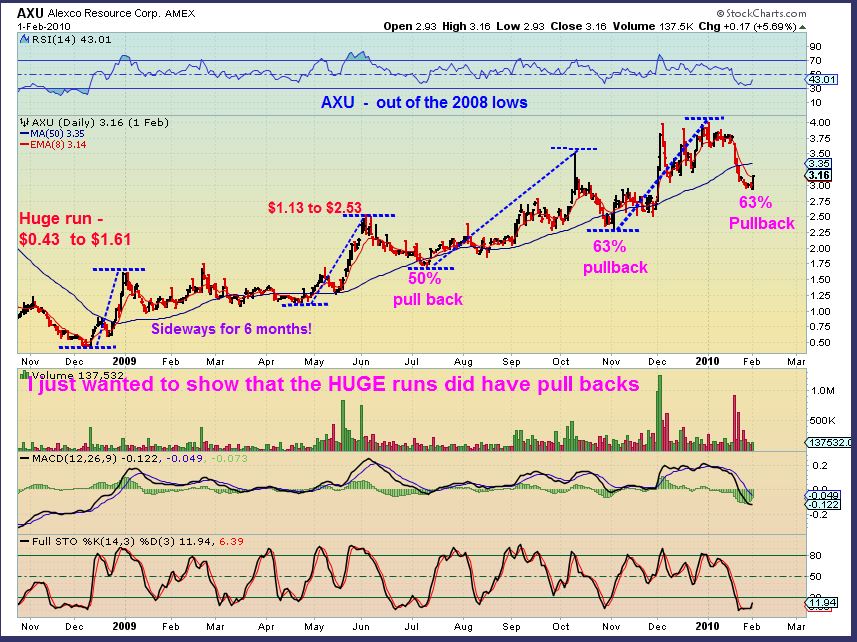
AXU – Another very profitable BUY & HOLD. At a glance, this was $0.43 to $4.00 – WOW!
.
Again, could you ride this ride for a year? The pullbacks affect the account balance, dropping 50 or 60% at times. The account balance drops, therefore, our emotions are affected if one isn’t careful.
.
So we are at the doorstep of many turning points. The absolute lows of some of the recent sell offs may be in, and dips can offer some profitable trading entries to the patient ones.
.
The general markets really are due for a dip into the DCL (Daily Cycle low), and now they seem to be acting a little more bullishly in the big picture. This needs to be monitored going forward – unbiased. If they start breaking to new highs, the changes could be meaningful. Also the Monthly & Quarterly charts end in a week and a 1/2.
OIL, NATGAS, COMMODITIES, PRECIOUS METALS, MINERS , etc – they all seem to have put in meaningful bottoms ( Natgas needs more proof, really) and what an excellent time it has been for traders. We have to expect some pullbacks, and Gold & Miners are overdue. These could present excellent buying opportunities if THE LOWS for precious metals are in place.
.
Thats a wrap. We’ll see what Monday and the rest of the week bring our way, and the days ahead may add clarity to our expectations going forward. Currently, I think the commodity stocks and Energy could have more upside short term. Patience is needed on the rest of the pullbacks.
.
~ALEX
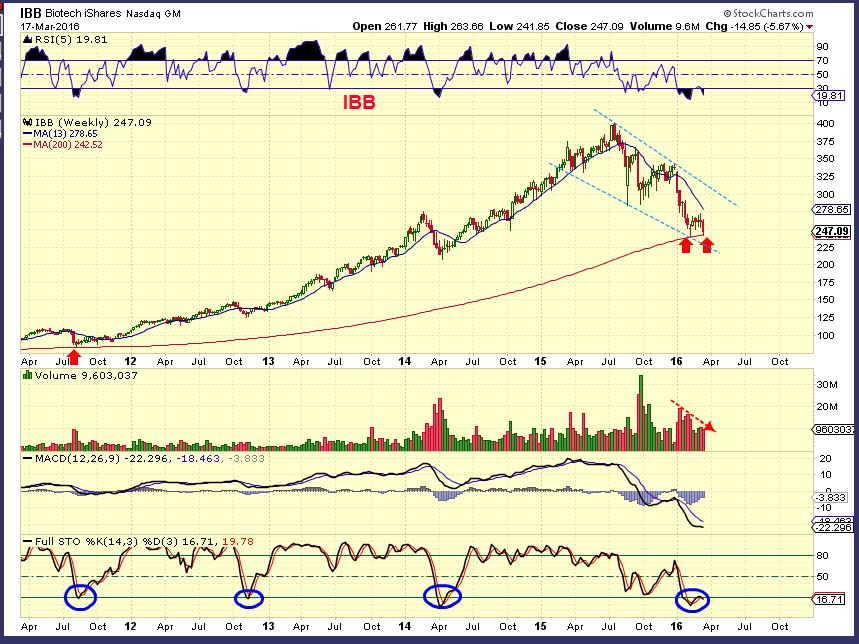
Sidenote on the Biotechs:
As mentioned in one of last weeks reports with this wkly chart of the IBB ( below) – I am interested in many of the Biotech charts set ups. I do see “bases” that have been forming between the weeks of the 2 red arrows that do have a bullish appearances on individual charts.
One can use ETFs or options to minimize risk, but trading the individual set ups does include a good amount of risk.
Personally I have traded biotech in the past , and they can be high risk no matter how solid the company seems. In the past I have owned a few ‘good’ companies that either failed on a drug trial that was going well, or the FDA didn’t approve their drug due to side effects, etc., and the stock will actually open up down 20- 50-70%.
.
This is an example. CLDN ( no chart included) – An analyst had given the stock a price target of $29 as it closed near $14. CLDN failed their tests, the target was then changed to $3 by the same analyst immediately, and they opened at $2+ the next day. OUCH!
http://www.marketwatch.com/story/celladons-stock-craters-after-disappointing-trial-results-downgrade-2015-04-27
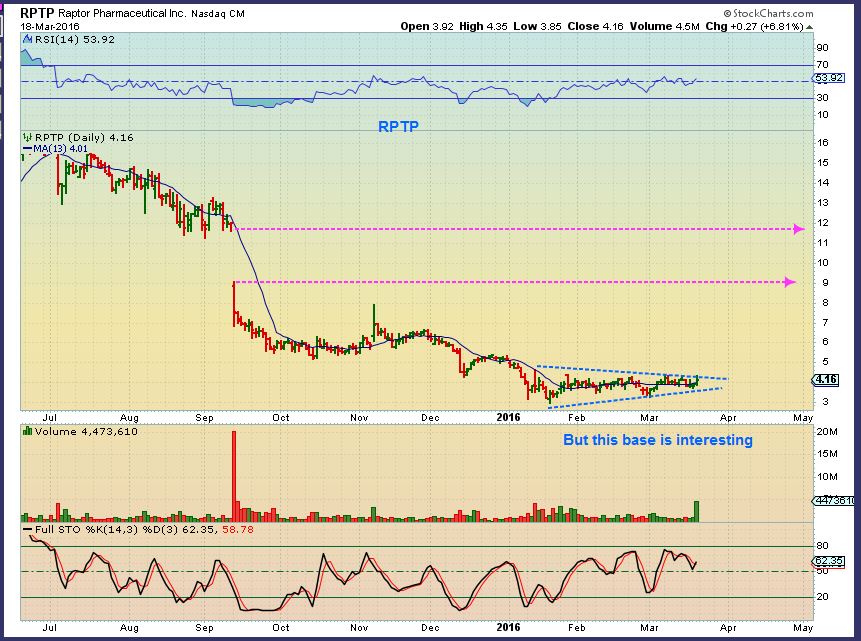
On the other hand, I look at biotech charts that have sold off, and see bases forming now that look rather interesting. A warning is that these are extra high risk and I would only take small positions in individual biotech and probably trade them quickly. Only trade what you can afford to lose. Maybe I will post some set ups in future report with this warning again. For example:
RPTP – Huge drop from $12 to $8 , but now I like that base in the $4 area.


Great work Alex! Hope you had a great weekend! As a sidenote to your SPX analysis, I would add that one ratio that I look at is $SPX:$USD. This is something that not a lot of people look at, but to me it.only makes sense for someone investing in US dollars to know if what they are investing in is gonna outperform cash. $SPX:$USD moved below its 50 week sma about 18 months ago, but it has moved back above. This is something that did not happen in the October rally. And the 80 week ma, which in the past 2 bears has been a heavy mark of resistance, has also been recovered THIS PAST WEEK. These are very bullish developments. BUT, weekly line chart still has resistance near above fridays close, so the market is not yet out of the woods. But if SPX can break above that trendline and hold it , we might see a real rush into stocks. Next week and 1/2 is gonna be very important. I would expect bears to put up a fight near these levels. We’ll see what happens.. thank you again for the insight!
PS: if anyone is playing Bio’s through XBI, or LABU/LABD, the weekly chart shows price might have broken down from a bear flag last week, and is currently still below the 10 week sma. It did bounce a little to finish the week, so maybe there is still an upmove starting, but I just mention it to make ChartFreaks aware. Have a great week everyone!
Also note to anyone playing XLE, or the 3x etf’s like ERX. XLE:SPY right at point where all other rallies have been turned back: 30 week sma, and right at 50 weekly rsi. A close above there this week could be HUGE. But I think we can expect the bears to defend here.
Thx Peter
Great report, Alex. Glad to be a new member of Chart Freak.
ROB !!! Nice to see you here, we go way back 🙂 Hope all is well.
Nice chartfreak. … thanks for your Hard work.
looking forward to seeing what transpires this week. …. lot’s to watch….yipyip
Butt….. can i just say in regards to wtic $44…$44 $44 .. w.. o… w……. layoff the wacky weed before discussing crude next time mannn…. ;o)
Oh, That $44 has huge implications for someones life 🙂
He is a good contrary indicator.
REN, BAS, WG, OAS getting some good volume buying here.
Thank you for the graphic views of what the gold ride may look like. And for the overview of so many different sectors.
Its tough Nancy,
I wanted to show that the pullbacks can, maybe, might be drawn out a bit so that we wont jump in on the first green day after maybe 2 down.
It sure is holding up nicely though
Time to add SPXU on watchlist for failed breakdown. Anyone else looking at ATW in oil/energy?? Alex, have a look at KGC, seems to have broken out of bull flag in weekly. GFI pennant in the works also.
I hadnt seen ATW. Strong run ( 100%) and now Kind of a nice flag.
Ok, here may be a stupid question to everyone here – I’m looking at my notes and trying to figure out exactly where we are on oils cycle – does it kind of coincide with the stock market cycle? So…are we expecting a DCL sometime soon and then the start of a 2nd daily cycle? Or is it possible the tiny dip down on the 15th was the cycle low and now it will just forge ahead into the next daily cycle (I’m thinking it was too early for that to be the low…). Or maybe the dip on the 15th was a half cycle low? Thanks in advance!
I’ll put it in the report
Couldn’t resist buying some RPTP. Starting to break out of the base now. It is a beautiful setup. Those giant basing patterns have been excellent lately.
I own that one and CGIX. High risk due to the sector, short term trades for me.
My Small position of OVAS is on fire. Very much like the long-term set up.
Will add on pull-backs. Also really, really like XON
Very nice
SM is not too shabby either 🙂
Alex, Bio Med sector looks ready to move higher. Thanks for noticing an posting. Energy sector might be getting stale.
Compare REXX to LABU. Right before REXX took off, that’s where we look now with LABU.
Yes, the list in the report acted well today
PETX , CGIX – I love those types of bases.
CF, Remember me bringing up SRPT last Thursday. Continued strong move forward, plus insider buying.http://cnafinance.com/sarepta-therapeutics-srpt-stock-is-about-to-soar/8622
I do Bill, I thought you actually said that you bought it. Looks good.
I wonder if Gartman is beginning to hear Ride of the Valkyries in his sleep. … Loved the toungue-in-cheek reference.
: )
Alex are you turning bearish on s&p? Seems like it’s at the top & I doubt we’ll see all time highs. But who knows
Hi Al,
Not long term bearish yet, but I expect a top and a drop into a DCL, but then I expect that the next daily cycle could move higher than this one did. IIt’ll be in the report tonight.
Awesome. Can’t wait. There could be some great opportunities.
I’ll try to explain what I am seeing in detail tonight with the SPX.
It has been stronger in this first run up.
Too bad I dumped my longs at S&P 1999. I was convinced it was headed lower, but nope…
Hey All,
I was out for most of the day, and I have to run out again, just checking in. Many of the BIOTECH listed in the report ( And there are many more, really look to be acting correctly. I may include them in the report tonight, the ones that already released earnings, but they are still a bit risky due to other reasons mentioned in the wkend report.
David Shaw and CRK. Just wow. I’m in this too, and Friday’s action was just wacky http://www.insidermonkey.com/blog/billionaire-david-shaws-d-e-shaw-co-raises-exposure-to-comstock-resources-inc-crk-439284/
Bios are always risky to me. Coming out of lows would add to the risk. When I ‘trade’ as a ‘trader’, I can ignore it, because it’s not BUY & Hold. I try to factor it in.
For myself, I know the risks are usually higher , and I just use position size and other factors to try to take advantage of the POPS, but not ride out the drops if it is a short cover rally with no follow through.
Often I ‘trade’ out of lows / bottoms, and then when the timing matures a bit, you can see if it is 1) Just a short covering dead cat bounce, or 2) A real solid bottom by the way it acts over time. It takes time to know though.
Also what you said (beaten down IPO’s could move next) is not out of the question.
Funny, I was also watching a few of the ones you mentioned ( I think I mentioned GPRO and MU in a prior report and TASR which is not an IPO, but beaten down a bit ) as possible beaten down tech stocks that may follow what the 3-d printers are doing.
3-D Printers were some of the first ones that I noticed dying on the vine, now they are getting good follow through off of the lows. DDD is a good example. And as always, Time will tell 🙂
Took advantage of the morning dip in CLF. Set to buy more if I can. Quick trades on energy? WPX is in a machine-line groove right now. Sure, no 70% in one day but a predictable 8% with well defined support for stops. Of course, pending that oil doesn’t change its mind…