
There It Is Again
Well, after several weeks of good trading , it appears again. Yes, I’m taking about that Elephant in the room – only this time things He’s levitating as we head into the Fed Mtg this Wednesday. Lets take a look at our markets, keeping in mind that we do have a Fed Meeting this week.
.
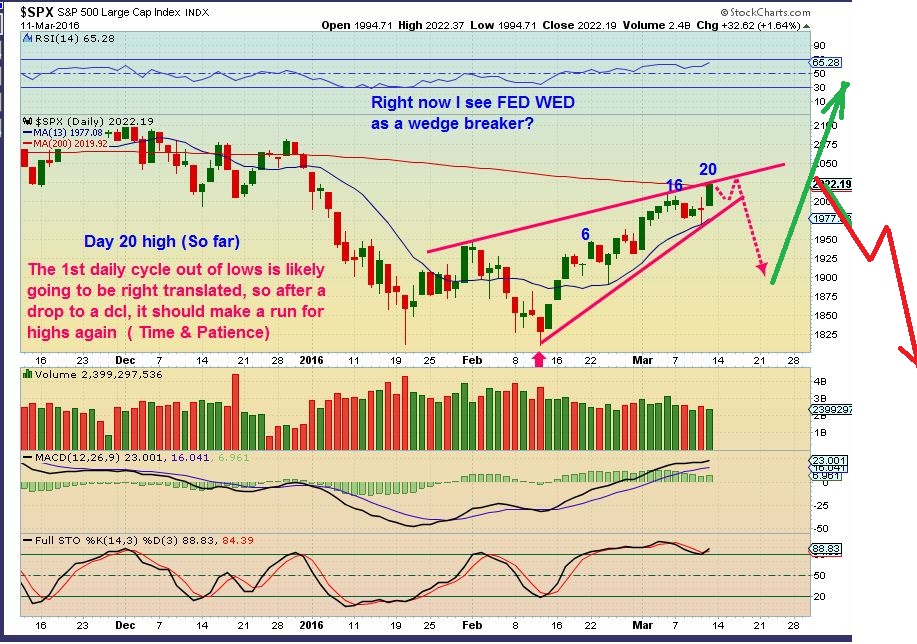
SPX – I see a rising wedge and on day 20, we could drop to a 1/2 cycle low. So we could drop heading into the Fed Wednesday or possibly see a drop after?
I mentioned something important last week and I want to remind friends of that here…
This is very early in a new intermediate cycle for the SPX. Too early to go short longer term, and with day 20 as a new high, this could be Right Translated. We would expect new highs again after a dip into a dcl. This all could takes weeks.
.
Reminder & Update :
Last year I had felt that we are witnessing the markets topping. I called for the initial drops and we have had them. I have posted these charts in prior reports to show what I would watch for next for the bigger Picture. Click on the charts to expand.
..
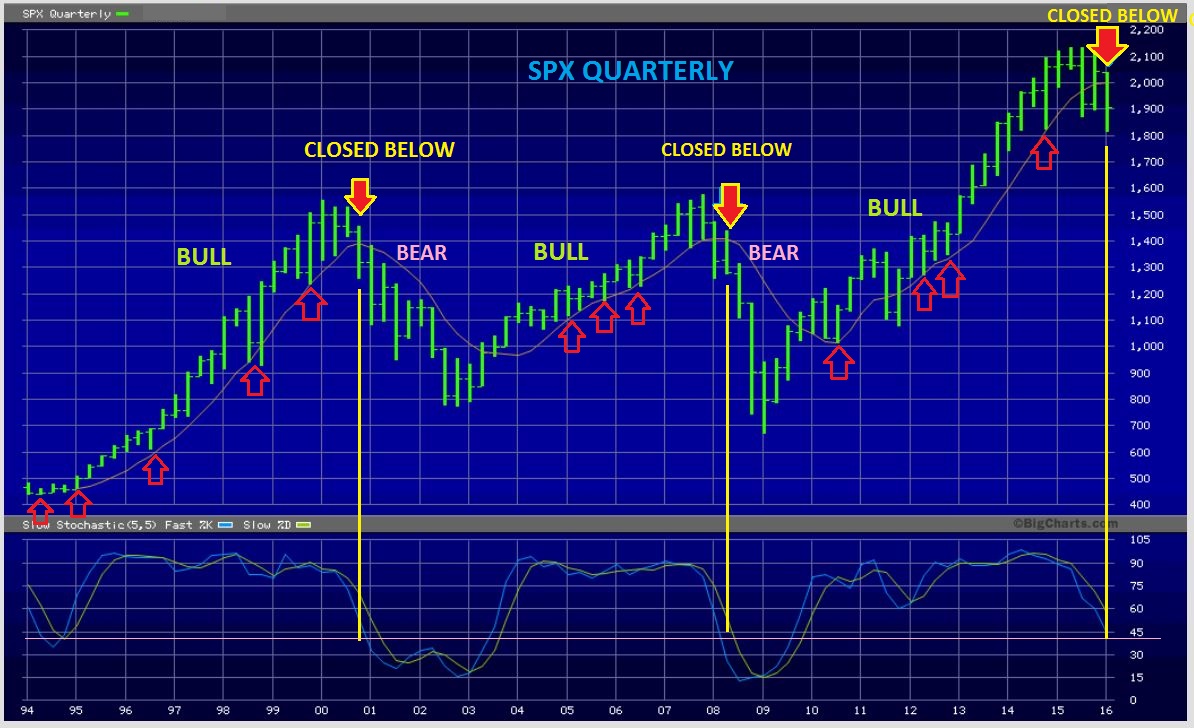
SPX QUARTERLY – This will be important at the end of March (1st quarter). I am watching that moving average that was never recovered in prior bear drops.
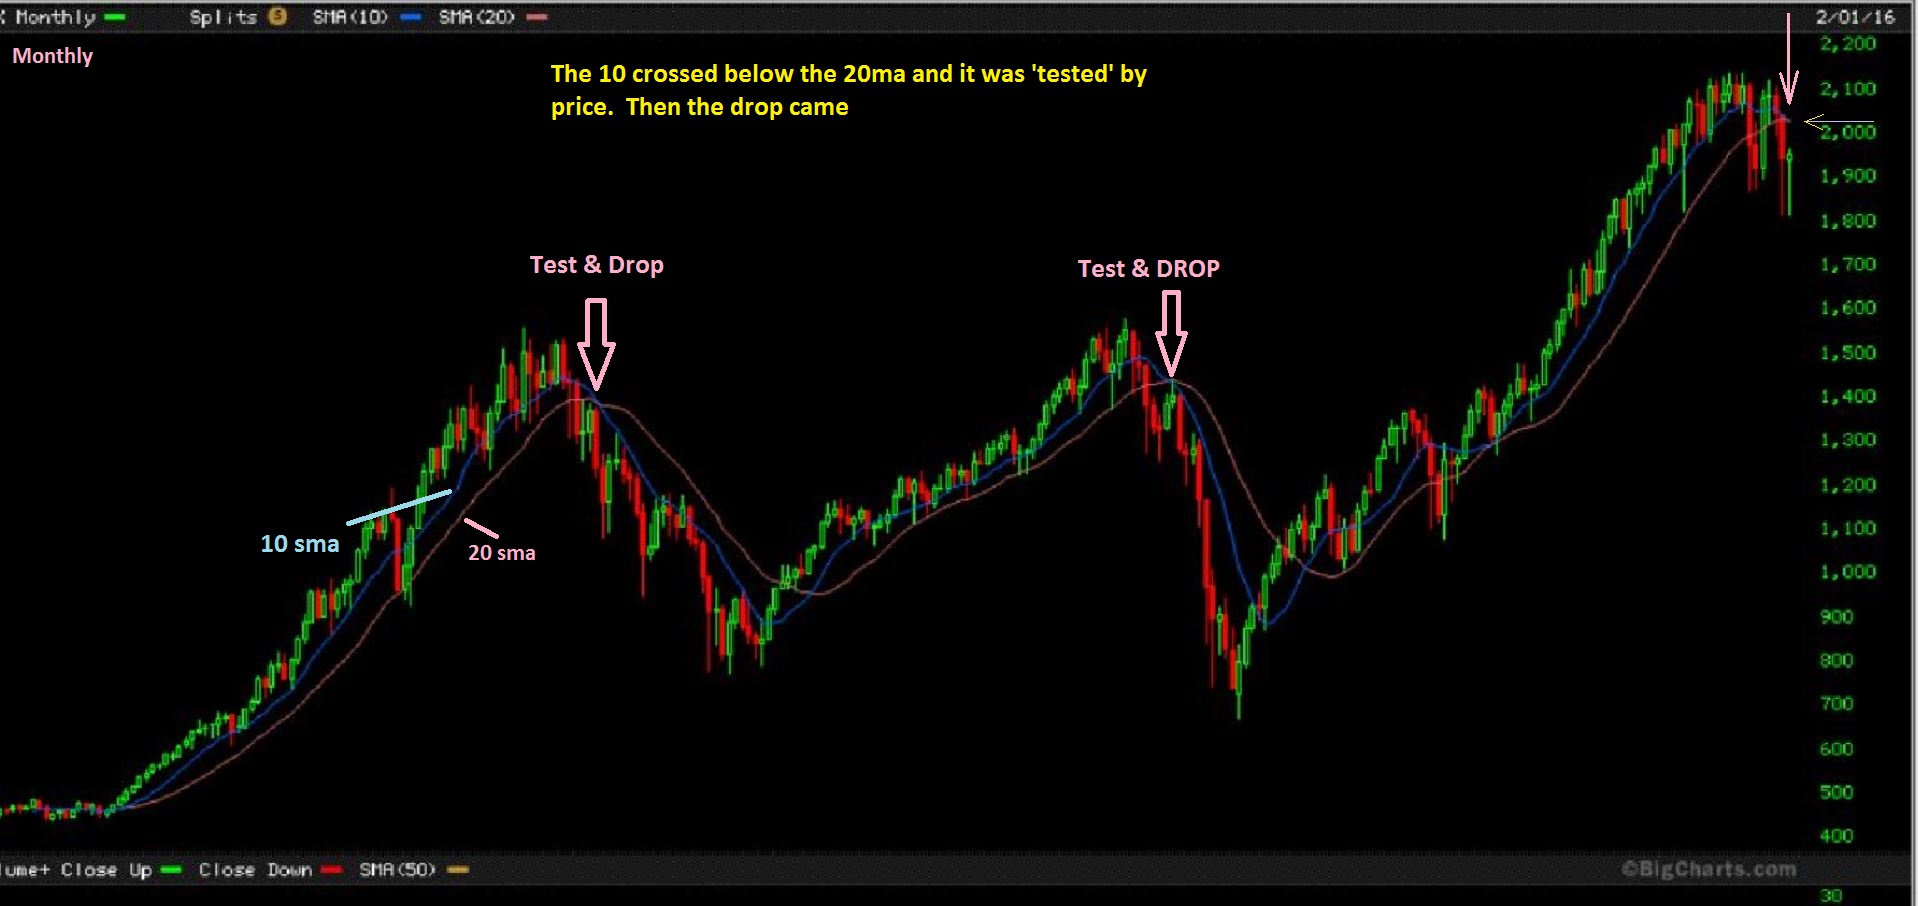
SPX MONTHLY ‘TESTS’ Chart Feb. Because the SPX is now at 2000+ – this is important.
Moving forward WITHOUT BIAS means we now approach this bounce from a neutral view and wait for evidence to see if it is just a bounce (Shortable) or a recovery. Lets look at more points of interest.
.
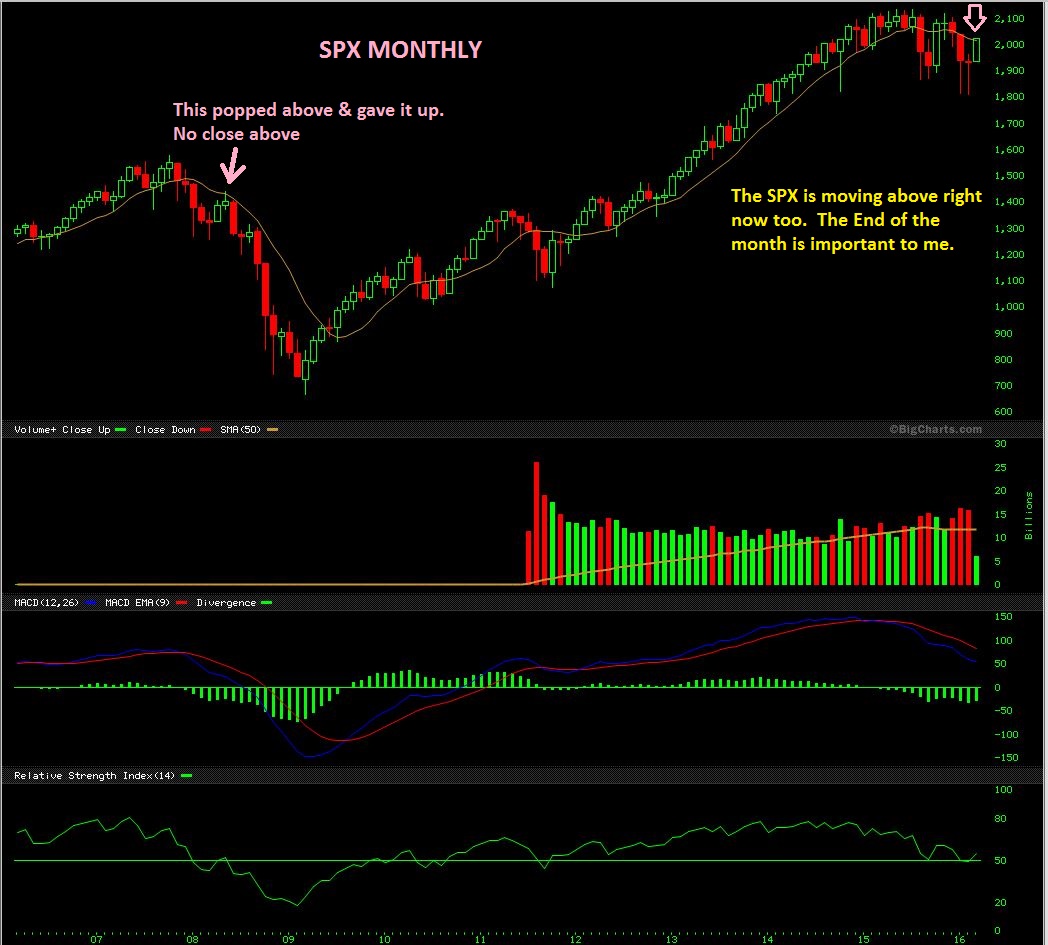
SPX MONTHLY – I expected at least a drop to test our break out near 1600. The 10 moving average shown was not recovered ( on a Closing basis ) in past major tops. Lets zoom in.
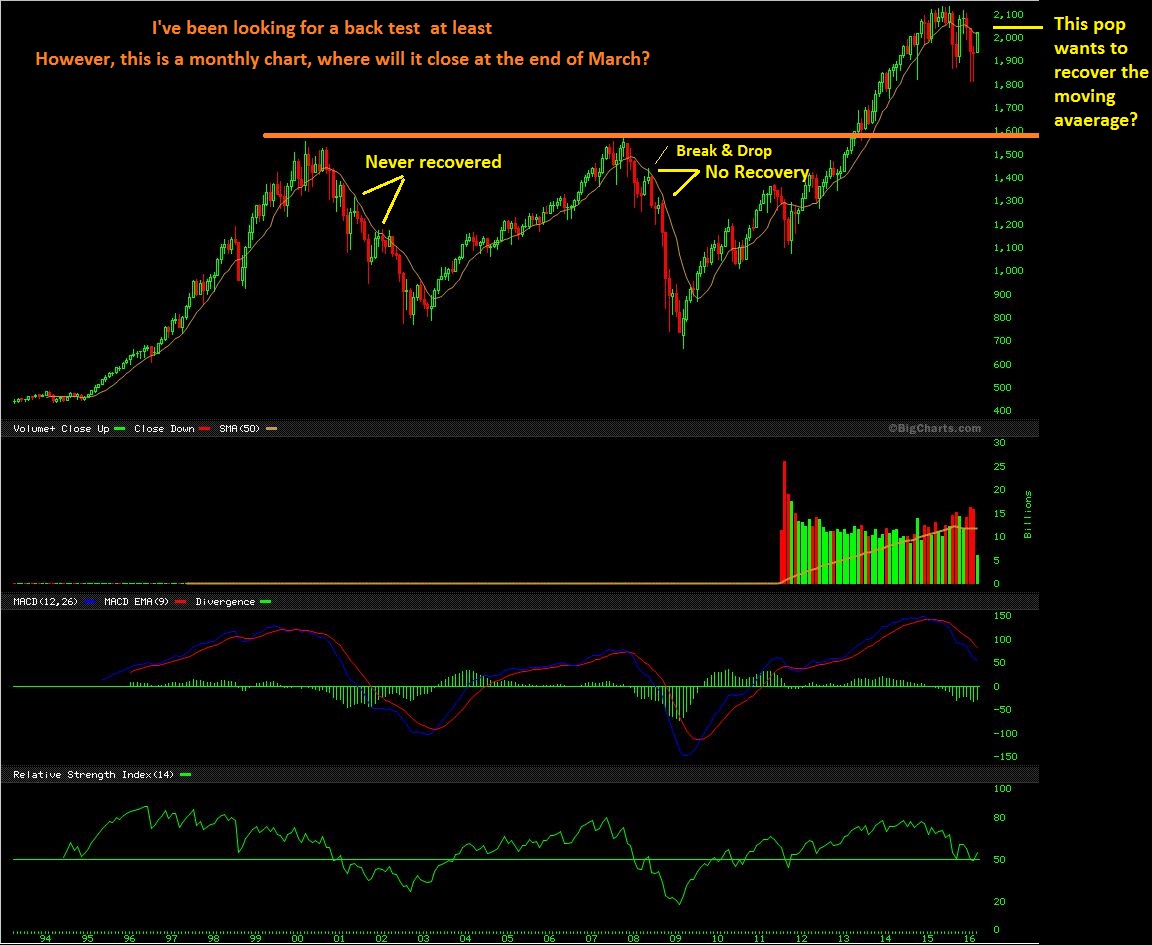
ZOOMING IN– We are breaking above that M.A. now. That could actually be bullish if we close the month above it.
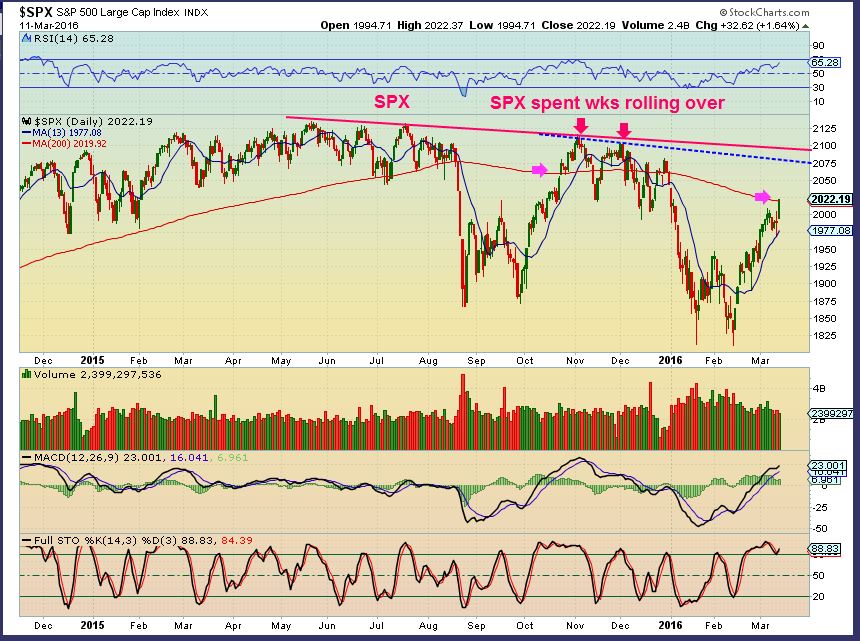
SPX Daily. Yes, it is breaking above the 200sma, but notice that it did that in Oct too, and still rolled over. In fact, It sucked in Long Bulls at that point several times in Oct, Nov, and Dec and still dropped to new lows. Currently, I expect a tag of the blue or red line. How might it play out?
-
After the Fed, a quick pop this week the the overhead line??
-
After a 1/2 cycle drop heading into the Fed Wednesday, then finish the 1st daily cycle at those lines.
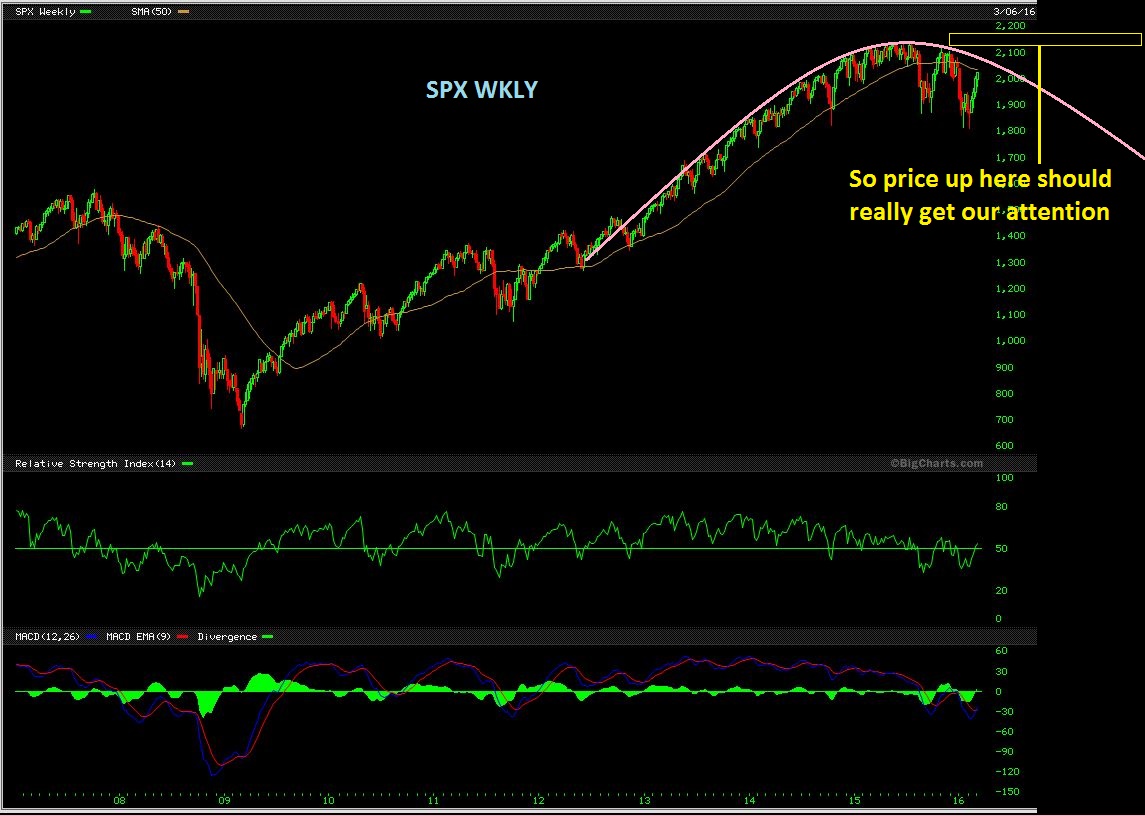
SPX WKLY – And this is a visual aid going forward. A possible round top.
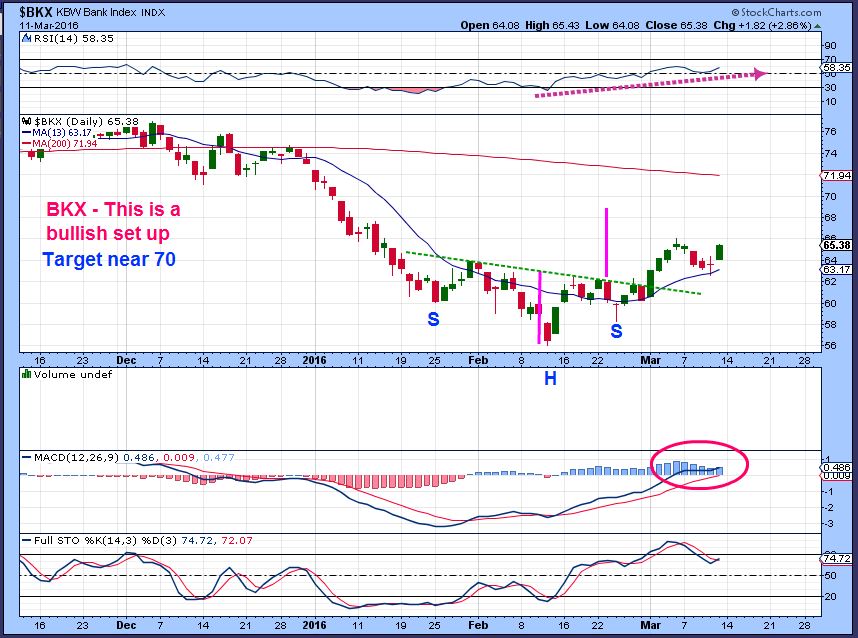
In prior reports I also mentioned that weakness in Banking was a concern of mine. BKX with BAC, JPM, GS, MS, etc struggled. They were not recovering and looked down right ugly, as shown here on Feb 3. BKX above $66 would help.
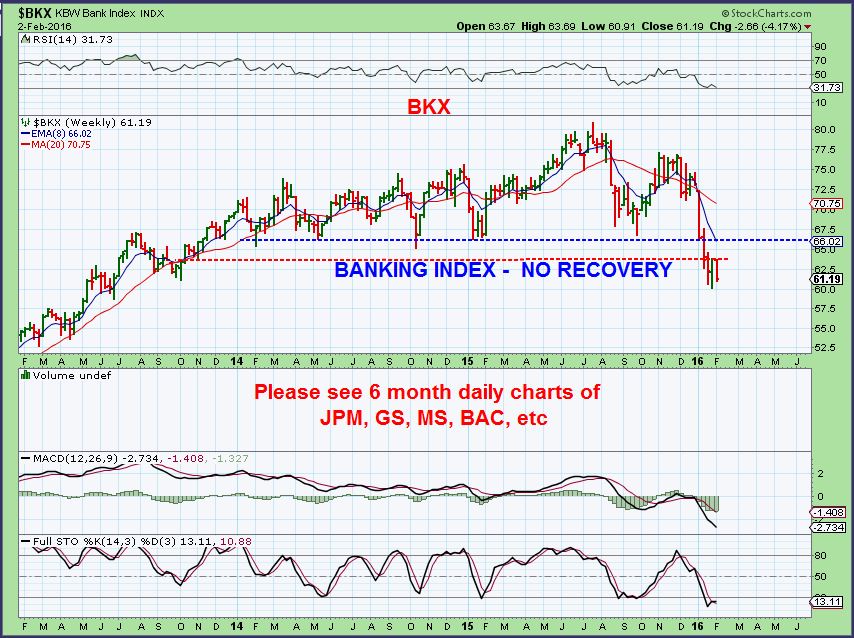
BKX– It’s not above $66 yet, but it looks bullish and may be ready to move higher ( Individual Bank stocks too). This improvement needs to be noted and watched.
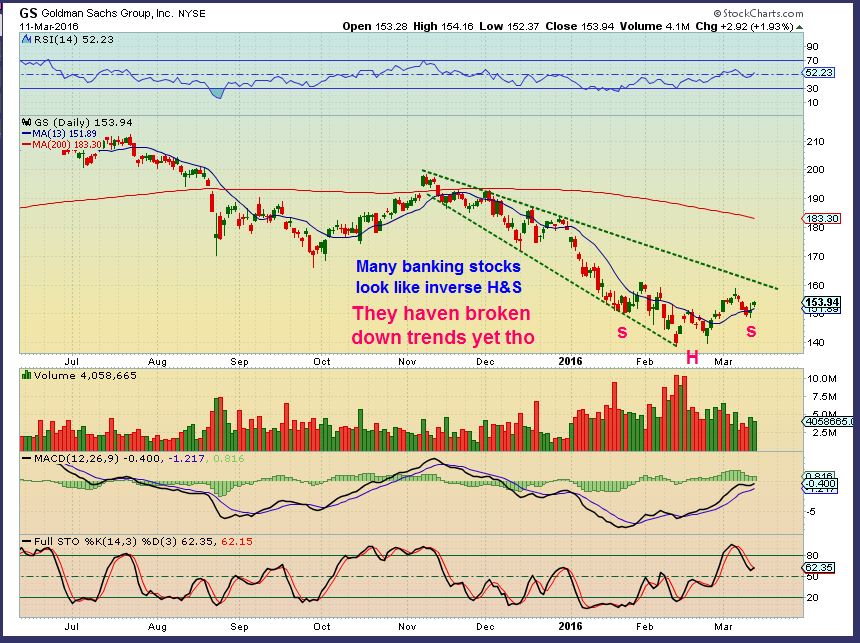
GS– Similar, but still lingering at lows.
SUMMARY: Along with the changes in Banking, I see improvement in other areas that I use to gauge Bullishness and bearishness. For Now I think we Might get a dip into a 1/2 cycle low. Then I want to see how the DCL forms. I’ll be watching many things between now & then. I saw a lot of negative changes in Dec and called for a drop. Then I thought we’d get this rally/ bounce to change sentiment back to bullish and drop again. With the above improvements in banking and other areas, I am fairly neutral, but still expect the continued drop for now.
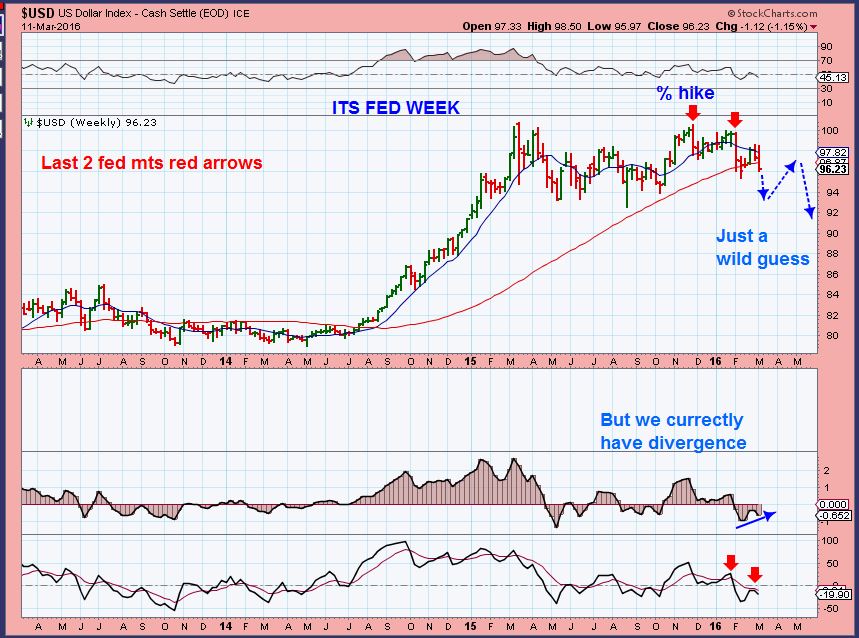
The USD WKLY – It has dropped at the last 2 Fed weeks (red arrows) . Last week started a drop, we’ll see if the Fed finishes it. If the USD Drops & then Pops- Does Gold POP and then Drop? 
.
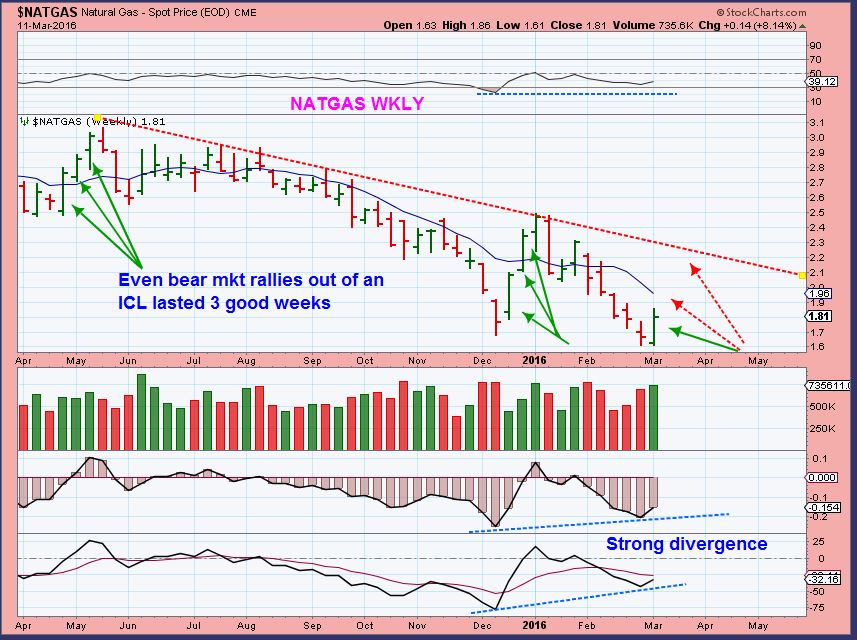
NATGAS– I have been mentioning that I think lows are in. Read the chart.
 .
.
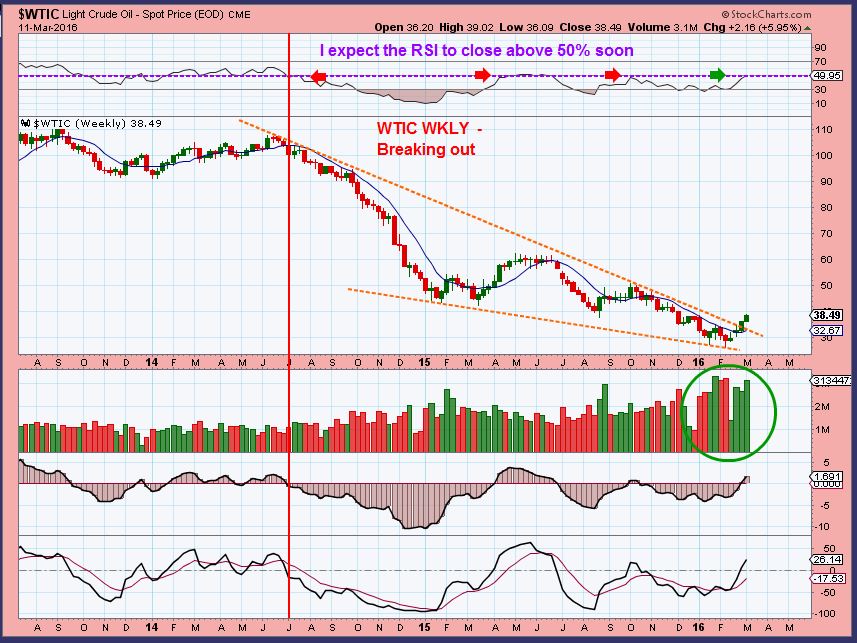
WTIC – We caught the lows in Oil and this weekly chart looks great. There looks to be plenty of upside.
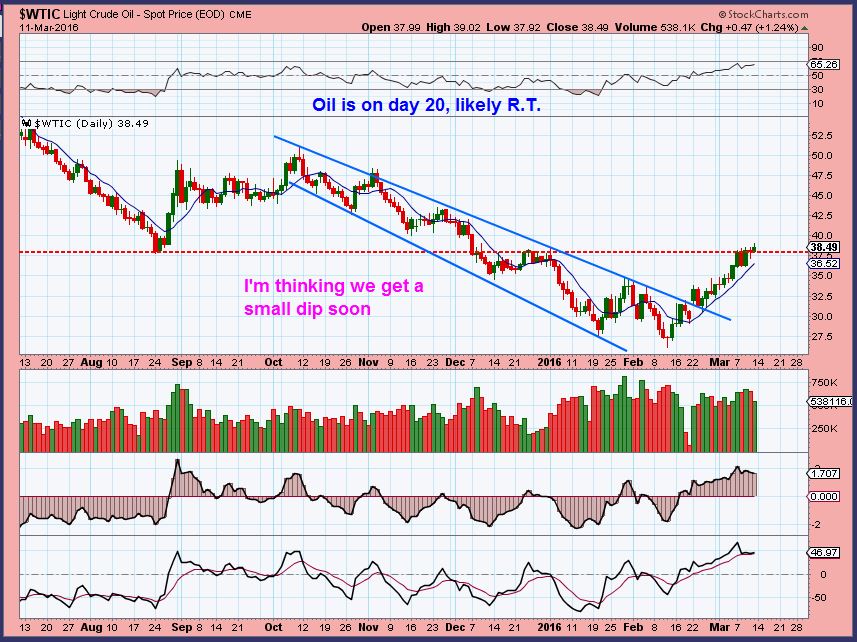
WTIC DAILY – Shorter term , I do think that we’ll struggle at this horizontal line. Oil is on day 20 and Daily Cycles for Oil can last 30+ to 40 days from low to low.
.
GOLD & MINERS
My goodness, what else can I say about Gold & Miners? I feel like I’ve said it all 🙂 They are the elephant in the room that everyone is staring at , levitating around , defying gravity. Lets take ANOTHER look.
.
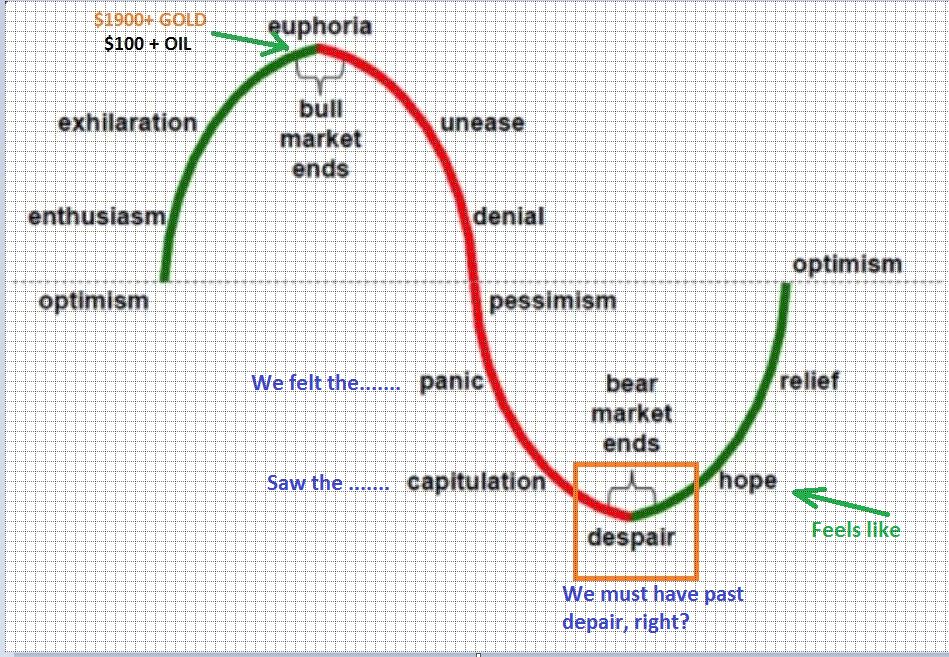
To start – These are the various phases that a BULL to Top to Drop to Bear MKT to Bear Mkt Lows takes one through. See if you can recall this ride in Precious Metals, and where would you say we are right now?
To the charts…
.
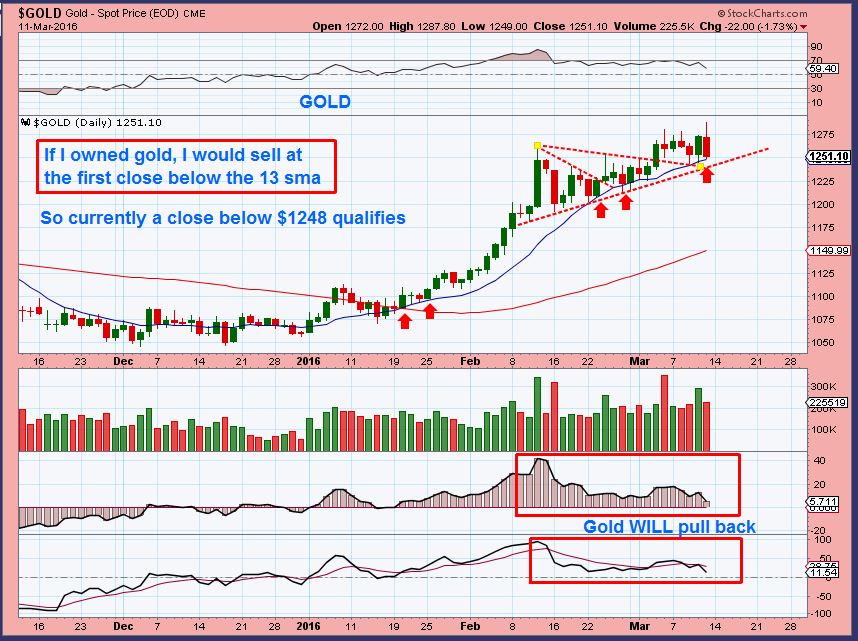
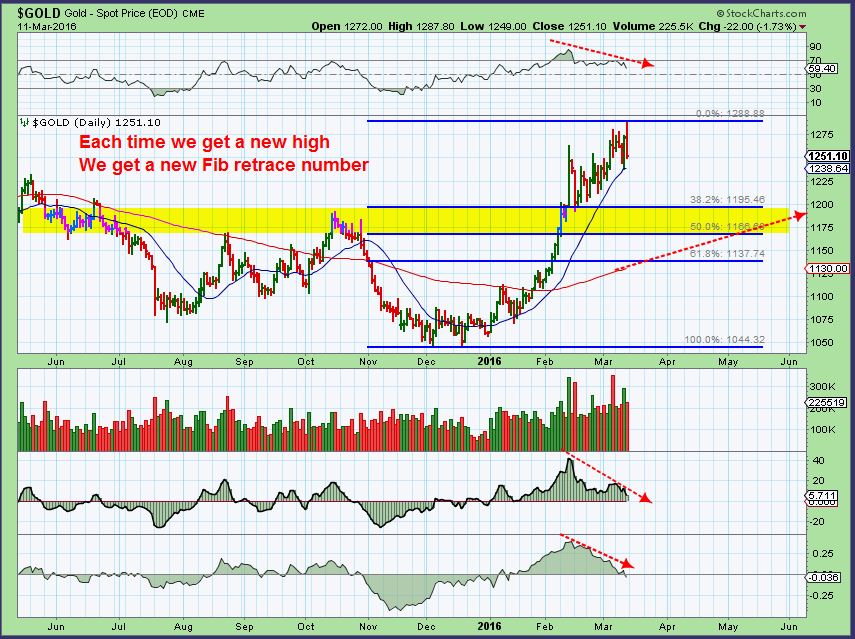
GOLD – It has to pull back sooner or later, but so far it is very strong. Notice that it never closed below the 13 ema since January ( Or Red dotted trend line since forming the triangle).
.
Gold got ANOTHER higher high Friday. Each time I show you FIB re-tracements, they are based on pulling back from THE HIGH. That means we must readjust.
.
Unless we hit another higher high, this fib line up actually lines up nicely with support. I would L-O-V-E to see a pull back. Why? I am almost out of all of my Miners, since we buy the dips & sell the rips.
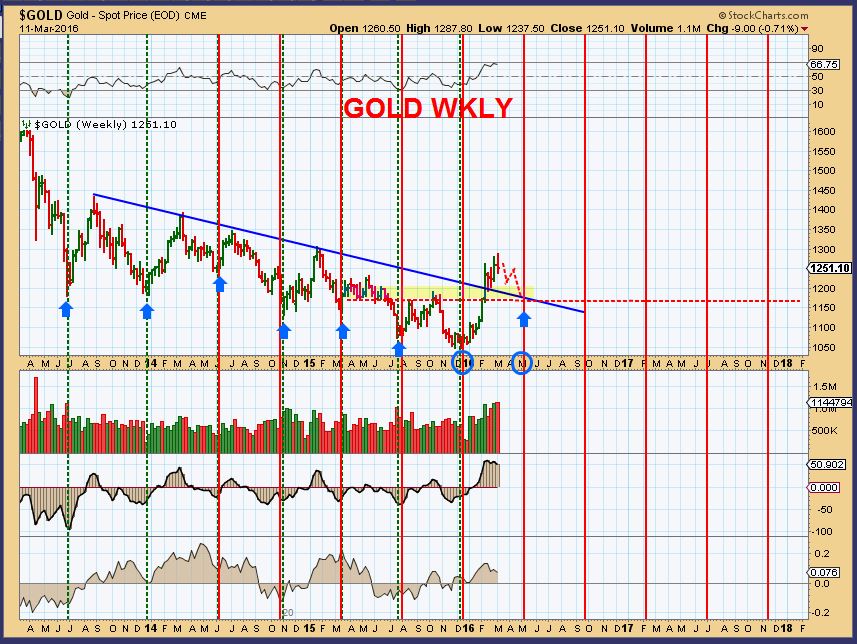
I’m expecting a cycle low in this entire Trading Cycle to come in a fairly orderly manner, I see things possibly going something like this time wise.
.
The C.O.T. has been steadily rising.
Note: Both Gold & Miners seem ready for a pull back, but I wanted to mention this…
Individual MINERS may kind of do their own thing if Gold has re-entered the Bull Phase. That is why companies like LSG, RIC, NG, Etc bottomed long ago. And now others may get accumulated on the dips and hold up / go sideways a bit while others just pull back swiftly.
.
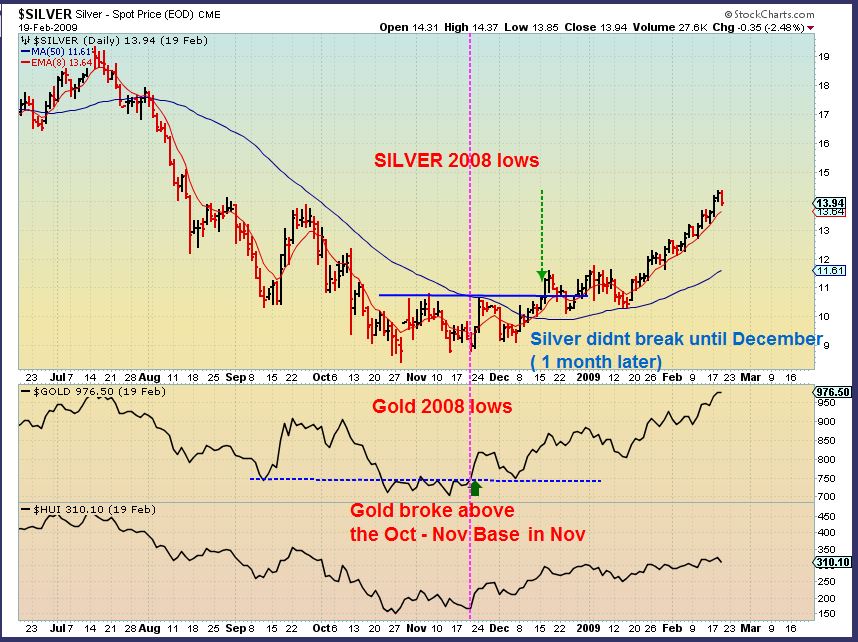
Some have feared that GOLD taking off and SILVER lagging is a sign that the rally is not real. I have been asked to address this. I have actually pointed out that in 2001 , GOLD bottomed in the Spring and Silver actually made new lows & bottomed in the Fall. That is a fact. Gold bottomed first in 2001. Now lets look at 2008.
.
2008 Lows. This shows that though Silver/ Gold both bottomed in 2008, Gold broke out from a base ( Magenta line) & ran higher first. Silver didn’t break out until later. Conclusion? I’m not worried about Silver holding back yet.
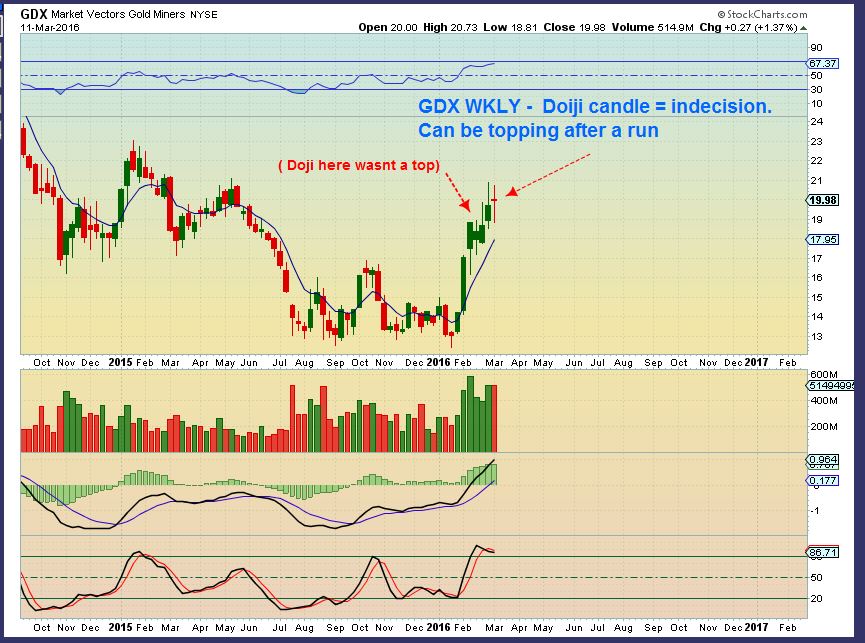
GDX WKLY – Miners have been strong, but I’d expect that they should pull back soon too. That is why I switched my focus mainly to Energy. It was earlier in its move out of the lows.
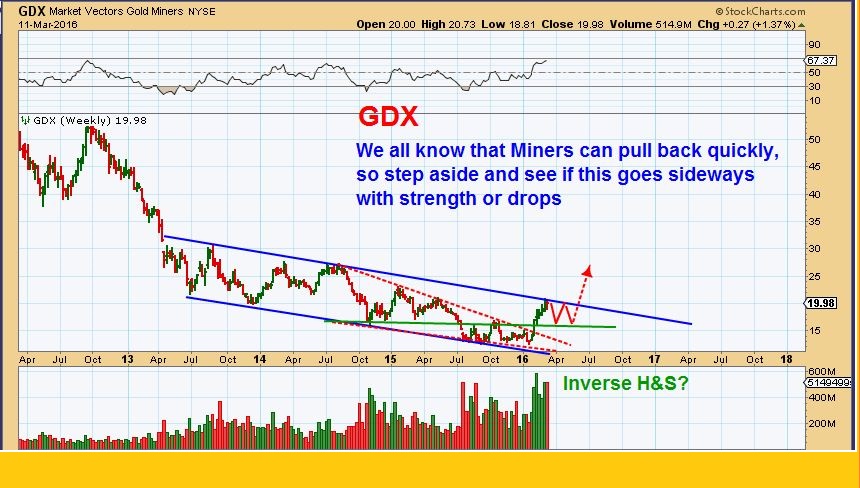
GDX WKLY – Doji. Often topping candle after a run. Maybe a wkly topping candle entering the Fed Week.
What can we expect from the pull back in Miners ( If we ever get one 🙂 ) I will continue to look for opportunity along the way, when we see better how things unfold, but for example:
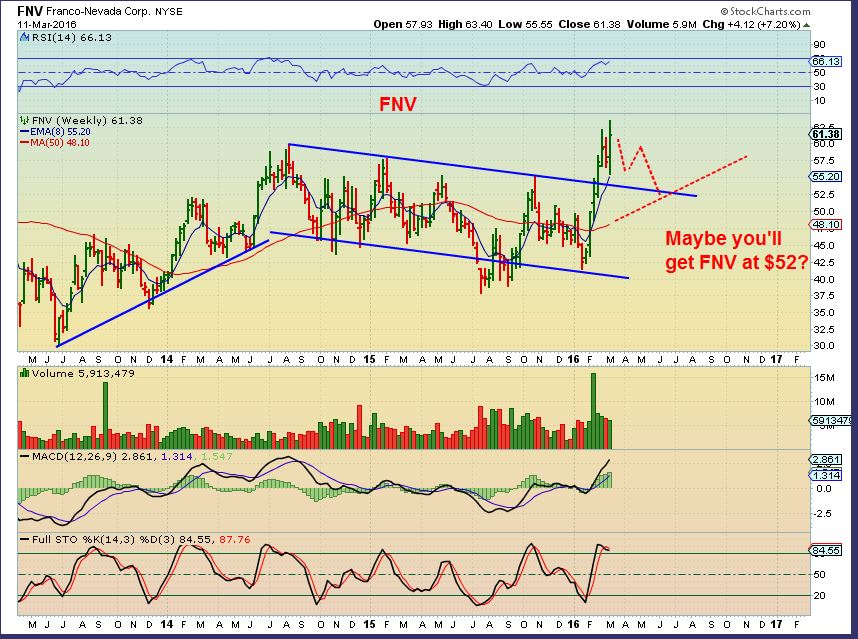
Maybe you’d get a great stock like FNV at a better price.
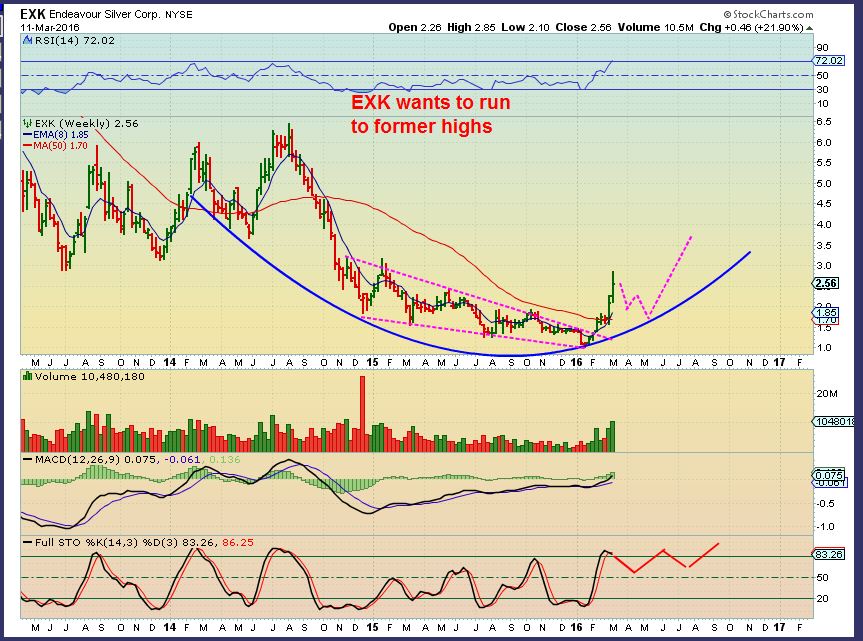
I pointed out on the EXK WKLY last week how a tiny pull back from $2.27 to the $2 area would be nice. But then…
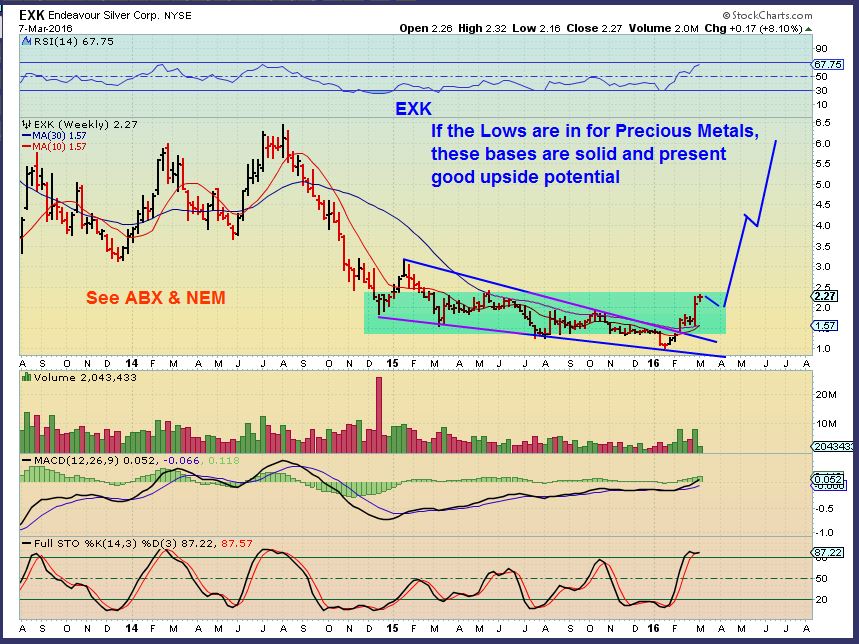
EXK – Exk just kept climbing last week to $2.85, so again, the drop may present another chance to own it lower.
We just need to get the pull backs first, to know where a good entry may be.
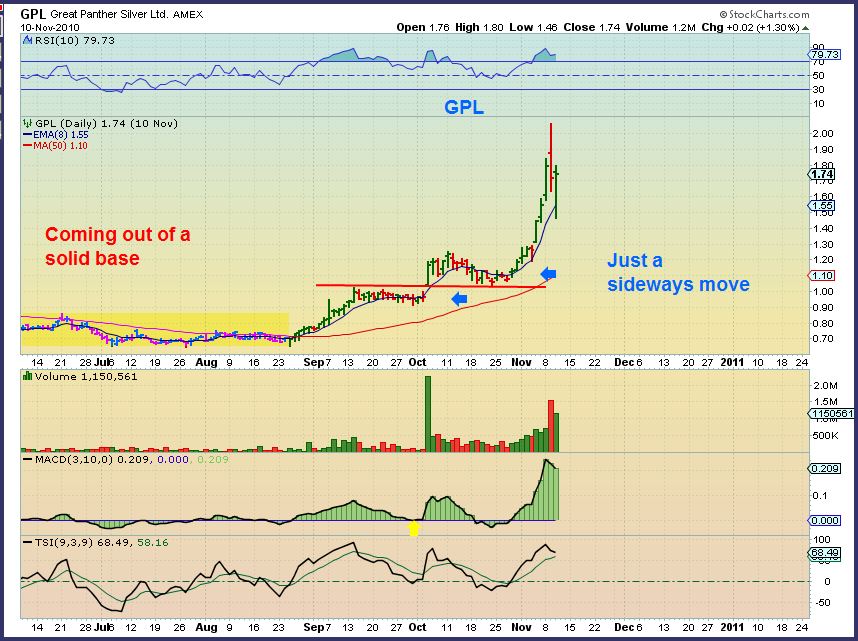
Picturing Miners working their way back down to the 50sma may seem like they have a long drop ahead of them. Notice how GPL just went sideways for weeks after leaving its base. That gave the 50sma a chance to catch up a bit. We can look for that possibility in some miners too, if things remain bullish.
So that’s the weekly wrap up and expectations going forward. I hope all had a great weekend and we can look forward to seeing how things unfold Monday and Tuesday as we approach another Fed Wednesday. Thanks for being here at Chartfreak!
.
ALEX
.
I was also thinking of something that I mentioned last week. In Energy, some that do not like to buy the lower priced stocks ( under $1 or for some, even under $5 ) may need a couple more Companies to look at. We talked about WG, HK, LGCY, ARP, WTI, BAS, TPLM, SXE, ETC. How about a few more priced over $5.
.
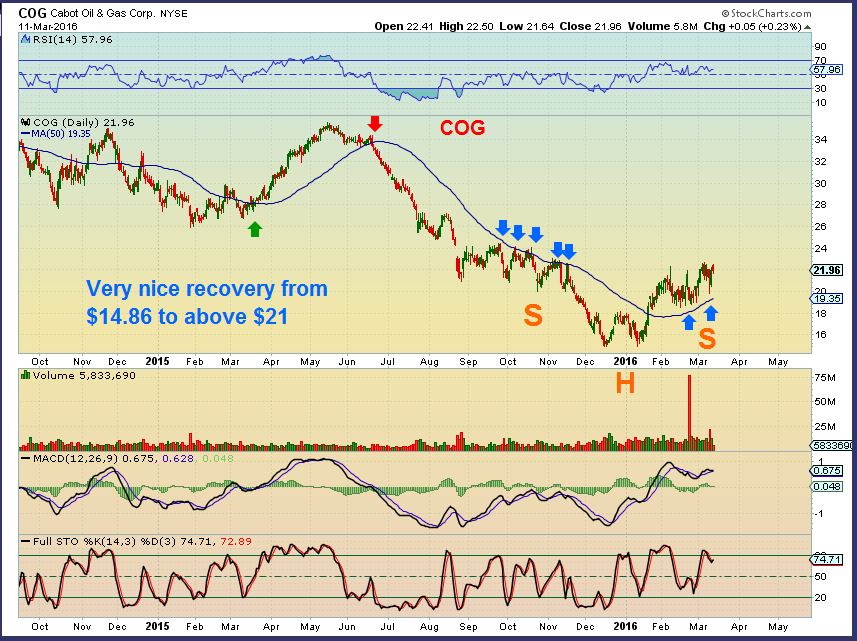
COG –
.
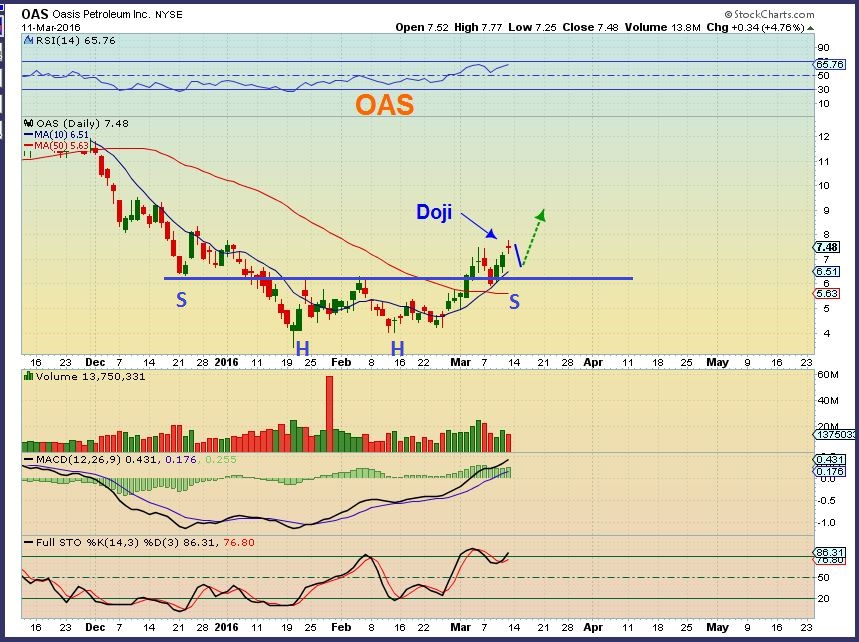
As a reminder – I did point out OAS as a buy . In 2014 it was a $56 stock, so it has upside potential.
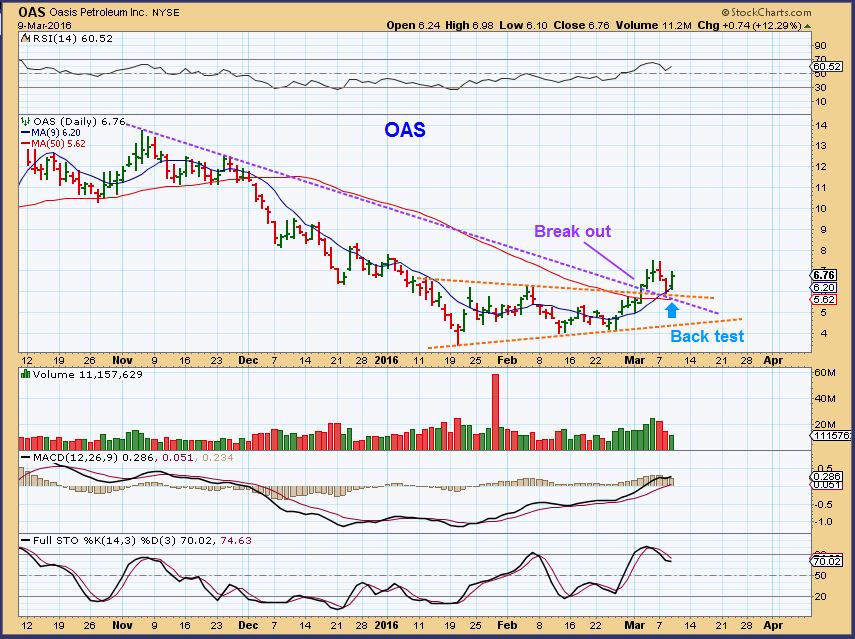
OAS ran to $7.77 since I posted, it may pull back short term.
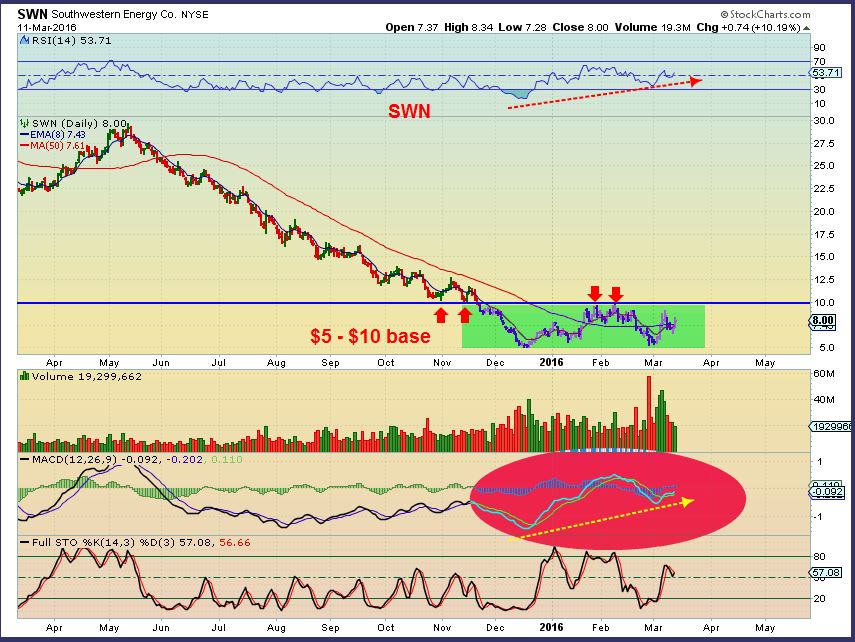
SWN – This is still inside of its base since capitulation last Dec . It has a good set up and could break out higher in time. If I wanted a position in this one, here is how I would play it personally. I would buy a partial here above the 50sma, and add the rest on a break out. Lets zoom out…
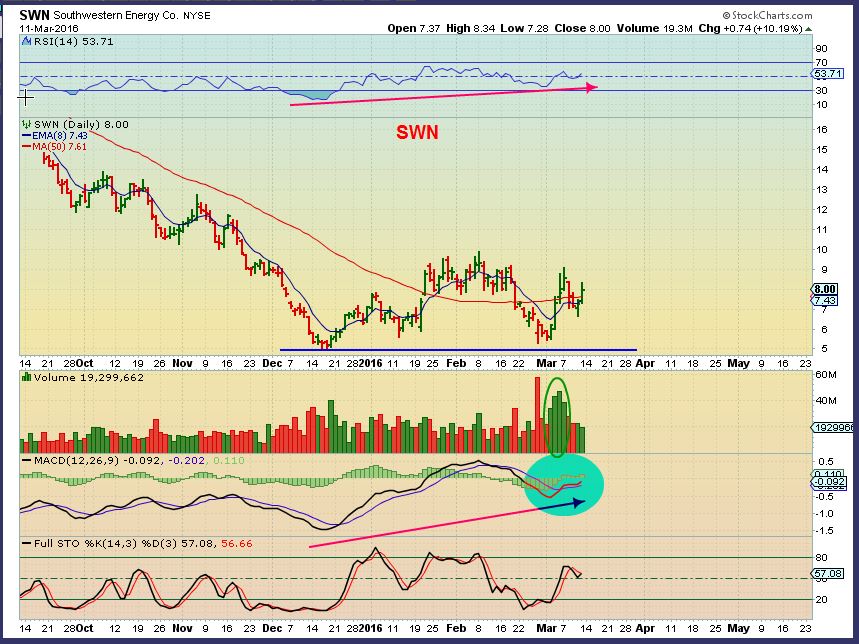
SWN – You can see that the upside potential if this breaks from the base is excellent.
.
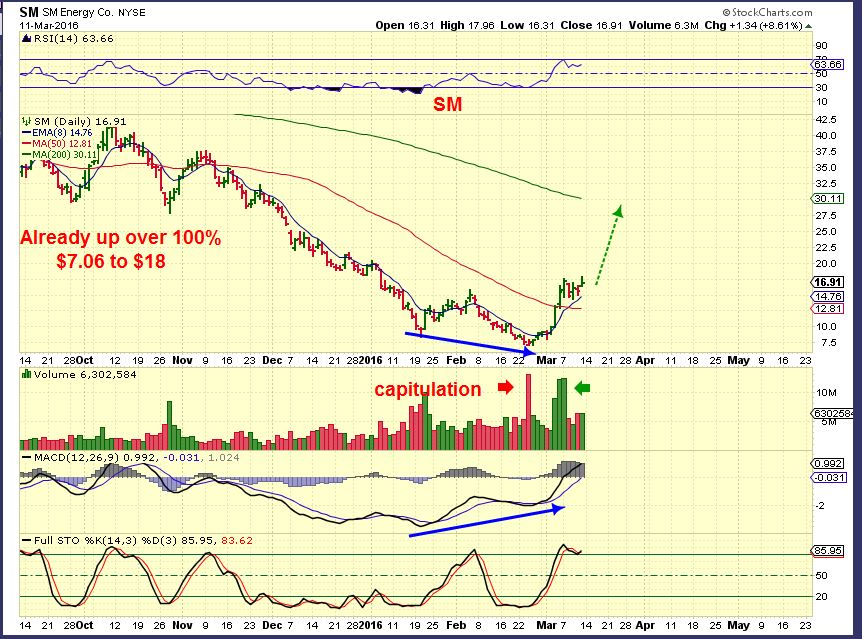
SM – Nice run up over 100% and now flagging over the 50sma. It may or may not drop there again in this flag. I’d only buy a small partial position in this area and see if it pulls back some more, or just wait in case it does. After an entry, I’d put a stop below the 50sma somewhere close.
.
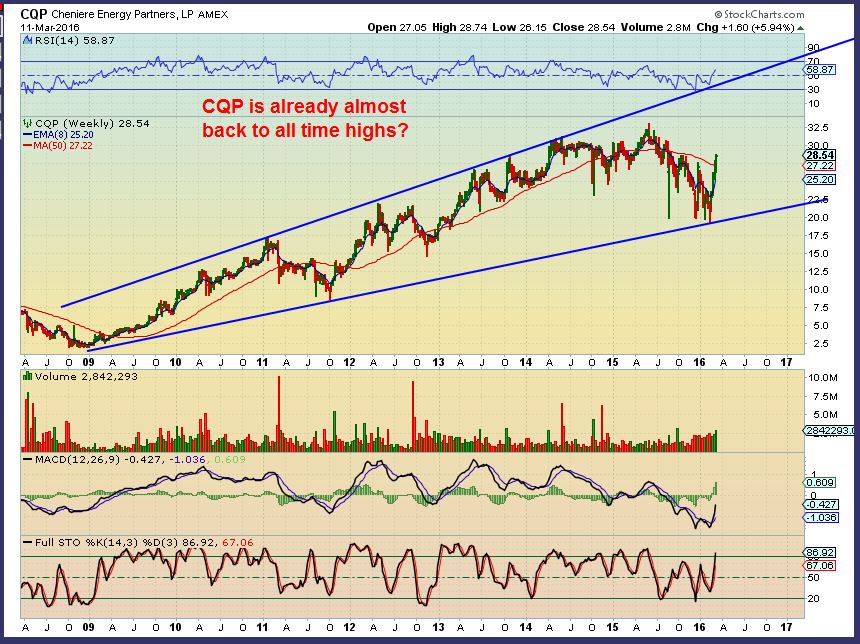
CQP is a different kind of Energy company & is special. I dont love stocks that go straight up, but they can be strong and just go sideways at resistance. It went sideways all last week and broke out. Why is it special though?
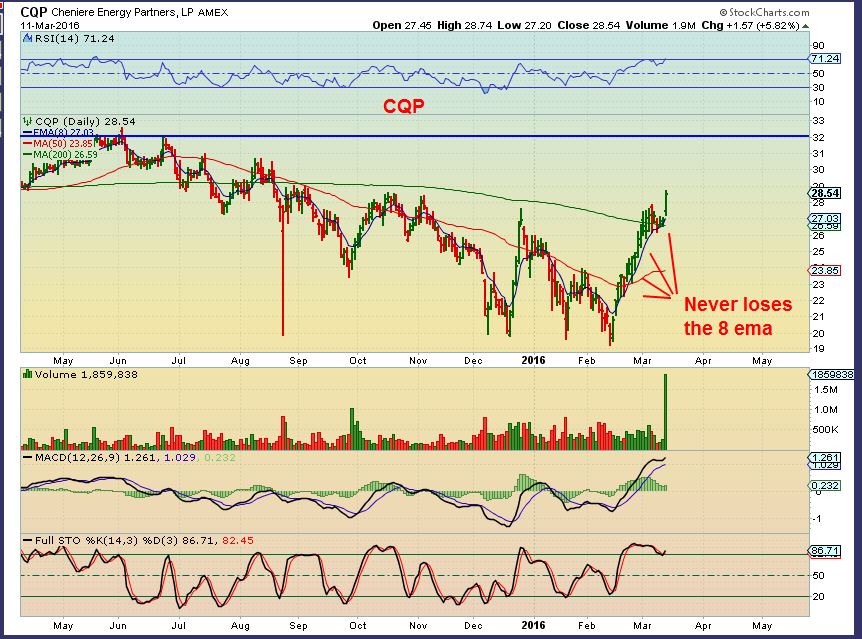
CPQ WKLY – This is almost back to all time highs already? This company is involved in liquefaction and is not an Oil company. I believe they deal with liquefied natgas ( importing & exporting) , I’m not exactly sure how what part of the process they are involved in. Due diligence, the chart surely has held up well.

Great analysis. I won’t touch banks or wtf banks because I personally believe Fed won’t raise rates. But these charts are great. I do think s&p dipps, no way will it make all time high, data suggest not. But we’ll see. Alex let me know if you swing trade volatility like tvix
Hi Al,
Right, I’m not buying those bank stocks either. I was actually just pointing out that an area of the market that I pointed out over a month ago as concerning (BKX) finally looks like it wants higher price. My first BKX chart posted from Feb 2 showed a $66 area for recovery. We are closing in on it.
I dont play the TVIX or UVXY trade anymore. : )
FWIW I believe that if any of the major indexes break the 7 year cycle down trend line then the low is in, and a new 7 year cycle will have begun. The Russell and mid caps are closest to a break.
I really wanted to see the market test 1600 but when the last daily cycle “mysteriously” bottomed on day 16 I started to give up on that idea.
Great report Alex. You operated on SPX like a surgeon with a scalpel. 🙂 caution till Fed is in order.
Thx Wishful – So far it looks like we might get the 1/2 cycle low going into the Fed, and then the Fed may actually lift the markets this time. We’ll see.
Great work Alex! Thank you!
Thanks Peter!
Alex
Not sure Im reading this right? Sounds like you expect a run up to the trend lines and then a decline to 1600 area. Yet, the 2nd sentence seems to say you expect a drop first and then a run to the trend lines? Sorry, not sure on what you are saying here.
“After the Fed, a quick pop this week the the overhead line??
After a 1/2 cycle drop heading into the Fed Wednesday, then finish the 1st daily cycle at those lines.”
Well, I’m pointing out the wedge in the SPX , so I would expect a drop from that wedge. Could be pre-fed or Post – Fed is what I was saying shorter term. In time, it is early enough in the daily cycle that we could run up and tag the upper trend lines too.
If we dont tag them on this run (on the first daily cycle) and then we drop into a DCL, we could tag them on the next run higher, because this first run looks like it’ll be right translated.
My point was : It is too early to short the markets unless you are shorting for a small drop
Hi All, what do you think of the BIO sector? See attached chart, looking ready soon.
https://www.tradingview.com/chart/IBB/HS296mSo-IBB-Biotechnology-sector/
CLF is re-starting an Iron Ore pellet production project that was shut down. They are re-starting based on demand needs for Iron Ore.
Nice reaction by the stock
Looks like a buy there, bouncing off the 20sma
Yes, I was kind of thinking of the same thing Bill
REXX! there you go! I said it looked good on Friday, up 22%.
Yes, I liked that set up too ( I think I said that right below your comment Friday). I also liked SXE ( only up 7% .
.
Did you see GBR?
Yes, you did confirm on Friday. SXE is new to me. Maria will correct the spelling. I also like LGCY and REN here. Coming off of support! You agree?
giggle… i was gonna say… dislexia?
I confirmed – I didnt buy 🙁 It still looks really good ( And some of those shippers as mentioned by Ms C today = looking good too.
I do like the way vale is behaving here, but I want it to tag that 50% $3.50 area just so I can feel that it is done down here 🙂
Refresh-
.
In. First half at 3.75 next at 3.5
NADL looks good – a sideways move over to the 10sma, but
FCEL looks really good using the 10 sma. Forming a cup?
I mentioned a couple of weeks ago that the 3D stocks were setting up well.
They are looking more bullish all the time.
DDD, SSYS, VJET , XONE
Good moves, let that one slip away.
Me too : ( Too many set ups or potential future set ups) to trade
new member test post. greetings from texas.
G-Morning Texas 🙂 Nice to have you here.
this is gonna be awesome. i love just watchin’ you guys bag 1 after another casualties of the greatest capitulation (in jan) i have ever seen. dilemma for all of these companies is to reorganize (shares to $0 but fresh start) or not.
Right (I assume you mean Oil stocks and not Miners, but kind of goes for both sectors when it comes to re-organizing to survive. Many Miners have been trimming the fat and are lean machines again).
Higher prices in the asset will help, since oil companies really need to pay down some debt & return to profit if possible.
howdy tex…)
hi. browsing through threads after i joined, your posts tickle me silly. value of this chartfreak membership benefit? priceless! lol. {-_- } .
teehee…
*probably should delete some of those thirstyThursday latenight posts.. ;o)
*SOG is an instigator.. just sayin…
lol. well, this is I, and I am he. woops pic is too large. apologies.
What is the red guitar ( I could probably guess tell if I could see the headstock).
a Gibson Les Paul “generic” lol.
… occasionly, true 😉
hi tex
Oh Tex – she charges me a fee every time someone says how cool she is 🙁 (J/K)
Go Cowboys!
oh pecos….
TOO took off this morning. Thanks for the heads up last Friday! UNG is making steady progress; still hanging onto LGCY –waiting for it to bounce
Thats a nice base and good volume today too 🙂
I am holding on to a portion of my LGCY too. I bought some lower and bought some at the $1.00 gap fill last week.
Do you track storage capacity @ Cushing?
No, I dont.
my primary focus is the s&p. which is imho at the edge of a breath-taking’ly high cliff. long-term trend lil simple 75-week hi-low i use turned down on that last low near 1800. but i now have accepted the the fed i feel has added some roles it will play when necessary that it was not initially gonna involve itself in when it was formed. These roles of course being global liquidity crisis provider and market crisis stabilizer. its source of funds is limitless thus it can place orders to buy zillions of futures contracts. brave new world and now armed with algo’s, bubble to bubble, crisis to crises. lol. death, taxes, and now add power of the fed that i personally would when facing, do a 180 and run my ass off lol. {`_` } .
I just read the charts, use cycles and sentiment and a few other tools, its been working like a charm so far , for calling the drops and rallies 🙂
this gold development however is killin’ me. outta nowhere it pops up in jan “HELLO! remember me?” lol. GLD is my instrument. I feel that gold has now entered from 2001 wave 5 and is gonna confound with a vengeance. i wanna so bad to buy but need to focus on the i-term legs. but right here right now this moment this fed wait eery quiet it might resume and blow through every resist point. the fed can’t raise rates because they will not be able to make govt debt interest payment. but if they cant raise rates then they lose inflation control. thus price of gold instantly revalued at infinity. lmao.
Going to lunch.
As an F.Y.I. – I sold all of my TGD today at 24 cent , bought at 10 cents and 13 cents as posted, using the 10sma and the coil under the 50sma .
Was waiting for a close under the 10sma, but I’m not waiting for the close. It could recover, but I’m just Taking profit and we’ll see what happens going forward. Maybe I can still get in lower later. If not, There is always another trade 🙂
Have a good afternoon all, lunch time here.
Refresh for a chart of TGD
.
Alex, does TOO look like it can go higher? I’m up 34% It’s paid for a years’ worth of your service 🙂
TOO definitely looks set o run higher, but if its a heavy position, maybe take a little off ?
.. and happy to report that my TPLM thing paid for 12 years subscription Alex!
you likely got me for that long now,.. unless i do something like that again.. but in reverse 😀
LOL- Job security 🙂
U were born to do this …
I decided to bank it all–didn’t want to get greedy….probably will regret it. Here’s another good one
DHT ….look at that base on the 5yr chart
If he was Mafia we’d owe him a percentage of the take 😉
Alex, All, GMO tearing it up
… i thought of u & my engineer & musician friend when I saw this…
brilliant…
https://youtu.be/IvUU8joBb1Q?t=10
I’m very very impressed
yeah… amazing .. my son sent that link to me .. there are two other showing how he built it.. took him a full year.. #amazing
CF… there is also a video of ‘best drummer ever’ – guy wacks on some water buckets… w .. o .. w …
I just finished watching it. I’d recommend going right to the 3 minute mark. He’s good.
Thats cool, not small project to design.
“Marble Machine” by Wintergatan. awesome. 🙂 . i love the vibraphone sa much. ty for sharing. omg gadang thing gave me a heart attack. still learning this TradeStation. had turned up the volume listening to the video and TS’s closing bell triggered. hey i love bells and whistles npi(=no pun intended) but geebus heart attack. My fav part of ex_machina’s ambient sound track is the vibraphone part. i too fell in love with Alicia Vikander’s Ava. 🙂 .
lucky man, Michael Fassbender
did not catch that flick but ahh yes.. she is one beeeeeautiful specimen .. 😉
good film, worth a watch.. has a zen-like stillness.
nice.. tx ..
will add to my list… right behind Kennebunkport’s recommendation today to watch ‘Unbranded’ ;o)
ahh… horses involved.. thatll be right up your straße
mmmhmmmm :o)
(she says after she googled strasse … lol)
i edited for the german ß .
you know your french but not your german
Nice Esset. If only I could put dots over my e…
I noticed hat Ken and Chris ( and Maria) dont post as much, I assume bcuz they are skyping with you.
You are now off the payroll 🙂
..
When I posted NADL earlier, the set up looked just like HK. A sideways move to the 10sma.
They were twins. NADL took off since I left .
I hate that energy is giving back today. Not broken just down. Even REXX only up 7% now 22% earlier.
I hadnt noticed, but I see it now. LGCY actually moved off of the lows. REXX can pull back like that and still get some follow through tomorrow, it is disappointing if you own it though. Probably some end of day profit taking.
Yeah, my newer positions are pretty much all underwater. Keeping it small with lots of different set ups instead of all eggs in one basket. Just need a few to get hit again…
Pull up FCX with a 10sma ( Thats pretty)
WPX tested 8 EMA early this morning, filling my 1/2 pos’n limit buy. Grabbed VALE at 3.75, next add is 3.5. I had sold 1/3 BAS Friday PM.
Realize now with today’s report was a little early with the TZA, good entries so am right at breakeven, tight stop now will eject and re-evalutate most likely. Lots of other energy postions – ERF, CRK, DNR. A bit more cash heavy now that I’m out of all SPY and derivative longs, plenty of dry powder if we get next round of set-ups.
Looks like we may finally be getting the gold and miner pullback here. Tempting to short but haven’t had an easy time with that! Likely going to stay in miner sidelines until after Fed announcement at this point. Anyone still feeling froggy with gold?