
Can We Buy The Dips?
Yesterdays report mentioning Anti-Gravity stocks was just the right thing to start the corrections 🙂 In Energy stocks I think we were getting a bit spoiled with 70 & 80 % gains in a single trade, but not so spoiled with giving back 20 – 25% today in BAS, LGCY, ARP, etc. Commodities are pulling back and Miners may start joining them. Will we be buying this dip? Lets take a look.
.
SPX – My chart from yesterday. I had called for a rally , but now calling for caution.
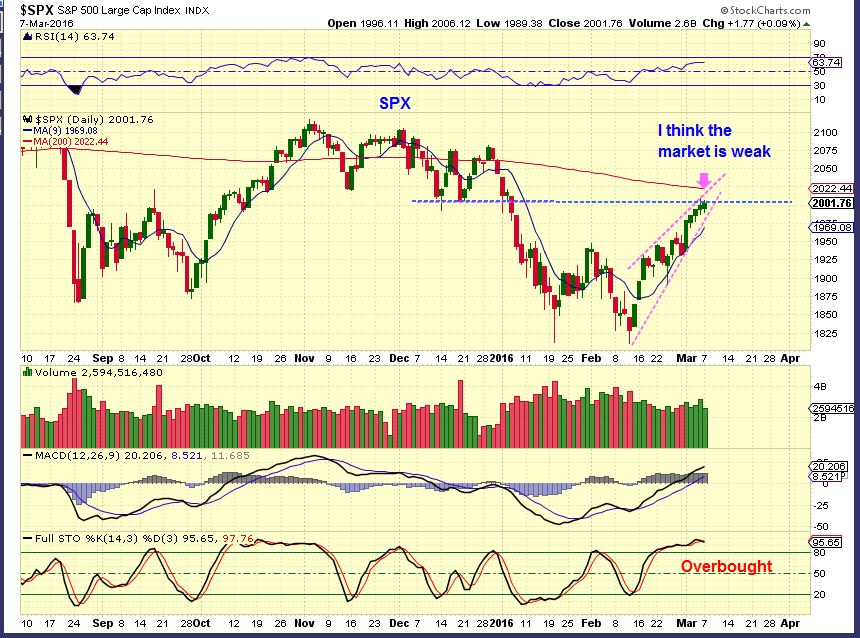
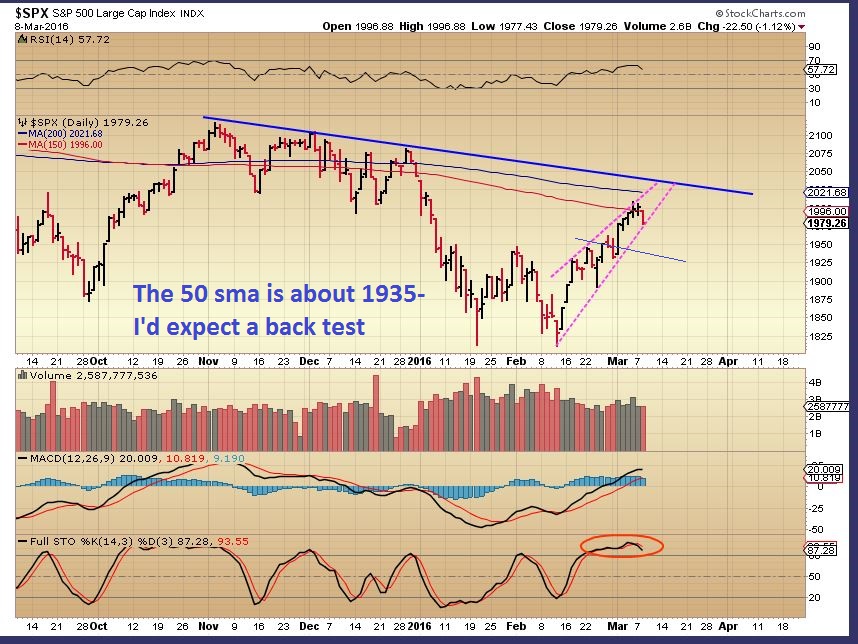
SPX – And we did start a little selling Tuesday. We can go higher since we are still inside of that wedge, but eventually I expect a drop to at least the 50sma.
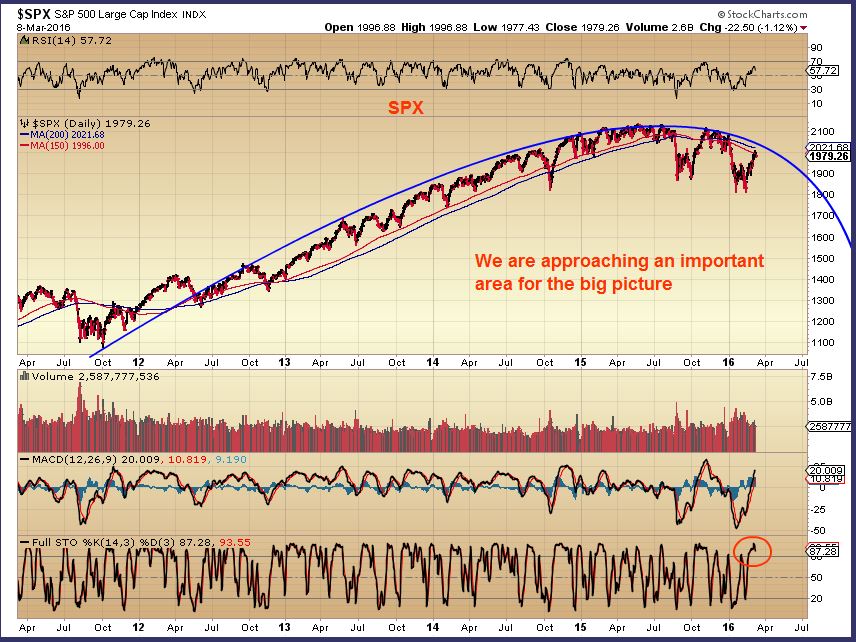
And my longer term view is still playing out . We’ll need time to see if the markets can ‘recover” – Or is this just a death bounce? Overbought Stochastics.
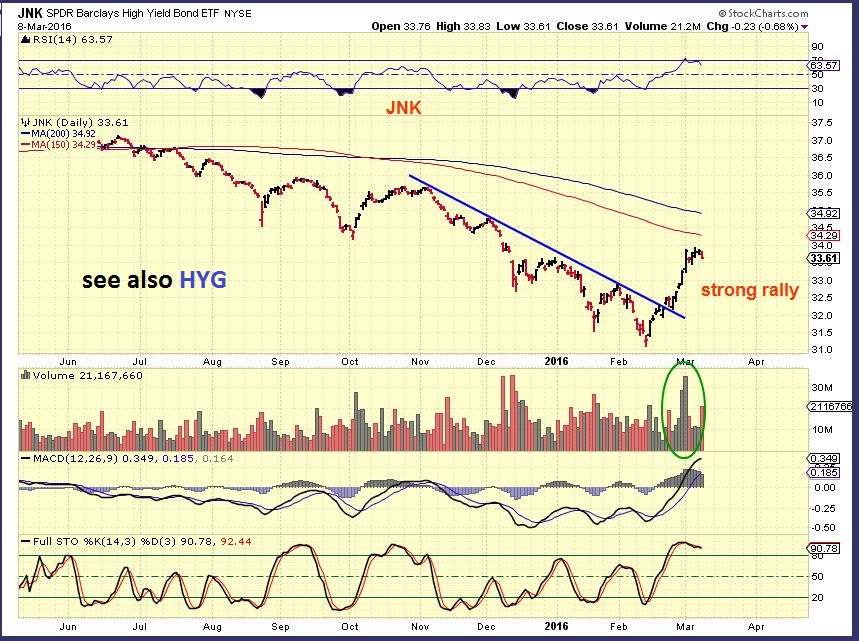
I did have big write up in a December weekend report showing that high yield bonds were calling for the markets to drop. They were crashing and I said that that was not good for our markets. The markets sold off for all of January in one of the worst January’s on record.
NOW…The high yield bonds are almost recovering. They are at least putting on a good show, so there are things to monitor as we move forward.
.
THE OIL / ENERGY REPORT COMES OUT THIS MORNING
.
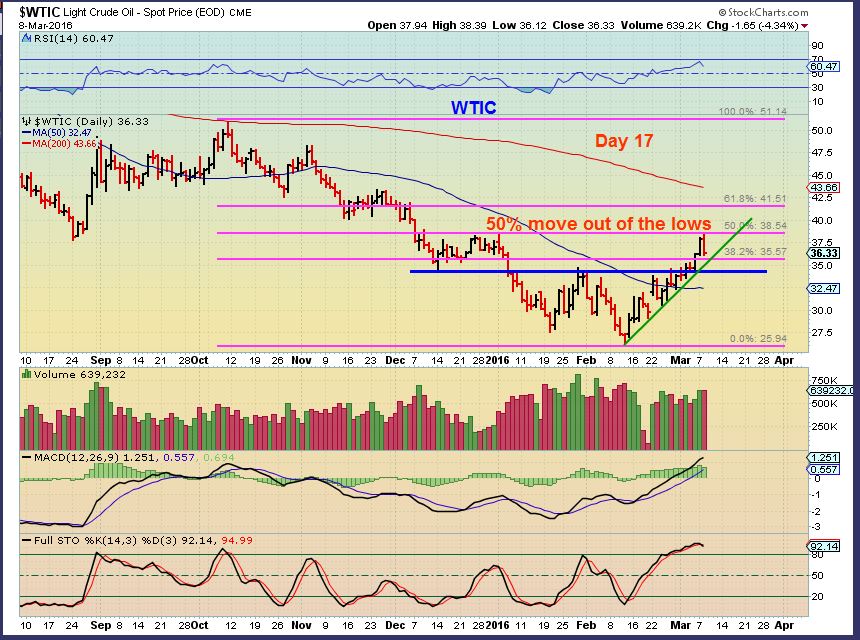
WTIC – Oil took a break today and some of our oil stocks got taken down. I can picture oil just going sideways here ( resistance on the left) and forming an inverse H&S, but lets just see how this goes. Oil has LONG DAILY CYCLE COUNTS. We’re at day 17, these can go on for 30-40 days . The report may even move Oil Higher
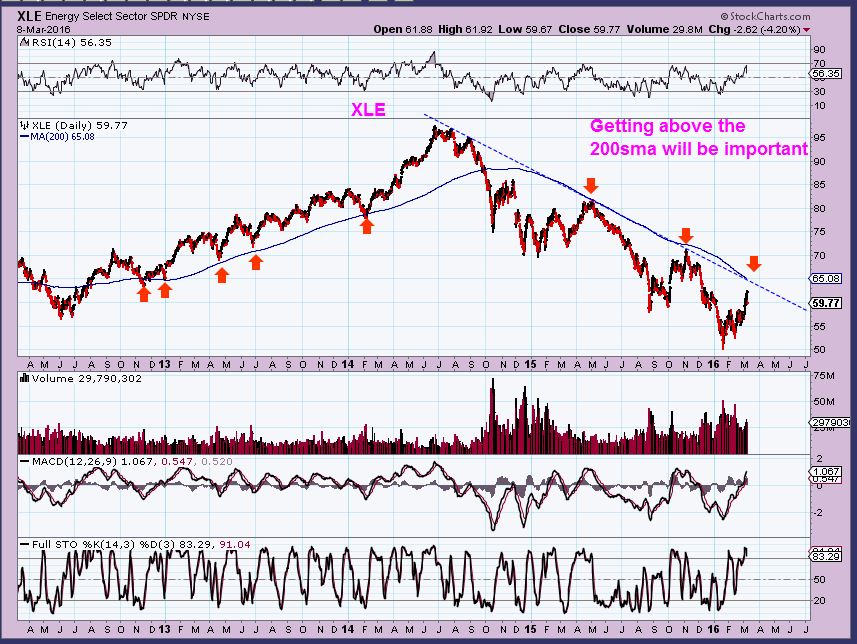
XLE – The XLE approaches an important resistance area, the 200sma.
.
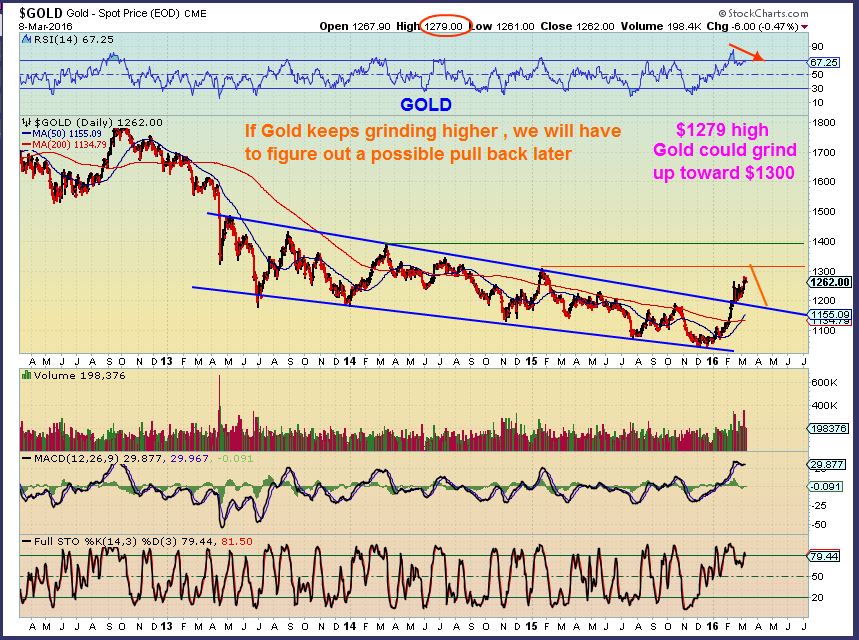
GOLD – Still grinding higher, but divergence is notable. Its hard to predict a pullback target if you cant be sure that the top is in, and Gold hit $1279 today. Looking at this chart, a pullback to back test this break out around $1160 ish would be possible.
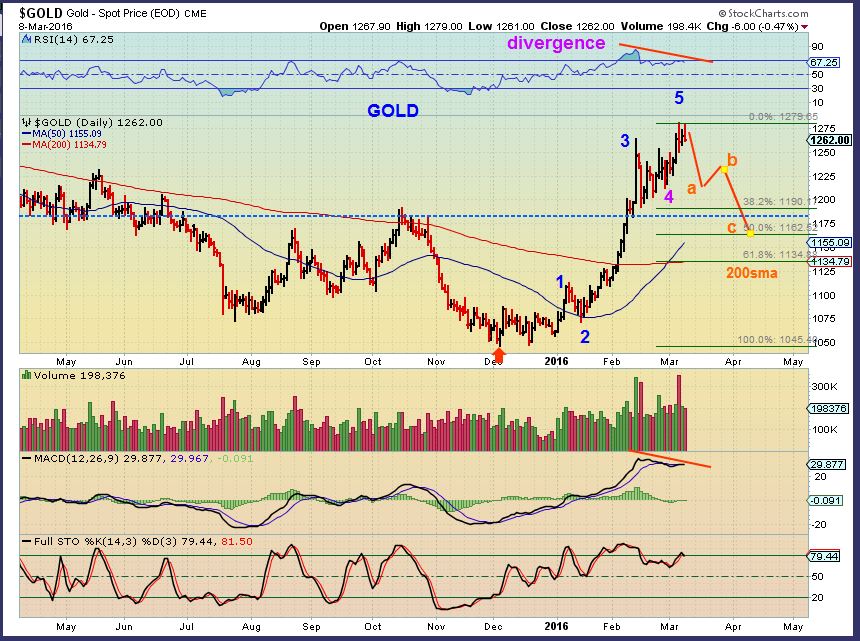
GOLD – If Gold topped today, I’d look at it something like this. It also drops us to the $1160ish area at the 50% retrace. 38.2% is possible too, testing the break out.
.
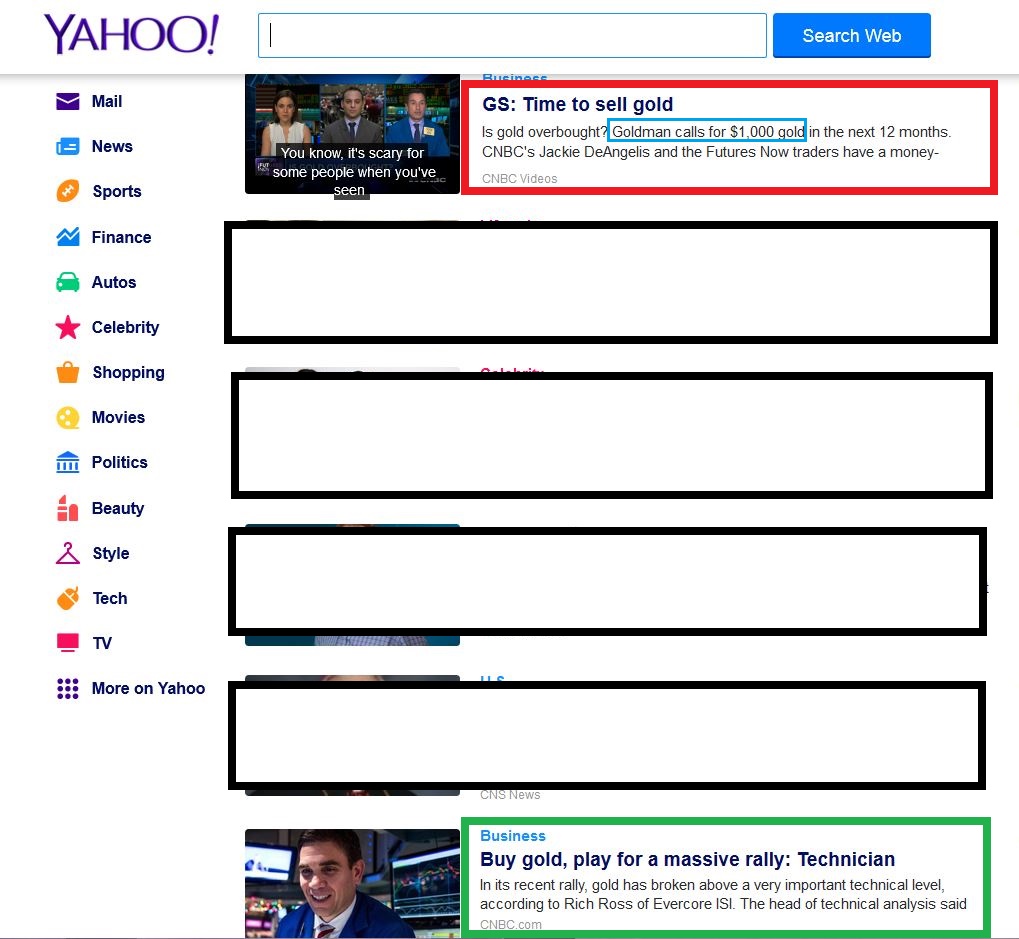
I had to clip the headlines stream on Yahoo today. The top one and the bottom one are at odds 🙂
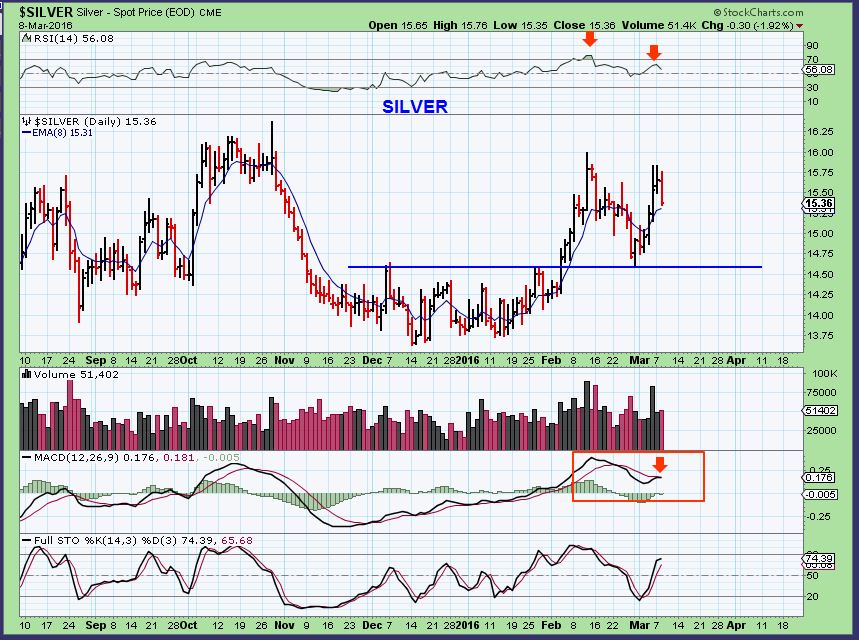
SILVER – Silver is weak at this point. ( Red Arrows)
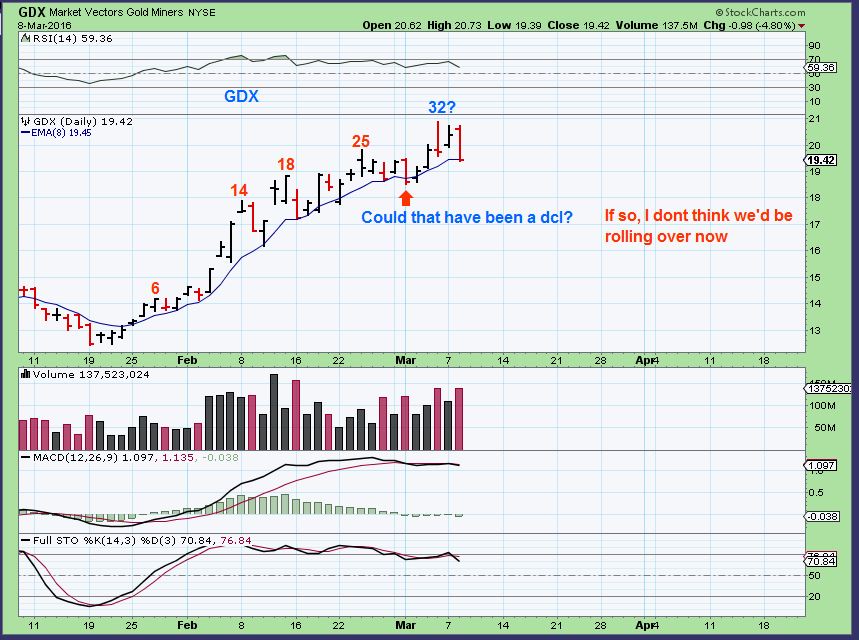
GDX – This has been a very strong run. Miners usually drop fast in a panic when Gold wiggles, yet it has basically held the 8 ema for well over a month. Strong.
.
LETS TALK ABOUT PULLBACKS
.
I have been discussing regularly “Take some off the table, and let some ride” , because pull backs can come at any time. It’s good to lock in some gains when they are there. Pullbacks in an uptrend can be a 1 or 2 day events , dropping price down to a moving average like the 8 ema, as seen on the GDX chart below. They also can become longer affairs (I will explain).
.
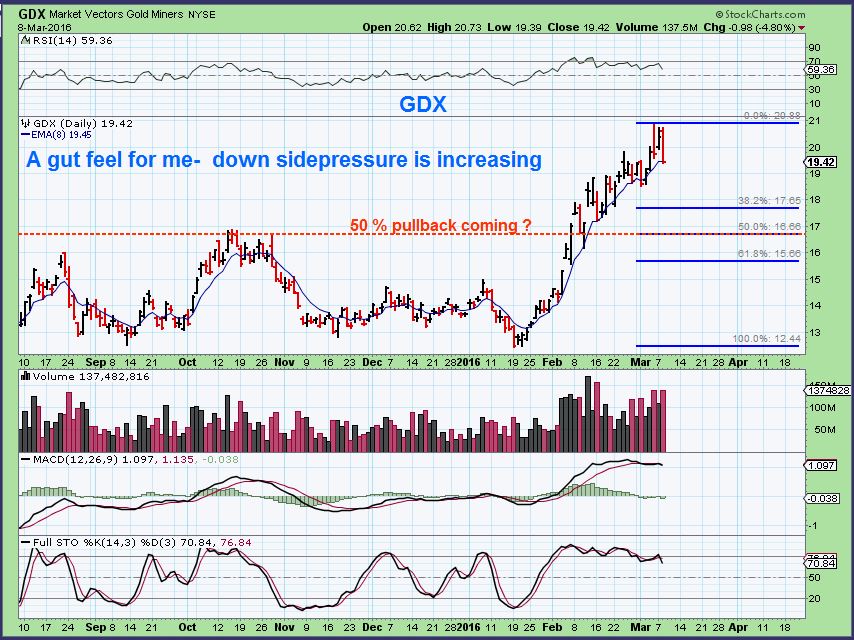
GDX – I do see signs of a bigger pullback coming. This could become a great buying opportunity in Miners, but I do need to point something out. Some may think , “ If GDX is going to drop to the 50% line, I’ll be loading up on Friday!” Yes, it could drop there in days, but…
XAU – Look at that first run up from July lows to Sept . That also pulled back 50%….AND IT TOOK MONTHS. Lets zoom in…
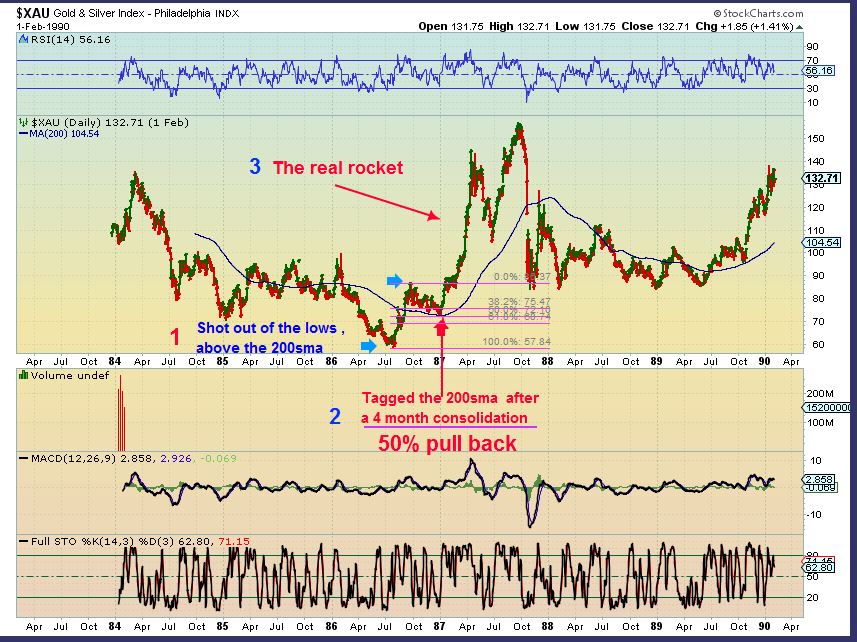
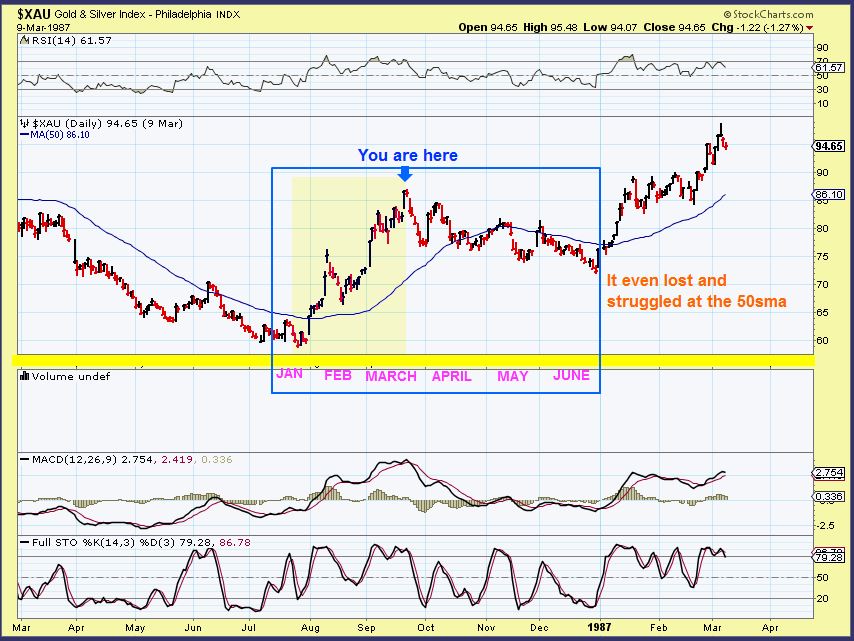
XAU ZOOMED IN– Lets imagine that the move then is the move that we just rode from Jan lows. When would the next lows come in at 50%? It ran straight up for weeks, peaked in 2 months, and pulled back sideways / down for 3 months ( June). Wow. So sometimes patience is the key.
.
So it takes time to watch things unfold. The above pull back in XAU didn’t totally break down, so you could have bought it & held, but you’d be sick from the roller coaster ride. Again, sometimes a pullback is only a week or 2, sometimes a month or more. We’ll keep an eye on things.
.
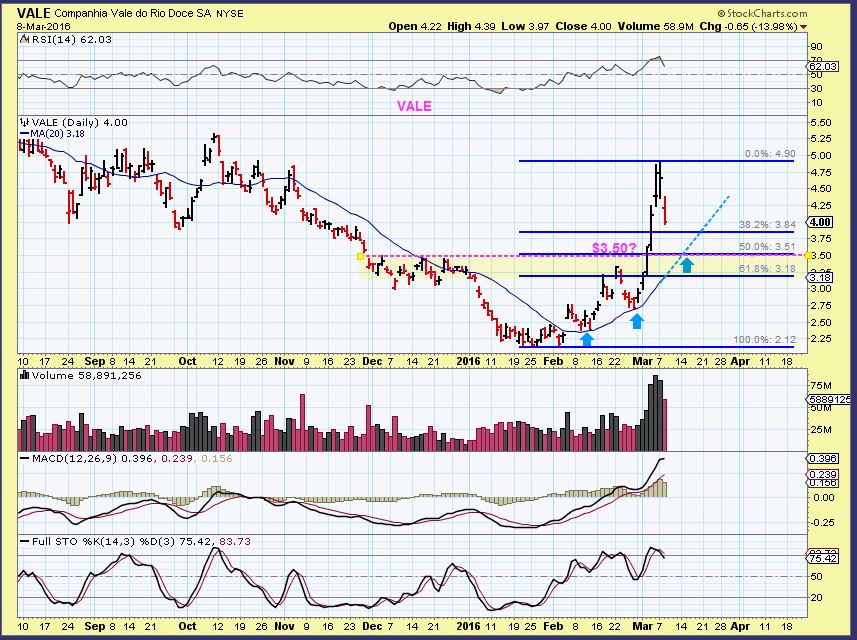
Lets discuss these pull backs a bit more. I’ll switch to commodities.I already showed how VALE could pull back in 3 different ways in yesterdays report. I did that to show how we need to allow time to give us clues when to buy, or you can just sacle in if you are certain of the bullish trend starting.
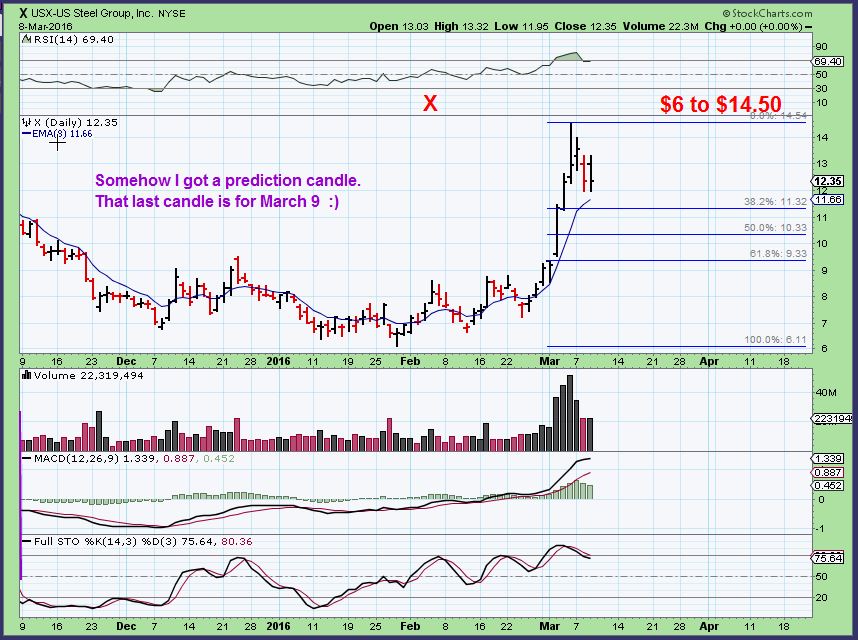
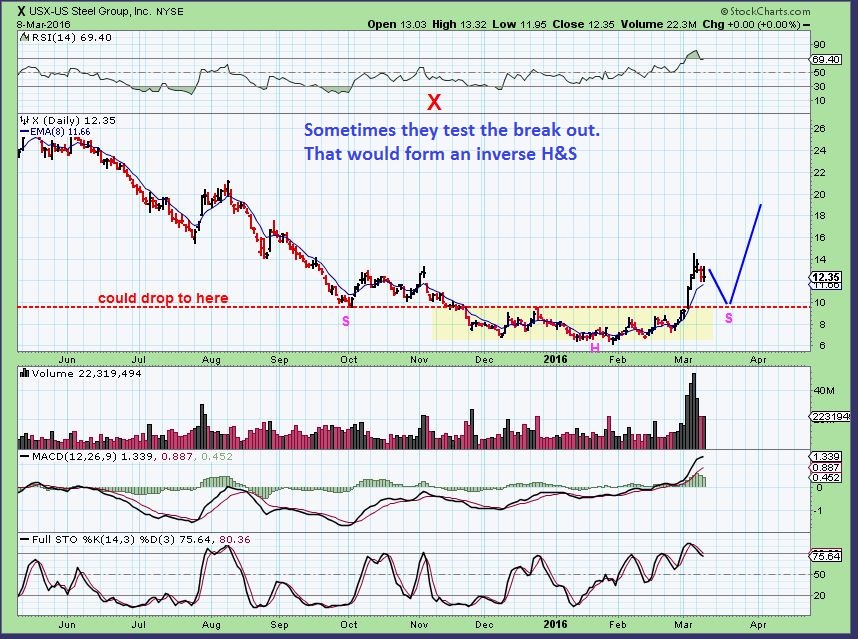
Lets look at X – This is odd, I got a candle for today already? 🙂 The red candle is Tuesday. Even though X was strong and we would think that the 38% would be it for a pull back, sometimes they drop to ‘test’ the break out.That would be 61.8%.
X – IT could look like this and be totally normal.
.
VALE again– Somehow I sold 1/2 of my position near the top above $4.50, and then sold the rest near the top Monday . THAT doesn’t happen often. I do want to own VALE longer term if commodities bottomed, the potential is great. I dont mind scaling back in. I do think that support at $3.50 is a logical place for this to land. Notice that the last 2 pull backs in Feb ( Blue arrows) took maybe 5 days, this may take 5 or more days too.
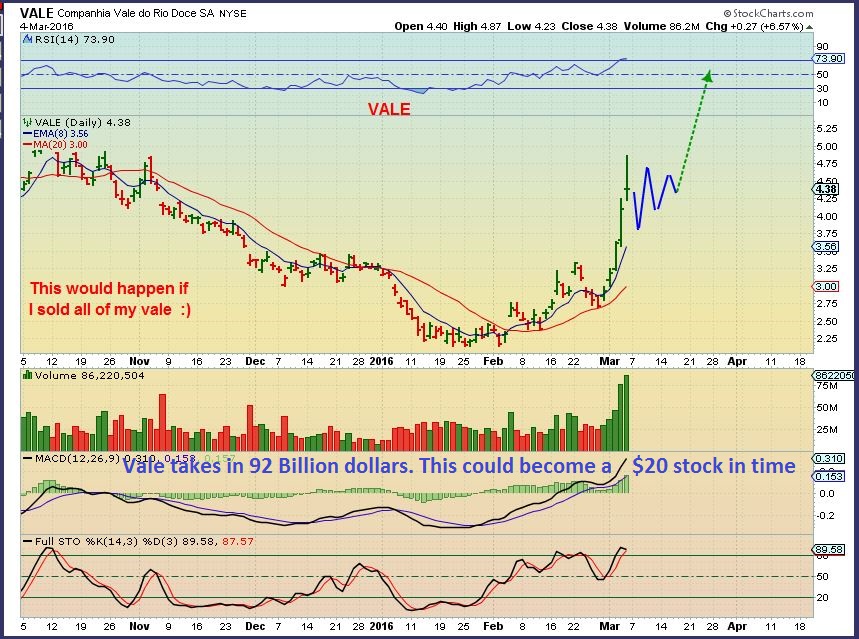
I also posted this March 4th chart in Mondays report. Just a Flag. I would just buy the dips on that with a stop right below.
But over all, this is what looks important to me. This actually could drop to $3 and test the break out, but doesn’t have to. That is why I might scale in, buying a little on each dip near Fib Levels.

.
Those commodity stocks & Miners ran for weeks- so they could pull back for days and weeks. The ENERGY stocks that we’ve looked at JUST STARTED to run , just starting to break from bases. The pull backs may be short and scary, but also may not need to last too long. We’ll have to wait and see.
.
LGCY – The 50sma has been important as resistance. Will it act as support? This is the big picture.
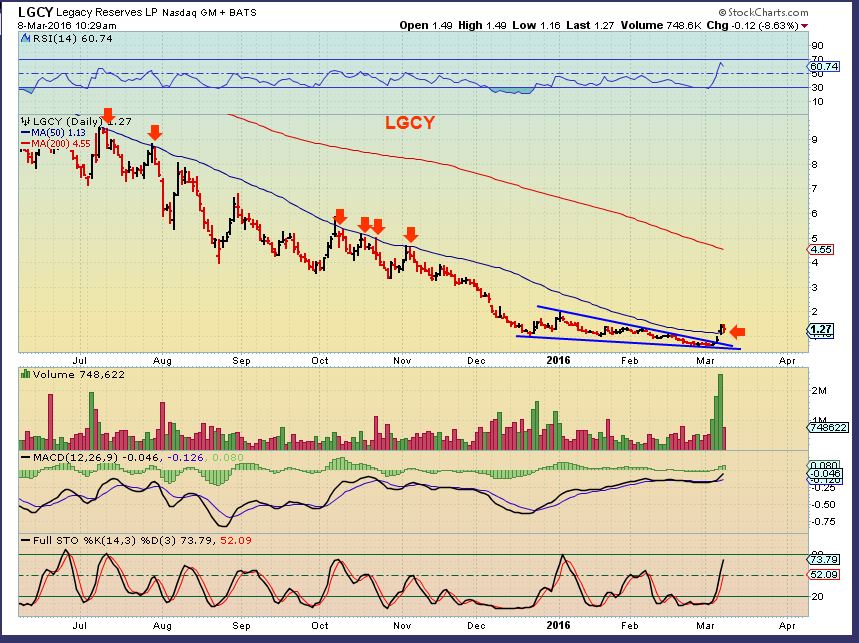
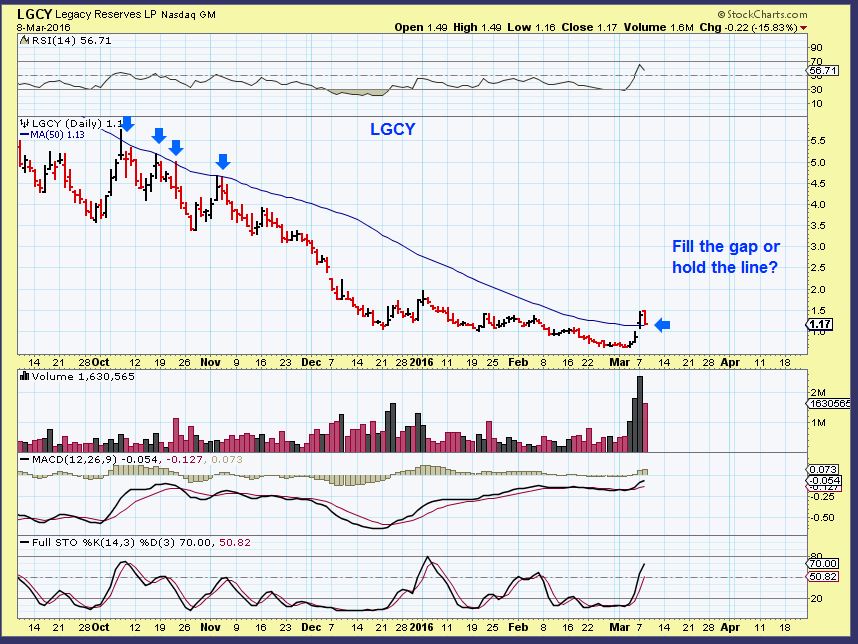
LGCY – There is a gap. If we drift down into the gap and reverse back over the 50sma, THAT is a buy in my opinion. It may just hold up here. I bought this Friday before the break out and added Monday – ( I rode it up & down, still own it).
.
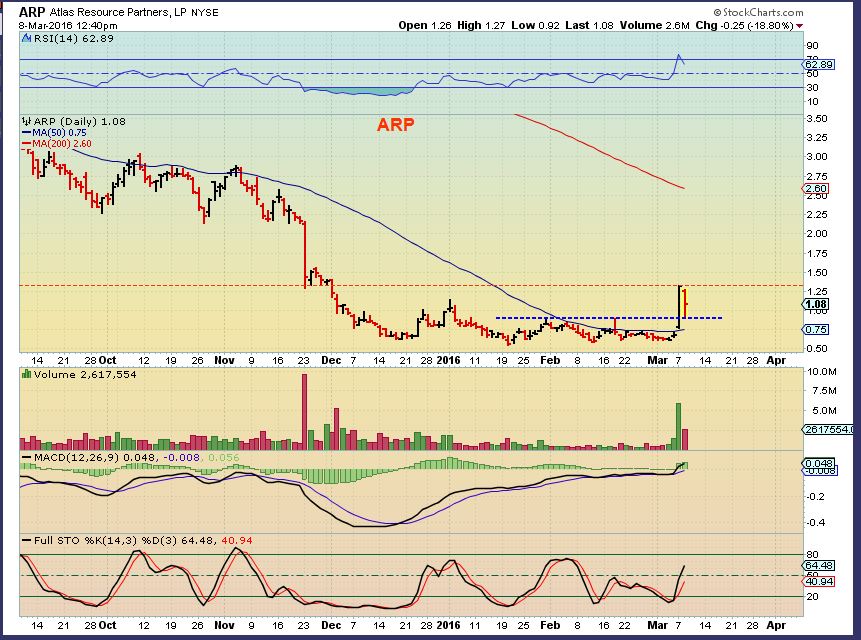
ARP – I pointed this break out on Monday. It was at 83 cents and I had mentioned that I bought it. Volume at 10 a.m. Eastern time was huge already.
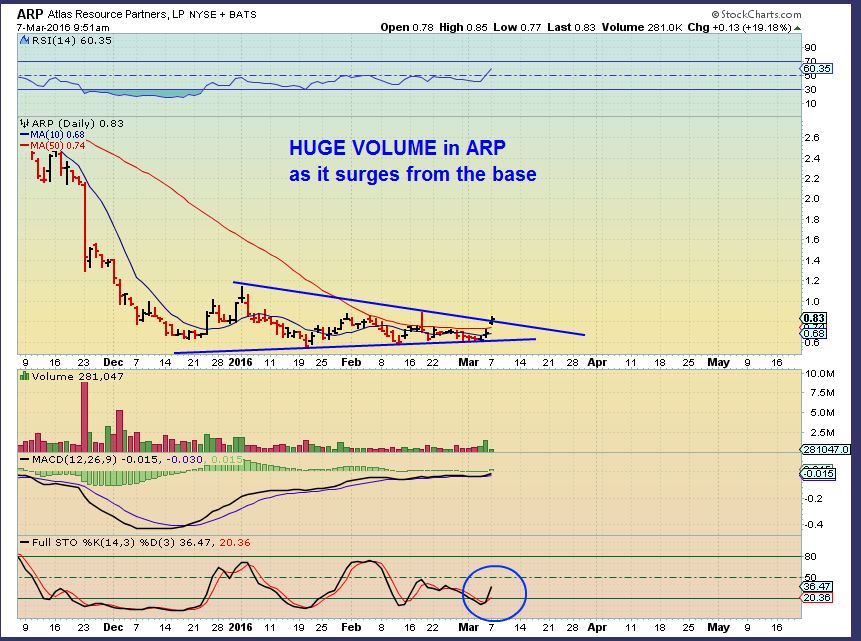
ARP – ARP had a 70% POP on Monday and a 18% drop Tuesday. This could be a 1 day pull back that looks normal, but when you own it? It only feels like a 20% drop that could keep going, right? 
This is still a bullish set up, the drop was on 1/2 the volume as the pop.
SO for now I just want to say that Miners and Commodities have been running from January through March. They ‘MIGHT’ need a bit more of a pull back. I’m looking to add on the pull back, but I need to watch it unfold first and see if there is any indication as to what kind of a pull back we will get.
As for ENERGY ( The OIL & ENERGY REPORT IS RELEASED THIS MORNING) , These POPS out of their bases could just be the start of some nice runs if conditions remain favorable. Why not look back at MINERS and COMMODITIES to see their early pops, since we know how they eventually ran.
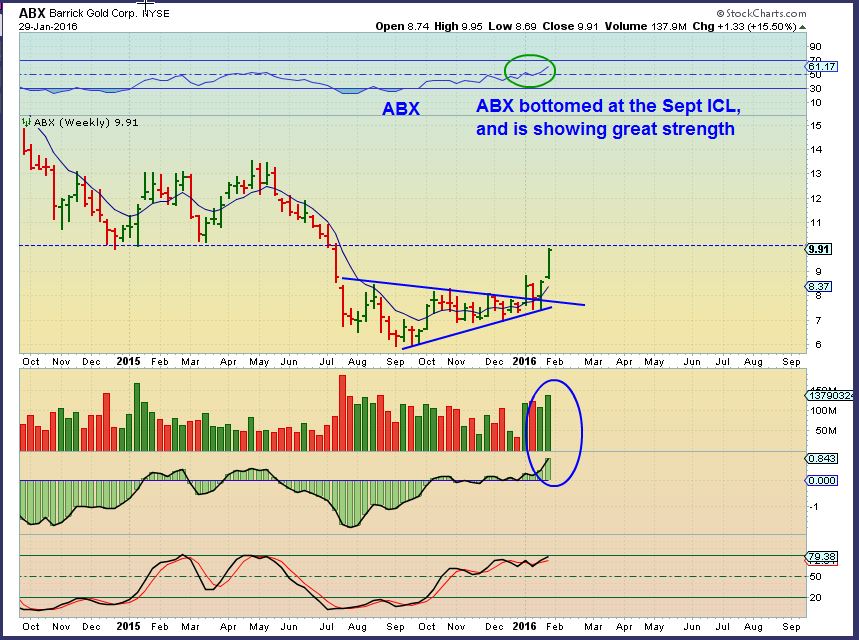
ABX WKLY- Please note that It POPPED from its base on the 1st week of JAN. Did it go straight up day after day? You can see that it immediately pulled back the next week & THEN popped again and started the run near the end of January.
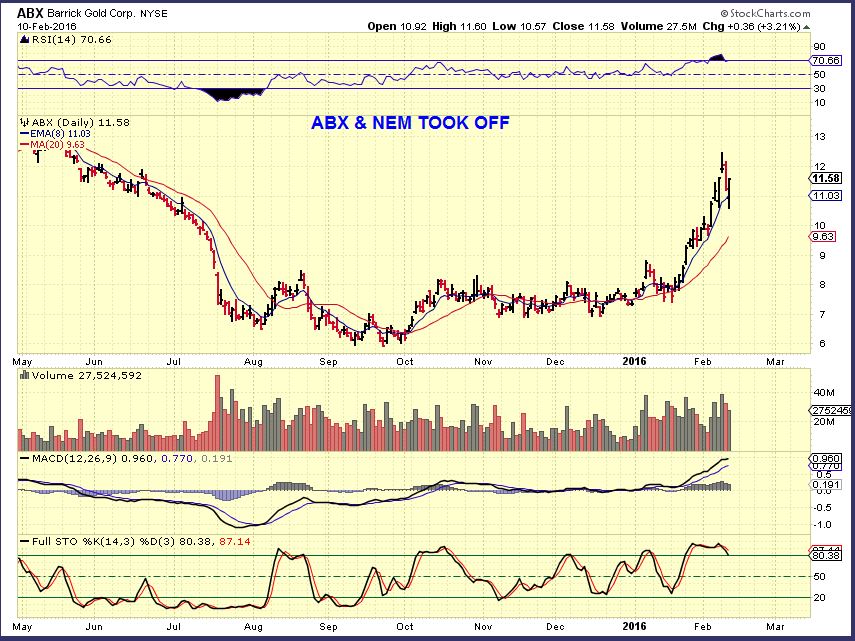
ABX DAILY – Here we see the pop in early Jan / the immediate drop for 5 days/ and then a straight up run started. Our Energy stocks may be in a similar time frame. Its a time of accumulation.
.
Look again at VALE- Was the POP from the base an automatic run higher? Lets pretend that this is our energy stock. The yellow box is the initial base. That is where I like to buy to ride out the wiggles.
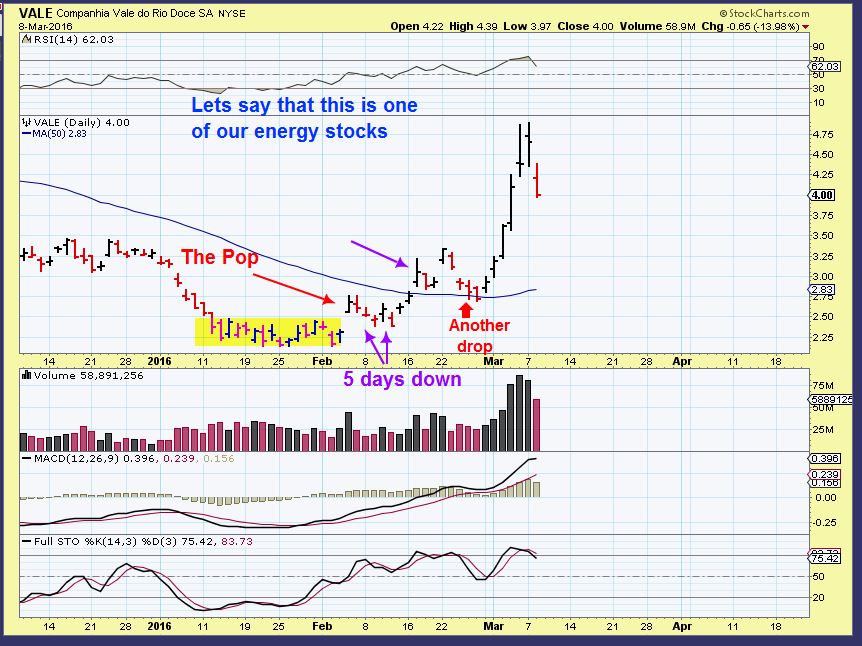
SO that is just to refresh our minds on the idea that pull backs are tricky and by design, they shake out new entries. I like to enter near the lows, because downside risk is defined risk / reward wise. Many of my energy picks popped 50 – 80 % in a day- they could have been sold that day, but I like to catch the lows, Maybe sell a little on the pop or a run higher, and ride out the wiggles, unless I see something more concerning.
The OIL report this am might cause Oil to drop or Pop. If you hold Energy, The above charts are to help guide you. You can also use the first hr of trading to lighten up if the bottom action is not for you. Someone that missed the pop in energy might even add after looking at those bases above. I think we are putting in lows, but as you know and we saw with the miners and Commodities – lows are tricky. Look again above at the commodity / miners stocks at their lows. Look again at Miners when they were in their bases. Many missed the move after it started higher because the move got explosive and only had 1 day pull backs. Traders were afraid to jump in as it went higher. If you see ENERGY stocks breaking from bases and bouncing around, it may be time to buy the dips. I will keep an eye on things as the days go by, but I still like the set up in Energy / Oil stocks. I hope this detailed report on Pullbacks can act as a guide for you.
~ALEX
P.S. If a report like todays helps you with pull backs, etc, why not right down the date or title of the report in a notebook and look it up again later for reference? 🙂


Alex how u feel about Nat gas? Seems like it’s not moving any lower & I think I’ll play dust today as well.
Hi Al,
I like the way NATGAS is acting and I do think we are seeing the lows.
It is kind of stabilizing, but not really bursting higher yet. Often at NATTY lows, we see a couple of small days and then a pop, so I do think we’ll see that pop ( Maybe tomorrows NATGAS report). HOWEVER, reminder, tomorrow is that NATGAS report 🙂 Anything can happen.
Thanks alex
The UGAZ chart looks great, starting to move up out of a base. I don’t own it, but I see more upside than downside
glad it broke out at more or less at the open.. im only holding for the day
SO – Here’s an idea.
I HAVE LGCY Up 40% pre martket. BAS up 25 cents , Do you own energy stocks and yesterdays drop made you question holding? You could use the open to lock in gains and wait for the Oil report if that makes you feel better. Just an idea .
Hi Alex. Can I ask where you get after market information. All the sites I use are hit and miss with both after and pre market quotes – some are quoted and some not.
Actually – I just saw that I am getting a false reading ( I was using marketwatch). I checked the XLE and got a true reading, and GDX was a true reading, but LGCY is a false reading. : ( LGCY is $1.38
http://www.marketwatch.com/investing/fund/gdx
Thanks Alex
… i like when u do this chartfreak…tx
Thx Maria, It’s sort of like thinking out loud. I actually owned 5 energy stocks right out of the lows, all very profitable except PQ. I was thinking that maybe I should lock in gains on some or partial , and go from there.
Pullbacks in VALE & X look great so far. Zeus back to $12 soon? I think we may have a good trading pattern setting up in some of these.
URRE finally appeared back in my shares list,.. thank gawd.
and it s moving back on up.
nice one BILLY
Yes, finally working. It had a good base. Let it roll!
URRA up 32% now
Outstanding volume
Alex, any thoughts on URG? Could be getting ready to movie higher. Coming out of a base. Earnings were. very good. Double bottom
I dont find it appealing to me here. No volume yet ( That could change, but very light today so far).
I was just looking at DNN, USEG, URRE, UEC URG . Long term charts do look to be bottoming in Uraniums.
I like DNN on a longer term wkly
I wanted to mention BTU 2days ago at he 50sma- But I am weary of it going BKRPT. It is really having a nice move out of the lows here.
That may have been a DCL in Miners as shown on the chart in the report, and this may be ready to run higher,
I dont want to jump the gun, but I think MINERS may have just entered a 2nd daily cycle.
Yikes this is strong.
wow… nugt .. 52-59 by 11am .. really??? :-O wheew… so much $ to me made out there…
vale .. this amazes me .. if it holds .. the confluence of that trendline and the 38% retrace.. unFreaknReal
#IcantStandIt
https://www.tradingview.com/x/D7FKg3gv/
The set ups are good. I think ( Hope) Vale and X drop a little more personally. I’d love to get Vale at the $3.50 area
How sure? I hate jumping the gun, I always get burned. Miners still look overbought, but we know they can stay there a long time. Bouncing of the 20sma is bullish. Barely a 23% retracement? Talk to me CF…….
Thats what I’m looking at. SO I looked at all of the individual minres and they’re pulling reversals too.
Some look better than others, but this was my GDX chart in this report , IF That was a stealth DCL ( That would be normal timing) This would be day 6 and that dip was that little dip that comes after the lows to shake out people, then we go higher.
.
ACTUALLY – Now I have a trend line break and a break of the 10sma. Today could be the DCL too?
Check out GORO, SA, NGD, AU, TAHO, LSG, etc etc .
This has been a strong move off of the lows.
I got stopped out of NG this morning before it rebounded. Still have EXK but that is the extent of my miner exposure. So mad at stupid SA for leaving with me. Again.
EW friends… anyone have gdx as ending diagonal… in the 5th wave now?
https://www.tradingview.com/x/ZRim1rSH/
ps. this is NUGT 65 minute…
hi maria, why you think nugt will plunge to 40’s? because of the FED meeting? that means gold would have to break the great resistance of 1200 and go to around 1150
hi Al..
I am not sure.. it is just an idea — IFF .. IFF this is an ending diagonal then price should return to the beginning of diagonal – waiting for input from my EW friends who are MUCH smarter than “moi” as miss piggy says…
ahem .. SOG, Chris, KenDawg* – get off the slopes and do a girl a solid… slacker. ;o)
*actually .. i should say – off the beach as it is BEAUTIFUL sunny day my way….
*that’s me in my dream… except replace the bike with a horse… 😉
And maybe the guy for a girl?
no……. im there on the side drying off cuz we were just rolling around in the sand and water …
see his shorts are wet….
YOWZA!!
*he’s exhausted….
Has he got his rod out as well!? 😉
ha ha ha… oh chrissss .. don’t encourage me – there are new peeps here & im tryn2behave 😉
*yeah… something like that .. ;o)
I was talking about his ‘fishing rod’!! What were you thinking of!!!! Lol 😉
giggle ….
ps. my new mic came.. let’s chat about that chart later…?
I’m at home for the rest of the evening. Just so long as it’s before 7pm ‘your time’. After that I’ll be in bed!! So see how the rest of your day goes. 🙂
🙂
Tonto,
Actually that pic is not too far from the truth lol except different motorcycle, I perfer an Enduro Comp. bike so I can take the dirt trails to Lake Michigan. 😉
I have Gold working on a wave 5 of 3 presently……..
1. Damnnn
2. Tx LR 😉
This is my GDX 1 hour chart. I have a very simialr pattern BUT have it already completed as on my wave count I have wave 1 in an earlier position to you Maria. But apart from that, very close. 🙂
thank u chris :o)
Dont tell Maria, but You just answered my question for her (but I didnt dare ask her, bcuz she gets touchy when I ask about her charts, even though I love her charting ) 🙂
I was wondering why her wave 1 didnt start at the major lows, it just appeared in the middle . Your count looked similar to mine in the report, except that I was using GOLD. Refresh
.
I suppose that makes me ‘the sacrificial lamb’ then !! Lol I noticed your gold count today and mine is very similar to yours. I also have that same 5 wave count but the only way I can make it work is for a first larger wave 1 to start at the major lows 2 Dec ’15 and a larger wave 2 to end 31 Dec ’15. IF…IF that count is correct then this five wave count is only a larger wave 3 with a larger wave 4 correction to follow before a final push to the larger wave 5 high and then potentially a much larger intermediate correction that would likely tie in with the next ICL. That’s my best guess at this time!
LOL .. .WHAT?? I do not … lol .. turd.
I love love love input.. how will i ever learn and grow without it?
#SillyMan
But.. sorry – im at work (naughty– seriously my boss is SITTING right here with his tea and im semi-ignoring him while he asks me about his compass ap for his phone.. lol #sorryNotSorry
— ii will have to study it on my next ‘break’ .. ha ha
Oh , sorry, I thought that was a private message that I sent to Chris 🙂
#caught
mmmhmmm…..
ps. i did not read ur report yet either… u put this in today??? lmao
ur SUCH a closet Elliottwaver….
That’s funny. Too bad I can’t comment from work. B/c I’d throw out all sorts of stupid stuff. Having not read the report. 😛 Sometimes I can’t get to it until after work is over.
This chart says “buy DUST” to me
gave you my GDXJ EW at the top, last friday..
you got a memory like a sieve Missy…
(remember Lara, parallel chans & all that?!)
anyways up.. its same as Chris’s GDX & Alex’s GOLD
Whoa whoa whoa – dont get her upset, SOG – she’ll ‘gif’ the crap out of you
LoL thats what im hoping for.. all dressed up her in her dominatrix catsuit
ohhhhh… SOG … didnt your mum ever tell u … be careful what u wish for’ …… meeeOwwwww
lol… yess this IS actually true–juggling too many balls at once…. ;o) thanks — ill have to go back and look at that… I’m trying to keep up.. (haven’t even read CF report today ..don’t tell him…)
you’re at work.. youve got a good excuse.
(chart is reposted above.. just REFRESSHHH!)
:o) thannnnnnk u SOG… I’ll peek later…
Who knows. I tried to end Wave 3 two weeks ago. Nope!
Credit Suisse announced this week that it will implement a reverse split on UWTI and UGAZ
on Monday, March 14. At that time, holders of UWTI will receive one share for every 10 they currently have, while holders of UGAZ will receive one share for every 25 they currently have.
2015, UWTI had a one for 10 reverse split and UGAZ had a one for five reverse split.
Sine that date, UWTI plunged 81%, while UGAZ lost 91%.
Even worse, since inception in 2012, both ETNs lost more than 99.5% of their value.
source: yahoo finance
DUST will be next
Yep
Excellent rpt. Alex, 5 stars.
Thank You Michael – Glad it was helpful. 🙂
Miners? Not sure the damage is done. I’m looking at this (refresh) for GG, GOLD. Harmonic patterns typically form as a W or and M. This could be what we are seeing. Many of the miners are rebounding now, but it could be just the move from B to C that haven’t played out yet. IF we get a move higher than A then I’m all in. I’ll wait until then. Thoughts.
Close up GG refresh
Just my thoughts….I dont know about this . It would be like testing the lows in the 2nd daily cycle after a right translated first daily cycle.
CF, Don’t pay too much attention to the 88.6% retrace from CD. There are so many Harmonic patterns with varying depths of retracement. I am more concerned with getting past the last high before turning the BUY faucet back on. I’ve seen these M and W Harmonics play out before. You can see it on the previous GG patterns. The other miners, like I said may be making BC currently. GG will be our forerunner. Perhaps
Oh, thx bull. , I thought it was an automatic price projection if fulfilled.
yes, it could definitely be a type of double top, but using cycles, we should be able to get above it after a small correction .
I did see the pattern in the prior areas, but it wasnt right out of the ICL for GDX. It was in the 2nd & 3rd daily cycle . GG really lagged in those first ICL s in GDX.
Bull? You’re calling me Bull? Freudian Slip! Funny! 😉
Yes, I didnt see it at first, edited it 🙂
Yeah, dude that would be a darn on a 100% retrace. We get a 100% retrace and I’m outta here for good. Tell me when you see the top so I can buy it, per my usual.
Cason, like I mentioned below to Alex, just watch the BC leg, don’t pay too much attention to the CD leg. Look for a struggle to get C past A.
Shippers: SBLK, NMM, SALT and others have pulled back on lighter volume.
Yes, I’ve been watching everything that we saw rally , and trying to find good light volume pull backs too. 🙂
BTW.. If any of you Amurrikans & assorted non-Brits, are interested.. this series was on the UK BBC couple of years back..
Traders: Millions by the Minute.
http://www.bbc.co.uk/programmes/b04j52br
can watch both full episodes on YouTube..
https://www.youtube.com/watch?v=vyOulC3hxfM (ep1 – financial traders)
https://www.youtube.com/watch?v=_ZgV0fWGWmM (ep2 – home traders)
worth a watch
UNG making steady progress on heavy volume. 🙂 not ballistic but like the strong base.
AT breaking out of the base. Could run from here.
I went into pq this am at 55. Low volume day. I’m a new trader. Unsure if I should hold overnight or what. They seem like a legit company doing some good things.
Hi Jeff,
You paid less than me 🙂
I still own it and I do like the set up, but it is resting from the initial pop.
refresh for a chart
.
not sure when it”ll get going again
.
I’m still holding some. It was late to the party and now is just stalled. Good entry price.
Jeff, I have more confidence holding right now based on some of these bottoms. I am giving my stops a bit more room than I would if we were sure this was a short-term bear market rally. I got out of SA and X earlier ‘in case they pulled back’ – now check it out. Oops!! (they were still both winners for me)
Many of these bullish reversals in miners look real to me
ABX looks real. some silver stocks had good reversals. Tough call
Goro looks ready to run
NGD & SA
SA is in Beast Mode. So, so sad. PLEASE COME BACK SA!! I couldn’t believe that miners turned positive with the craptastic performance out of gold today. Gold didn’t exactly ‘break out of the flag’ with too much vigor. But miners are holding strong. But not until after I got stopped out of NG. 🙁 It was doing crappy, so I’ll just find something better now.
I just know UGAZ will be at $1.50 and I’ll kick myself.
I’m kicking myself for not shorting when gas failed at 2.4…..
Big volume in NADL?
PACD is way over done compared to the rest of the sector. Completed 61.8% retracement. Excellent entry point, IF the sector is recovering now.
Love your Gartley(?) patterns, Bill.
Read a book by Arthur Merrill years ago that categorized those “W” & “M” patterns and gave them % success rates of completing. Some had high scores. I think that may of been before Gartley named them – not sure.
Would love and expect GG to get lower than the previous low next week. That is my time frame.
Agree with your take on Gold direction.
Randy
Alex – here’s my one big question – we expect that the markets could roll over at some point soon. How will that affect energy? Oil and S&P have been very highly correlated recently. In fact in the trip up from 1810 to 2000, the end of the rally was mostly energy and materials and not FANG like was the case in 2015. So, we have new leadership (potentially) but what will happen if central banks or China or boogey men spook the market? I guess what I am saying is worrying that we have a good thing going here and somebody will ruin for us. When the tide goes out, all boats go down with it (except my gold boat!!).
Had a crazy idea. Certainly not for everyone. Or even most. But some of the small cap energy options are still really cheap right now, considering the recently volatility. For example, DNR (in my opinion) isn’t pricing in another huge surge. March monthly (expires the 18th) for $2.50 strike are $.20 So, if DNR retests the recent highs (3.76) in the next 7 trading days (no, not saying that it will, saying ‘if’) it would pay $1.20 per with a max downside of $.20 so that’s a 6:1 risk/reward. 4 calls with commission is under $100, but if it blows up would be worth nearly $500. It’s a lottery ticket but if you have $50 you made recently…
Added to TZA today on market strength, now at about 1/2 position. Add small position in VXX. Wrong below 21 on VXX and above 108 on IWM.
Stopped out of NG before reversal (it was crappy anyway). Sad I sold WPX. Bought DNR, holding BAS.