
Is That A Bull Flag?
On Feb 17th, after the recent run up in Gold, I mentioned that it could Pause and form a Bull Flag. These are often just a pause along the way (although they can fail). So lets discuss the last few days and discuss Golds Bull Flag and other important implications that I am seeing.
.
Feb 17 – I discussed a possible Bull Flag forming after a strong run higher.
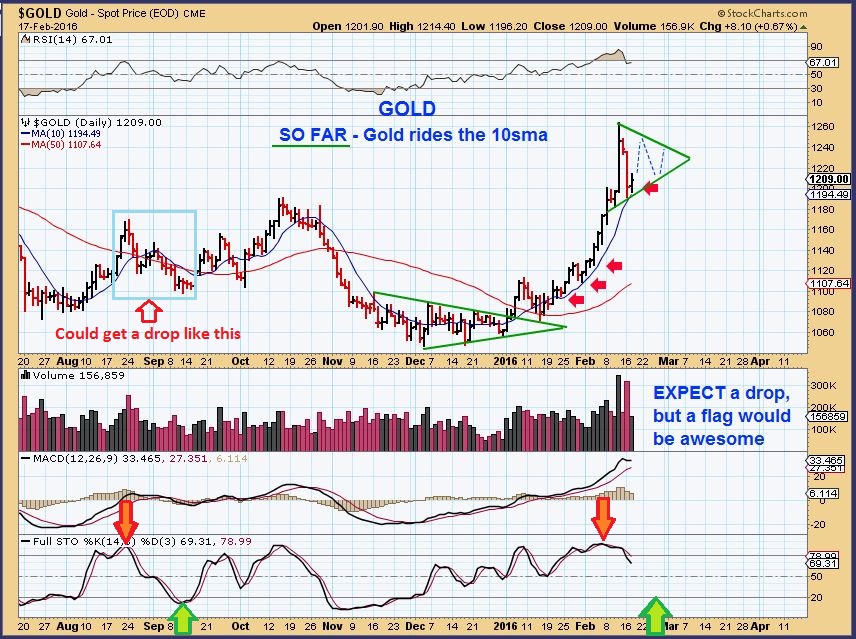
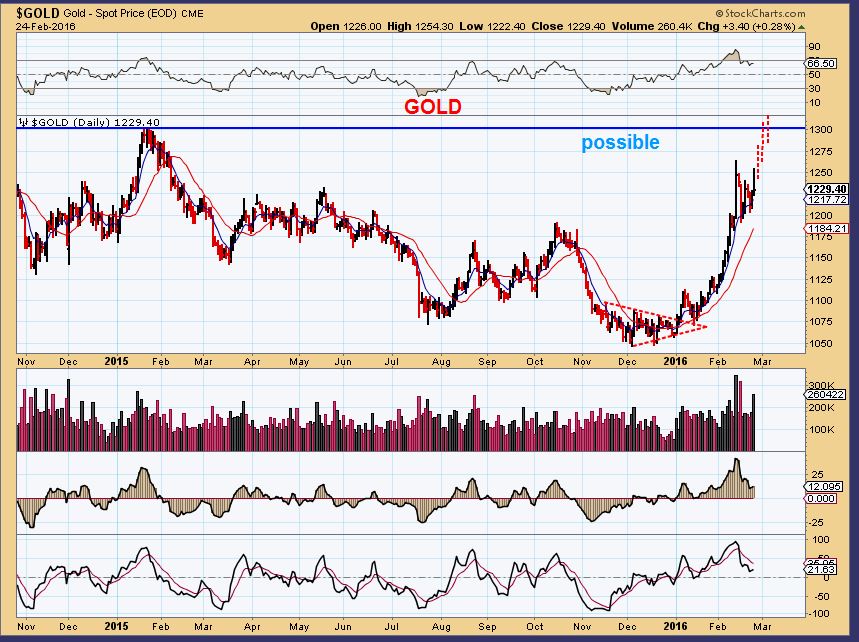
Feb 24, We have the Flag and it is often just a pause before continuing to run higher.
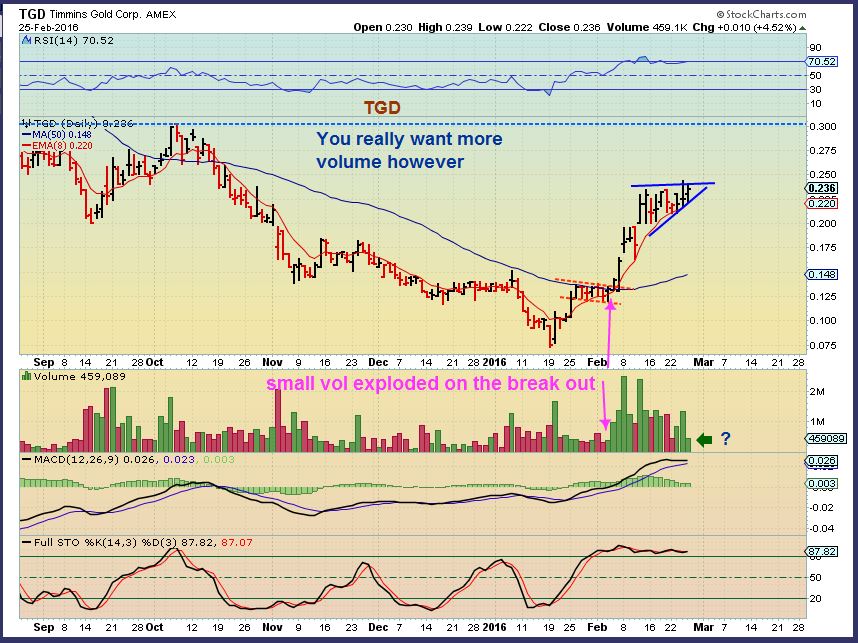
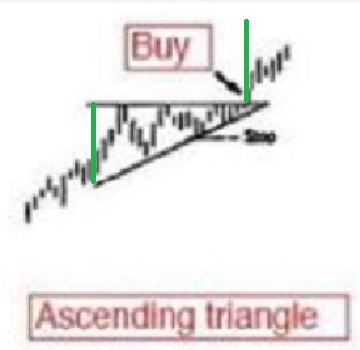
Then I started seeing similar bullish formations in various Miners, like TGD. This is an ascending wedge or ascending triangle, and usually plays out in a bullish break higher too. Hmmm.
Lets discuss chart patterns and look at some more Miners…
—– Yes, I know that I wasn’t going to have a report Friday, but these patterns can be helpful in hinting to us what Gold might do next week, and I wanted to share this even if no one wants to take a trade on Friday. Also you need a fresh clean slate to write on in the comments section after yesterdays deep technical commentary filled that space . 
.
TGD is an ascending wedge. This is an ascending wedge pattern. Like a Bull Flag, You also buy a break out and place a stop below one of the lows. I place mine a little below the apex.
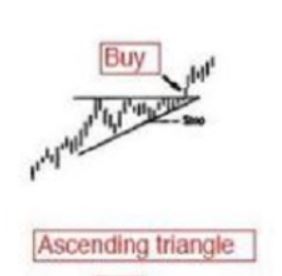
This is how it often plays out, long or short. The size of the opening of the wedge is the target at the break out.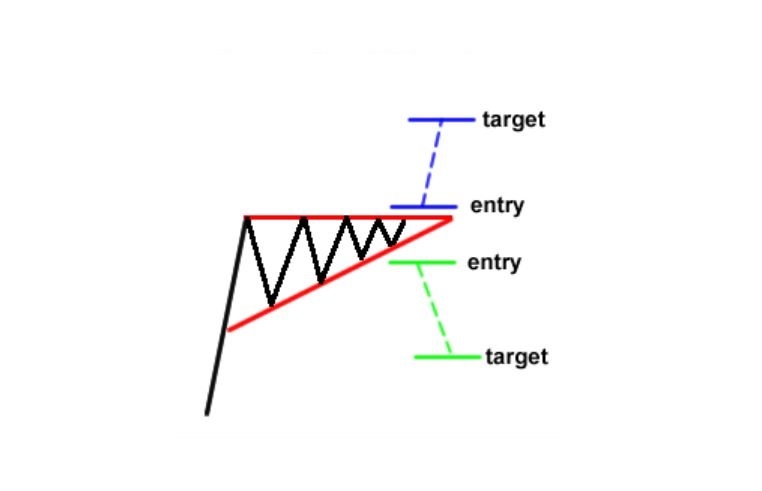
This is the pattern seen in Gold currently. Gold is having a little trouble with the follow through, but this is the pattern so far.
So the idea is for a trader to buy that break out, but I often buy inside the flag with a stop a little below the 10sma, because the move can be rather quick once they break out.
.
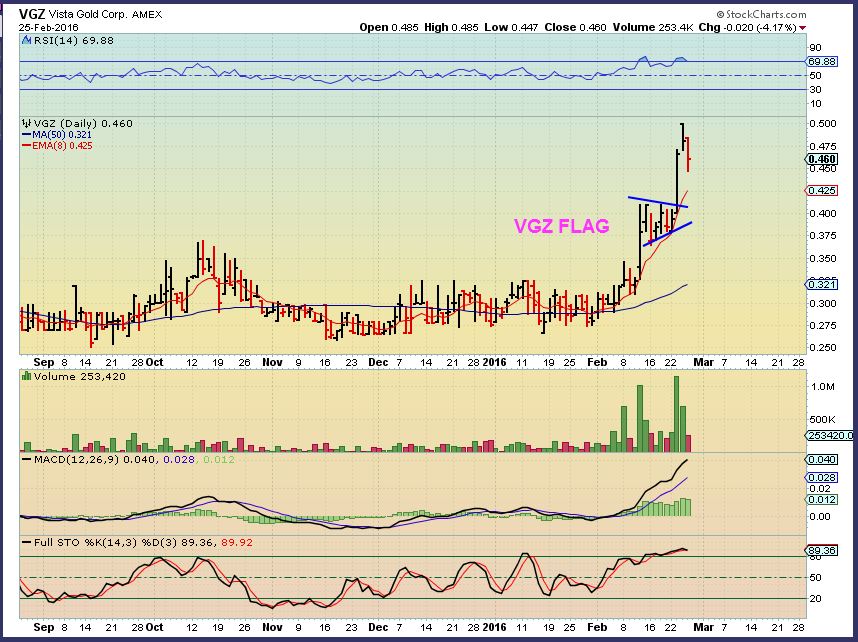
VGZ had one this week, and it acted correctly
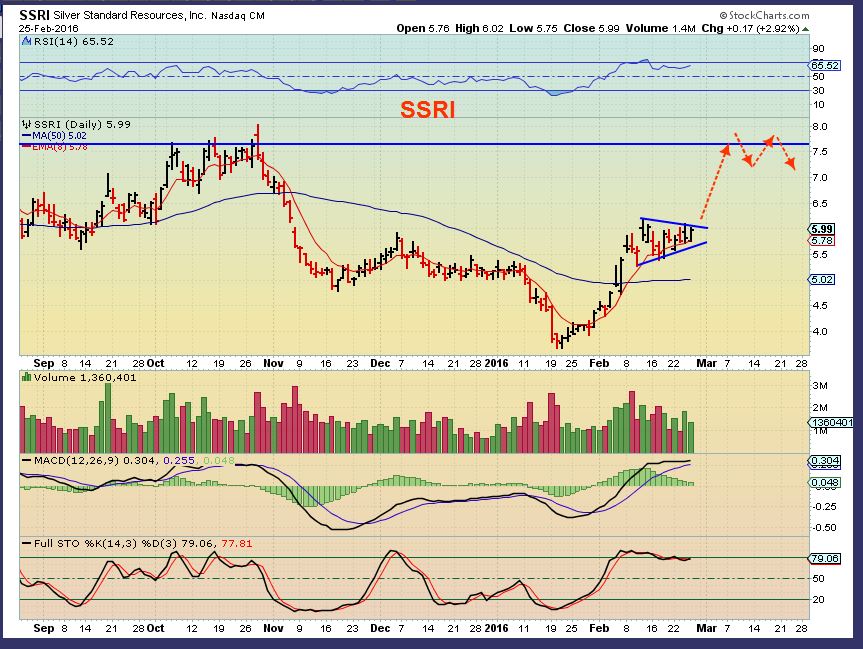
Look at SSRI
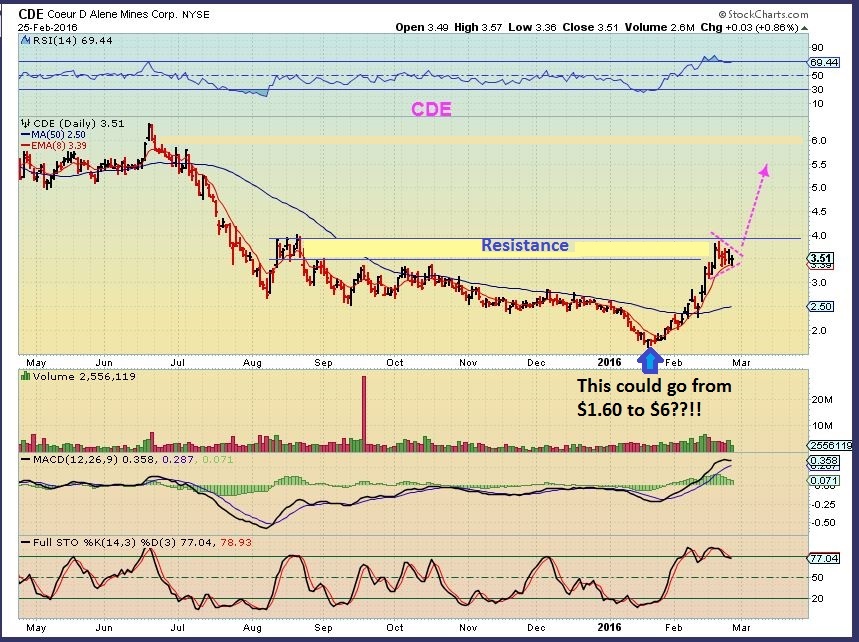
CDE– If this plays out, we are watching CDE make HUGE GAINS. Many miners are making huge gains.
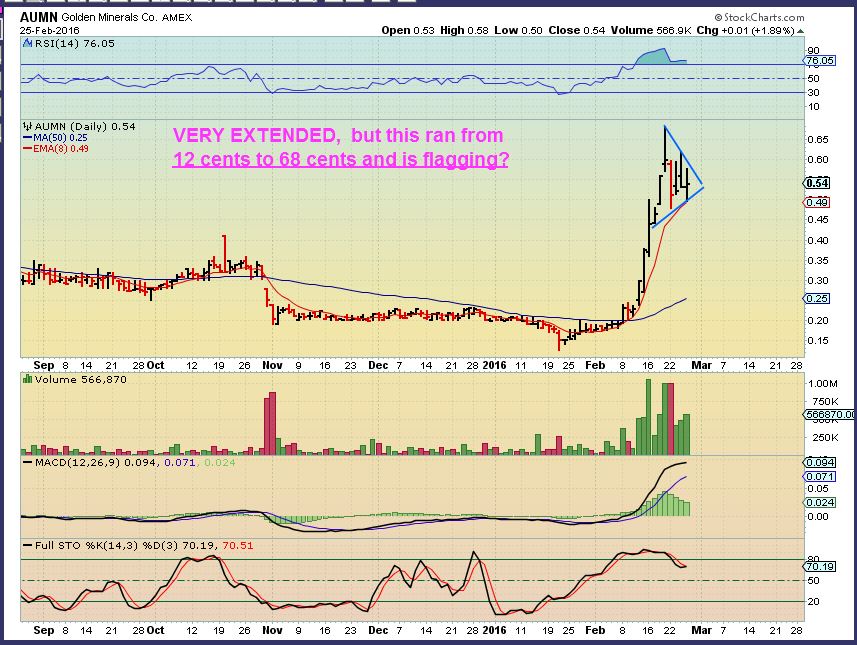
AUMN has made some huge gains. $0.12 to $0.68 in days, that is crazy. Anything that goes straight up is in danger of falling back, however, we do see a flag consolidation and it is no longer overbought as a result…
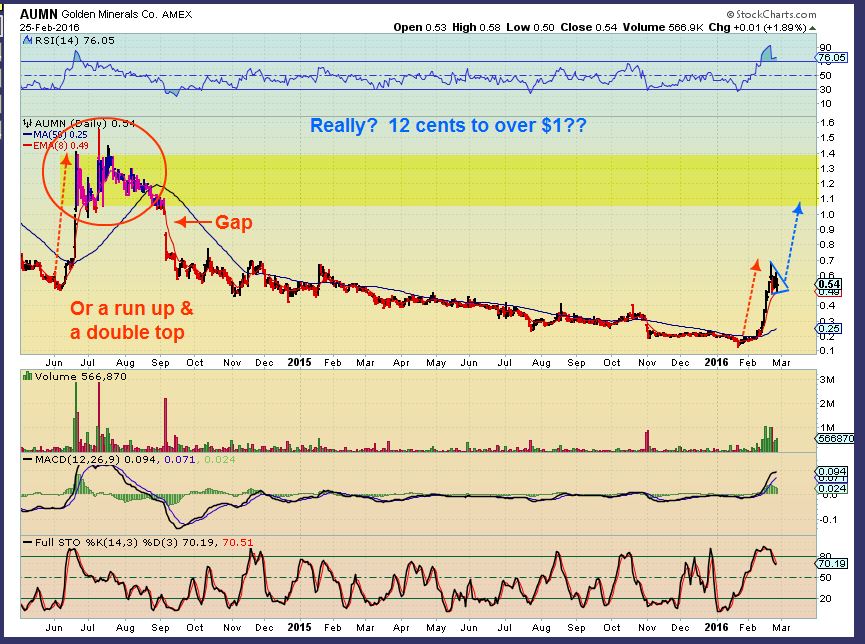
AUMN– And this is where it gets really crazy. This could just double top inside of the current flag (like on the left of the chart) or this could get ridiculously overbought and run to $1 area..
.
Do you remember when Miners would sell off deeper and deeper into impossible levels of pain? Some are now climbing higher and higher, leaving those waiting to buy that dip behind. Many people in public blogs are still bearish. I am NOT saying that these bull Flags cannot fail and lead to a pull back into a DCL, but they can also just get ridiculously overdone to the upside first. I have recommended for those that are traders to trade the Miners, for longer term investors? We could get a pull back at any time, so cation is prudent. When the game is over, we’ll step aside and reassess the situation. Until then, these Bullish patterns are consolidations allowing overbought to unwind a bit and then carry on upward. We will likely see divergence as we climb higher, and then the pullback will begin.
.
It is nearly impossible to say when this bull run will end, or even how it will end . It could go sideways and just put a handle on all of these cups, or we could get a solid drop of 50% or so. I will try to discuss that further in the weekend report, which will be out by Sunday night or Monday morning before the market opens. Have a great Friday & weekend!
~ALEX
P.S. I like these set up too, mentioned in earlier reports.
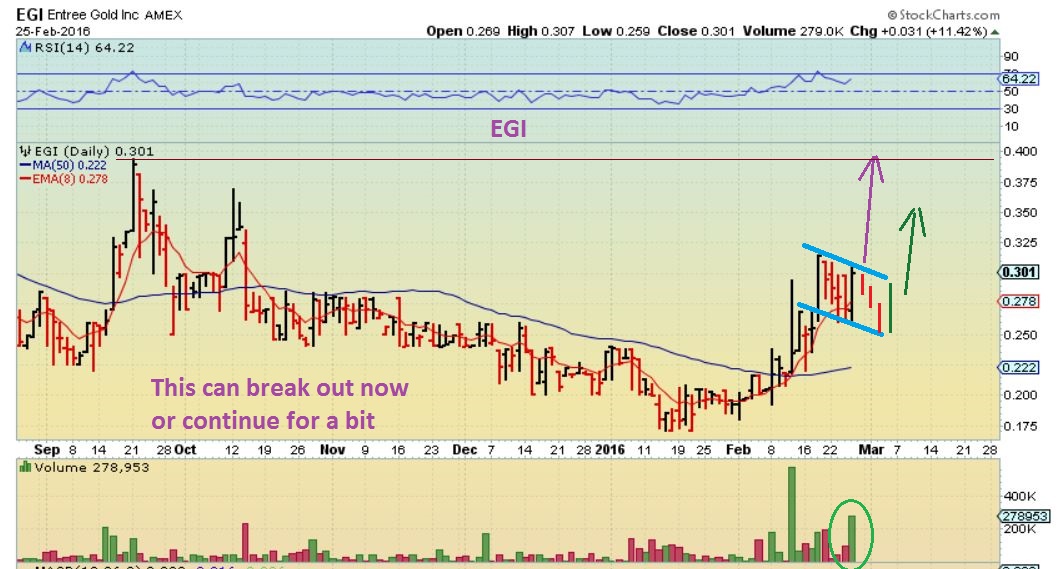
EGI – I mentioned this earlier this week. It could break out immediately, or continue to consolidate.
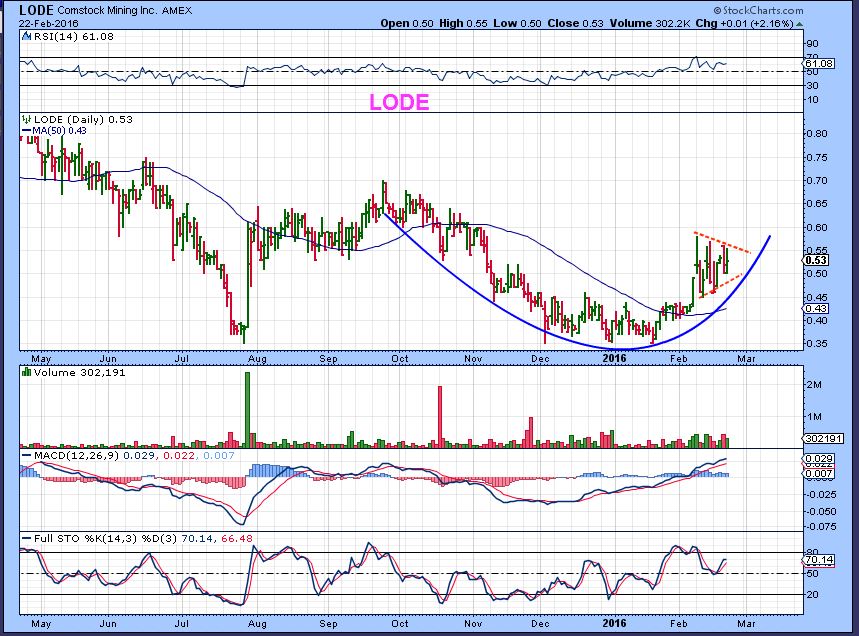
LODE – Posted on Feb 22 , we see another flag pattern.
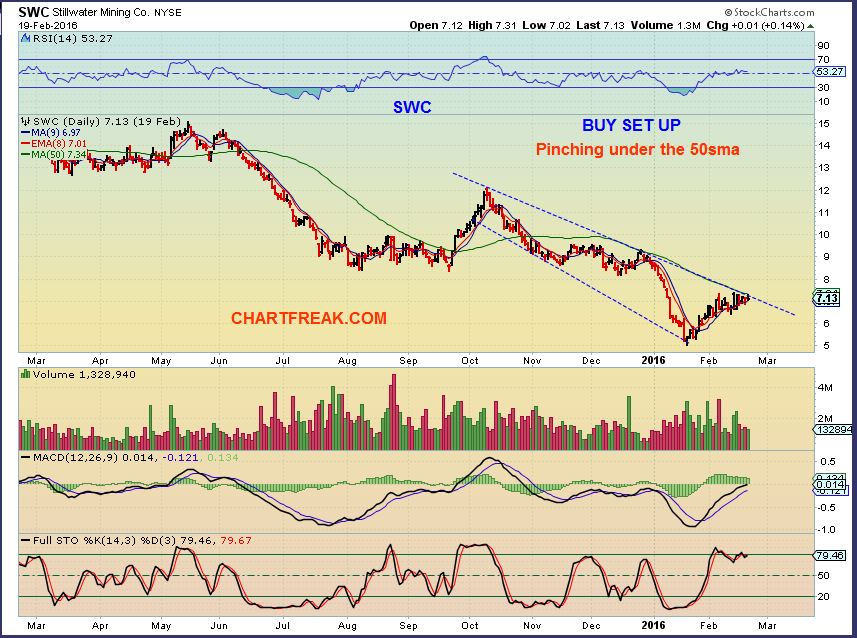
SWC – A beaten down Platinum stock, it flagged under the 50sma and I bought it. They had good earnings, so I am still holding for now. It is currently above the 50sma


You really can’t resist with these ‘bonus’ Friday reports!! Lol Careful though……we’ll start expecting them every week at this rate!! 🙂 But thanks for all the extra work and effort. It is hugely appreciated. 🙂
Yes, I know : )
Sometimes I’m just doing my own research and think to myself, I wonder if some of the Chartfreak readers could use this information, even if it is a Friday? Some wont trade on a Friday, other will.
Trading or not the reports always make for an interesting and thought provoking read. So I’m ALWAYS happy to see the ‘bonus’ Friday reports. 🙂 Thanks Alex.
Thx Chris – Happy to hear that. I know you’re more of the big picture investor, but all the little pieces are interesting to me too.
Alex, thanks for the clean slate for discussion. If I read you right, there is no clear direction. We could get moves higher or breaks lower. I’ll stay in cash, for now, except “X”
Hey bill,
Pretty much, yes. These are Bull Flags that I’m pointing out, but they can and have broken down too.
GG- Earnings release and dropped over $1.70 in Pre-Market. At a glance it looks like net loss of over 4 billion.
It too looked like an ascending wedge, so there is an example of a break down in what should be a bullish pattern.
Hey gang.
Have decided to stop lurking and join in.
I play with Astro and other stuff. Have been catching some good tops and bottoms with my time windows.
Looking for a low in March now. Don’t really have any price objectives on this chart, only time.
Pretty clear 5 waves up, so now looking for an A-B-C down into the window.
Alex, you have such a great site here – love it.
And really good move hiring Maria to spice things up. LOL.
What’s MTD?
Hey Randy! Glad U decided to join in and thanks for being here. It is a good group of people here, thats for sure. ( Another fan of Maria, I think she asked me for 10 cents every time her name is mentioned. I’m going broke. – lol).
.
Nice chart , I like the labeling , but I’m hoping that your 5 could be the 3, and one more pop higher. Then I’ll be ready for an a-b-c to the 50 & 200sma ( they are about to intersect).
Anything can happen. Nice chart
Funny you say that Alex. I was thinking something very similar. I have 3 and 4 at the peak and low immediately before where Randy has placed his and have a work in progress that the final 5th wave is subdividing into five sub waves in some kind of ending diagonal or such like. That would then make Randy’s 3 subwave i his 4 subwave ii his 5 subwave iii and then we’ve potentially done subwave iv today with a final move higher in subwave v to complete the larger 5. Does that make any sense!! 🙂 But agree on liking Randy’s chart and like the look of that timing period for the next possible low.
lol.. no .. it doesn’t – my eyes rolled back into my head and I study EWs… giggle 😉
did u post a chart already?
im playin catchup …
Just for you!! Even though I’m trying to watch ‘The Blacklist’!! Lol
thank u dear… I used to watch that show… pretty intense – i fell off this season… get back to it … ;o)
It’s just getting to one fo those VERY ‘hairy’ moments where the ‘good’ guys are heavily out-numbered and looking like they have no way out!! Hopefully they do!!
..wait.. so that’s an ending diagonal like i have then?
Quite possibly…but I think I’ve finally gone chart blind!! Lol
I was watching Blacklist last night, too!
Yes, but I’m voting for 3 with 5 ahead but all that is major 1 (or primary 1 depending your count) of New Bill with Wave 2 (larger degree) after for a further pullback. That 2 equates to Daily Cycles 3 & 4, ICL is start of Primary 3. Maybe?
That would be nice Cason and I think many if not all of us have something similar in mind. As a longer term investor that next ICL…assuming it is a higher low then Dec as we all hope/expect!….is potentially the ‘back up the truck’ opportunity before that larger wave 3 kicks in. And ultimately that in itself should only be part of an even larger wave 1 if this new bull cycle has years to run!!
:o)
Rj.. forgive my ignorance — im not understanding 8, 9, 10 &then 1,2,3 on your chart would u mind explaining that to me? and by window.. you just mean (yellow boxes) & ur projecting 3/9 for abc correction to complete?
thank u ;o)
maybe time to dive into UNG??
them ol’ convergences may be saying sumthin’ once again!
interesting….
it was the same ‘interesting’ that you expressed towards my GDXJ momo chart .. just prior to its lift-off 🙂
you’re my good omen
Hi, Bill.
That is Delta medium term change in trend (CIT)points.
They will drive you nuts if you don’t combine with other CIT indicators.
I use for some buddies who follow.
Just thinking now if showing them breaks any of Alex’s rules?
So you’re seeing GDX $15 soon! That’s what I have in mind as well. Singing the same song!
Thanks, Alex.
Maria. You are a delight. You should ask for a raise!
Bill. Yes, am expecting the gap around $15. to get filled on the next drop.
That will be a SWEET low to get into if it happens.
And the 50 & 200sma will be intersecting around there. A slight break could shake some out 🙂
You’ll learn the hard way not to compliment Maria too much. It brings out all the unwanted “GIFs”
LOL.. i just saw this…
damn.. u nailed me …
HA!!
lol… really cason? ha ha ha
Yup!
hello RJ
welcome to the Hotel California…
Nice Report Alex. (sorry haven’t been here much lately).
Maria congrats!
AG had a nice move. NGD is consolidating > time to buy more. The next wave is gonna be fun. TRQ I’ll nibble on that.
I’ll post my miners list at eod.
Yes, I wondered where you Ken, Geurt and a few other regular posters had gone, but I just figured work, markets, stuff. Good to see you again.
Frenchie!! :o)
Say Hello to Randy, snob.
have a good weekend again , all 🙂
i did…. look down mister…
dammn … u R sooo hardon me 2day…
I am leaving for the weeknd, Have a good one all!
Have a terrific weekend!
yeah.. did u hear that chartfreak.. Delightful .. and Spicy ;o)
ps. I accept paypal..
Just one last checking in….just looked at weekly candles. COULD still flag, but GLD and GDX have those toppy looking candles weekly.
Check your stocks and lighten up if needed.
Slowly, but I am rotating to heavy cash.
Heard that Gold & Silver CoT deproved this week (opposite of improved).
I guess we knew it was coming?
Haven’t seen the pretty picture yet.
refresh…uglier
.
Thanks.
Nice! – for those wanting to reload.
Will I finally get my chance to back up the truck???
hopefully should get a pull back to 34week ma in the miners, if history is anything to go by
That would work, but a bit steep. Would def whisk New longs out, especially anyone in NUGT. On daily, 50% retrace is about 16.16, 61.8 is about 15.37. I’ll post my chart tomorrow.
Pending any new crazy changes or updates from Alex I’ll start scaling in longs about GDX 16.5
SSRI chart looked sweet.
just check out the past spikes on HUI.. always return to 34week ma (black line)
refresh!…….
Also notice that the 34 week had essentially capped ALL rallies last 3 years. Blew through it no problem. I’d like to see the 13week hold on the upswing as additional Bill confirmation. 13 and 34 in week are similar to 50/200 on day (but not the same).
GDX, GC_F, and GLD will all form the ‘Golden Cross’ next week, pretty much mathematically guaranteed. That’ll suck in some longs!
I posted the almost as ugly COT last week and then Sunday night it fell. Hard. Then what? New highs! So, this is bad but doesn’t mean straight down immediately? Probably not.
A higher low next keeps us on the bullish track and gets us a better entry on some of these recent charts Alex has shown this week. This is a good thing!
Strong Volume close on DUST pushes out of the bull flag on the 15 min chart.
you decided to hold over weekend?
3x gaps give me the willies
Yes, I’m up already so, house money. Everything I see points to lower GOLD prices and miners.
fair enough.. you have balls of steel mr Bill
I wanted the house money in my pocket. But yeah I agree with your charts, fine Sir.
I sold my DUST this morning when the 8 EMA held on GDX. I agree with Bill that we probably start heading down, but I’ve said that before and been wrong. So, I can always get back in Monday. Another poke higher would be pretty cool.
Thanks for the welcome, Maria.
Very pleased to be here.
Irwin. Yep, COT is right on target in the nose bleed area for commercial shorts.
And the open interest is way up too. Tells me the smart money is changing
positions with the dumb money as they need heavy participation to do the dirty deed.
Bill. Saw that DUST move. Nice.
Happy weekend all…
One of the best interviews I’ve heard from GoldSeek (35 minutes)
GSR interviews MONTY GUILD – Feb 25, 2016
https://www.youtube.com/watch?v=-DT-rUpCmXw
Sorry, Maria I didn’t see your question about my chart earlier.
I do several cycle counts, the one you see with the dark red numbers is called Delta.
Wells Wilder of RSI indicator fame bought the rights to it years ago and promoted it relentlessly.
It is a cycle method, but has many flaws.
The yellow boxes are one week in length and comprised of a neural net type gizmo thingie.
I use all sorts of funky top secret cycles, but the primary input is an Astro technique that I’ve never seen
done before. I’m not a big Astro fan because of the huge amount of variables and the idiot fortune tellers.
My Astro is a cumulative index of 99% of the planetary influence to humans and hence the markets.
This model is tuned to the GDX, but works on Gold and Silver to a great degree.
Hope that answers your question.
The enclosed chart is a scenario based on the GDX / DUST gap getting filled in an GDX A-B-C decline
into early/mid March.
Bill. Go, DUST, go!
Randy
From Friday:
@ Alex: “What is your bearish view , if you dont mind sharing… There are a few, but do you mean Rally done, or just pull back? Thx”
Just using StockCharts default settings; RSI at 63 pointing down; MACD went negative on Friday; SlowSto at 68 pointing down; and price has put in a fair amount of distance above 50-day sma.
A retrace to $1180 or $1160 looks entirely plausible.
I’m just looking for a PDAC pull-back lasting a few months – hopefully, $1130 will hold.
http://stockcharts.com/h-sc/ui?s=%24GOLD&p=D&b=6&g=0&id=p92178343290&a=447252439
Potential retrace targets??? 50% of the whole move is about 16.3. A deeper 61.8 would get the new bulls out, just about nail the 200-day and fill the gap left at 15.35. I’m likely to start scaling BACK in prior to that so that it doesn’t take off with me. I ain’t getting left out in the cold again!