
Still Climbing
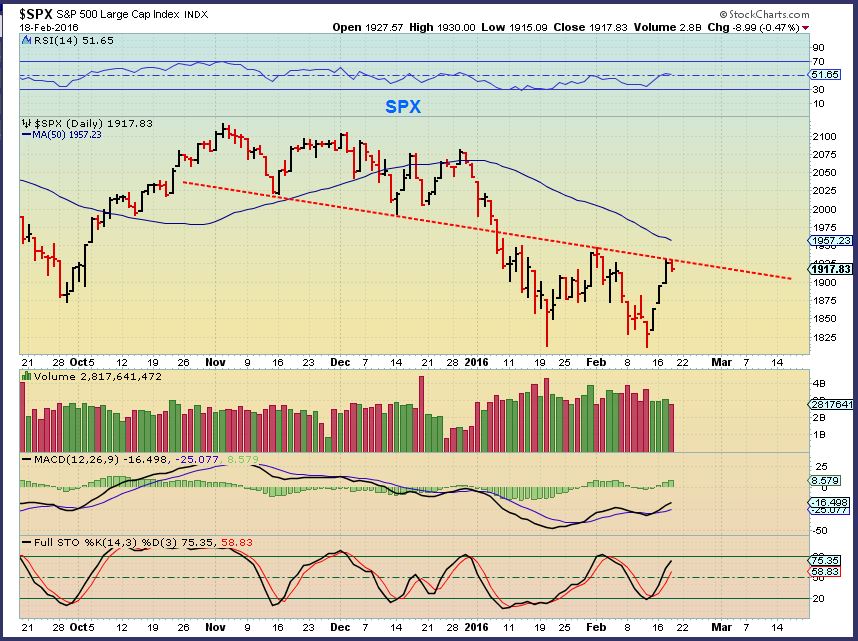
Precious metals and especially individual miners keep climbing higher. Wave after wave, the dust buyers and shorts are getting hammered. This wasn’t entirely unexpected, that is why I mentioned taking some profits and letting partial positions ride. This runaway , melting upward type of move can be rewarding, but cycle wise, it is will pause or pull back soon. We’ll discuss that. The markets were moving up off of their lows too, but they stalled on Thursday. Oil turned back down too. To the charts…
‘
It’s Friday, so there isnt much to say with only 1 trading day left, but lets take a look and see what we can learn.
This was 1 of my 2 Gold charts from Thursday mornings report. Gold actually hit $1240 as the day went on, so it looks like that flag pattern could form. While it does look like that Flag pattern could form, I actually think we may see something else too.
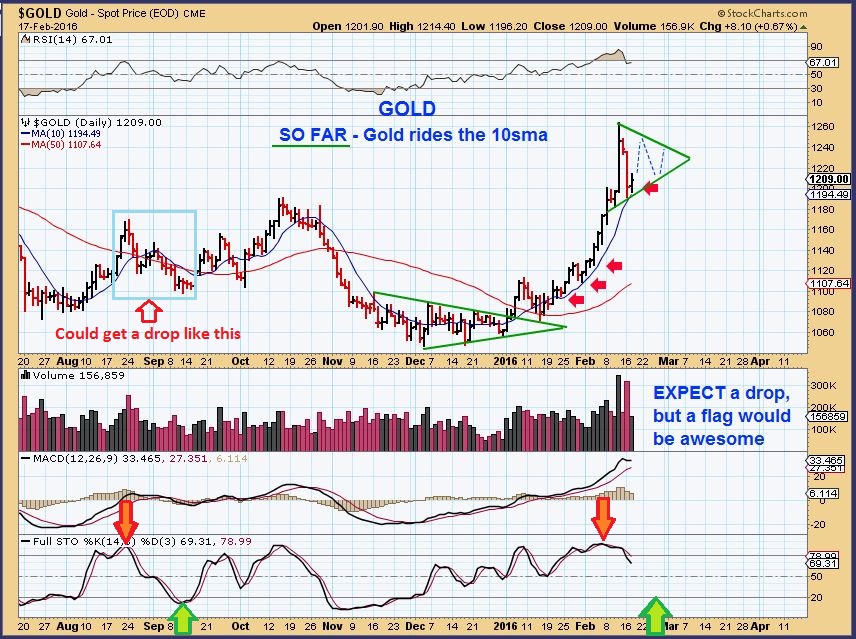
Let me show you what I think is happening now…
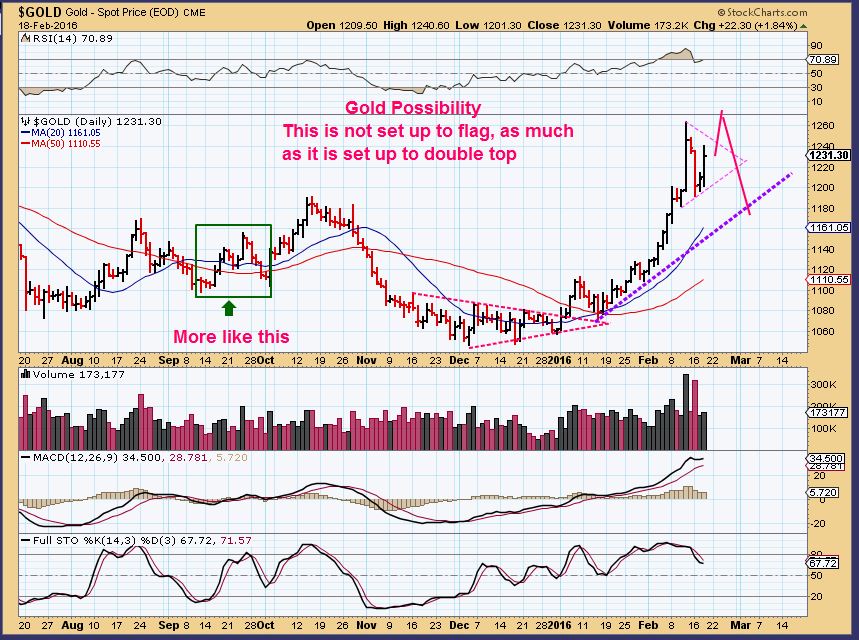
Yes, we could still get that triangle flag, moving sideways to the apex and then a false drop down to break the trend line to form a dcl. I actually get the feeling that we are going to get a different result here. Look how wide the price swings are these past couple of days. I’m watching for a possible pop to new highs. That nice round target of $1300? This would suck in new buyers, and then Gold should drop to a DCL ( Daily Cycle low). That double topping action could look similar to the green box shown. We may know more after Friday.
.
So it really wouldn’t surprise me to see GOLD tag $1280 or $1300 before dropping. I have us on day 22, the way I count it out. This daily cycle could go for 5-10 more days. The daily swings are wider now ( $40 daily moves). In 2 days Gold could be at $1300, and then drop right back down next week to a dcl. Time will give is a better idea.
.
If the markets continue to stall here, That allows Gold another shot at breaking to new highs.
.
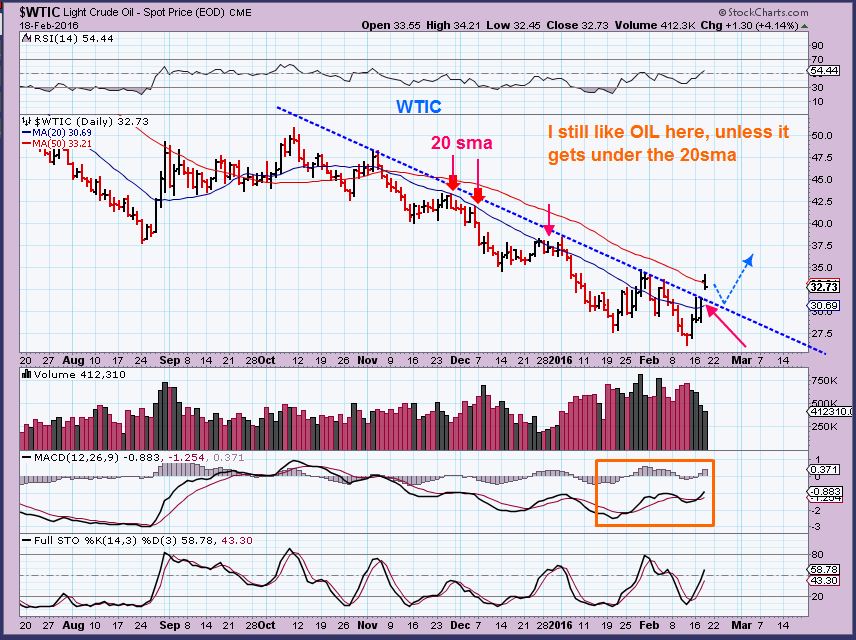
WTIC – Oil broke out and reversed, selling off as Thursday went on. I still like this set up , so we’ll see if Friday clarifies this picture. Support is shown here.
.
Let me remind you of what I mentioned in a couple of reports 2 weeks ago.
.
In ABX, I pointed to the sell off on the left side ( Constant) and I said that the buying on the other side could match it. I have seen this is other similar set ups when conditions are right.
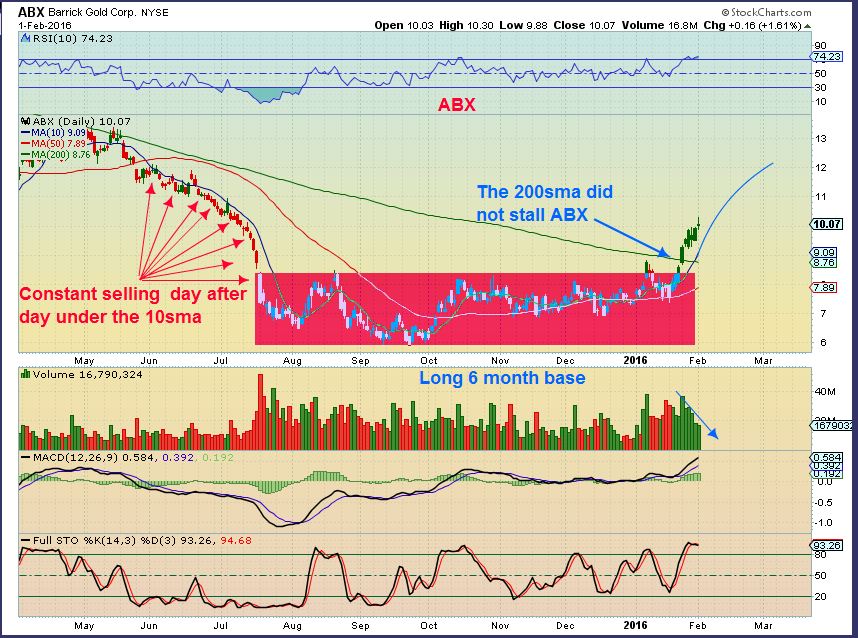
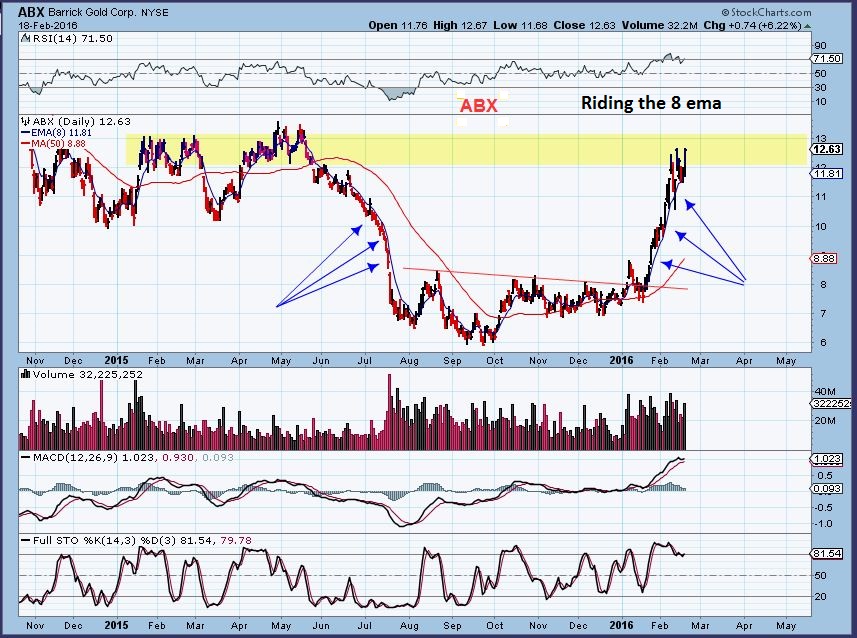
ABX – And there we have it. I mentioned that under these conditions it’s best to sell a partial position to lock in profits, but let some ride, because they often ride above the 8 EMA to the former peak ( Forming a cup) .
.
GDX – So are we seeing that here? It certainly looks like it. I also mentioned that many would get left behind, waiting to buy a pull back that never comes or even buying dust and trying to short this. Soon, we should get a handle on this cup.
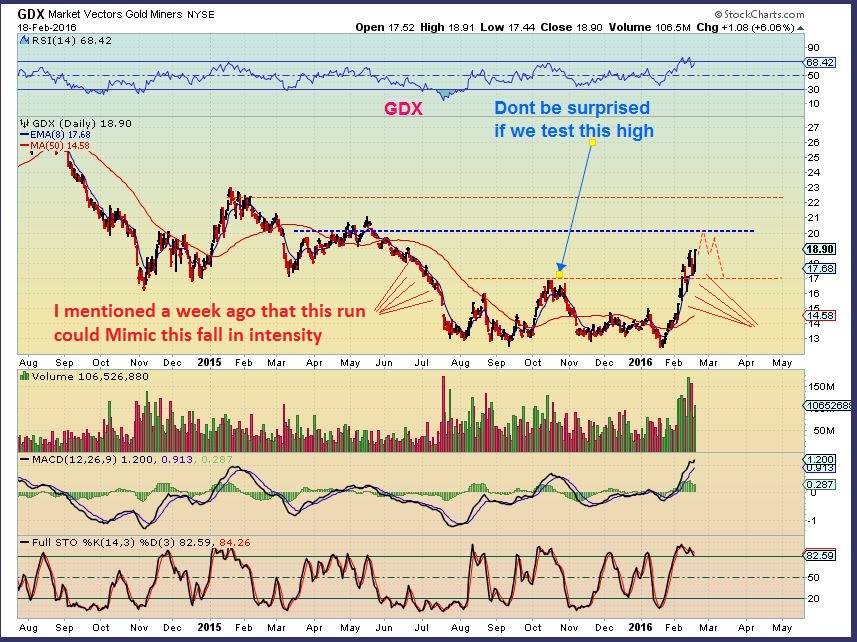
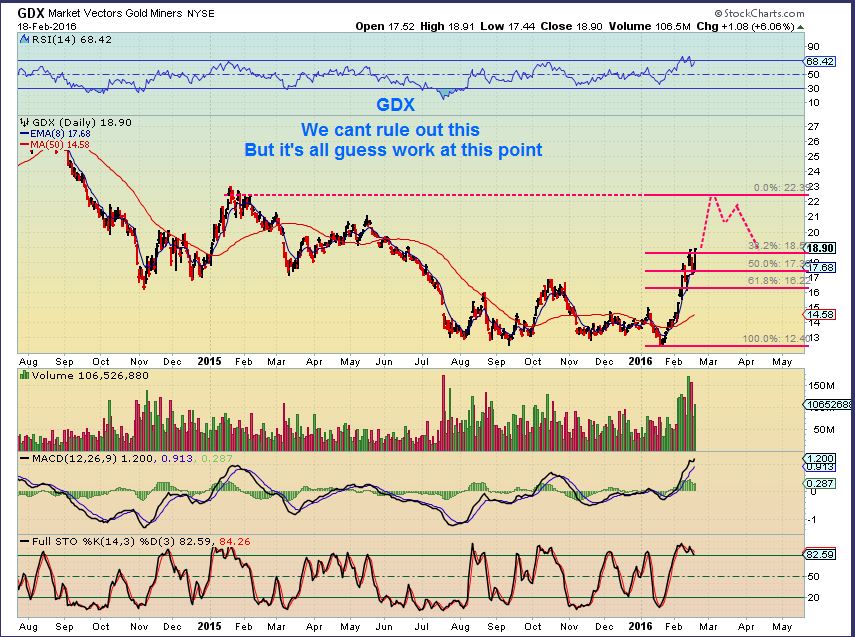
GDX – We cant rule out an all out blast to former 2015 highs, but it is getting late in the daily cycle ( Day 21), so it would be quick and then we should get our pullback.
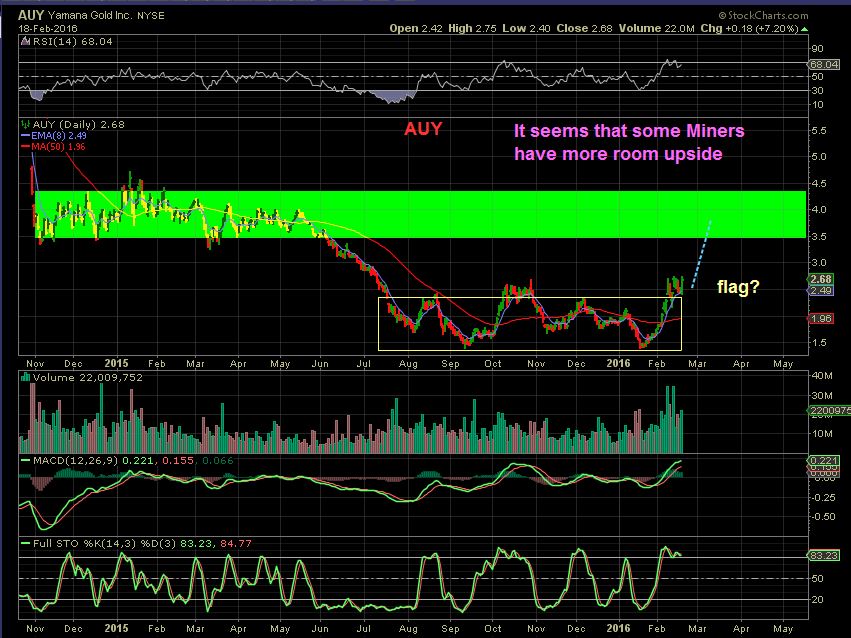
With the above information, I have been looking for similar set ups and wondering if they will just run on their own. I have been trading Miners the whole time, considering ‘laggers’ and other set ups that may work out ( My TRQ is not working out yet, but I still own it). I posted charts of GPL, NG, LSG, MUX, TRQ, BAA, EGI, TGD, etc. So this is why I bought AUY above the 50sma. This pattern looks exactly like GDX did, and ABX and NEM had similar breaks from their bases and ran quickly. Now AUY looks like a flag and ‘ MIGHT’ run higher. A pop of 35 – 50 % higher would be the green area.
.
I wanted to put out a report today when I saw the action in Gold & miners Thursday. There really isn’t much to say with Friday as the last trading day of the week, since some do not want to buy & hold over the weekend. The weekend report will cover my expectations going forward , and so far things still seem to be falling into place with the Big Picture ideas presented in prior reports. The weekend report will be done by Monday morning at the latest. Enjoy your Friday trading and have a great weekend!
.


Thanks for the report Alex! Really appreciate your great work!
Ur welcome Deshy.
I remember when Friday reports were a bit more rare, because ‘what could change from Thursday to Friday?’.
Now there are endless possibilities with such volatility. Exciting times for traders though 🙂
$15 price swing in gold futures between 5AM-7AM. Epic daily volatility right now!
Good morning, Alex!
You mention that, at 21 days, GDX is getting late in it’s daily cycle. Do you have a range in mind for how long the cycle can go?
You’re doing a great job of explaining a fluid situation – exciting stuff!
Daily cycles fluctuate a bit more than they used to. In the old bull market they seemed to be shorter . We would get 24 day cycles often and even an occasional 14 or 16 day daily cycle. On average I think that they used to run 24 – 28 days. In this bear market we have seen a lot of 32 and 33 day cycles.
I use cycles as a decent rough guide, but in my opinion, they are not as reliable as they used to be. They are not as consistent. I am hoping that that changes when the Bull market run returns in Gold.
hey should normale (abit :-0 ) as we move outa this volatile bottoming process. I continue to play surprise to upside.
Thank you all for input and you Alex for directing a neat crowd in these volatile times.
Beware any idea that saudi and russia can normalize pricing. First of all they are At War over syria, and secondly world economy and therefore use of oil is continuing to Contract period, while production actually continues to come on and stay on line even below margins to make any/every effort to hold up on their extensive debt/leverage.
Thanks Bob,
Appreciate your input on Oil. I’ve also been playing surprises to the upside in metals, because even with the huge gains and strong move higher, many still kept wanting to short it. Eventually we’ll get our pull back, but individual mining stocks seem to be doing their own thing for now. 🙂
CPI core rate came out with the biggest increase in 4and a 1/2 yrs, and Gold drops : )
Excellent info. Love these charts thanks Alex. Good work
Thank You Al, appreciate the kind feedback 🙂
Oil down big. Below $30
Yeah, and that ( see the chart above in the report) puts it right back down under the blue trend line and 20sma.
Oil is tricky lately, very jumpy.
EDIT: Wait a minute…I have it up near $32…that would be a gap fill on my chart and still have it looking good.
@ Cason: “I might buy your call tomorrow. hehehehe 🙂 Hopefully, we both win!”
Congratulations – if it was you who bought my call.
Good luck to you!
I’ll be happy if called away.
Look at a chart of AUMN.
#Rocketship
BAA – Posted a chart last week at 19 cents, it has that look on a wkly chart.
. Now breaking above that 200sma, weekly chart breaking above the 50ma, and volume today is high already ( for it).
Watch BAA – see if it is predicting itself as the next run.
AAU / AUY / GPL – Breaking out with volume so far today too.
I been watching gpl since last week when u posted the chart it was .59 now just went past 52 week high.
I think I know the chart you mean , a big rounding base weekly chart. before that chart, I posted in here at 49 cents and 52 cents.
refresh to see a chart – it was a buy as it broke out.
.
( Refresh) Posted this chart Feb 3 as a shake out type buy with CENX, X, FCX, AA, etc .
CENX up almost 20% today and nearing the 200sma, that may stall price.
I still think these commodities go higher over time. Traders may want to take profit soon.
Alex, any new thoughts on oil today? I guess expiration today? does it change the chart above at all? is it still acting as expected?
thx
Hi Curtis, refresh. Looks fine here so far.
.
We closed below 30. 🙁 But oil rigs fell another 26 this week. Should see those reflected in chart eventually? But the rig count down 9 weeks in a row. Lowest level since 2009. This will have to lower production at some point. Some won’t make it. But those that do will (eventually) emerge and rocket higher.
With the weak action in the US$ Index, Gold has still not caught a bid. HUM!
Hey Edward,
Gold was up over $25 yesterday at one point, and the dollar was up too.
Then last Thursday it had that $50 up day and the Dollar didnt drop, it actually put in a reversal low, so I dont think they correlate at all times lately.
The implication was that If Gold was weak or neutral, as it is now, it would be helped by a weak dollar (implying it may be weaker than we think having run its cycle), not necessarily that if it was strong it would be helped by a weak dollar. It could have ignored the dollar last Thursday just based on its strength alone.
Don’t know if anyone has mentioned Global Silver Miners, SIL, but the movement could give you whiplash.
Yes, and that’s before silver really broke out too. Kind of a nice climb higher since Jan 19th.
When Silver breaks out, I’d expect the silver miners to really do well (And they haven’t done too badly already) .
Going to lunch, have a good weekend Edward & Everybody!
You didn’t miss anything. Yawn. Man, this afternoon was boring.
I have a feeling that by the time Doc Postma decides to seriously load up on gold and miners, I’ll be ready to close my brokerage account and go on extended leave of absence.
Geez what an ole curmudgeon!
signed: ItTakesOneToKnowOne
Maybe for SPY – the B last two days of A-B-C Wave 4 up? Was hoping for 50 day, pullback then 200-day/2000. But maybe one more day of mild pullback and then a move up to btw 1950-1987. I’ll throw a chart up later this weekend. After that, it’s going to kiss resistance and hit wave 5 down. Even with a lackluster day did anyone notice that spot VIX was still down 5%?
Here are the weekly Gold and Silver COT Chart. Warning: It is NOT pretty. Don’t jump to conclusions, wait for what Alex has this weekend. Also, remember these are NOT exact timing tools – don’t jump in and out of 3x ETF based on a COT chart. These are also (as always) as of Tues, 16 Feb. May have changed btw then and now. Biggest issue I see is that they are higher than I wanted. I was hoping gold would go up and then back down where you could easily see 2 daily cycles (like this summer). Not currently what it is showing. Personally, I hope that the commercials get fleeced and have to cover while losing a shit ton! *Refresh*!
Just a bunch of good ol’ boys trading to the mean of a downtrending market…
Any of ’em wondering if gold sector’s bottomed?
I expect another bump, and got in today bow, in case it’s monday, but may not start till wends. or thursday…
Beek, not sure if I totally followed. You’re thinking pullback or launch next week. I thought pullback 2 weeks ago. Wrong! Conditioned to think that way after 4.5 years of bear attacks!!
I have positioned not to miss a gap up monday. However I expect either way, gdx will be back on the rise by wends day. Stop at 8dma. Cot’s have different character on uptrend, with higher proportions of commercial shorts. What I see is gold’s bottomed and I’m adjusting accordingly. I can afford to be wrong here after last 3 weeks ride.
The entire gold bug sector is still twitching at the mouse after 4 years training. Meanwhile a lot of others have noticed pog for 2016 and gdx leverage is no where near the secret of former years.
One potential take on S&P – in B wave pullback of Wave 4 (up) in an A-B-C move. Looks for Fib retrace support just below. C move should take us into heavy resistance and likely (but check the charts then) set up a low-risk market short opportunity. If we could get gold/miners to line up with this also, it would be home run time. 4-hour chart.