
2-17-2016 Stretched
Yes, Gold and Miners got a little stretched in their recent run higher. We now see a bounce in the markets (Expected) and a pull back in the precious metals area. Lets take a look at the charts…
SPX – There are a lot of different scenarios that these markets could play out. I believe we just saw an extended daily cycle with divergence, and we are now early in a new daily cycle. There are plenty of resistance points on the run higher to watch, but like I said last week, I think we continue higher.
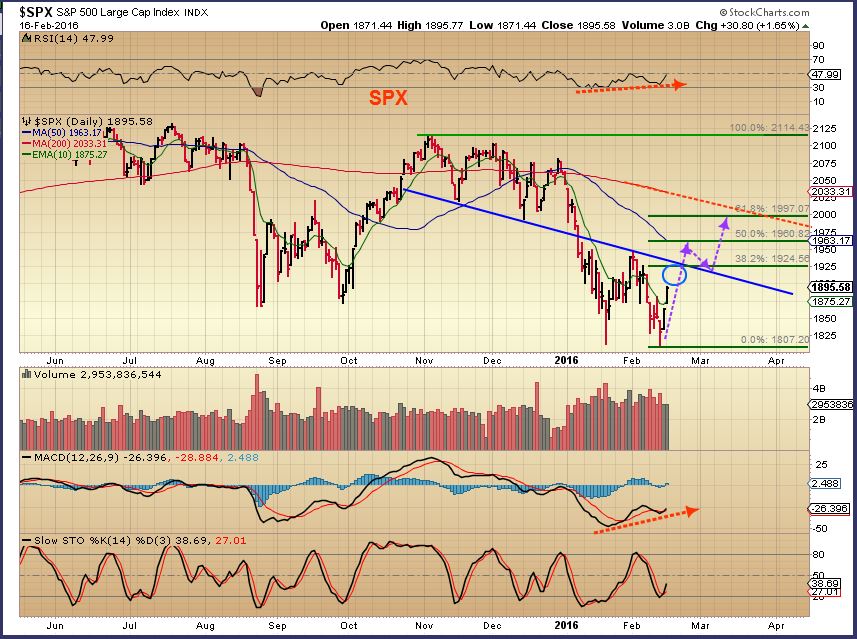
You can see that the SPX topped last spring, putting in lower highs and lower lows.
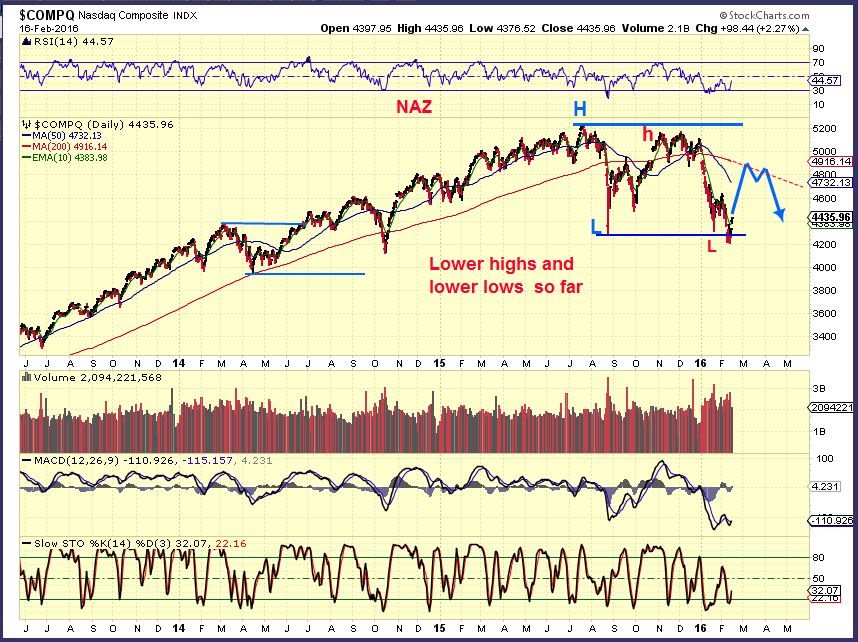
The NASDAQ remained fairly strong, but now we see a set of lower highs and lower lows here too.
 .
.
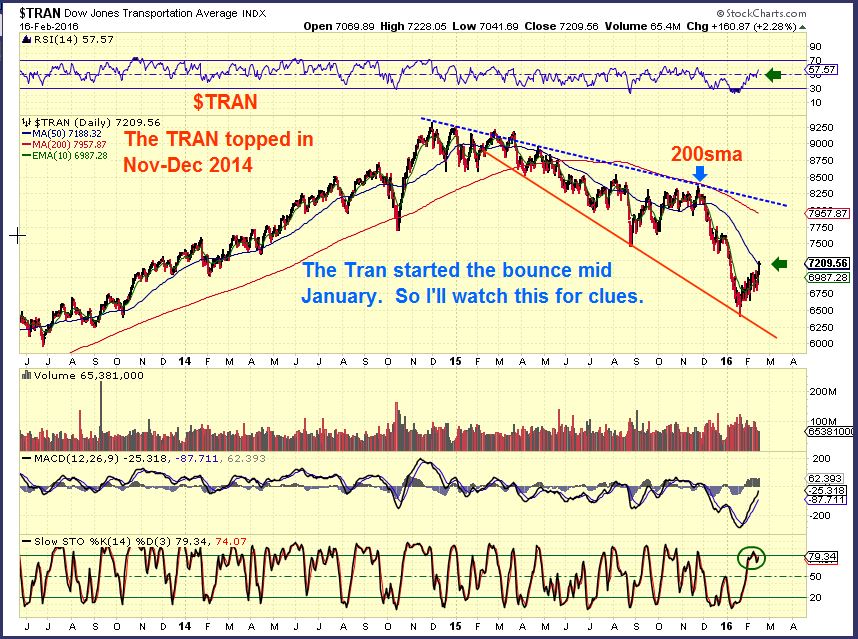
The TRAN actually topped in 2014 in a big way. Lower highs and lower lows for a while. A down trend. Now it’s leading the way higher here, since the SPX, DJIA, and NAZ had double bottom lows last week and it didn’t. The TRANNIES are already moving higher since Jan. I think that it would be wise to watch this area and see if it stalls, blasts higher, goes sideways, or drops first. The TRAN is already overbought at the 50sma. Sideways from here could indicate weakness.
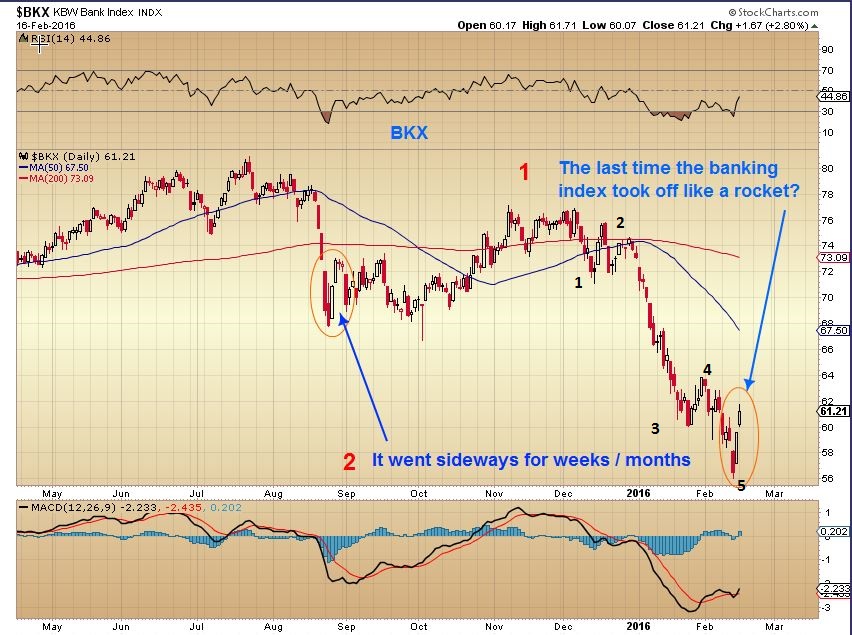
BKX – After 5 waves down, the banking index was due for a bounce. 1. It took off higher last week, but 2. the last time it did this it stalled and went sideways. I’ll be watching this area for clues too.
.
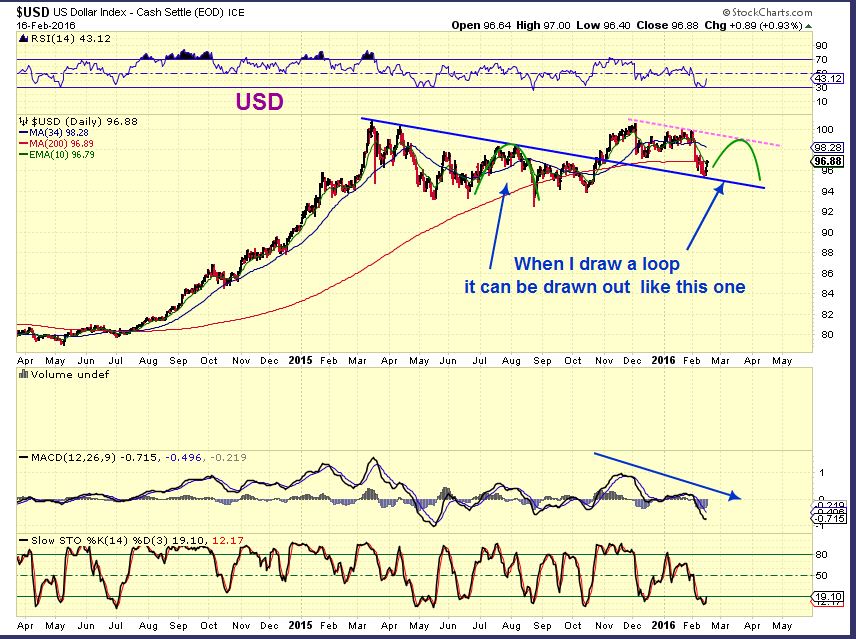
USD – I expect the USD to put in a lower high again. When I draw a nice smooth loop, that doesn’t mean that I expect a nice smooth loop. 🙂
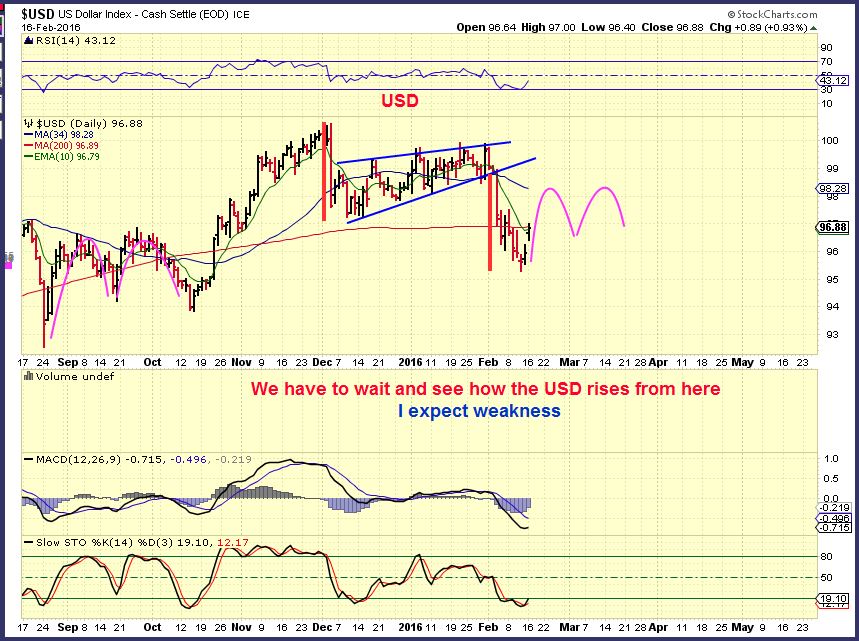
USD – Close up
.
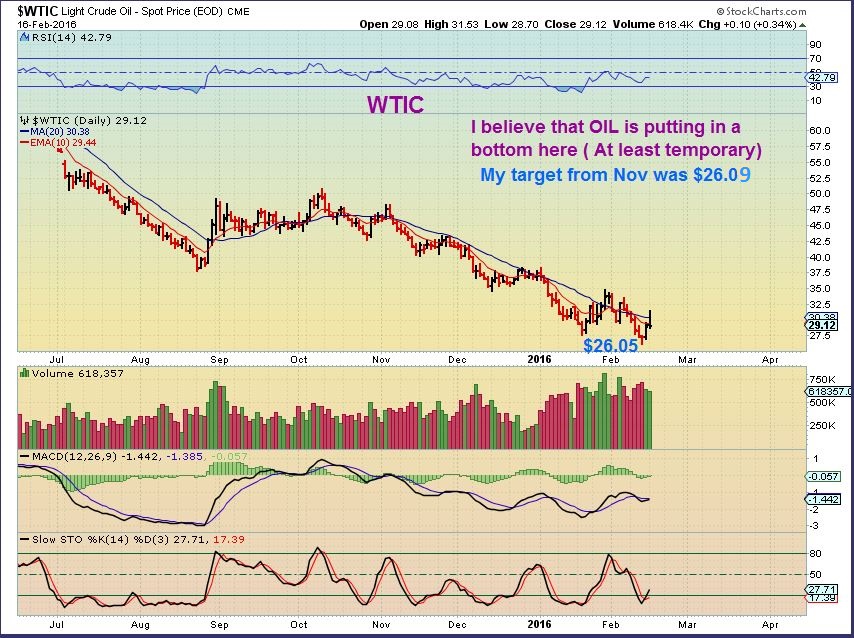
I think OIL is putting in lows, and I think that for a few reasons.
.
On November 13th , I said that my OIL WKLY target was $26.09
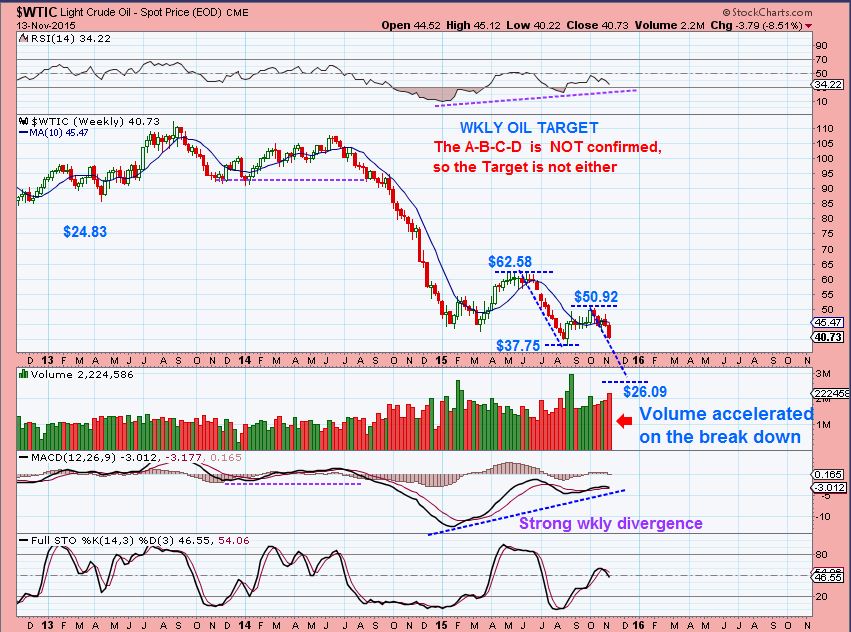
OIL hit $26.05 . Oil hit the 20sma and sold off repeatedly normally I would view that as a warning sign, but …
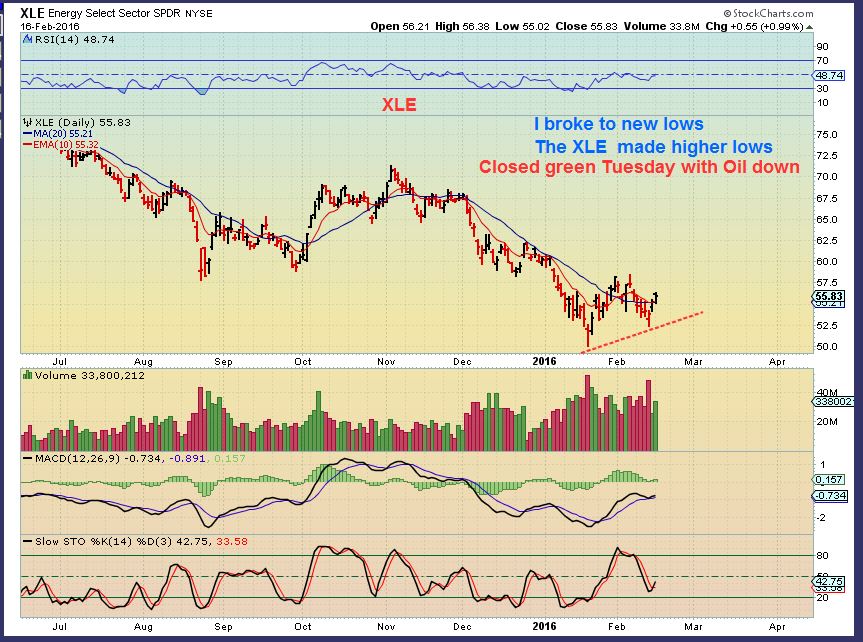
XLE- Higher lows while Oil dipped to new lows.
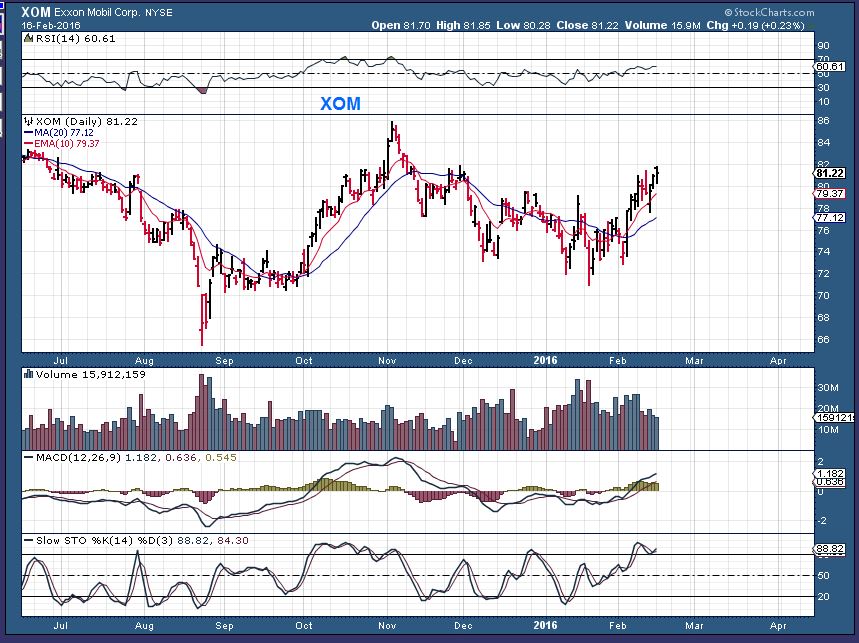
XOM – lows are in?
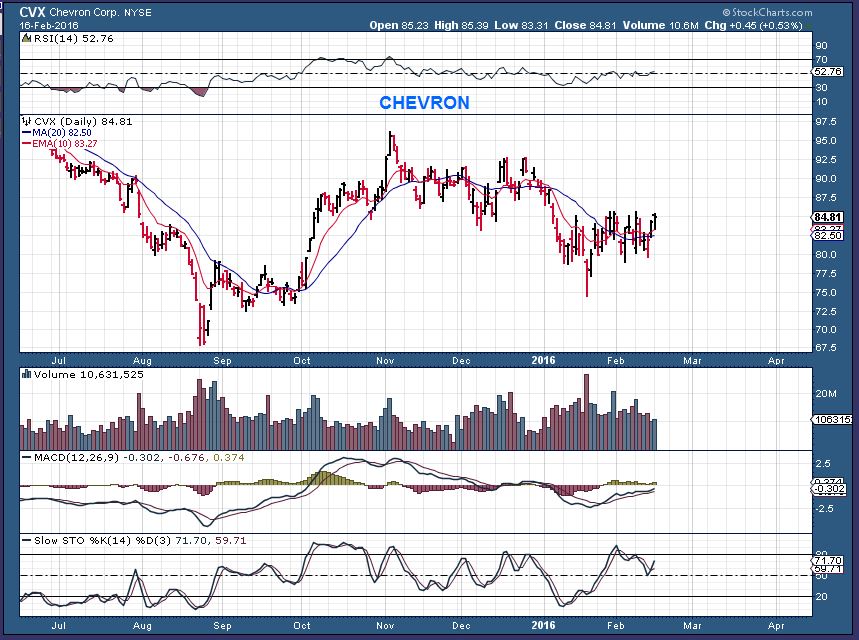
CVX – Lows are in?
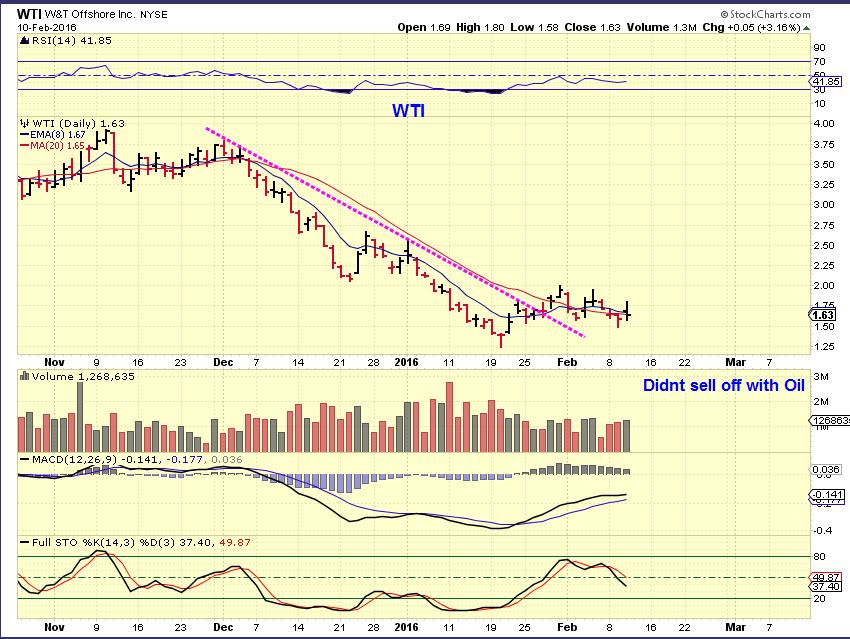
I posted this chart of WTI a week ago, saying that OIL was breaking down and I didn’t understand why some Oil stocks were holding up. WTI is the same price today with sideways action as Oil dipped to new lows.
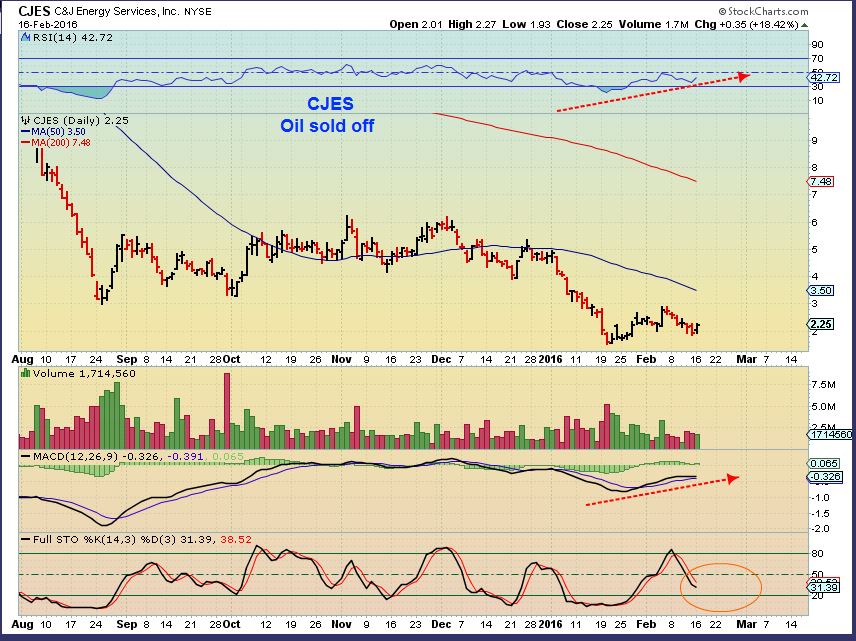
CJES – So we see some Oil stocks holding up at this point. I’m not ready to recommend any as low risk at this point, but I feel that many traders will start looking to trade in this area soon. I think Oil may be putting in a bottom now.
.
GOLD, SILVER, And MINERS
.
So much to say in this area, but in all honesty- We need time to reveal what kind of a pull back this will become. A sideways type handle on a cup? A 50% crash down to scare out new bulls? A double top, to draw in a few more bulls at this point and then shake them out? We cannot tell. I am watching individual Miners for clues, as well as ETF’s. SO while we wait for time to reveal more, just charts…
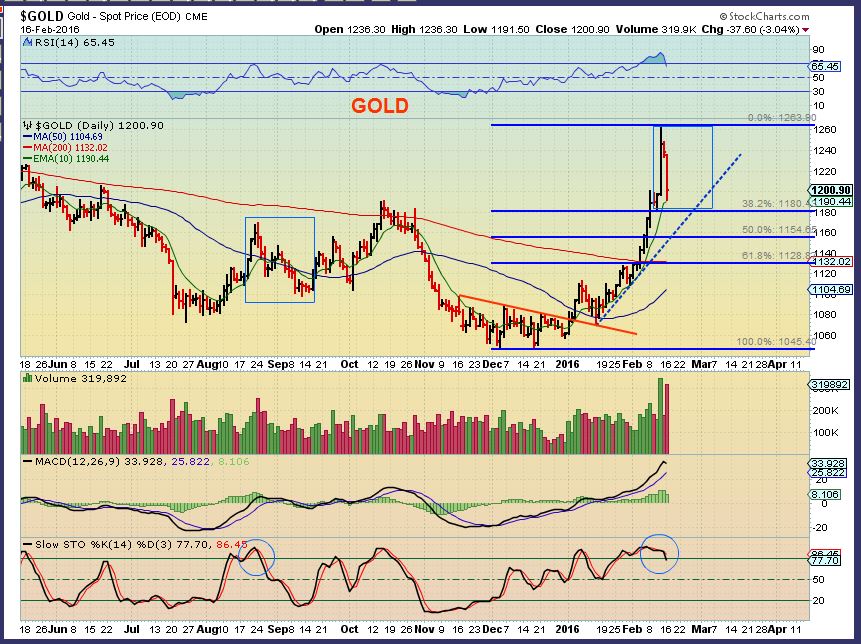
GOLD #1 – Gold is overbought, so I wanted to point out a blue box sell off from overbought to over sold. It doesn’t have to be straight down. A tag of the 200sma soon? 38% retrace? 50%? Time will tell.
GOLD #2 – A bull flag with large swings shaking people out, eventually tagging the 50sma?
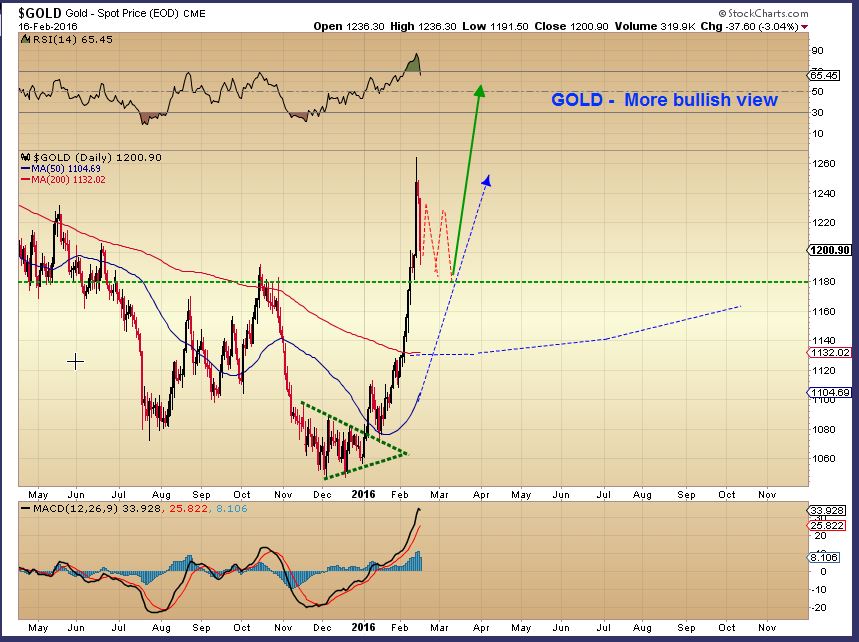
It is pointless to draw every scenario that I have in my head, but trust me, there are many. We need to allow time to reveal the strength of this move.
.
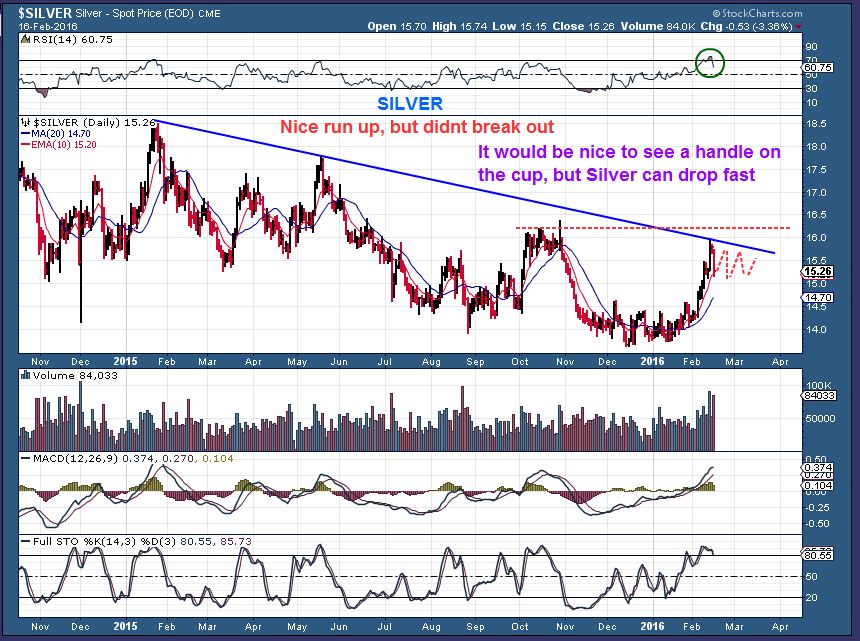
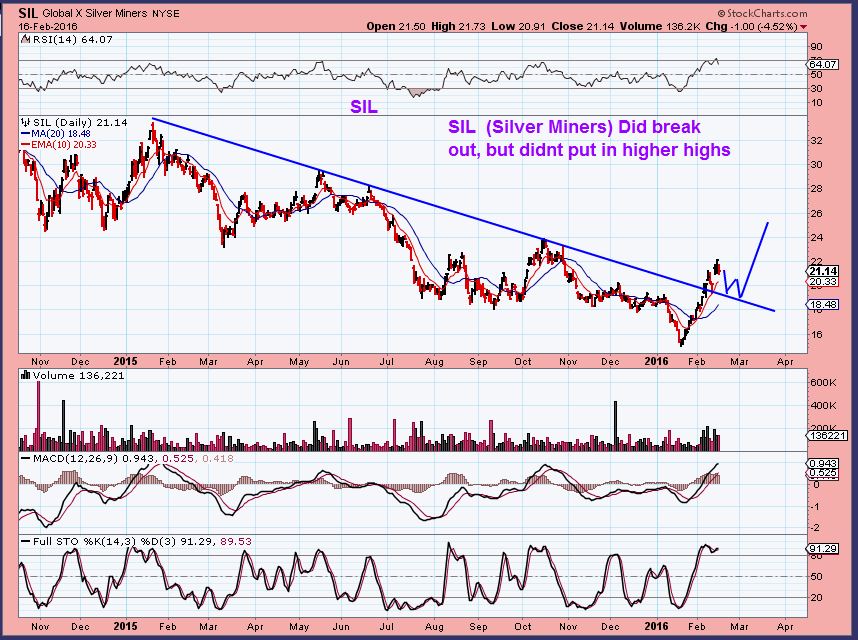
SILVER – Silver did not break out, I’d love to see a handle on this cup. WARNING: Look at the sideways move in October.
SIL – SIL did break out, so that is a bullish way of saying that Silver Miners are leading Silver. Going forward, Chartfreaks do not want to see silver Miners pull back and lose this break out.
.
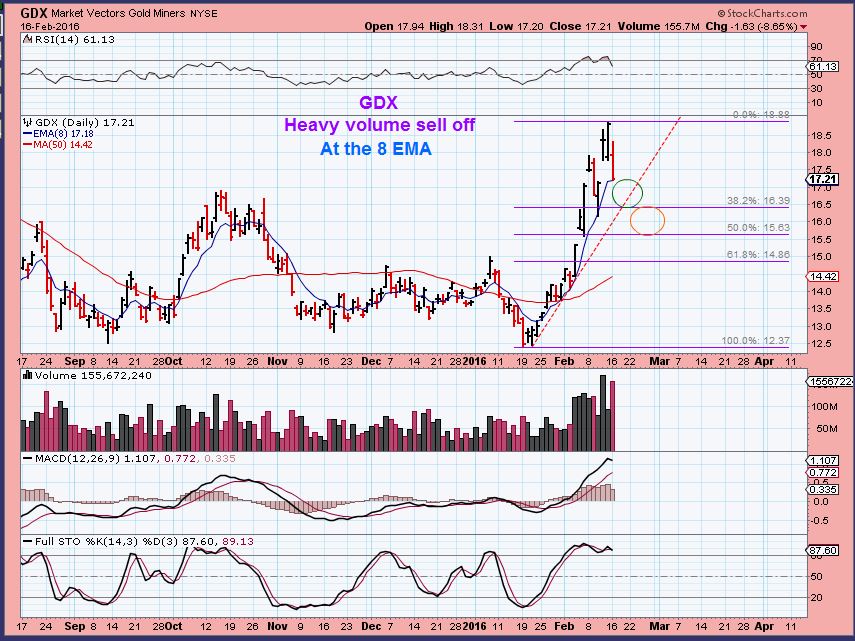
GDX – If Miners sell off further, I will look for these key areas to fill price. Honestly , so far GDX remained above the 8 ema, but that can end Wednesday.
.
So I am watching the Miners to see how they handle this sell off. We may get buying opportunities, but for now you have to look at the loss of $60 in Gold as the start of a pullback. I also saw many stocks today surge higher in various sectors, including some Miners ( AUMN, MGN, PLG, FCX, GRPN, SUN, ADT, SONS, etc). I’m watching the OIL sector for what I call “Interesting” developments. A possible bottom.
I have been watching SHIPPERS get absolutely torn apart, but now ( experienced TRADERS looking for scalping can check it out ) look at SB, NM, NAT, SHIP , TNK, etc). They could be bottoming, at least temporarily. SO I have a lot to look at and I’m eager to put it all together. Investors need to try to be patient. If you own a core position in Miners, you ought to still have stops ( mental or hard stops) to protect gains that you may have. Many miners are still above the 8 ema, you can use that or another area that you feel is support. In several areas we need patience and time to tell us what is going to happen. Go to cash or try t ride it out, whatever suits your trading style. 🙂
.
~ALEX


Great work, Alex. Those scenarios all seem very plausible. Its very helpful to have pullback targets, both for buying more shares and maintaining confidence for holding a core position longer term.
Thanks Dallas and I agree.
I’m thinking that GOLD holding above 38% on my first Gold chart of this report or the green dotted line on my second chart would be pretty strong . GDX being higher today makes me wonder if we just do a quick double top & drop or a bull flag over the next few days.
So many different scenarios that I really think that the individual miners movement will be helpful .
Alex, what are your spidey senses saying about UNG currently… tingling or not?
It does look like it may be at a temporary low, but I cant tell if it just wants to go sideways again or make a move here.
Look at how it acted from Jan 19 onward. That could drive one crazy waiting for a move higher or feeling like it could just gap down .
NATGAS was forming a falling wedge , but it isnt pretty and uniform.
That said, I’d say a pretty tight stop if I took a trade there.
thx.. i’ll keep an eye on it for now.
btw.. i see SUNE in danger of liquidation.. class action lawsuit , etc
I’ve been watching TRQ as a lagger and today I think it is going to challenge (And possibly break through) the 50sma overhead.
I’m expecting Gold to pullback, but this one is acting correctly, so I took the trade.
Thanks for mentioning shippers. NMM is now up 23% from the open. Perhaps this beaten down sector is close to a bottom.
Hey Alan,
EGLE & NBR were also up 25% today too, and eagle broke above the 8 ema , which it got trapped under for bit.
Worth watching, and maybe a quick trade or tow, but it also might just be a bounce, so caution for now.
Interesting set ups on shippers SBLK, FTK, STNG, ( SB just moved above te 5sma). Etc.
but I think many of these may have done some reverse splits
Thanks. Sold NMM for quick 20% and now stalking SBLK. I used to watch shippers but had forgotten all about them until your report today.
The IBB broke out from under the 10sma, MACD cross, oversold etc.
Then look at IDRA, BCRX, HALO, CEMP, etc (OXGN double bottom)
Possibly some good upside potential developing.
Anyone notice VALE, AA, CENX, FCX, X, AKS, …
Its starting to look like a party out here again.
Hi Alex,
I’m hoping you might share a look at the relationship of the miners to pog…
Miners lead vs pog’s lead in downtrend vs likelihood of having seen the bottom.
Very different perspectives into/since bottoming of pog teacup.
I’ve use some ratios (gld:hui) but I’m not so good at comparing to the 2000’s bull.
I sense a sharp DC rise here into a much higher ICH for pog, but wondering if gdx has just plain led ‘long enough’ for this IC?
Best regards,
Alex, appreciate the market comments. Looks like a move to the 50-day is possible here in above chart. CNBC talking heads Getting all bullish again. If we get there I’ll be lightening a lot. You think 200-day is realistic for a test?
API surprise draw -3.3 million barrels. While miners are away, energy could be the play???
GDX broke below the 8dma, but closed a quarter dollar above it. “Testing. Testing. Testing. Hey, is this thing on?”