
Weighing The Evidence
Bull? Bear? Bias? We caught The Lows in Miners a few weeks ago, and the rally has surely gone beyond my expectations. I now see many are calling THE END to the 4+ year bear market and calling the start to another phase of the Bull market in Gold. So was the action of the past couple of weeks a guarantee of the Bear Market lows being in? It’s best to weigh the evidence and try to allow the facts to speak for themselves. Lets continue to look at all of the markets and weigh the evidence.
.
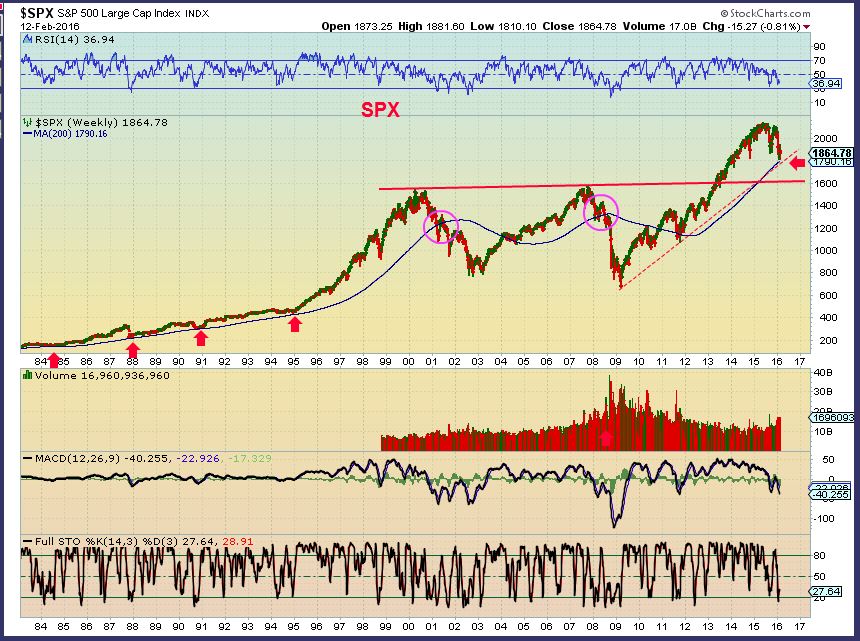
SPX BIG PICTURE – My readers know that I have been calling for the bear market drop in the markets since early last summer. We just landed in a very interesting place this week. Notice the dance around the 200 ma on a wkly basis since the 1980’s.
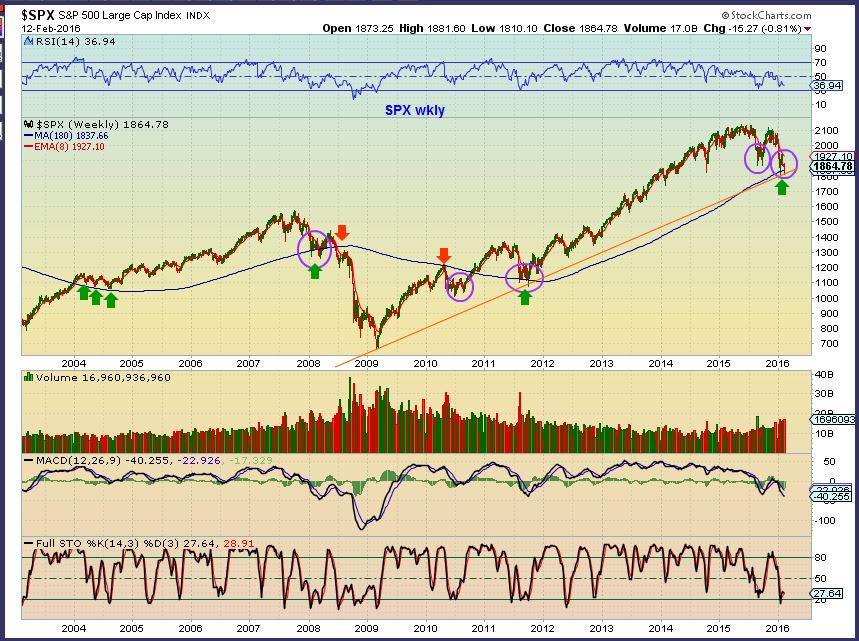
Zooming in…
SPX WKLY – I have been calling for a small rally in my daily reports ( See last weeks reports) , and this shows that it is natural to get one here. We currently have a double bottom on the daily. That happens all the time to get people bearish and then shorts must cover. I’m still expecting a bounce.
I wrote the above to show since 1980’s, the markets react this way, repeat, repeat, repeat. I get emails asking me to explain the ‘Government intervention’ and how they step in to save the markets today, etc. I can go back as far as possible and see that the markets live & breath and react to human emotions the same now as they always have. Patterns really haven’t changed. Constantly writing about the fear of manipulation could hinder ones ability to read what the charts are saying.
.
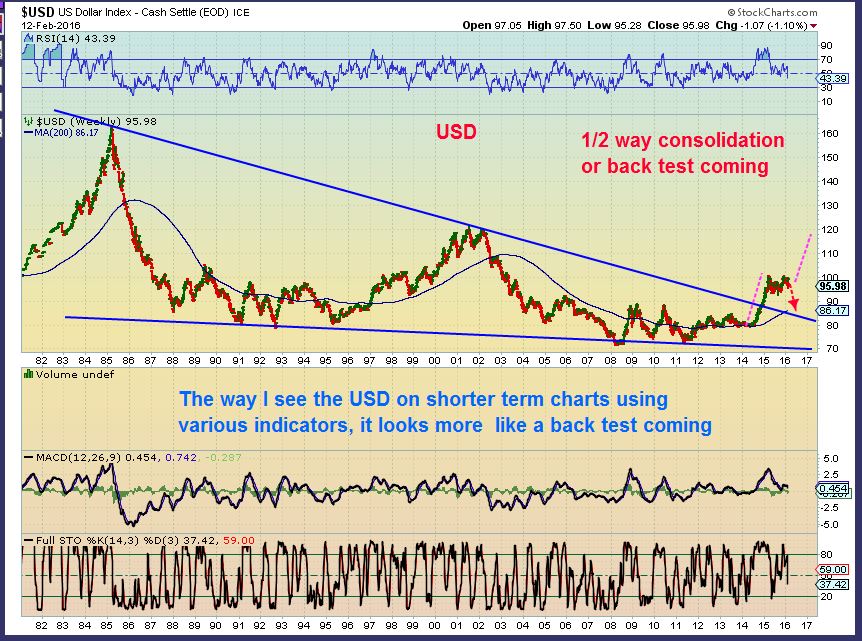
USD – I am looking at the big picture here. I still see the dollar as weak on the daily/ weekly. This shows that after a strong run up, the USD paused and flagged. It could drop & back test the trend line, that would help Gold further. As a bull flag, it could run higher. That might not be so good for Gold.
.
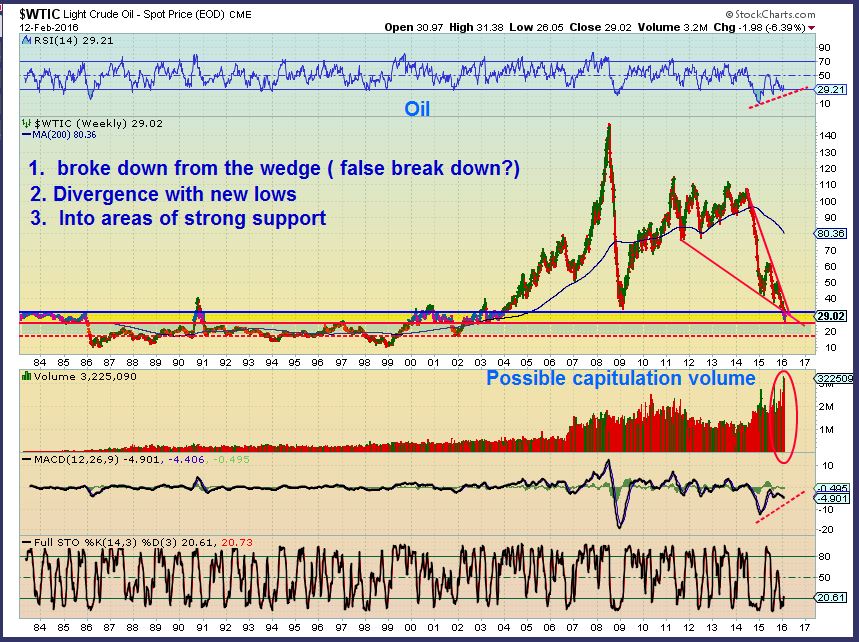
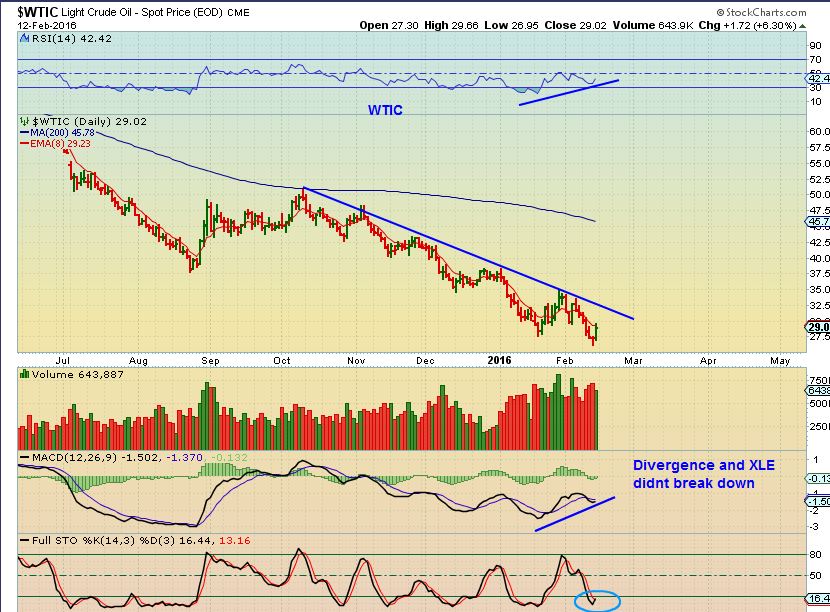
WTIC WKLY LONG TERM– Oil looks close to putting in lows, but it has for a while now. Read the charts.
.
Oil looks ready to bounce again. I had mentioned last week that the XLE & Several Oil Stocks were not breaking down with Oil (usually a sign of sniffing out some lows). Again, I’m watching the 20sma and that trend line. Oil stocks are for experienced traders only at this point, in my opinion.
.
GOLD SILVER & MINERS
I HAVE WAY TOO MUCH TO SAY HERE, so I am going to try to be concise for now. Brief but comprehensive. I will cover more as time unfolds.
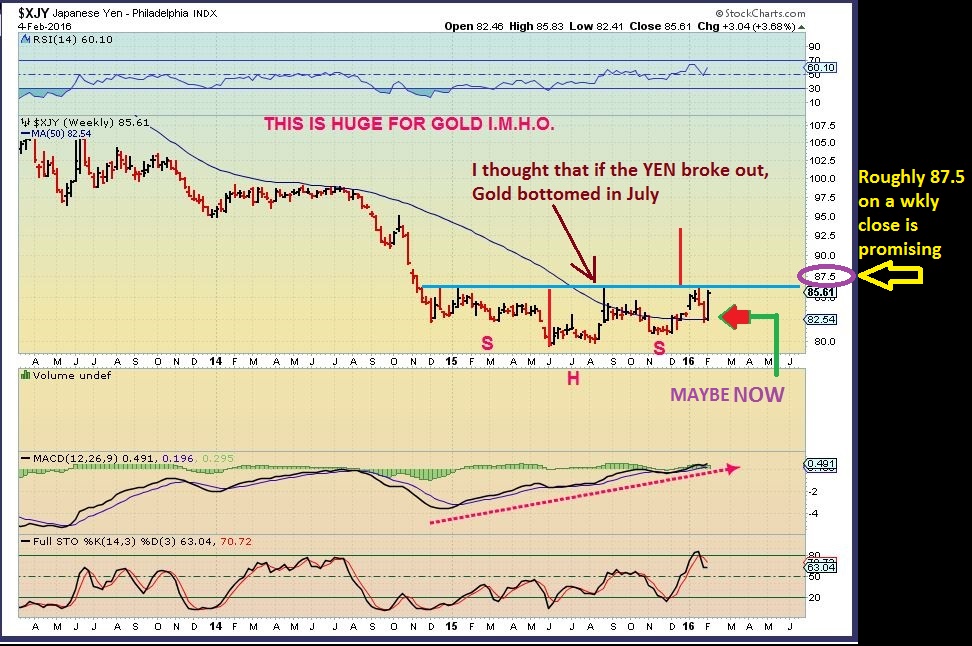
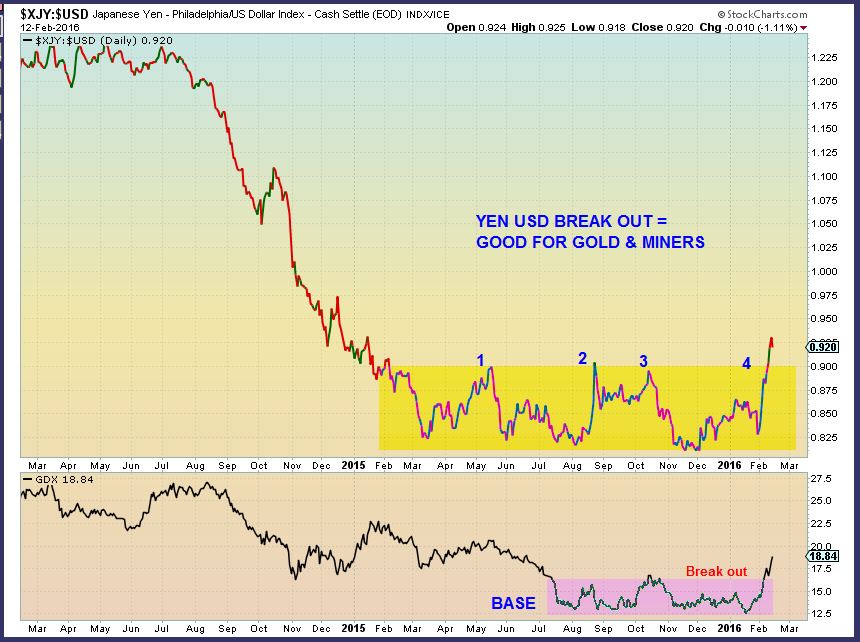
In a prior report, I showed a whole study on the XJY vs the USD and in harmony with Gold and Miners. I was looking for a break out here in this Feb 4 chart, since Gold & Miners looked ready to break out too.
XJY VS USD FEB 5 – Miners breaking out, and the XJY vs USD looked ready too. This is good for Gold.
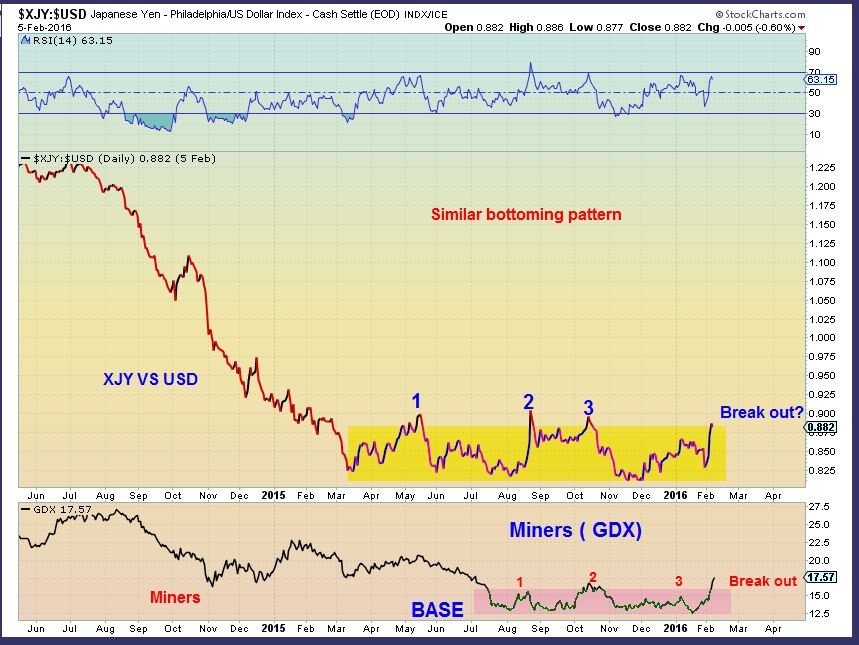
We got that break out and follow through with the miners. So this evidence still favors Lows in Gold, Silver, and Miners.
.
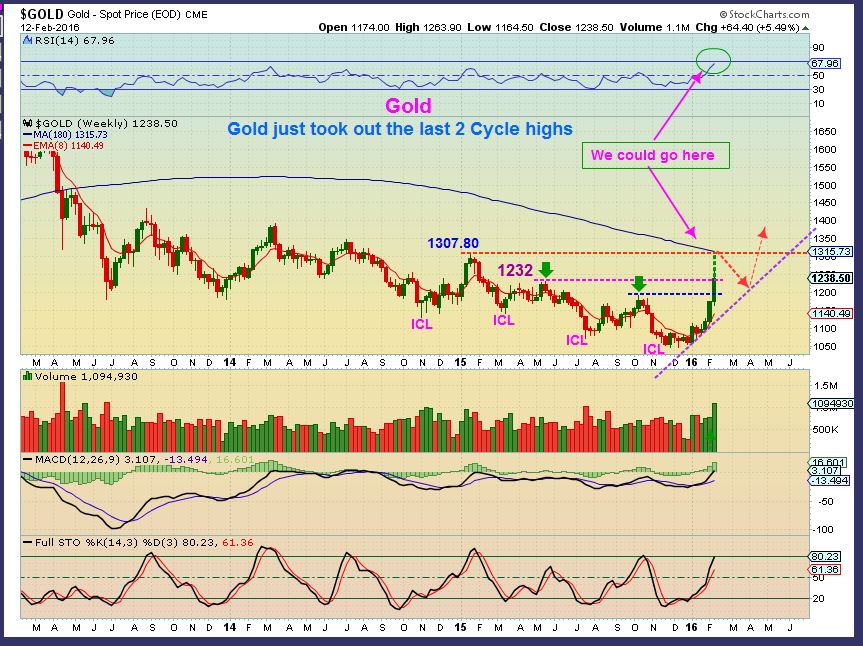
GOLD 2 views for now. What a bullish explosion last week! Gold is now rallying in all currencies. It has been a long time since I have said that. Further evidence that the bottom may be behind us.
.
-
Gold took out 2 former cycle highs. THIS is how an uptrend starts, higher highs and higher lows. If Gold had another week like the last 2 weeks, it would even hit the next cycle high at 1307.8 and the 100ma, forming a huge cup from Jan 2015. A handle would be the daily cycle drop.
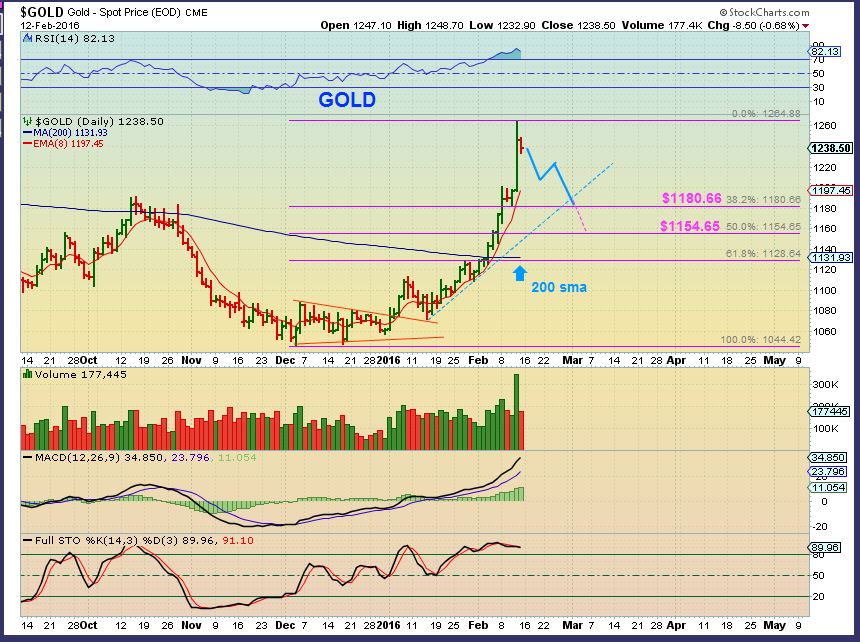
2 . Gold could also be ready to drop into a daily cycle low now and that would be normal. A test of the 200sma? (That could happen or it could come later as the 200 rises). A 38% retrace back down to the top of the cup shown is near $1180. A 50% retrace is $1154.65. All are possible, time will tell.
.
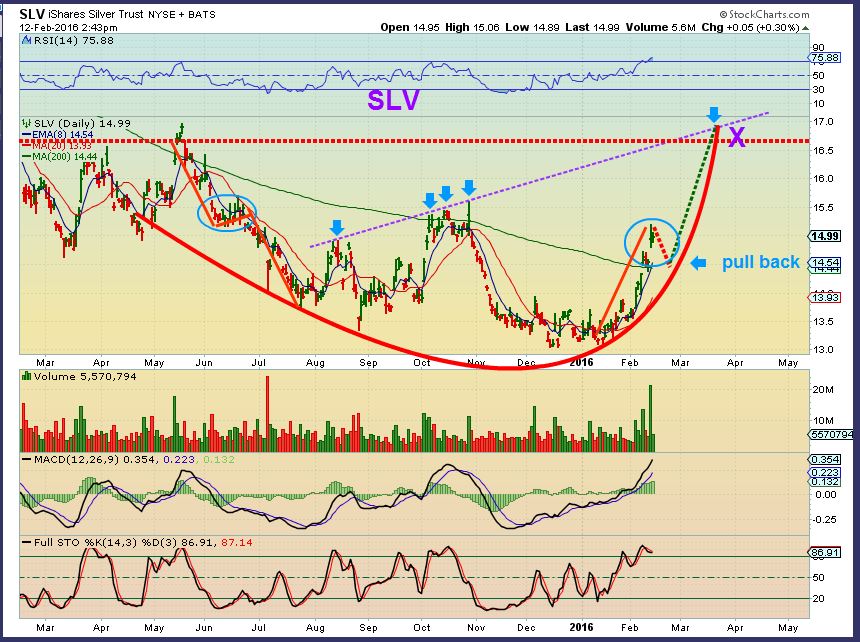
In the comments / chat section Friday, Son Of Gud ( thx S.O.G.) reminded me of a possible Bullhorn pattern . I agree and a bottom purple line would have shown this better. I was looking at the SLV in a similar manner, with Gold & Silver Cups. This would put SILVER & the SLV only about 1/2 way there. This can come immediately, or after a pullback and in a 3rd daily cycle .
.
GDX MONTHLY UPDATE – I posted this to keep an eye on. A close above $16 by February end. This break out could add further evidence that The Bull is reemerging.
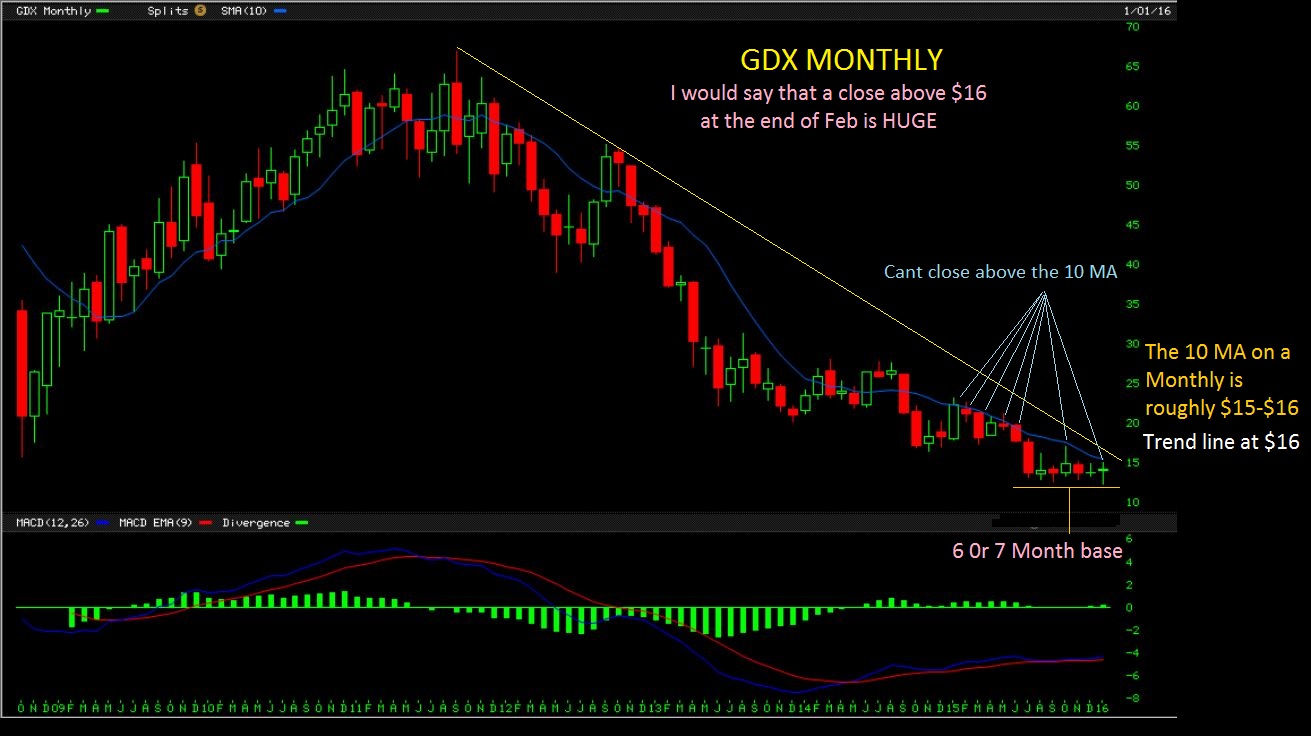
Last week we broke out and volume was good for the 1st week. Bullish longer term.
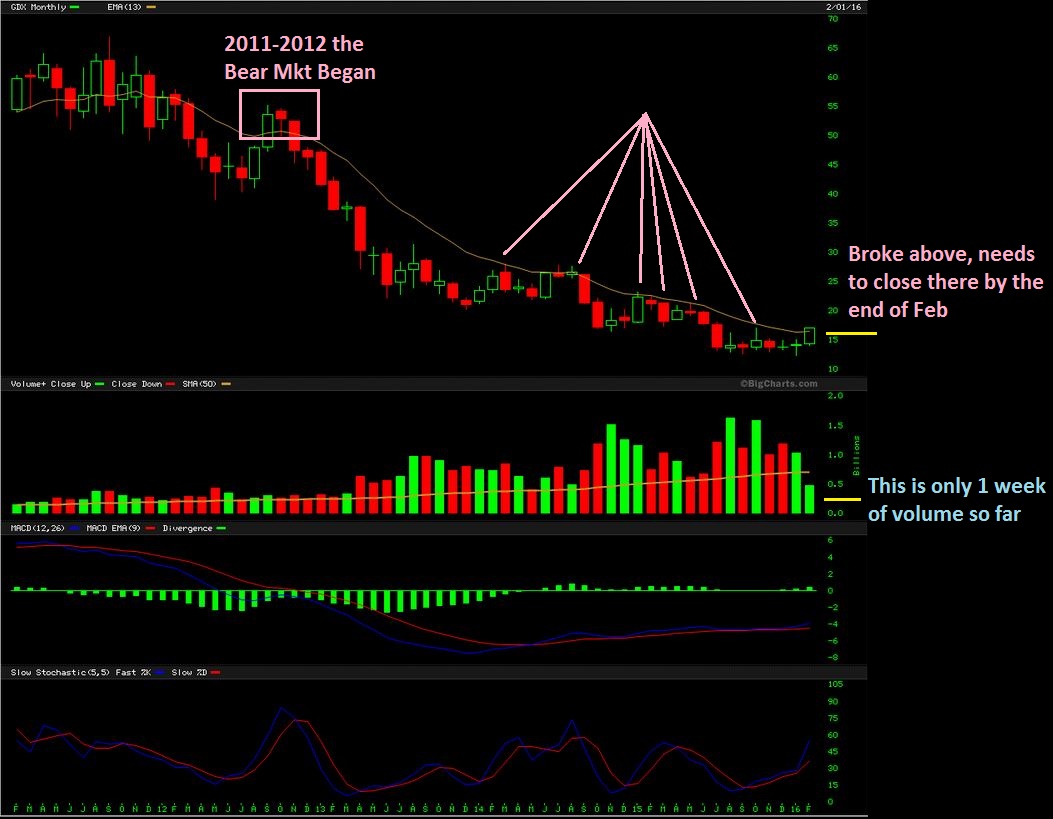
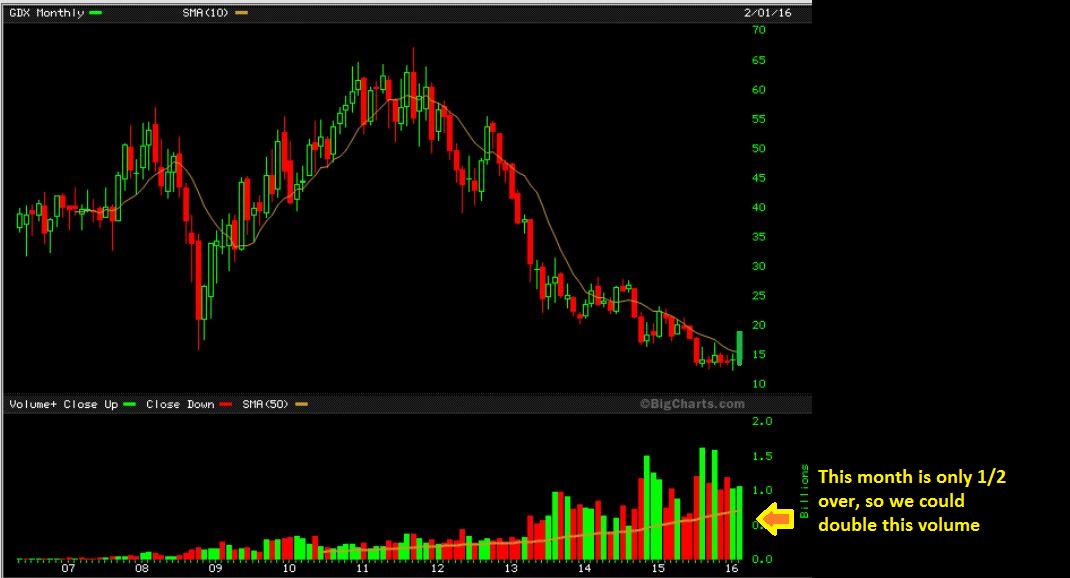
Currently – The break out strengthened above that $16 area. 2 weeks into February the volume is as much as it was in all of January already. We may end Feb near 2 million in volume. BULLISH. Look at 2008, the first month higher was followed by 3 or 4 more. 🙂
.
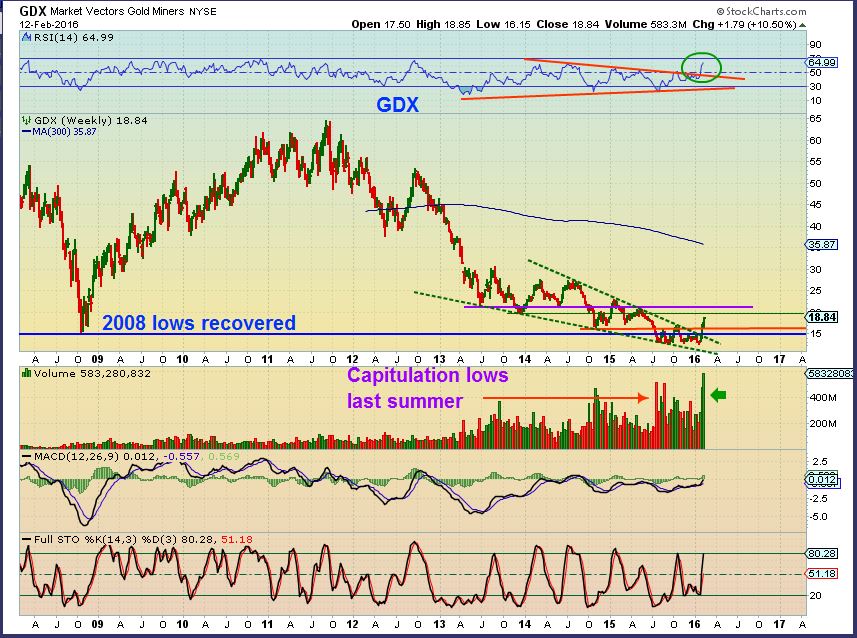
GDX– Just plain ole Bullish looking, and seriously, if THE LOWS are in? Do you see the gains we have made with Miners on this tiny move? Multiply x10 and more in the coming yrs on a trip to former highs.
.
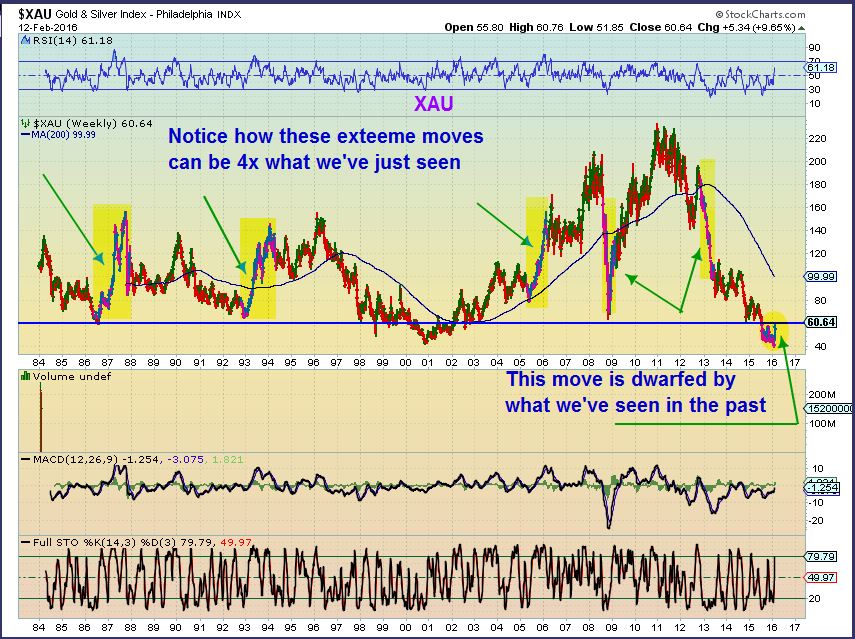
So that is a very bullish looking fact sheet above us for GOLD, SILVER, and MINERS. In fact , take a look at this 30 yr chart if you missed this move and feel that maybe you somehow “Missed THE Move”. You missed ‘a move’, but THE move can last for many months and years ( with pull backs along the way to enter). That move that we just put in looks tiny from this view.
.
For a review of recent Miner activity, lets look at the bases and break outs in Miners now. It started with some great moves out of 5 month bases in ABX and NEM shown in prior reports. We’ve seen DRD, HMY, SBGL, SA, etc with huge moves doubling and tripling as they moved higher. Now we see many junior miners & explorers breaking out too.
.
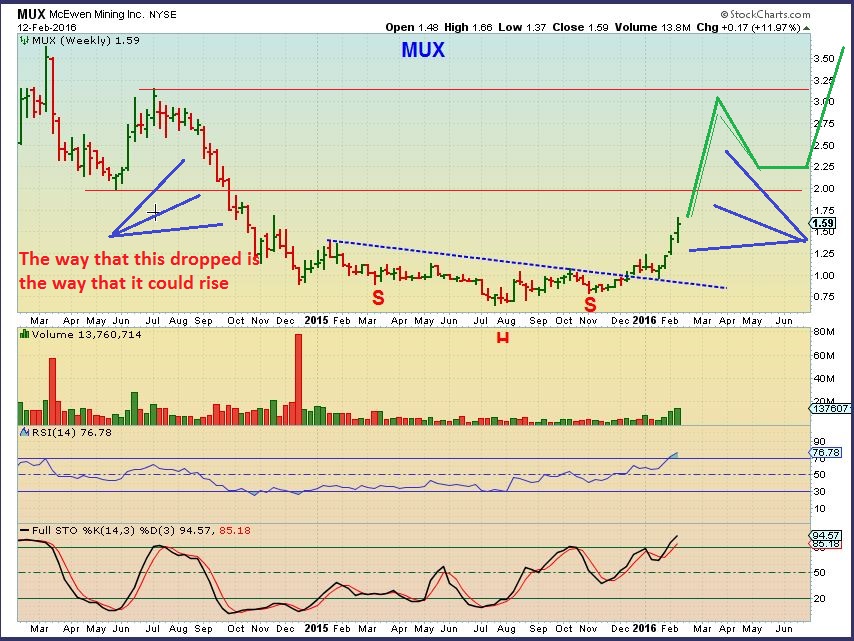
MUX– Look for the base.
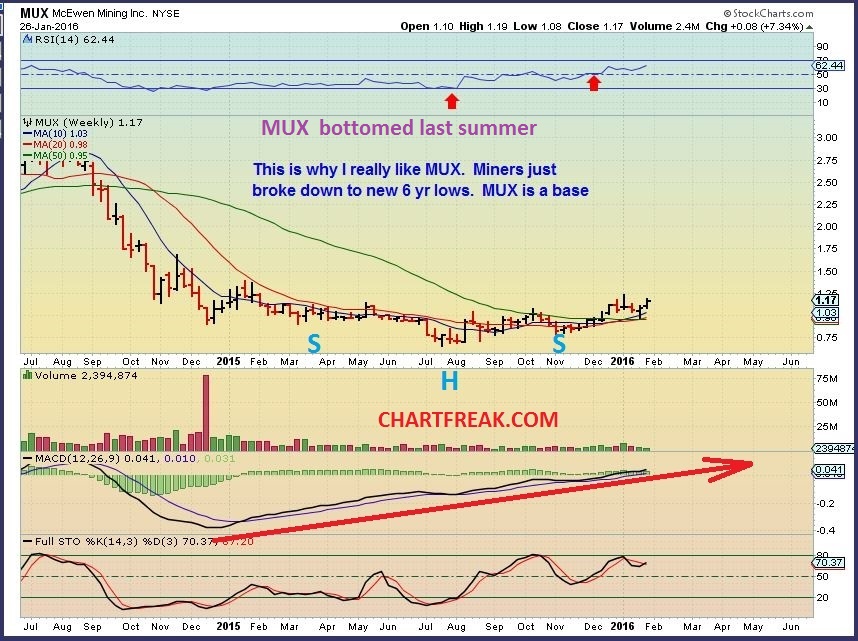
The run has begun, and can mimic the multi week drop on the left.
.
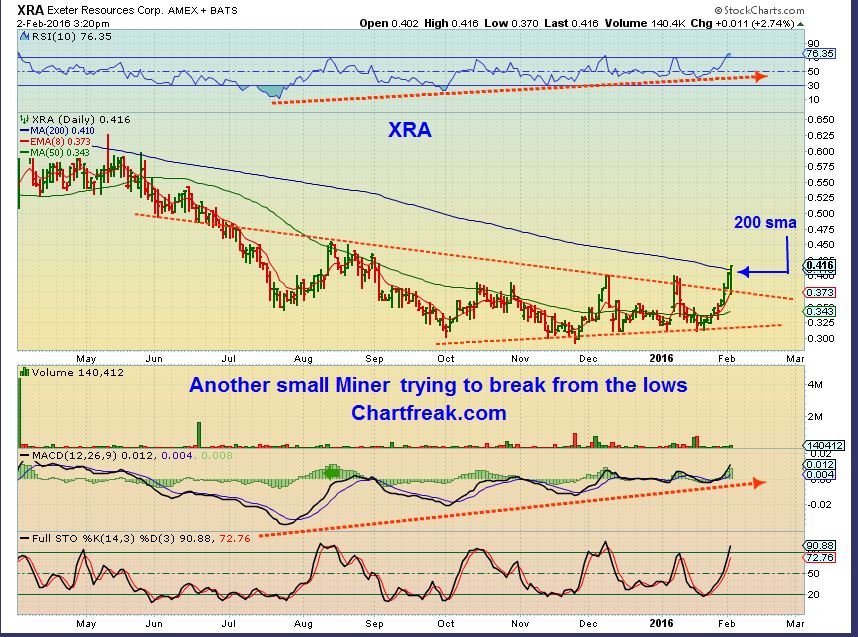
XRA was breaking out at $0.37 from a triangle base. Then over the 200sma with no problem.
.
These types of melting up moves can ( may not, but can) simply consolidate at the top & form giant Cup & Handles. The ride down on the left of the cup can be repeated on the way up under current conditions.
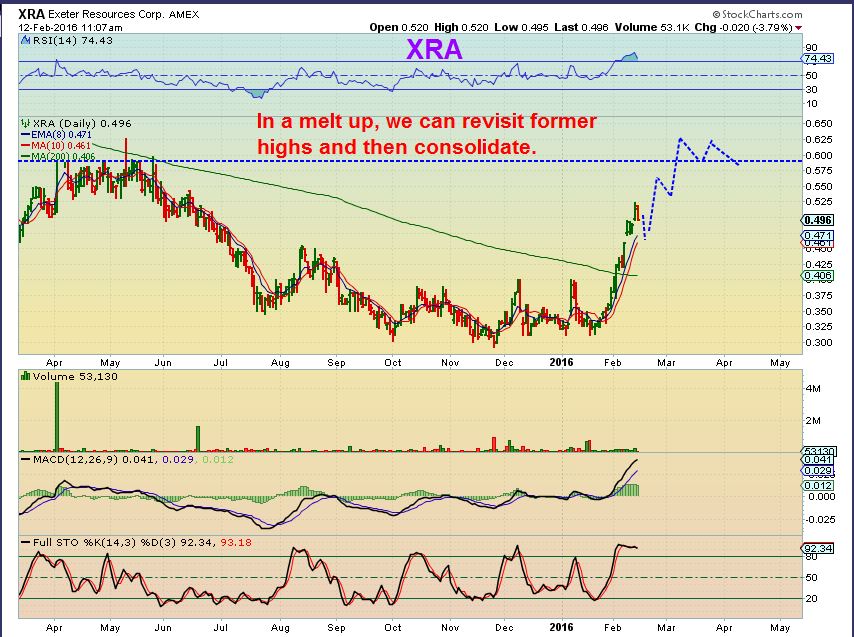
So by looking at prior opportunities / set ups and how they moved, we can anticipate future set ups.
.
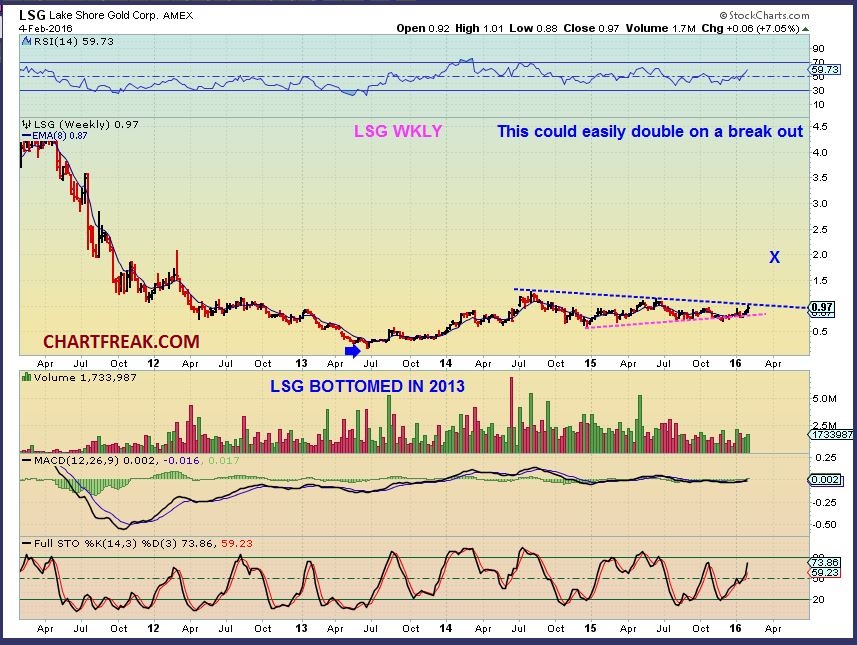
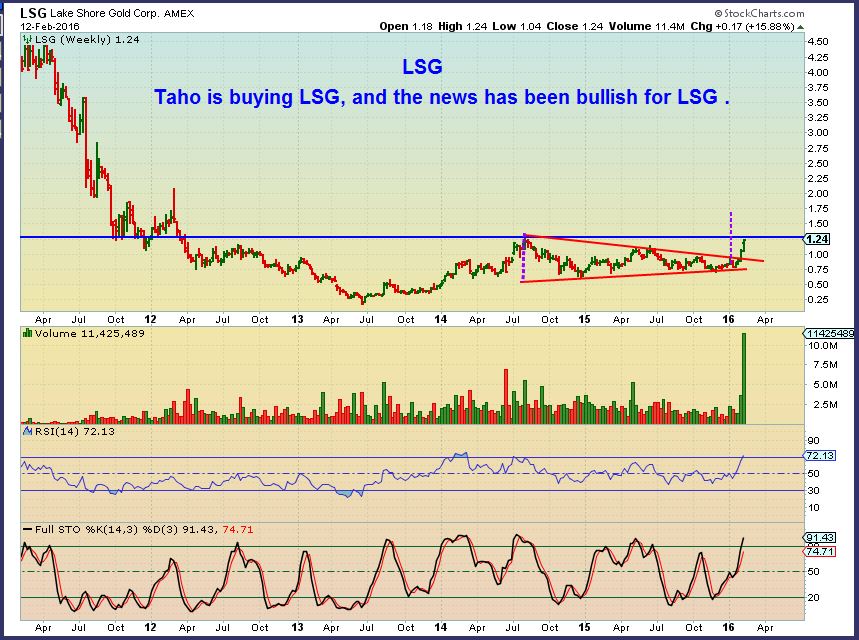
LSG – Feb 4th , and this was a Great set up, much like RIC.
This looks rather explosive with that volume pouring in. TAHO had a shake out from a wkly base and then flipped higher last week. It looks ready to run higher, and that would send this one much higher too. This could be a strong company with the combining of the 2.
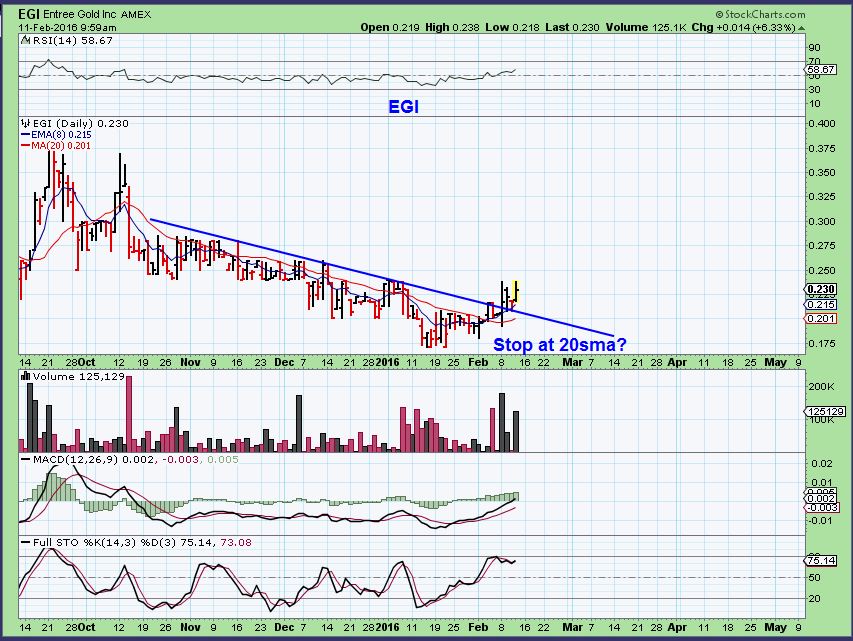
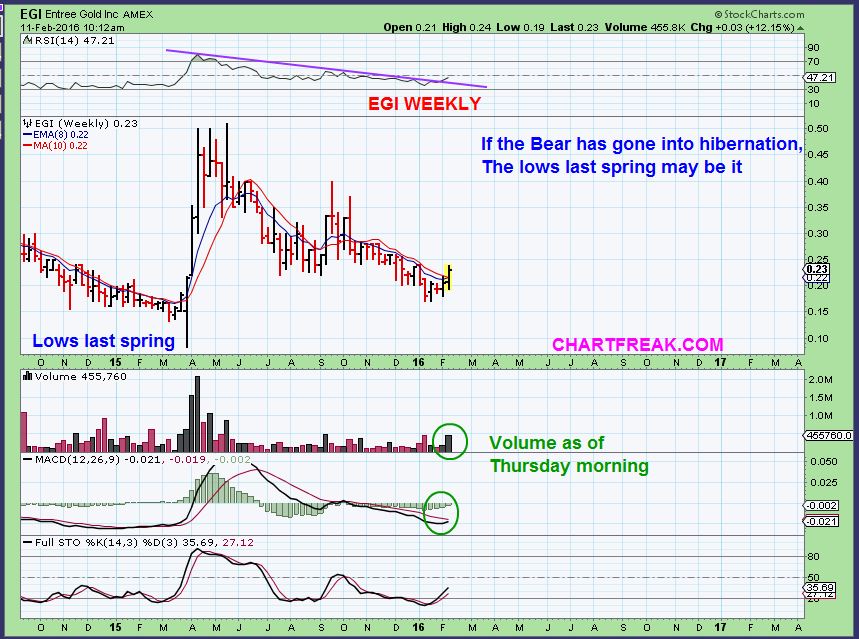
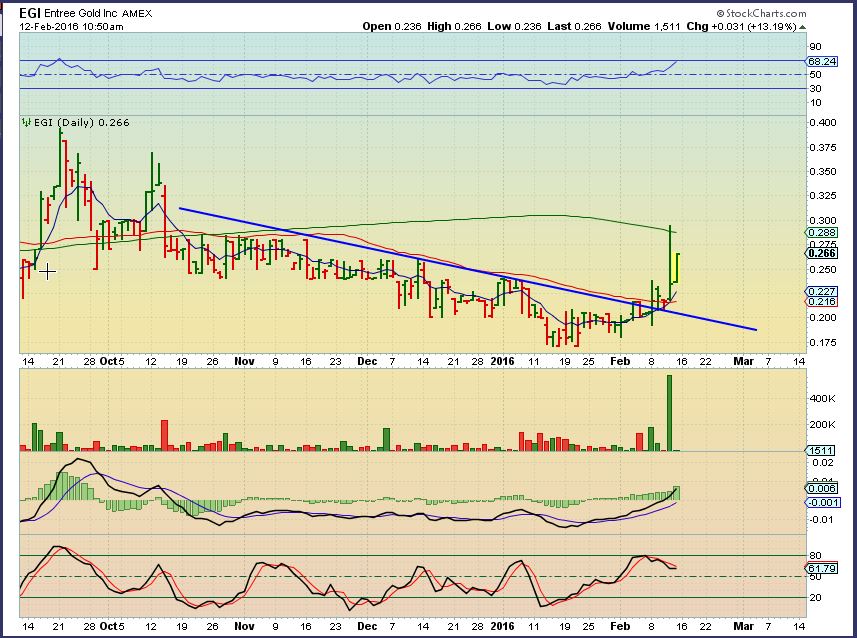
EGI – Even those Babies are now following the leaders. I posted this Feb 11.
.
A bigger picture was still bullish, still a buy in my opinion. This can easily double if it breaks this base.
This closed the day at $0.27
TGD – Back test at 7 cents and then broke above the 9sma at 10cents. It closed at $0.23 now.
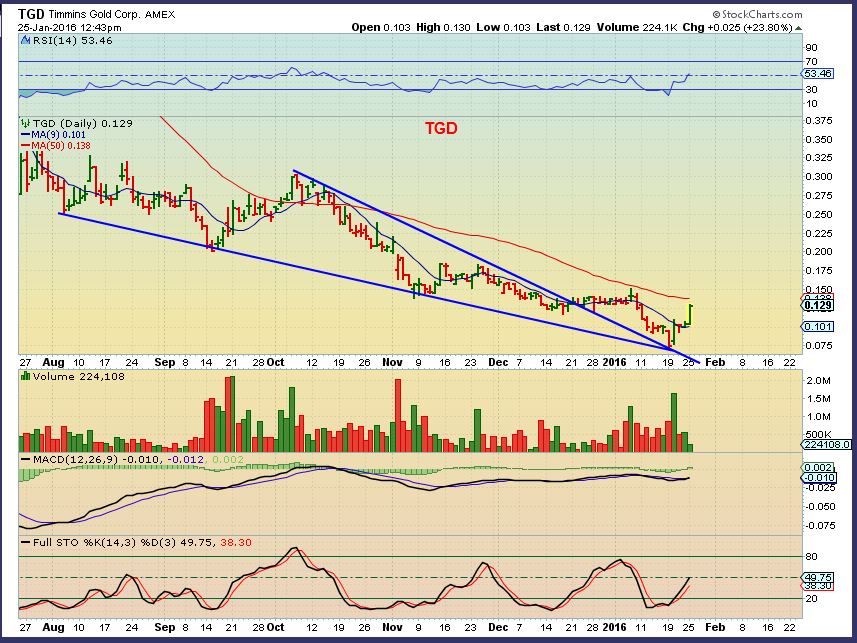
I also posted this at 13 cents, so these juniors are running now, and you can see the possible upside in time. Their earnings came out on Feb 5, and the rally took hold.
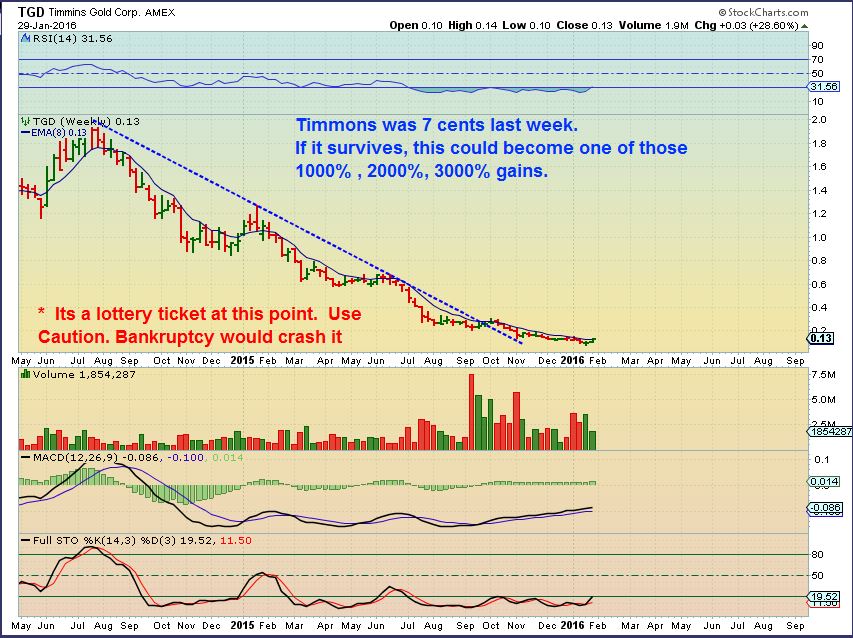
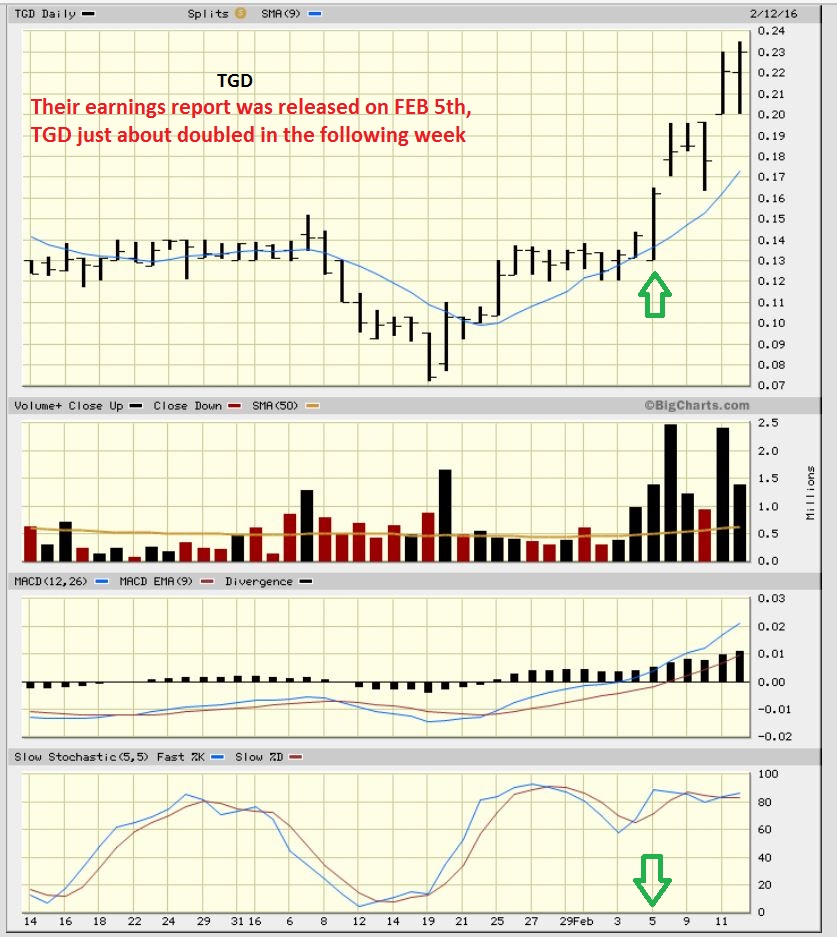
Timmins (TGD) released earnings Feb 5th and this baby Minor tripled in 3 weeks.
.
Think of this : We have had low Oil / Energy prices since Oil sold off from $100 to the $20’s/ $30’s. Energy is a big expense for Miners. This could give the expenses that Miners deal with a break when it comes to future earnings reports. The price of Gold rising would also help earnings when they can sell product for greater profit. There may be a bit of a bullish domino effect here. 
.
So we are definitely seeing many reasons for believing that the Big Picture is changing as expected. The Bear market lows could definitely be behind us with that classic shake out move in miners in January. We see Gold and Miners breaking above prior Intermediate cycle highs. Many that were stopped out and left behind may now have to buy later and that could push this higher too. The set up is very encouraging and we will be trading it and following it to the best of our ability here. Some “Mining Stocks” may act individually and set up even when Gold itself is pulling back, and that will be noted too. We saw this type of action when several Miners bottomed months, even yrs ago. Other may now have reason to do the same. I will be hunting for and sharing trading opportunities in this sector with that in mind.
.
~ALEX
.
Final Note : People are already asking about “ buying the dip next week “. I want to show you something here. We could get a buying opportunity soon on a pullback, but I also have been studying extensively prior lows and bottoms, the following run up higher, and then the pull backs that follow. I have a folder full of charts and I will gradually share these in future reports to help us with our expectations. I will start below with 1 note here, as we anticipate a possible pull back to a DCL ( Daily cycle low) soon.
.
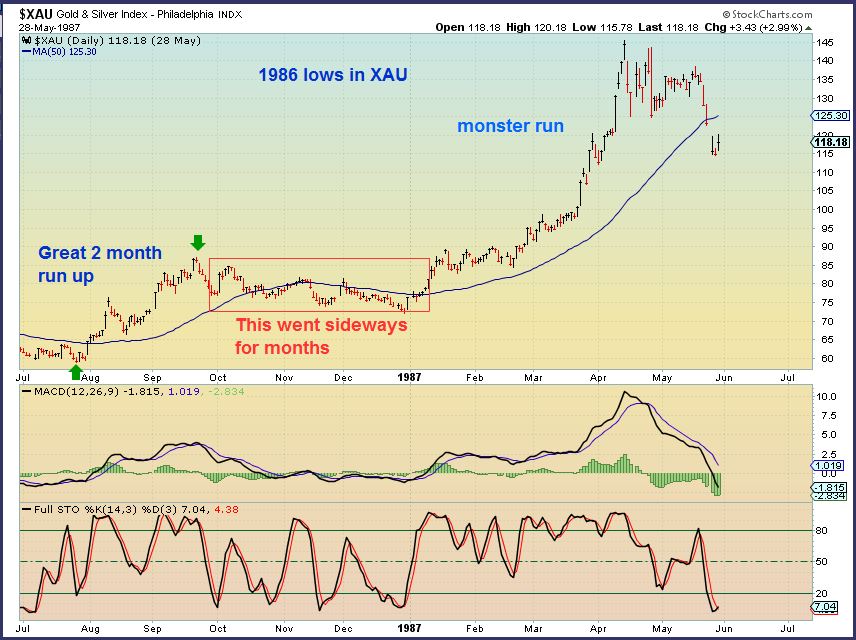
I wanted to point this out in case we get a sideways consolidation now, instead of a large drop. Either could happen. Notice that movement Inside the red box is Not as easy to buy as it looks. Notice the 2 month run higher and then it just had a long sideways consolidation. These get Exhausting watching them day after day. It lost the 50sma in Oct ( sell?) , Then regained it in Nov (buy thinking it’s breaking out?), loses it again in November to a lower low ( sell?), regains it in December (buy), drops to new lows in Dec (Shake out) and then takes off in January . Then if you bought that late , it stalls sideways and consolidates again -to make us nervous, and off it goes higher again. Not Easy. How do we handle this?
This is not as easy as one may think, so IF the lows are in, it may be best not to sweat the wiggles of GDX & GDXJ. Instead it may be time to just add to individual miners on dips starting small positions, and not be jumping in and out of 3xetfs. ( of course that is your personal choice if you want to trade them, I’m just saying that this can be tricky). Often we think a run out of the lows is straight up with only small pullbacks.
…
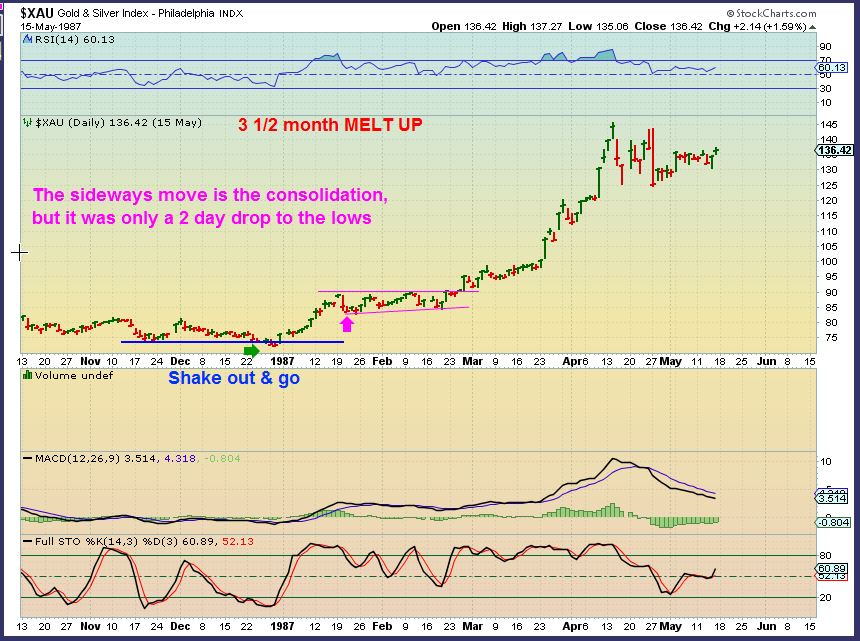
1987 lows Again – These are the same lows, but this chart is focusing on that Nov – Dec shake out at the 50sma. It then experienced a 3-4 month “Melt up”. I mentioned these type of runs in my last report. People just get locked out. Lets break it down.
.
-
After the shake out lows in Dec , a 12 day run higher began
-
The ‘pullback’ then only lasted 2 days and then it went sideways for weeks. This would have been good to accumulate positions in favorite Miners ( This would be No fun in NUGT or Dust until March)
-
The run from Febs break out to April was relentless and did not allow those waiting for a pull back to get in.


Another hugely informative and well balanced report Alex. And I personally love that you keep stepping back and looking at those bigger pictures as well so we keep everything in perspective. All too easy to get caught up in ‘the noise’ of the moment and lose sight of the bigger prize! For example, your weekly XAU chart near the start with the 200 wma. You could make a case that a bull move is not really confirmed until we are back above that 200 wma. It has topped there before as in late ’99. But once it’s above it has tended to really get pumping. That MA is currently around 100 although falling hard. But let’s argue the XAU crosses it around 80. It would then have risen something like 100% and I’m sure many might be feeling they’d missed the bull run, whereas your very long term chart shows the party may have barely begun at that point! So thanks again Alex. Great perspective and something here for everyone from the scalpers to the long term investors. Enjoy the rest of your long weekend. 🙂
I second your thanks,Chris
I especially like your last chart and insight on this report Alex.
Happy valentines day Maria…
☺ thank u beek.. same2u
☺ ..
Lost in the wiggles; yep, that’s me!
Thank You Chris.
So many charts, so little time 🙂 You are correct though, I’m trying to find something relevant for Scalpers and longer term viewing readers.
I put this together about SPY, especially after GUD asked about my Friday AM comments. I really see this (currently) mimicking the Aug-Sep movement. Could easily change, but is following right now. HUGE divergence on the RSI; stoch slight divergence but really about down to lows. If this wave count is even close we’ll have a wave 4 up bounce soon – Fibs show 1910, 1950 (50 day will be about here at that point), then 1985. I went long Friday when 1850 held.
With the chance of melt-up, I went long NG and SAND Friday, thinking that they looked more like laggards. Definitely worried that the gold pullback that is due will pull them down and that I just bought ANOTHER top, BUT I bought laggards AND small and I’m not in leverage. If I bought NUGT, might really be worried, but now I have skin in the game and feel pretty confident that lows are behind us (but still need to keep an open mind). Actually, a pullback would be great – might be time to get a truck to back up.
Sandwiched btw 200 and 50 day with 8 EMA sloping up. Any consolidation leading to a 200-day SMA break could be explosive. Hasn’t closed over 200-day since 2014.
For what it’s worth coming from a guy you don’t know, Cason – I think anything you buy now will look great in a year. So you’ll know I’m a guy putting my $ where my mouth is – I’ve accumulated GDX/J and indiv miners from late July through December – now 80%+ of my main account. My worst-timed purchase was GDX & GDXJ on a false break-out at the end of August. That was painful to hold through so near the beginning of my accumulation and ESPECIALLY holding all positions through the December low! But I didn’t sell a thing and now am breathing easier. As you say, I felt it was a back-up-the-truck moment – however, I’ve been waiting for a few years for this, so I wasn’t letting go easily
And I’m glad I found CF last summer to add to my work on PM & Miners – Great Report, Alex!
I’m holding a bit of a core and trading also . With todays pullback in Gold , it should really help many mining charts start to show clarity this week. Will some hold up nicely, while others pull back quickly? I have to wonder if some may just fall apart too.
I think the thing to watch it the high flyers like DRD, HMY, and even MUX and AU – Some that have enjoyed the run. I want to see how they react to a larget drop in Gold ( Today was not all that large on a chart, but it feels it when you see it down $30).
Some of those miners may become buying opportunities in time.
All perspective, isn’t it? If you got in near the lows and went up $200 with it, $30 isn’t a big deal. But if you got NUGT at the top last week, Tuesday might not be fun. Keeping some powder dry.
Hey Cal, thanks for the comments. Yeah, I been reading and seeing a few of you that had been in for awhile now. GL with your positions. Really hoping for a good load up opportunity soon. Looks like bad timing for me to go in Friday. Based on some of the themes we’ve been following, my stops are pretty liberal at this point.
Also looking for the market to finally pull higher; could be a good short entry in the near future.
1 concept that might be worth some looking in to – selling covered calls on some of their positions. Sure, if they continue to rocket, it could be risky. But most of these names should be ready for at least a little bit of a pullback. Anyway, I was looking at options pricing on Friday and it is through the roof based on the recent volatility. I even tried to cash in on the (almost) pullback Friday morning – even with the really low open, GDX puts didn’t move much – b/c the time premium is coming off at the same rate as intrinsic can be added back on. So, if you could put that straight into your pocket. Anyway, down, neutral/consolidation, and even a small rise all make money. GL.
The charts above show XJY:USD. I didn’t initially realize that the referenced previous study (Feb 8) showed the opposite – USD:XJY. Don’t let it confuse you like it did me.
Yes, always read the chart. When that says USD:XJY – That is what it is. Thanks for helping others if they ran into misreading what is written. The above chart shows the USD first, so if the dollar drops, the chart drops. XJY:USD is showing the Japanese YEN first , so if the Japanese YEN runs higher, that chart moves higher.
If it says USD:XJY…It is the dollar vs yen. If the chart says USD:GOLD, it is the dollar vs gold. If it was USD:CAD, it is the USD vs Canadian dollar, and if it is CAD : USD – It is How the Canadian dollar is performing vs the USD.
I post many and I explain them, but I did recieve a few emails, and it seemed that some ‘skim the reports’ and dont take the time to read them. Then they realize that I am talking about several different views and they missed something important in the explanation.
I’m not saying that that happened to you, but I did have a few that told me that at first they just look at charts and do not read what is being explained. They read them later and get the true understanding.
I showed the USD: XJY here in the Dec 11 report to also point out to the readers that when we saw the USD;XJY topping, GOLDS ICL ( Lows) were in place
.
Chart shown here from that report.
,
So it was used to show that we can look for LOWS in Gold at these times too. And since it was in a topping consolidation, we could look for a break down as a sign that Gold would break out. We do have that now.
.
No worries. I read and remembered the report regarding the Yen study, and was left scratching my head for a few minutes, thinking I had gotten it wrong last week. Went back to Part 2 of last weekend’s report, saw what was up, and immediately the birds began to sing, the clouds parted, and the sun warmed my face. Hell, my wife even poured me one of my favorite beers after dinner. All good.
You were not alone…. I like that nature reacted well to the findings 🙂 lol
Your post may help others
I had to google your name. Are you related to BACCHUS? 🙂
Been dating her for a long time. Might say we’re “in a relationship”.
L .. O .. .L :o)
* I need a wife
I hate that stockcharts doesnt update the charts on holiday trading of GOLD and OIL, even though they’ll trade Sunday – Tuesday Morning.
I own a small core position in Great Panther ( GPL).
This bad news came out this weekend, death of a worker in their mine. : ( We’ll see what that does.
.
http://www.winnipegfreepress.com/business/vancouver-based-great-panther-silver-investigates-death-of-worker-in-mexico-368834241.html
Will GDX continue to ride the 8 ema?
If it does, and then turns higher, it may leave many behind again ( I dont mean here, I mean the ones that I see buying dust on twitter for a deeper pullback in GDX).
Things are pretty good for a down day. Look at MGN, SA, RIC, MUX.
yes…
Yes,
Actually, quite a few individual Miners look good and have that ‘set up’,
I mentioned MGN and BAA last week as good looking set ups . Today AUMN, BAA, PLG, MGN, etc
(BAA is in the process of a break out and has strong volume for 1.5 hrs of trading with Gold down 🙂
Just added to my BAA. My original position was so small I’ve been holding since August, apparently, haha.
It has nice volume and is sitting in a good base. I think it will get a Pop and some follow through.
I also added last week.
Looks like we spoke too soon. At least for NG, I did. MUX, SA pretty good considering how GLD, NUGT, JNUG fared. Glad I’m not leveraged at all, have time on my side for once.
Looks like oil was ‘buy the rumor, sell the news’ – I think what will be interesting is if oil can regroup and head higher without going back to the lower rails of the recent trading channel. That might be a tell, also how it then would interact with 20-day.
Considering the shellacking gold and NUGT are taking (as expected), many individual miners holding up well, proving that they have been a tough short here – that is a change of character and would add to bullish traits. Surprised (pleasantly!) how well my NG is holding up today.
VIX not settling down much on market rise. Alex, any new short term thoughts on SPY, Dow and friends for tomorrow would be appreciated. Tracking long term pretty well.
Refresh
.
Posted a different chart last week, but this is updated as of this a.m.
.
LODE and AAU look pretty interesting too
Things getting pretty ugly now. Looks like the correction ls here.
Sorry, man. I think I jinxed us!
BAA…..
Alex what do you see on this daily chart of BAA ?
i see london, i see france .. i see …
oh.. u were asking CF ..
*my bad 😉
😉
Would you care to put a EW count on BAA Ms. Maria ? Please…….. 🙂
Anyone visit StockCharts.com’s Technical Rank (SCTR) page before? It assigns a score to ETFs based on 6 technical indicators, covering short/med/long-term timeframes. Higher the score, higher the technical strength. Right now, over half of the strongest ETFs are gold miners. The other half are VIX, Bonds and Yen!