
GOLD PART 2 – IN Search Of A Bottom
This is part 2 of the special weekend report discussing how we Search for a possible bottom in Gold. This half of the report will include many more charts with just the facts of what is happening in many areas. Again, these facts keep both Bull and Bears unbiased. They also indicate that GOLD may already be hammering in a bottom. Miners especially have the hallmarks of a longer term low in place.
.
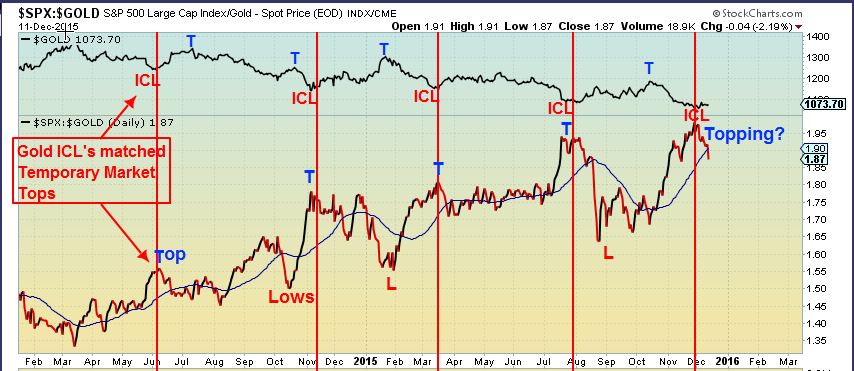
This chart adds to out last discussion in part 1 and my Big Picture view that I have been pointing out for months now. I pointed this out in this DEC 11 chart . It shows that with the SPX bull market , and the bear market in Gold, we have repeatedly seen Gold ICL’S ( deep trade-able lows) and also Golds Bear Market Rally Peaks moving inverse to The SPX . I drew this to make that clear.
T= a TOP & ICL = A LOW
.
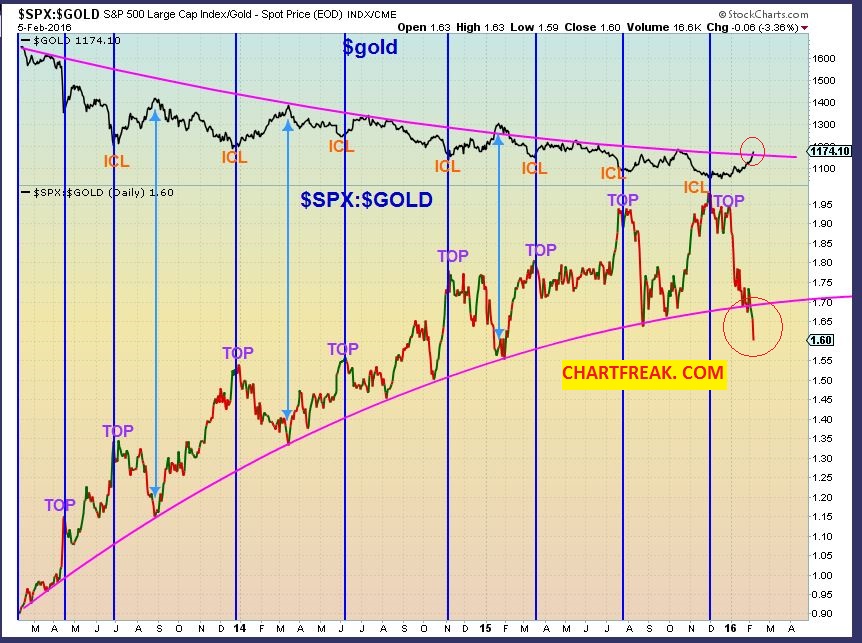
I also said that I would be looking for a break down in this area ( A change). Here is my updated chart
So…
I have been saying that I believe the SPX is topping, and we are seeing distribution at the top now and a break down. We are also seeing Gold pound out a different type of bottom. Not a V-Shaped ‘short covering’ only rally, but a nice round bottom. Many view this as weak looking. While we see ‘distribution’ at the top of the SPX, we see ‘Accumulation” at the lows here. Smart money buying (And a classic shake out in miners to boot).
.
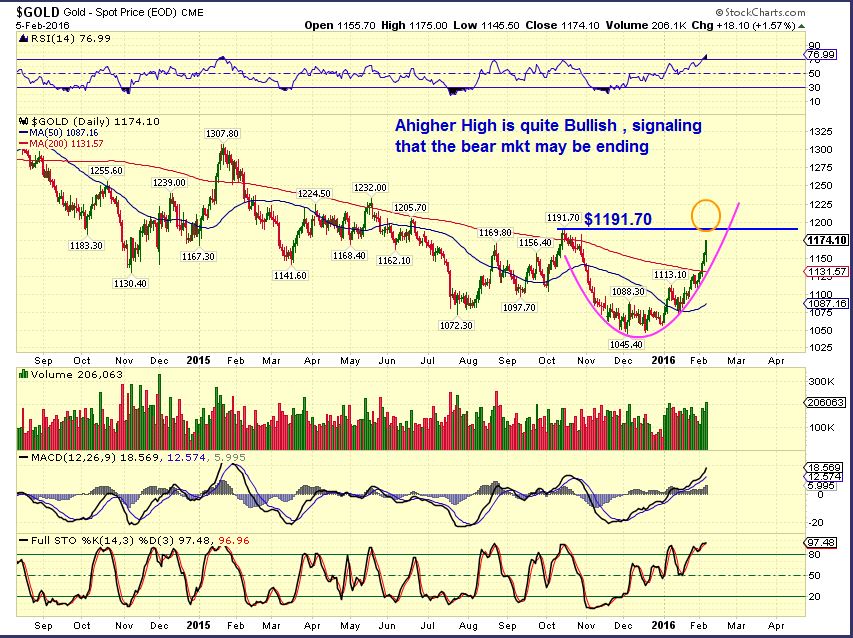
GOLD – A break above $1191.70 is the start of gold breaking free from the bear market. Higher highs finally after 4+ Yrs! ( See opening theme image). 🙂
Let me stop right here and just ask, ” What does it mean if Golds lows are in and the new Bull run higher is here?” It means that we could actually buy and hold many of these beaten down miners and walk away for months and come back with large gains in many, possibly all of them. If we bought and held stocks in the general market and walked away for months, we may come back to find a problem. That is why it’s called a Game Changer.
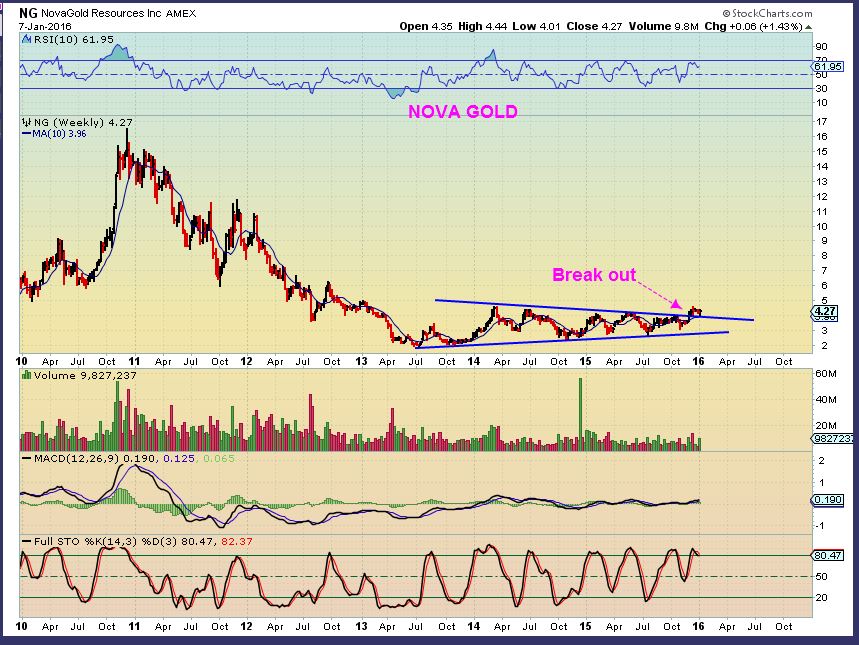
In past reports I have pointed out that some Miners already put their lows in during the Bear market. What will these do in a Bull run? These lows are already in…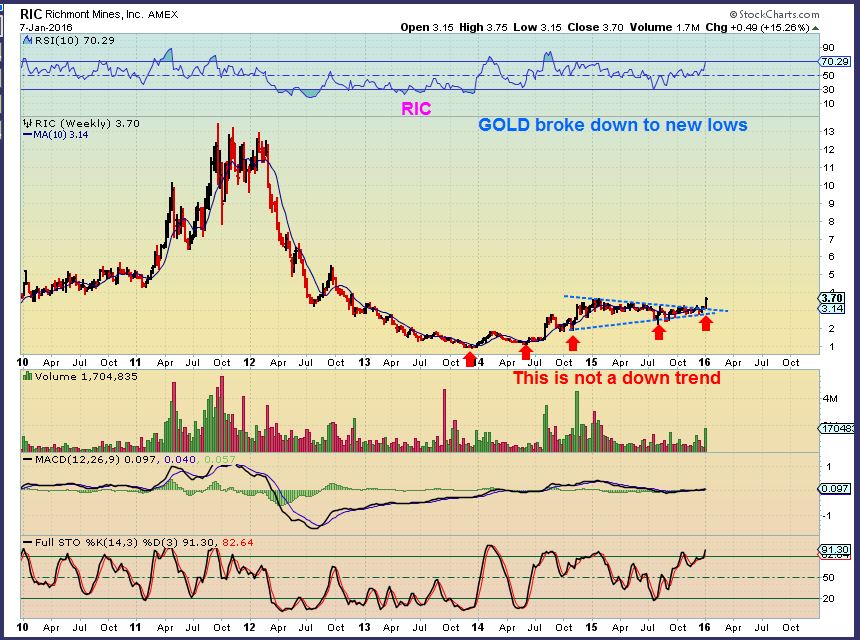
.
So lets get back to the research that I have done and show you some other things that I have been looking for and will be looking moving forward.
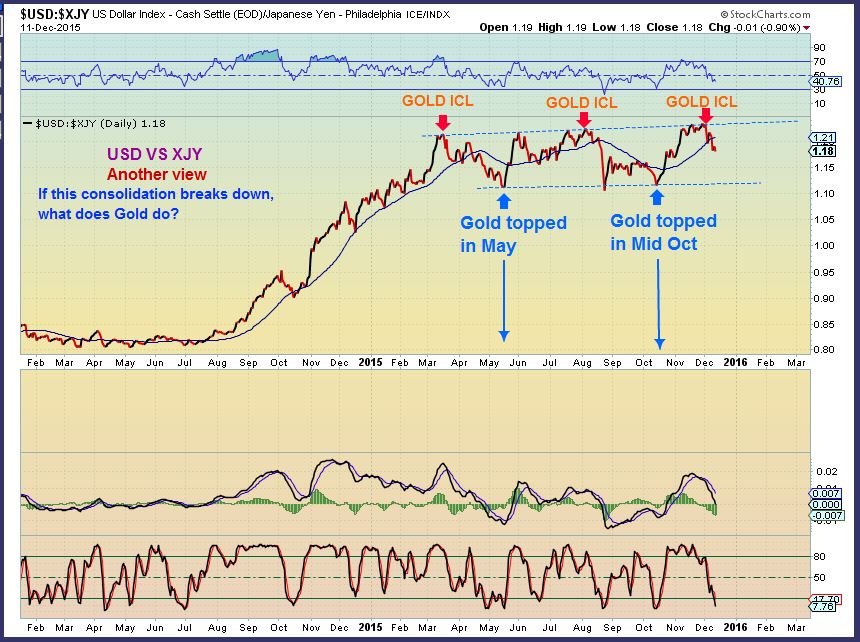
On Dec 11 – I Mentioned that I had been studying the XJY – Japanese yen ( I will share more of those studies later in this report). Here I had pointed out that I was watching the USD VS XJY. When it peaked, we saw GOLD bottom with ICL’s. When Gold topped ( the lower line), This ratio would rally and Gold would drop.
.
I then used the Dec 11 weekly chart to show weakness in that MACD on a weekly basis . If this ratio breaks down, Gold could break out, based on studies that I had been doing.

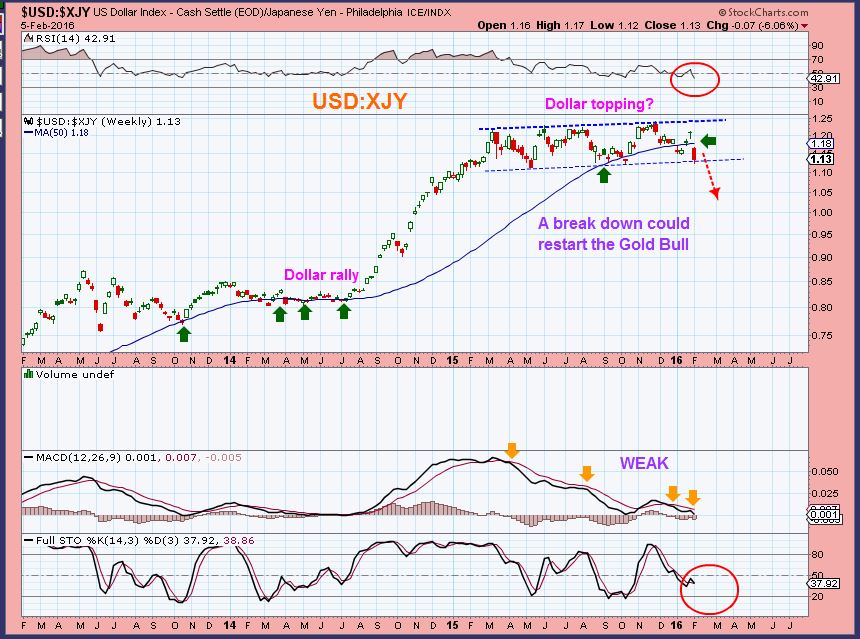
Update: The MACD for this Ratio is now very weak, and this could be breaking down ( Remember the surprise by Japan recently? BOJ adopted a negative interest rate regime . The XJY Popped and could rally like the dollar did).
I drew 2 charts by accident, one for yesterdays part 1, and one for today? I must be tired. :- )
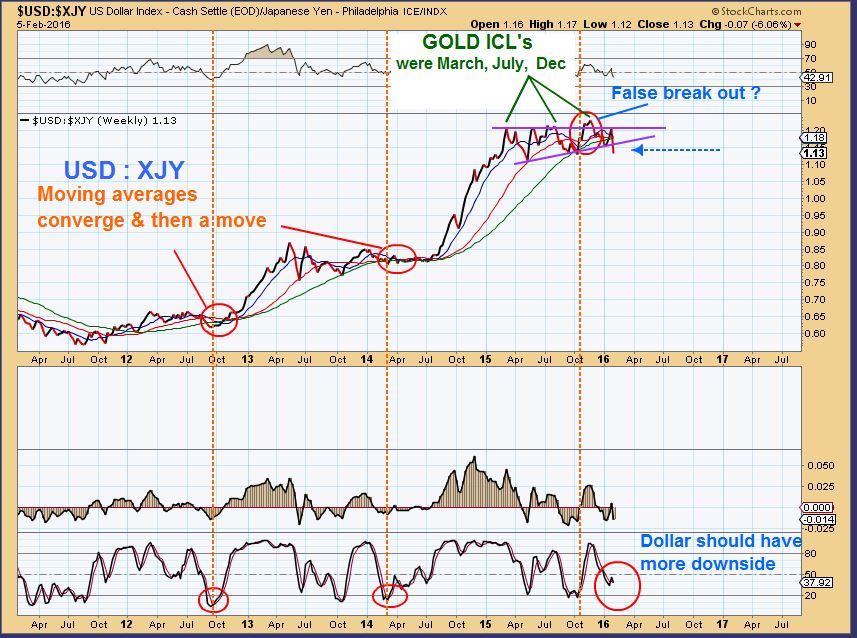
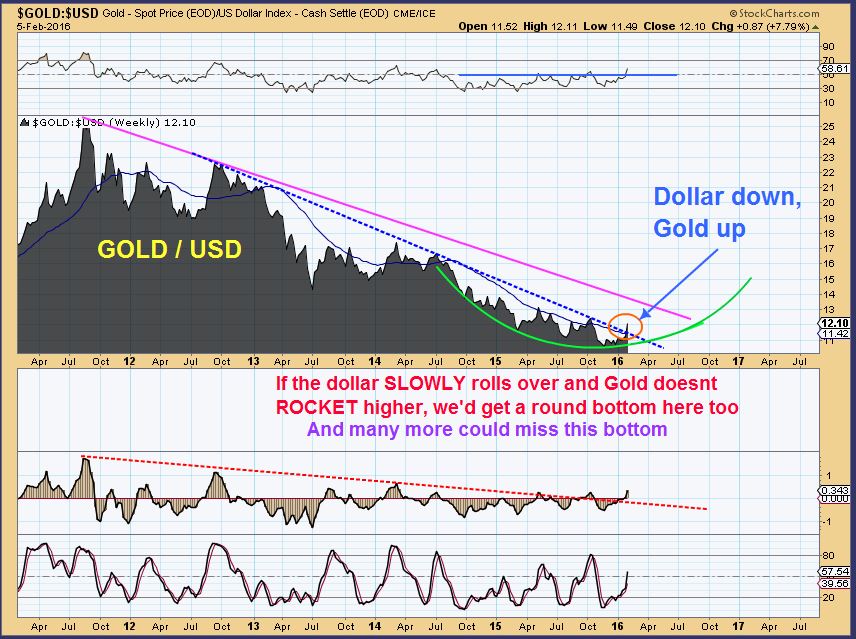
This gradual change in the relationship between GOLD VS USD is also slowly causing a round bottom here too. This bottom would continue with Gold breaking upward and the dollar dropping.
.
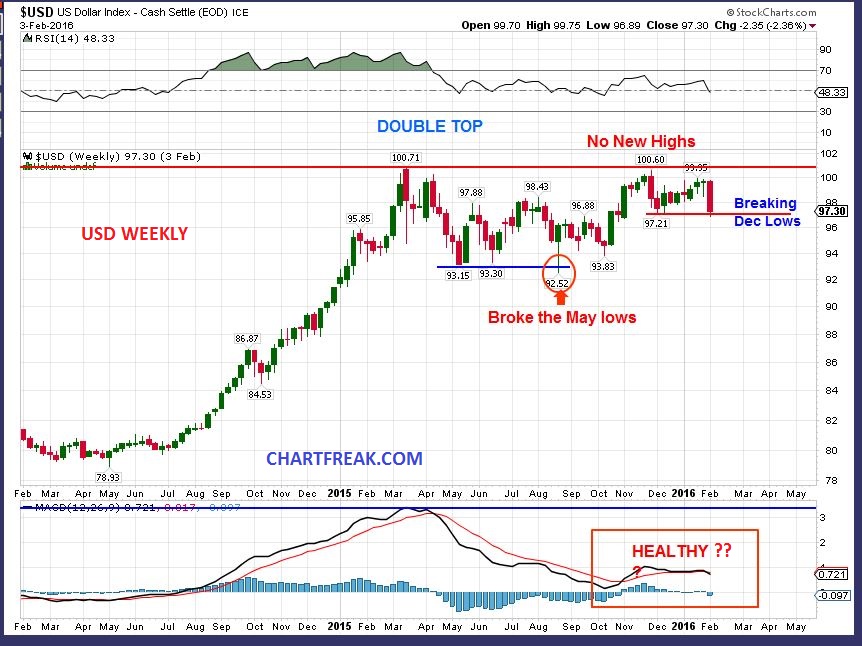
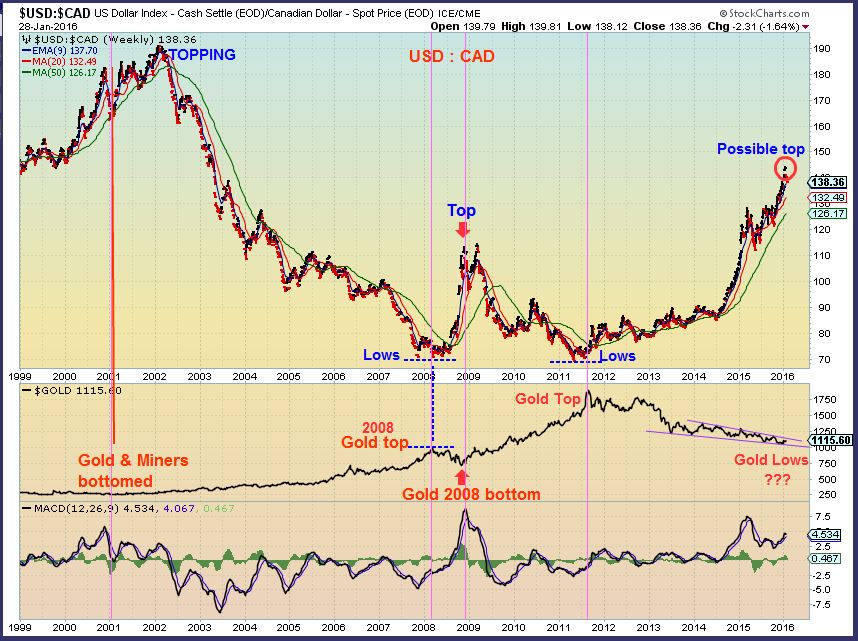
Again, The USD broke below the May lows, then it did NOT put in a higher high when the FED raised rates in December. This looks like the start of a double top and lower lows, lower highs. Time will tell if we get a gradual down trend now (Bullish for Gold). Look at that MACD.
.
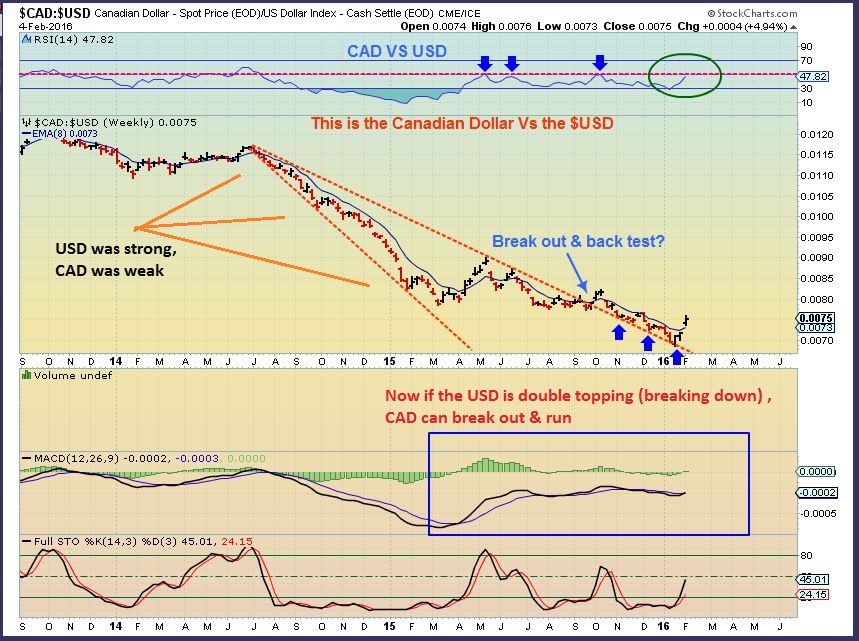
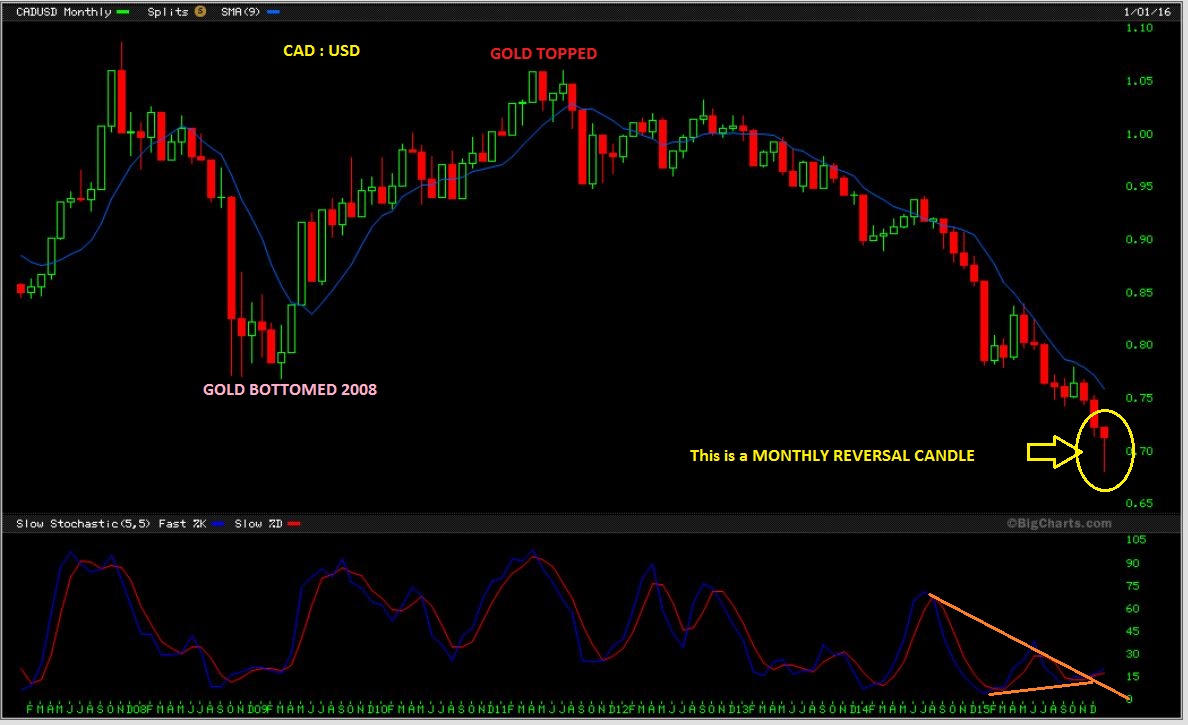
Is the Canadian Dollar breaking out vs the USD? I think so.
.
We see a MONTHLY reversal candle. When this happened in 2008 – Gold rallied. When it topped in 2012, Gold topped. ( Click any chart for clarity).
.
Here is the $USD / $CAD with $Gold in the box below. I drew this for last weeks weekend report and forgot to include it. It makes more sense in this weekends report.
.
This is the part of the report that I have wanted to share when the time was right. I started this study last spring, saving these charts as time went on. I knew that I would share this when it mattered, when GOLD & The Miners Bottom looked to be in place. I wanted to wait and see if this study matched up with that Gold Bottom when the time comes. I think that time is now. ( You will also see why I thought the July 2015 Lows in Gold could have been the lows too. ).
.
OK – Those who enjoy chart studies may enjoy this, others may struggle with it’s boredom. I hope to be able to explain this clearly for all. I hope to be brief ( yeah , right!). 
In the following charts I’m pointing out the $GOLD and the $XJY relationship, and my thinking all last year was …” When the XJY finally bottoms, we will see a GOLD Bottom soon after. ” To the charts!…
.
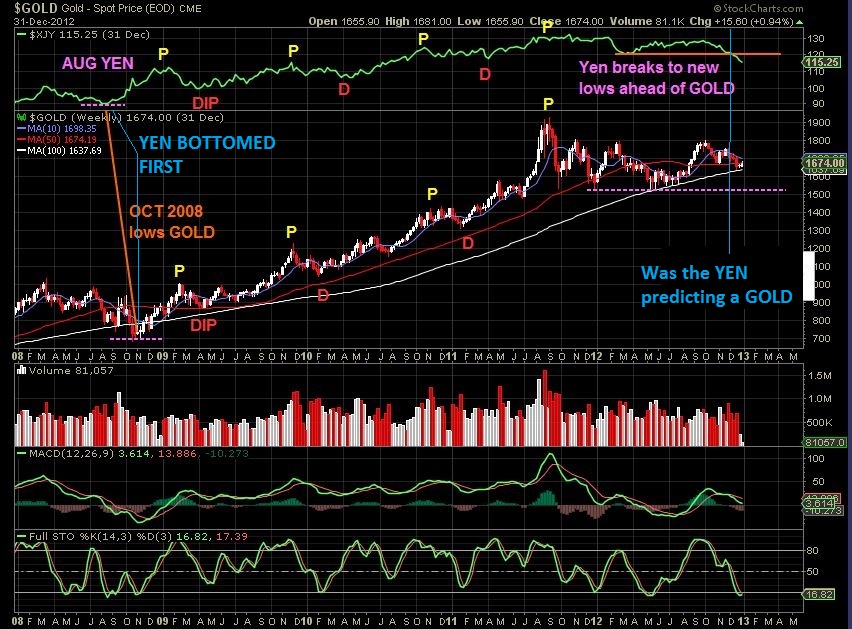
2008 to 2013 – The Japanese yen is the top box, Gold is the larger chart. Often Gold & the XJY Peaked and Bottomed around the same time. Notice on the right side of the chart in 2012, XJY broke down to new lows orange line (Gold hadn’t – Dotted line). Was XJY predicting Golds drop?
D= Dip P= Peak
 .
.
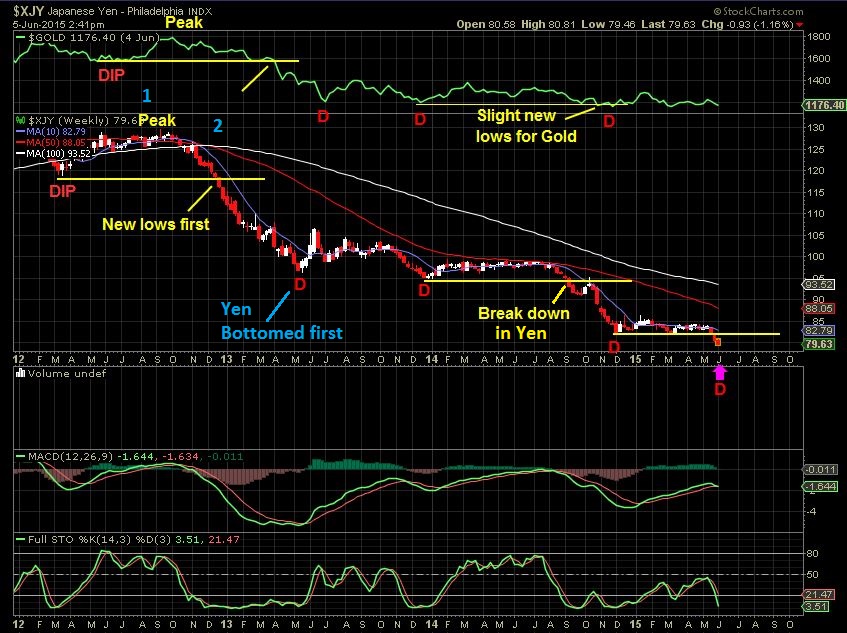
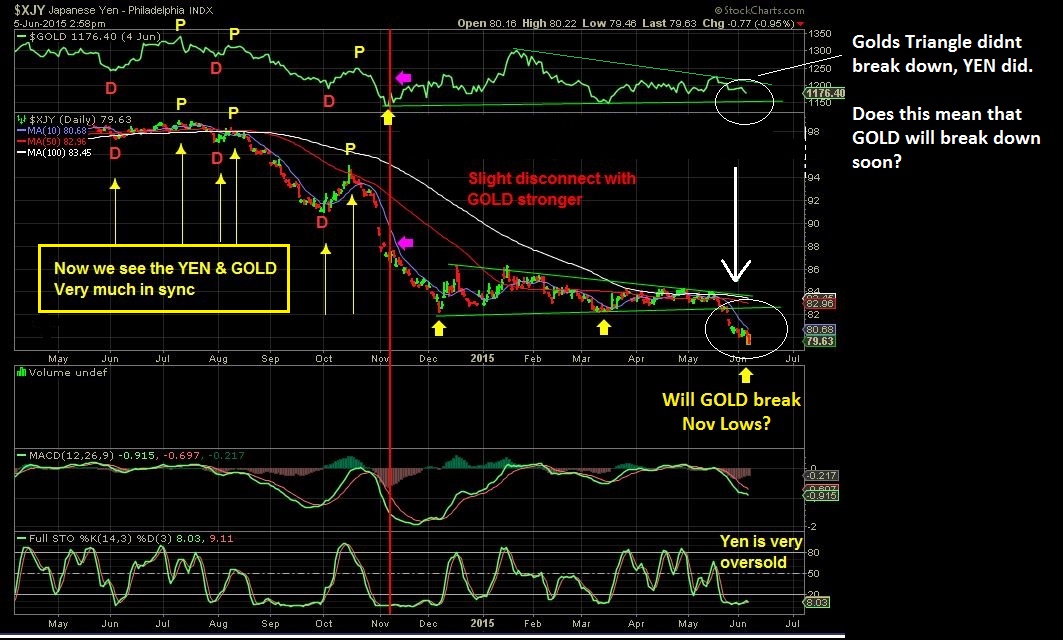
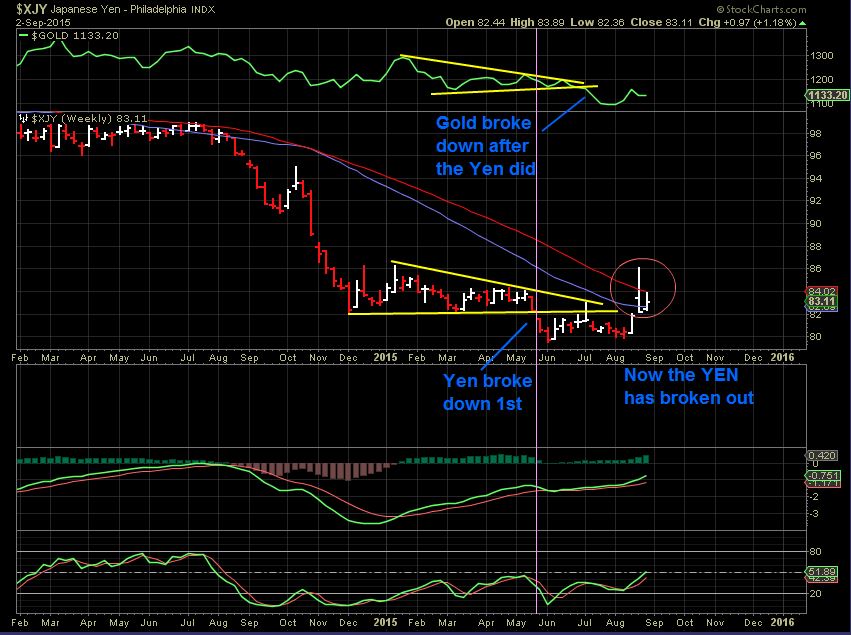
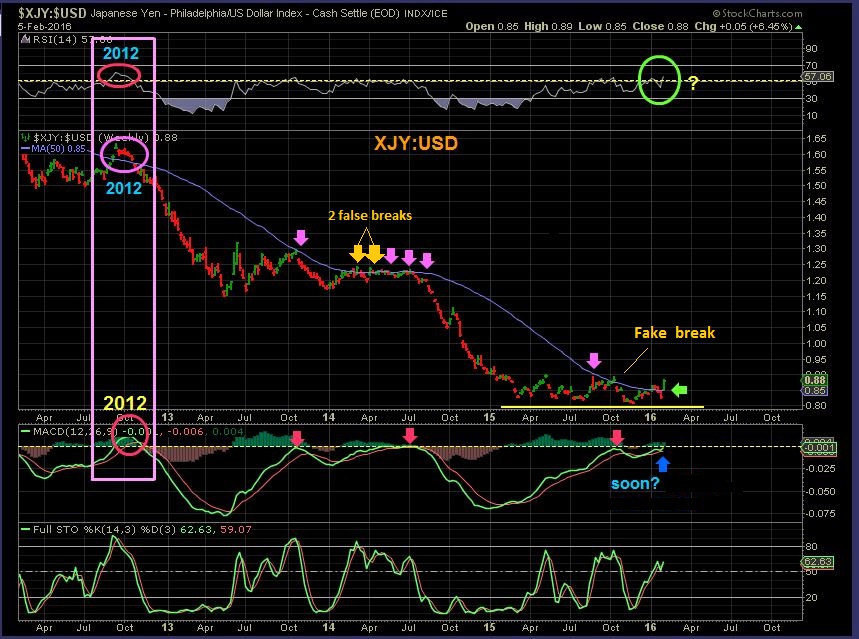
Jan 2012 – June 5 , 2015 – In this chart I placed the XJY in the large box and Gold above. I picked up where the last chart ended. In 2012 the XJY broke to new lows 1st ( 1st yellow line) , and Gold followed later. Each sell off after that saw the Yen bottom near Golds ICL’s. THEN we see XJY broke to new lows before Gold in 2014 again ( 2nd yellow line) , but Gold didnt. Shortly after that- Gold broke down too). That is when I started watching the XJY with GOLD closely.
You can also see that the XJY Then broke to new lows in June last summer (3rd Yellow line, Magenta arrow) – so a break down in Gold would come last summer too?
 .
.
On June 5 – Zooming in. Gold & Yen really acting in sync with dips & peaks. They both formed a triangle. $XJY broke down, would $Gold follow last July to new lows? I expected that low. Read the chart.
.
SEPT 2 , 2015 – Gold put in an ICL last July and we traded that low here. I was watching the XJY and it bottomed first in JUNE and made a higher low in August , so I actually started saying, “This could be THE LOWS” from time to time in my reports. I mentioned that I was studying the yen and liked what I saw. This is what I was watching. If the YEN bottomed in June and made higher lows, then I expected Gold to bottom in July & do the same.
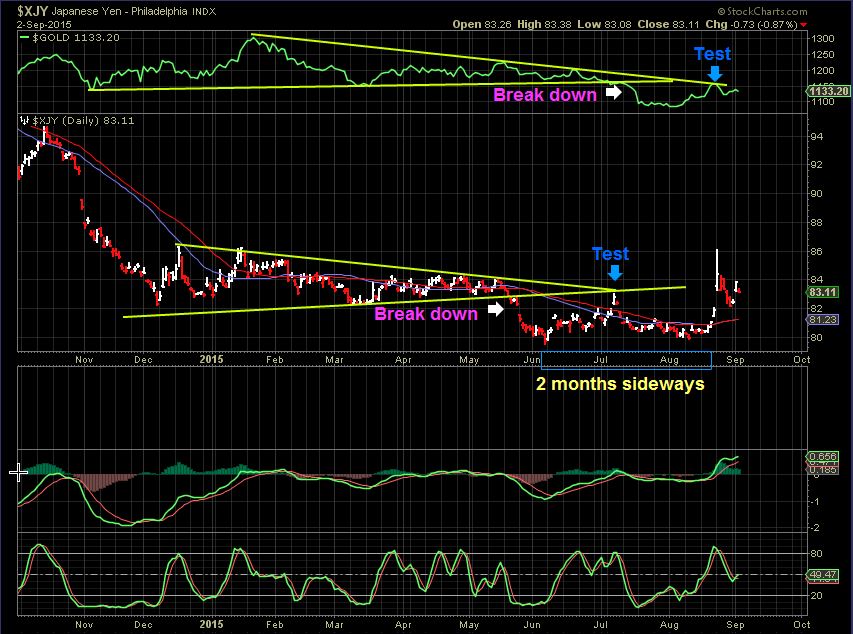
SEPT 2 WKLY – And this was looking good. Notice the break out higher in the yen! Did XJY recover? Would Gold follow?
.
Last September The FED really started talking about interest rate hikes possibly in OCT? or DEC? I wanted to see what that might do to these charts.
.
The Fed raised rates in December 
.
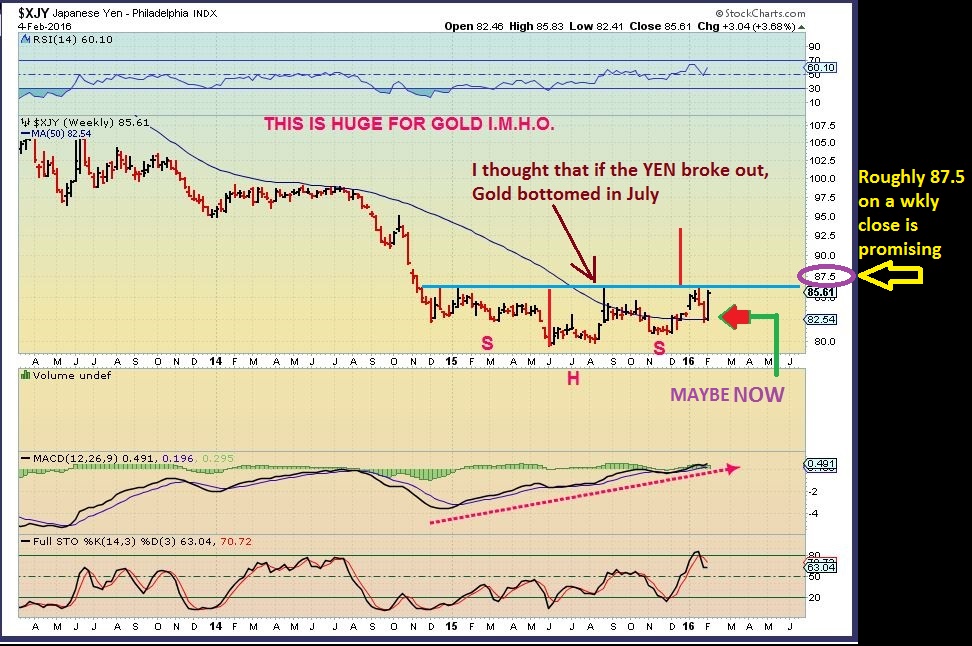
$XJY – After A dip in November heading into the Fed mtg, the XJY ran higher & formed an Inverse H&S. Now in Feb 2016, it looks ready to finally break out. This means that XJY most likely bottom last summer, so I would expect Gold to bottom too. Our SHAKE OUT in the Miners may be THE FINAL LOWS. A break out in the XJY will be viewed as bullish for Gold, I.M.H.O.
.
.
And the Big Picture may be changing in many different areas. That is a weekly break out for XJY/USD. Will it hold for the first time since 2012? Will Golds lows hold for the 1st time since 2012.
Many of the areas that I have been keeping an eye on are lining up. As I mentioned, it takes a long time to turn a large freighter ship around in the ocean. It also takes a long time to turn multi year markets trends around too. Smart money unloads gradually at tops, and accumulates gradually at lows. There are still other areas that I also keep track of, and they are also acting in a way that would indicate that Gold / Miners lows could very well already be in place. I will include them in future reports too. 
.
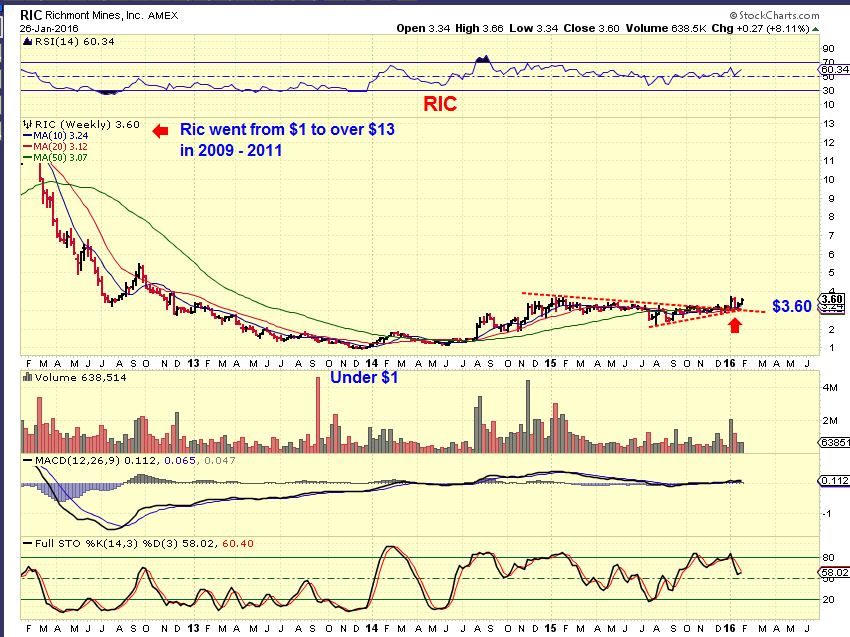
Questions remain for some. What about that re-test of the 2008 area? What about all the other analysts saying that Gold must go sub $1000? Is that necessary? I will share my findings on that in future reports too. Right now Gold and Miners are acting very Bullishly and Silver is finally breaking out. There are reasons to believe that it could be more than a short covering rally in a bear market. At this point I will still trade this bottom as mentioned in last weeks reports, and look to BUY THE DIP if things remain as they are. we’ve been riding positions bought at the lows 2 weeks ago. I discussed using Trailing stops, Partial profit taking, etc. in a report last week. As for Miners that bottomed a year or so ago, like LSG, NG, RIC, etc? It looks like keeping a core position will pay off. I will add on the dips as long as things remain bullish.
.
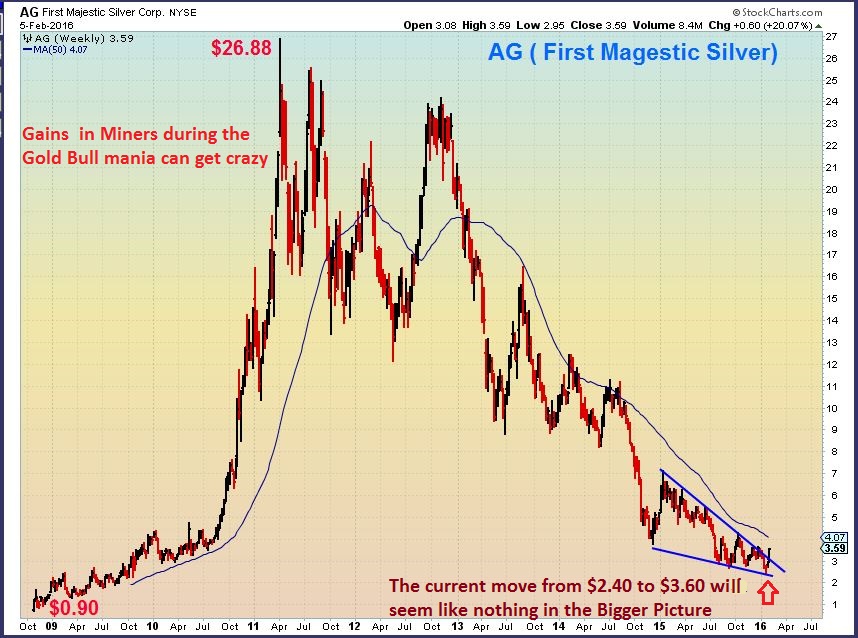
I believe that this 2 part weekend report is unbiased. It shows just the facts of what has been happening and the affect it is having on the precious metals. We see proof that Gold is either at, or very close to forming the Bear Market Lows. This type of research can add confidence to future trade opportunities in this area after a pullback. So many others will remain bearish at the lows, ready to short each pull back. I have been studying the move that the HUI, XAU, GDX, GDXJ recently put in, and the pattern playing out. I will share those finding soon too. Right now there is no way of knowing exactly when the pull back will begin, or how deep it will drop. In future reports I will try to help us to navigate it, but one thing is for sure… If this is the lows of this bear market and the bull is reemerging, there is a lot of money to be made when these beaten down Miners recover. You will see moves like this one in AG from 2008-20011.
.
Thanks for being here and I hope everyone had a great weekend!
.


OK Alex-here’s me being incredibly pessimistic. Right now, gold is rising as a fear trade. Gold may have bottomed as you have pointed out. My concern comes from a decline that gets so out of hand in the conventional markets it takes everything with it including gold. The FED and the CBs around the world are way behind the curve and I seriously question whether this time around anything less than a bazooka type response will be enough to ward off a 70% decline in the S&P. We have major structural problems around the world. However, I just don’t think the FED will do anything unless and until we breach 1500-1600 which is obvious support on the S&P and by then it may be too late to ward off an additional 20-30% decline. Then, the CBs get serious with unprecedented measures beyond our wildest imagination. So, you think this is a realistic concern/scenario with gold being caught in a deflationary collapse such that 500-750 becomes a true bottom later this year?
Mark,
FWIW the dollar isn’t rising as stocks fall into their 7 YCL. So the only safe haven assets to turn to are gold and bonds. I doubt this time will be similar to 2008. During that crash the safe haven was into the dollar. Not this time.
So the more panic selling in stocks should trigger panic buying in gold and bonds.
Yes, that is a distinction that’s worth noting I forgot about. The dollar will hit bottom at some point and move higher. The question I suppose becomes from what point and will it make a higher high?
Hi Gary. I have seen in the past where the Sp sells off and the miners get trashed with it. Gold can go up and miners fail. Do you think we will see any of that?
IMO the bigger the panic out of stocks will trigger more panic into gold and miners.
This is different than what happened in 2008/09.
FWIW look for the daily cycle to top on a breakout above 1191. Retail traders buy into breakouts. Smart money sells into them.
I agree with that thinking, but I think that it depends on which “break out” they are watching.
(refresh for a chart)
$1191 is a higher high for cycle enthusiasts, but is it really a break out to the big boys? …
Many may sell at a round number of $1200.
Some would watch the break out above the 200sma. ( we did that already )
Others the downtrend line that we broke above at $1140.
As for Miners…they can march to the beat of their own drummer, but they are getting very extended. No harm in locking in some profit and trailing the rest.
Hi Mark,
In the 3rd chart of the part 1 weekend report, I pointed out that the 1990’s SPX/ NAZ Bull Market (Think tech bubble too) dropped from 2001-2003, and Gold ran higher out of bear market lows. That Tech Bubble crash was scary for many, but a market drop doesn’t have to take everything with it. Gold was already in a bear market and was bottoming.
If markets drop here , you cant make money long there. I expect the dollar to drop. If the dollar drops here, you lose money long there too. If interest rates are low, you cant make money in savings. If Gold starts rising, money may go long there to make gains and momentum may take over, etc.
I suppose that there are endless scenarios, but I dont currently see $500 Gold in the charts.
I watch many different things along the way and I will just keep watching the charts to guide me along. They usually tell the story before we can see whats happening.
Very good. thanks Alex.
Hi Alex. I’ve had a ‘love affair’ with charts for more than 35 years now!! So you can only imagine how much I’ve enjoyed this weekends ‘double dose’!! 🙂 🙂 And I strongly suspect I am far from alone in that! 🙂 Great analysis and a incredible amount of work on your part, which is hugely appreciated by all of us subscribers I am certain. Hope you managed at least a bit of R&R this weekend though!!
yes.. what HE said!!
(minus the whole 35yrs thing … cough cough) 😉
That goes without saying!! Lol You are just a ‘spring chicken’!! 😉 lol
…haha.. not really…
Compared to me at least…no doubt!! Lol 😉
When I started Maria I had to hand draw my first charts!! Imagine if Alex had had to do that for this weekends reports!!! One good thing about technology at least. 🙂
wow…. lucky u!! :o) im envious… insert clip “…if we could turn back time… ”
just a fairly new-found passion of mine … but – the realllllly good news is that I know with certainty that for the rest of my life there is something out there that will continue to fascinate, intrigue, & hopefully not allude ;o) me, annnnd where the research/learning possibilities are quite literally … limitless…
woop
I know exactly how you feel Maria. I feel as excited pullling up charts now as as did at the start and there are always new subtle twists and turns to learn and take account of, which keeps it endlessley fascinating in my opinion…and in yours too by the sound of it. And the great thing is that as long as you can operate a PC age is no kind of barrier to particiaption!!! Thankfully!! 😉 lol
… music to my ears chris… this IS my solace…
… someday maria.. someday….;)
One of my favourite artists. 🙂
:0)
i actually just became a big fan… recvd 25 for xmas gift… it’s been quite the whirlwind –
deep meditations w/ this one..pheww…
Make sure you get to hear some of her earlier stuff as well if you haven’t already. Some amazing vocals. 🙂
… yes.. u KNOW im on it ;o)
not enuff hours in the day………
I know that feeling well!! Trust me…it gets even worse as you get older!! 🙁
are you on stocktwits or twitter… ?
No idea what the first one is and only vaguely aware of the second!! Lol And on neither! Just remember when I started at this the animals were still coming off the ark!! Lol I do use email though!! lol
ha! ok then, well … let’s see – if you want to chat more ask CF for my email…
He might not give me that under data protection laws!! 😉 If you want…drop me one to mine fauconnaires@gmail.com and if you do I’ll send you some really long term stuff I have which you might find interesting. This is real ‘big picture’ stuff but wrap your head around this and I reckon you will understand more than most people involved in the finance industry. Or if they are aware of it they will never admit to knowing it becuase it doesn’t fit with their business models and they prioritise making money over protecting their clients!!
got it.. ;o)
lol.. that ‘shouldnt’ be a problem with my permission 😉
..welcome back btw – ive missed u 😉
I’ve never actually gone away but just been doing lots and lots of analysis here on my own as well as giving all my trading/investment systems a major overhaul to hopefully help make this year a really good one!! 🙂 And a bit like Alex I’ve had some very long term charts on the back burner and just waiting to see if some of those ‘super tankers’ are finally turning!! It’s certainly looking hopeful at long last! 🙂
i luv that analogy…. supertaker turning… i TOTALLY feel it …. 😉
And it should be a fantastic year for us if at long last they are!! 🙂 🙂
Thanks Chris, I was hoping that it wouldn’t bore people to tears, but it is part of what I have been watching unfold.
When various different things continue to line up and point toward a possible Bottom in precious metals, I felt it best to share with readers here, to add to their confidence if we get a “Buy the pull back” opportunity. Many still fear a flash crash to sub $1000, so this report may say that something else is occurring. There is more that I want to share in time. if things continue falling into place.
Thanks for the positive feedback 🙂
NEVER bored with your analysis Alex!! And making us stand back and asess the bigger picture is so vitally important so that we keep seeing the wood for the trees. All too easy to get wrapped up in the daily moves and miss the much bigger things that might be happening as you’ve highlighted so well this weekend. Thanks again. 🙂
Nice report Alex, really like to detail you put into it. I have a small PM/miner position but will wait for a dip to add. Chasing things for me usually hasn’t worked out well in the past.
Thx CS
It is best to add on a pull back ( Unless you find a low risk lagger that looks like it wont sell off much & may be ready to take off). POssibly SA? Another Example : Some silver miners were looking that way last week., then many exploded like FSM, SSRI, PAAS, etc . EXK may be lagging . GPL moved nicely, but the weekly still looks good.
But waiting is better than buying an extended stock.
wow…
just had time to flip thru quickly.. W .. O .. W… some seriously advanced stuff… thank u for taking us there & pushing -at least me- into uncharted territory… ;o)
#homework
#leanMeanLearningMachine
“uncharted” territory : ) Not anymore, right?
teehee
“WHATS UP? ”
.
Gold, Silver, Miners, and the USD 🙂
Great report Alex, thanks. Do you see any % gains relationship between the Yen and Gold? Or is it just timing. Need your best guidance on when to step out of this uptrend in the miners.
Getting nervous with the miners. GDX/NUGT looks to be going parabolic.
Pardon my ignorance but why does GDX / NUGT going parabolic make you nervous ? I am assuming you are still holding on to NUGT. Any thoughts on why it might sell off / pull back ?
Well, nothing goes up forever, right? When a stock starts to go parabolic its a warning sign of bubble about to burst. Not saying it will here, maybe I’m still conditioned to think BEAR market. Either way I have a stop in place and will adjust it as NUGT goes up.
Perhaps anxious would be a better word that nervous. I’m the same way. I tend to lock in profits, sometimes too soon. But I just can’t stand to see profits disappear.
That’s what stops are for! Once your in $$$ you have to keep some
Ok. Thanks Bill. I have added stops too.
What do ya know? I have one miner showing a gain since I bought it – Franco-Nevada (FNV) and I’m not selling.
All the other flea-bitten varmints have to show gains in the many hundreds of percent to get back to break even.
Some probably will be de-listed eventually.
Okay – I exaggerate slightly. SA, RGLD, PG.TO aren’t that far away from showing a gain.
giggle
Excellent Report this morning Alex. I have been studying the Swiss Franc and IT’s correlation with Gold …… your study of the Yen is much better ! 🙂
SPX count …… If interested.
wowzer
*hi
I could be wrong, but I’m guessing this is the top for GOLD (NUGT). Expect a 10% pullback.
Could be, Bill.
I remember what happened after the Jan 2015 pop – deadly.
Changed my mind about FNV – sold it at $53
Europe’s best performing stock today:
Randgold Resources (GOLD)
Keep an eye on this one guys. (Chart is for TSX version, not NYSE)
i see no chart
Try refreshing your page.
Must refresh to see charts in comments.
hmm… rexx is tryn…
refresh for 2 charts below . long bases / sweet moves. Started a core position under $1, since it bottomed last summer. Sell partial profit and but the dip .
.
🙂
I sold my NUGT, but kept MUX!
So did I Sold all NUGT for 49. Great run. Thanks. I will wait for a pullback now
2 charts of TGD posted here-
.
This almost doubled since posting, and I think someone else here bought it too. It just hit 20 cents.
.
Alex, analysis on X? Any thoughts……..
Its a buy to me right now with a stop at $7.50 if one can take that kind of loss, if not, a buy right here, stop 15 cents below or so , but there could be a shake out.
Daily chart Pull up a 50sma, and it could be a small bull flag on the 50.
Thanks
whats X Bill?
X is the ticker symbol for US Steel Corp.
thx
Wow, some of these Miners. Wow.
AUY gapped right over the 200sma, now up almost 20% today alone after being higher for most of over 2 weeks.
.
Definitely smart to take some money off of the table and look for pullback, until THE LOWS are definitely confirmed. Even bull markets correct.
Hi Alex – I sold my NUGT at 49. It was a very good run. If you were to make an estimate on the GDX pulback, where would that be ? Could it be a 60% retracement. I know it may depend on if its a bull or a bear market. But your best guess. Thanks
Hi Goldsa
Sorry, but its all guess work at this point. There is no way to tell if we dont even have proof of a top yet. This pattern is a very rare pattern that I am familiar with- it can run to over exhaustion to the May highs coming out of this base. The pullback might then be a 3 week sideways handle, never even coming back here. It also can collapse and pull back quite a bit. Its too early to guess and expect it to help.
At a glance a pullback to the 200sma on GDX wouldnt be out of the question, but again, we need to know where the top is, to measure fib #’s from.
Here’s one guess on GDX! I really don’t know, but possible! 38.2% is a very common minimum pullback. Refresh
I had the same upper trend line, unless this just keeps going toward the may highs. Thats a good guess though, A pullback to the 200sma would be reasonable.
For thems thats interested… a 30 day compare of $(UUP)/ gold(GLD)/ miners!!(GDX)/ oil(USO)/ £(FXB)/ S&P(SPY)
DUST approaching weekly TL support…
Thanks, Looks inviting, but you really don’t want to trade against the trend!
no thats true.. i don’t.. but was just thinking more of the possible pullback point & re-entry with some more miner-buying
Alex.. check out CHK.. a capitulation buy?
Bankruptcy warning. It could be for a bounce soon, but caution
NEM & ABX have ( So far at 3:30) temporary topping type candles.
SA gave it up too
but I am watching this …
https://www.tradingview.com/x/7FiKJMpI/
sure looks like ‘extended’ “1” waves are being put in in various jrs …. anyone else think??
Imagine this if you can …
.
Using cycles however, still plenty of time possible. We could even get a quick slam down for 3-4 days and then a quick run higher to finish the daily cycle peak near day 23, then a dip too.
.
refresh
.
Or this…….. (Gold)
Wave 4 ( a, b, c ) down to the 38% Fib or that TL ?
Yes, On GOLD the 38 or 50% is around the 200sma.
😉
where’s 5 .. or is that stretched out onto a different ‘ipad’
ps. u best charge that thing….
Good question Tonto…..could it be “off the chart”. 😉
Btw…..this is only Wave 1 Major 🙂
😀 giggle
yes, crazy right?
…. u may just have to come down off that mountain to watch…. 😉
I love today’s technology……I do a ski run then while catching my breath I check “your” counts….all.at 11000 ft. 😉
unreal….. wow.. jusssssssst when I thought u couldnt get ANY tauntier… really LR… really? ha ha ha
I know quite the gig. 🙂
pics please…;)
u can email them if u dont want to post
**ask CF for me email .. LMAO (he’s gonna love me today)
I ain’t going to ask him you gotta ask him. 😉
Lol… hmelens@gmail.com
This message will self destruct in .. 5 .. 4…3..2…..
Did u get my message before it self destructed mountainman?
I did not. What did I miss?
Shoot… my catlike reflexes were too quick…
2nd try..but I’ll wait for confirmation this time..giggle
hmelens@gmail.com
…. this message self destruct in … 5… 4… 3… 2…
Got it !
…
I’m no candlestick officianado by a long chalk but on my chart system I have GDX demonstrating a gap up today. If that gap was maintained into the close today and then GDX gapped dowm tomorrow I’m pretty certain that would make todays candle an ‘abandoned baby’. If so…and there are a few ifs in here, then if I recall correctly that would be a short term bearish signal. But no saying how bearish or how short term.
Agree Chris !
‘Abandoned baby’…just one of the colourful candlestick names that has always styed with me!
Sold about 50% of my positions here. I was pretty heavy into EXK, IAG, SA. I’ll either buy more on a pullback or sell the rest on a run up
Very nice 🙂
I love the way GOLD broke the 1200 and then gave it up.
I mentioned that in a comment below earlier today , they gun for the whole round numbers and then sell it off.
Probably get our pullback now.
.
Good night all – Great trading the past 2 weeks.
Alex.. just in case you havent checked… i sent you mail.